Article

Customer Perceived Risk Measurement with NLP Method in Electric Vehicles Consumption Market: Empirical Study from China

Department of Information Management and Information Systems, School of Computing and Artificial Intelligence, Southwestern University of Finance and Economics, Chengdu 611130, China
*
Author to whom correspondence should be addressed.
Energies 2022, 15(5), 1637; https://doi.org/10.3390/en15051637
Submission received: 30 January 2022 / Revised: 14 February 2022 / Accepted: 21 February 2022 / Published: 22 February 2022

Abstract

:
In recent years, as people’s awareness of energy conservation, environmental protection, and sustainable development has increased, discussions related to electric vehicles (EVs) have aroused public debate on social media. At some point, most consumers face the possible risks of EVs—a critical psychological perception that invariably affects sales of EVs in the consumption market. This paper chooses to deconstruct customers’ perceived risk from third-party comment data in social media, which has better coverage and objectivity than questionnaire surveys. In order to analyze a large amount of unstructured text comment data, the natural language processing (NLP) method based on machine learning was applied in this paper. The measurement results show 15 abstracts in five consumer perceived risks to EVs. Among them, the largest number of comments is that of “Technology Maturity” (A13) which reached 25,329, and which belongs to the “Performance Risk” (PR1) dimension, indicating that customers are most concerned about the performance risk of EVs. Then, in the “Social Risk” (PR5) dimension, the abstract “Social Needs” (A51) received only 3224 comments and “Preference and Trust Rank” (A52) reached 22,324 comments; this noticeable gap indicated the changes in how consumers perceived EVs social risks. Moreover, each dimension’s emotion analysis results showed that negative emotions are more than 40%, exceeding neutral or positive emotions. Importantly, customers have the strongest negative emotions about the “Time Risk” (PR4), accounting for 54%. On a finer scale, the top three negative emotions are “Charging Time” (A42), “EV Charging Facilities” (A41), and “Maintenance of Value” (A33). Another interesting result is that “Social Needs” (A51)’s positive emotional comments were larger than negative emotional comments. The paper provides substantial evidence for perceived risk theory research by new data and methods. It can provide a novel tool for multi-dimensional and fine-granular capture customers’ perceived risks and negative emotions. Thus, it has the potential to help government and enterprises to adjust promotional strategies in a timely manner to reduce higher perceived risks and emotions, accelerating the sustainable development of EVs’ consumption market in China.

1. Introduction

With the development of the economy and society, the vehicle industry has thrived and maintained rapid growth for many years. Private cars have gradually become public consumer goods. For a long time in the future, China’s vehicle sales will continue to grow due to rigid demand and the upgrading of consumers’ consumption structure. China has a large population and a great demand for vehicles. Vehicle industry development will bring more major energy shortages and environmental pollution problems. The pressure of energy and the environment has driven the cultivation and development of electric vehicles (EVs). EVs meet the requirements of energy conservation, environmental protection, and sustainable development and are a key emerging industry supported by China. Therefore, the Chinese government has taken a series of measures to increase the market share of EVs and developed incentive policies to encourage consumers to buy EVs. Prime examples are purchase subsidies, where the government provides monetary subsidies to EV buyers, purchase tax and value-added tax exemptions [1], preferential pricing, driving restrictions, and license plate controls [2]. Through these supportive policy incentives, particular promotion of EVs has been achieved. According to data from the China Association of Automobile Manufacturers (CAAM) from January to July 2021, the sales of new EVs reached 1.478 million, with a year-on-year increase of 2 times. China has adhered to the strategic orientation of pure electric drive, made outstanding achievements in developing the new energy vehicle industry, and has become one of the fundamental forces in developing and transforming the world vehicle industry. According to statistics from the China Passenger Car Association (CPCA), purchases of new energy passenger vehicles in China reached 1.11 million, increasing 71.5% over 2019, while the increase was only 20% two years ago. However, looking at the overall vehicle sales market, EVs sales in China only accounted for 5.76% of total vehicle sales by 2020. The figure falls far short of the goal of EVs sales, accounting for about 20 percent of all new vehicle sales in China in 2025, as outlined in the New Energy Vehicle Industry Development Plan (2021–2035) released by the State Council in 2021. Consumers’ enthusiasm to buy EVs seems to still be low; the market share of EVs is relatively small, and the consumer market for EVs is still underdeveloped.
This highlights the need for further research on the factors influencing consumers’ purchase of EVs from the consumer behavior perspective. Most previous research studies consumers’ intentions to buy EVs by questionnaire and interview survey. Much work originates from EVs’ technical uncertainty and immaturity, a significant obstacle to adoption and sales [3,4,5]. Moreover, some scholars suggest paying more attention to EV purchases’ psychological factors [6,7]. With the increased importance of analytics at the micro-level [8,9], including understanding and predicting individuals’ behaviors [10], accurate and timely measurement of psychometrics has become of paramount importance. Psychometric dimensions are measures of latent constructs related to knowledge, ability, attitudes, and perception [11]. These dimensions are essential antecedents, mediators, and moderators for human behaviors [12]. Based on questionnaire survey data, some studies used scales to divide the dimensions of consumers’ psychological perceived risks and found that perceived risk affects consumers’ perceived usefulness of EVs, consumers’ attitudes towards EVs, and consumers’ intention to purchase EVs negatively [13,14]. However, psychometric data collection efforts have traditionally relied on survey-based methods administered monthly or quarterly. This method of collecting and measuring relevant constructs has proven limitations in quantity, timeliness, period, space span, richness, and objective [15]. An even more concerning limitation, academic circles emphasize the need to follow ethical guidelines in the research process. In the process of using traditional questionnaire surveys and interview methods, researchers may expose people’s privacy, cause disharmonious relationships between researchers and interviewees, and violate ethical standards.
However, in the Internet era, the form of release of consumers’ psychological perception information has changed. Many consumers actively and directly express their psychological activities, including emotions, perceived risk, attitude, purchase intention, etc., through comments on social media by natural language. Simultaneously, machine learning techniques have proven particularly helpful in analyzing new big-data sources and were previously underutilized for research [16]. Based on a large amount of text data, machine learning technology for natural language processing (NLP) has laid a foundation for breaking the limitations of the previous traditional method [17]. More importantly, research across the psychology field has started to embrace big data and the NLP approach. Some scholars have studied consumer preferences for charging infrastructure from consumer comments posted on public social media using NLP technology [18]. Some studies have analyzed consumers’ semantic and emotional tendencies using the Weibo comment text data and NLP tools and developed the corresponding dynamic recognition model of consumers’ purchase intention preference [19]. Scholars deconstruct the multi-faceted dimensions of Chinese consumers’ image of boutique hotels through empirical analysis with many online textual data from social media [20]. In addition, other scholars crawl data on Weibo about migrant workers’ topics as the fundamental corpus of migrant workers’ concerns and use the NLP method to construct a recognition and emotional analysis model of the migrant workers’ concerns [21].
Based on the current research results and a huge amount of consumer comments about EVs on third-party social media platforms, this paper measures consumers’ perceived risks and emotions towards EVs on multi-dimensional and fine-granular through NLP tasks.
This paper aims to build an NLP measure architecture combined with machine learning models to study the perceived risk of EVs from social media comments. As a new technique and generation of vehicles, there are many uncertainties in consumers’ cognition of EVs, resulting in a psychological risk perception that may hinder consumers’ acceptance and purchase of EVs and thus affect the development of the EV consumer market. This paper is expected to uncover public concerns about EVs, of which specific dimensions are risk and different emotional intensities. This will help government departments further understand people’s psychological concerns and emotions to targeted policies that can be designed to increase public acceptance of EVs. Meanwhile, manufacturers can also thoroughly prioritize their corporate development strategies according to customer needs, thereby increasing market share.
The structure of this paper is as follows:
  • Introduce the related research of perceived risk theory and the NLP methods of this study.
  • Design consumer perceived risk measure architecture based on social media comments, build the NLP tasks implementation process and analyze experimental results.
  • Conduct empirical results and analysis to prove the method’s feasibility and obtain advanced suggestions and means for government management and enterprise operation.

2. Literature Review

2.1. Perceived Risk Research in Consumer Behavior Theory

The concept of perceived risk was initially applied to the research of psychology-related fields. Since the 1860s, the perceived risk theory has been widely introduced into the field of consumer behavior, proposing that consumers’ purchasing behavior implies unpredictable results, and the uncertainty of such results is the original concept of perceived risk [22]. After nearly 60 years of research and development, perceived risk theory has received extensive and deep research from scholars. They pointed out that perceived risk includes two factors: uncertainty, that is consumers’ subjective perspective of the possibility of whether something will happen; and the severity of the consequences, that is the severity of the consequences when things happen [23,24]. A widely accepted definition is that perceived risk is the expected negative utility of consumers when they purchase a particular product or service [25].
Perceived risk is closely related to consumer behavior. Research shows that the reasons for consumers to delay, change or cancel purchase decisions were related mainly to the influence of perceived risks [26]. When purchasing products, consumers tend to reduce their perceived risks rather than maximize their perceived gains [27]. Therefore, perceived risks are more potent in explaining consumers’ purchasing behaviors. The perceived risk may influence consumers’ decision-making process [28]. Previous research indicated that perceived risk negatively affects consumers’ attitudes and intentions to buy innovative products or services [29,30,31]. In the EV consumer market, these viewpoints are also applicable to the research on consumers’ purchasing behavior of EVs, since EVs have been regarded as a disruptive and innovative technology [32]. Consumers’ intention to purchase EVs was not high, partly due to their concerns about risks. The perceived risk may be an essential factor in inhibiting consumer acceptance of EVs [33]. Meanwhile, prior research has suggested that perceived risk plays a negative role in perceived usefulness [34,35]. Therefore, when consumers perceive a series of risks about EVs, they tend to question the usefulness of EVs, becoming more likely to form negative emotions and reduce their purchase intention.

2.2. Perceived Risk Dimension Research

Scholars extended the research field of perceived risk to dimensional analysis [24]. The perceived risk dimension refers to the consumers’ perceived risk concerning aspects and related contents. The mainstream method to measure consumers’ perceived risk is the two-factor model. First, ask interviewees about their perceived risk and uncertainty through a questionnaire survey or interview using designed scales according to different research backgrounds, then multiply the two to get the perceived risk value [23,36]. In the research on consumers’ purchase behavior for EVs, most scholars use the multi-item scale to measure consumers’ psychological perception dimensions. The scale design mostly referred to previous literature and was slightly modified to suit current research motivations. Typically, each question in the questionnaire was measured on a five-point Likert scale ranging from 1 “strongly disagree” to 5 “strongly agree” [2,7,14,37].
The dimensions of risk that consumers perceive in the consumer market vary depending on product attributes and characteristics [29]. Although customers’ perceived risk of general products has multiple dimensions, the most representative six dimensions include financial, performance, social, psychological, physical, and time risks. Their explanatory ability to the overall perceived risk of consumers reaches 88%. For EVs, some scholars have proposed that risks perceived by consumers consist of five dimensions: performance risk, physical risk, financial risk, time risk, and psychological risk. Table 1 shows a review of consumers’ perception of risk dimensional division research.

2.3. NLP Methods for Measuring Psychological Perception

Typically, many psychometric dimensions require ten or more survey responses, making them less feasible in persistent measurement environments [51,52]. Hence, recent studies have suggested that the machine learning-based NLP method applied to user-generated content such as consumer-generated social media comments might offer a complementary or alternative mechanism for measuring psychometric dimensions [18,21,53]. In terms of technical feasibility, many existing studies discussed how to deal with the sparsity of short texts on social media [54]. They leverage the structural information such as time slice, users, and hashtags for alleviating the context sparsity problem of short text. Although machine learning-based NLP has particular applications in the measurement of psychological dimensions, especially in sentiment polarity (i.e., positive, negative, neutral) and emotions classification (e.g., happiness, anger) tasks [55,56,57,58], many necessary psychological measurements, such as the specific dimensions of consumer perceived risk, have not been explored to a large extent. As stated in the introduction, the consumer perceived risk measurement method potentially impacts consumer behavior research. So, this study first needs to demonstrate the feasibility of the NLP method in measuring multidimensional and fine-grained consumer perceived risk based on text data of consumer social media comments.
BERT for NLP: this model is a multilayer bi-directional transformer encoder based on fine-tuning. Compared with previous feature-based language models, the output of the BERT model is adaptable, and the word vector embedding mechanism will dynamically adjust to context information. As a result, even for the same word, the corresponding encoding output is not the same in different contexts, solving the problem of polysemous words [59,60]. Therefore, the BERT model is a general language model to support different NLP tasks, and it has reached the highest level in many NLP tasks, such as reading comprehension [61,62], text classification problems [63,64], emotion analysis [65,66], and information extraction [67,68].
Convolutional neural networks (CNNs) utilize layers with convolving filters to apply to local features [69]. Invented initially for computer vision [70], CNNs have recently demonstrated superior performance on several NLP tasks [18,21]. To learn character-level CNN embeddings to accommodate possible spelling errors and prefix and suffix information is an impressive achievement. [71]. In addition, scholars used a CNN trained on top of pre-trained word vectors for sentence-level classification [72]. In summary, CNNs could be particularly useful for text classification of user-generated psychometric content, which often contains significant misspellings and domain-specific expressions.
Recursive neural networks (RNNs) selectively pass information across sequential steps while processing sequential data one element at a time [73]. In order to solve the problem of gradient disappearance in long-term sequence learning, two main gating mechanisms are proposed: long short-term memory [74] and gated recurrent unit [75]. The basic idea is to use a set of gates to regulate the value flowing to each hidden state so that the gradient does not approach zero. These RNNs are proven effective for many NLP tasks [76,77]. For example, in the context of psychometric NLP, RNNs can capture long-term language dependencies in user-generated texts, which are often difficult to capture by manual feature engineering to improve the classification performance of previously under-explored psychometric dimensions [78].
With its good performance in natural language processing (NLP) translation tasks, scholars began to introduce attention mechanisms [79] into psychological measurement tasks such as emotion analysis [78,80] and Chinese text classification [77,81]. The core goal of the attention mechanism is to select the more critical information in the current task from the sea of information, regarded as a dynamic tuning of feature weight. The traditional method assigns a particular weight to each token in word vector training without special treatment. The attention mechanism assigns a particular weight to each token in this process and then applies it to other tasks [82].
This paper’s first task is the determination of classification labels, that is, by NLP methods, to confirm which aspects in what degree of granularity should be applied in this study. The second is the classification task, with perceived risk aspects determined in the first task. The third is the emotional analysis task for each aspect under the perceived risk dimensions. Thus, this paper proposes an architecture expressly designed to measure consumers’ perceived risk in the following section.

3. Methodology

Figure 1 depicts psychometric NLP architecture, which encompasses three NLP tasks based on social media text: fused analysis via excavation of labels classification, semantic identification, and emotion analysis. Each component of the architecture is intended to address the aforementioned research’s limitations, thereby resulting in exploring the feasibility leverage—a novel method for the measurement of psychometric dimensions. The research process is follows:
  • Construct a data set of consumers’ social media comments toward EVs. At present, there is no adequate public data set on the customer perceived risk of EVs based on social media comments or corresponding methods for measuring customer perceived risk of EVs in China. Therefore, this paper preprocesses the collected related data to improve NLP accuracy through Chinese word segmentation, manual tagging corpus, and data cleaning.
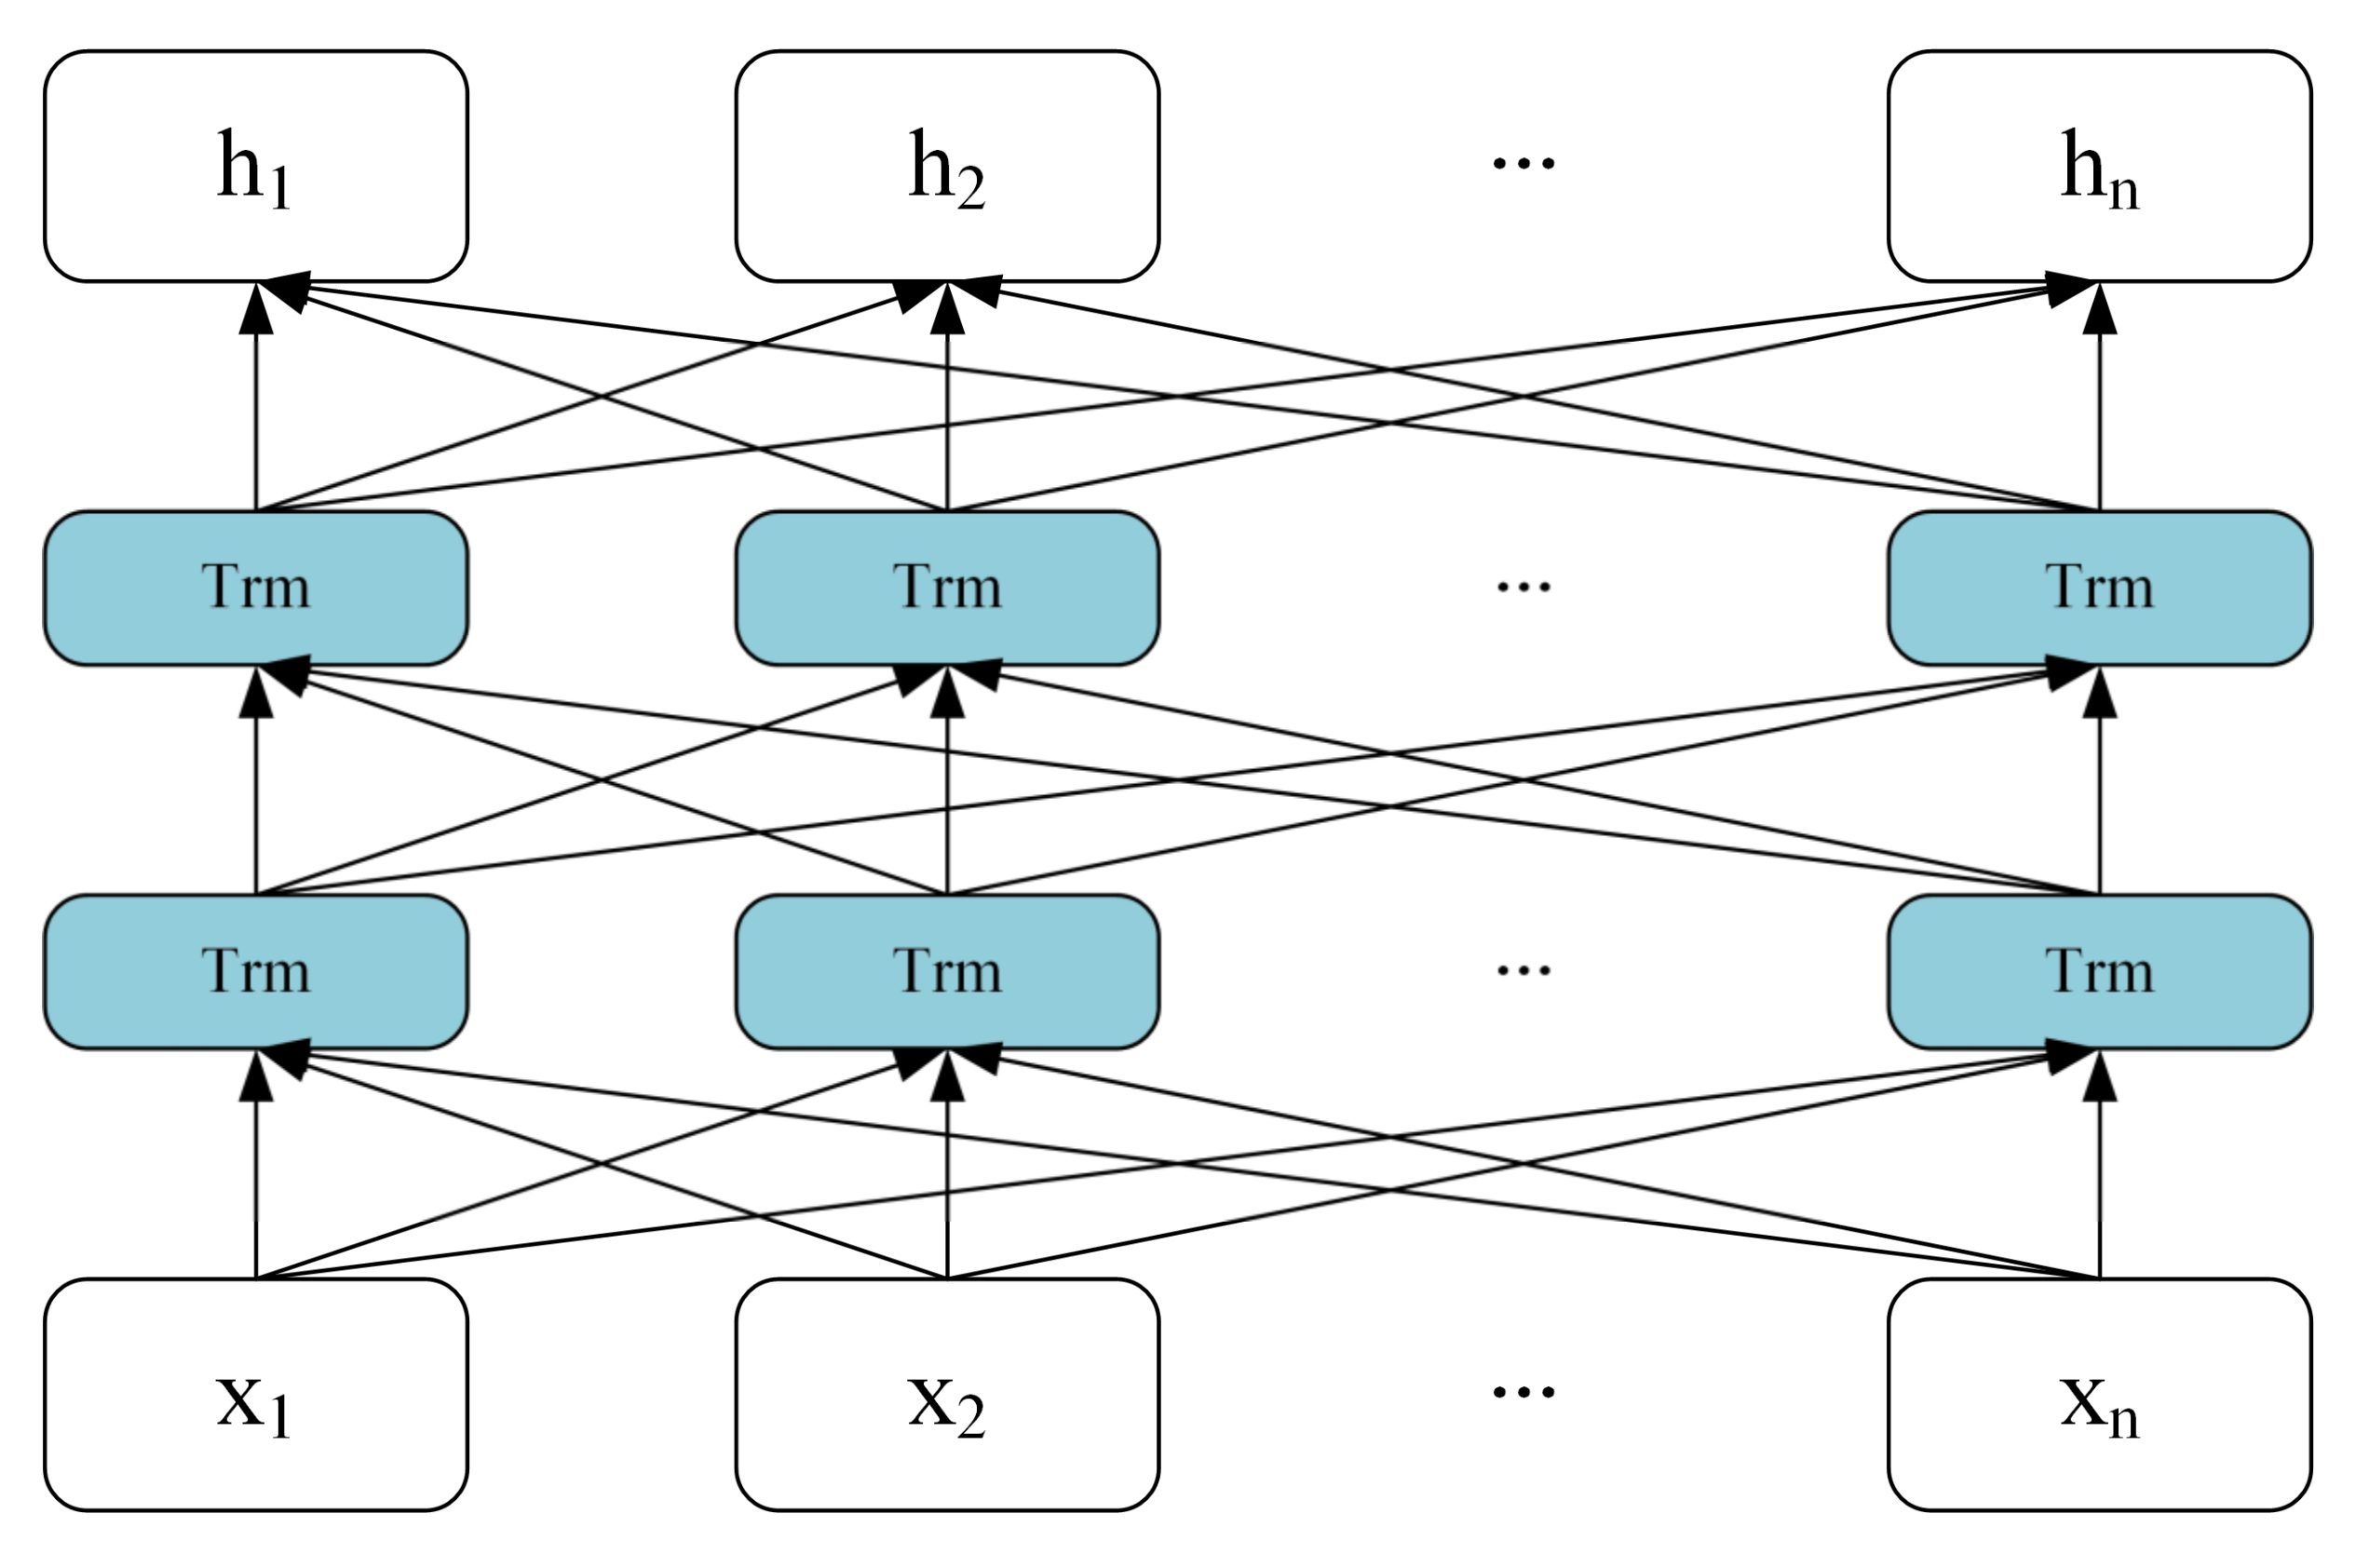
  • Establish a measurement system of customer perceived risk, including three NLP tasks. The first NLP task is to determine the classification of labels. The abstract extraction function of the BERT model was used to obtain quantitative analysis results from text data. Combined with previous research findings, labels containing perceived risk dimensions and granularity were obtained through manual screening and matching. Then, a word vector trained by the BERT model was used as initialization parameters of subsequent model. The second NLP task is the semantic identification of the consumer social media comments about the perceived risk of EVs. Based on the experiment results of the first NLP task, construct a multi-label classification method with the Text CNN model to complete the consumer comments semantic identification task. The third NLP task is the emotional intensity analysis of each perceived risk dimension. Based on the experimental results of the second NLP task, an emotion classification method is established to realize the multi-dimensional emotion analysis task by fusing the Bi-LSTM model and the attention mechanism.
  • To find the key aspects and their correlation in finer granularity by analyzing the recognition results of different semantic expressions in consumer comments, the emotional intensity of different perceived risk dimensions, with the feature word lists.

3.1. Classification Label Mining Based on BERT Model

In this paper, in order to effectively measure the dimension of consumer perceived risk from the text data of social media comments, we created the first NLP task, mined the text data using the BERT model to obtain the abstract information about perceived risk in different dimensions [67,68,77,83], and then determined the target perceived risk labels combined with the previous relevant studies.
The abstract information of the preprocessed text data is extracted by the BERT model. The word is predicted through the transformer encoder function of the BERT model; the overall structure of the model is shown in Figure 2. BERT is trained by maximizing the likelihood function of the predicted word, the album function calculation formula is as follows:
max θ ln p θ x ¯ | x ^ t = 1 T m t ln x t | x ^
When m = 1 indicates that the word is masked, it will be replaced by the “[MASK]” tag. θ represents the model parameters; x ¯ is the predicted target word; x ^ represents the context of the target word. The prediction of target words is to obtain the abstract information of different perceived risks in the consumer comment text.

3.2. Semantic Identification Based on Bert-TextCNN Model

Combined with the classification labels obtained from the first NLP task, we further set up the second NLP task—which is a text multi-label classification model based on the deep learning method TextCNN—to classify the data sources collected from social media and identify the consumer perceived risks about EVs. The network structure is shown in Figure 3, wherein the word vector is generated by the BERT model and the TextCNN model generates a classification result via a neural network [62,63].
The BERT model can make the word vector coding result in global training according to the downstream task fine-tuning model parameters, and the model will adjust the word vector according to the contextual information. After using the BERT model to learn the text, it will be adapted to multi-label text classification by fine-tuning. The input sentence with n words is constructed as X = C L S , x 1 , , x n , S E P . A word x i can be converted into a word vector h i :
h i = BERT x i
Subsequently, the BERT model generates the word vector matrix E n × d , where n is the input length and d is the word vector dimension (d = 768). Let   h i d indicate the word vector of the i word in the input. The input H of the length n can be represented as follows:
H = h 1 , h 2 , , h n
The convolutional calculation feature map is performed by the Text CNN convolution layer. Set the convolution kernel as w m × d , m is the height, and d is width. It can generate a new feature through a window containing m words. For example, a feature c i can be generated by window h i : i + m 1 :
c i = f w · h i : i + m 1 + b
Here b is a bias term, and f is a non-linear activation function. The convolution operation for the convolution kernel w and the word vector of all windows in matrix E to generate a feature c n m + 1 is as follows:
c = c 1 , c 2 , , c n m + 1
Then, the maximum pooling operation is carried out through the pooling layer of the TextCNN model, that is, only the maximum value of each feature obtained by the convolution operation is taken, and the most important feature information is compressed and retained. The pooled result of the feature c is c = m a x c . By joining the pooling results of all kernels, the new features are obtained as follows, where k is the total number of kernels (k = 768):
z = c 1 , c 2 , , c k
Finally, in the full connection layer, the classification results are output using the softmax activation function, and z will be dropped out randomly with a 0.1 probability. The output result y of the full connection layer is:
y = s o f t m a x w d e n s e · z r + b d e n s e
where y is the classification result, w d e n s e and b d e n s e are parameters and bias terms of the full connection layer respectively, r m is the mask vector used to randomly drop elements out in z , and the operation symbol denotes the multiplication of bits.
Meanwhile, we apply the focus loss function to solve the classes imbalance problem of the multi-label classification task (Lin et al., 2017). The loss function is designed as follows:
l o s s = 1 T j = 0 T i y t α t 1 y ^ t γ log y ^ t
As shown in the above formula, the loss is the sum of all labels, where y ^ t indicates a predicted probability value represented by a certain class, y i represents the real label value of the sample, α t represents the weight about the loss of a certain class with t label, and the sum of the weights of all classes is 1.

3.3. Emotion Analysis Based on Att-BiLSTM Model

Based on the second NLP task obtained classification results, we used a deep learning model Bi-LSTM combined with an attention mechanism to contrastively analyze the negative emotional intensity towards different perceived risk dimensions [63,68]. The network structure is shown in Figure 4.
  • Word Vector Layer
As with the second NLP task, the BERT model was used to learn the text. It will be adapted to the emotion classification model by fine-tuning. The word vector of the i word in the input. The input H of the length n can be represented as follows:
H = h 1 , h 2 , , h n
  • Bi-LSTM Layer
An LSTM network model is an improvement of the recurrent neural network (RNN) to solve the problems of gradient explosion and difficulty in learning long-distance features when the RNN processes long sequence information [84]. Compared with RNN, LSTM adds a memory unit and three control gate structures composed of input gate, forget gate, and output gate. The three control gate structures enable the network to selectively retain and discard state values, which can better capture long-distance context sequence information. In the processing of sequential text, the output of LSTM at the last moment will be taken as the input of the t moment, so the above information can be well preserved. At moment t , the input of the memory unit includes the output h t 1 of the hidden layer at the previous moment, the state variable h c 1 of the memory unit, and the input information x t of the input layer at the current moment. The output of the memory unit includes the state variable c t of the memory unit and the output h t of the hidden layer at the current moment. The specific calculation process of the LSTM network model is shown in Equations (10)~(15):
f t = σ U f x t + W f h t 1 + b f
i t = σ U i x t + W i h t 1 + b i
g t = tan h U g x t + W g h t 1 + b g
c t = f t c t 1 + i t g t
o t = σ U o x t + W o h t 1 + b o
h t = o t tan h c t
where, f t indicates the forget gate, which decides what information to discard from the current cell state.   i t represents the input gate, which determines how much of the newly acquired information to choose to update the status.   o t represents the output gate, which determines how much information generates the hidden layer state variable.   U f , U i , and U o are their tunable parameters respectively, W f , W i , and W o are their weights respectively, b f , b i , and b o are their bias terms respectively. σ is the sigmoid activation function, tan h is the hyperbolic tangent activation function, and is the product of the matrix elements.
In the sentiment analysis of multi-dimensional perceived risk, the contextual information of consumers’ comments on social media plays an auxiliary role in sentiment classification. However, one-way LSTM can only learn the above historical information, and cannot master the following information, thus limiting the effect of emotion classification. Therefore, the Bi-LSTM network is adopted in this paper. The Bi-LSTM network model includes two processes: forward propagation and backward propagation. The training sequence is input into the forward LSTM network model to obtain the forward characteristic information h t through forwarding propagation calculation. Similarly, the backward characteristic information h t is obtained through backward propagation calculation by inputting the backward LSTM network model. Then, the forward characteristic information h t and the backward characteristic information h t are spliced to obtain the final hidden state h t . In this way, forward and backward bidirectional semantic features are summarized with the formula:
h t = h t ; h t
  • Attention Layer
The attention weight v t is calculated, that is, the semantic relevance between the current entity and the context information is calculated. The calculation formula is as follows:
v t = α h t
where h t is the context semantic feature vector output by the Bi-LSTM hidden layer.
Secondly, attention weight is probabilistic. The attention weight probability vector p t is calculated by the softmax function. The calculation formula is as follows:
p t = e x p v t t 1 m e x p v t
Finally, attention weight configuration. According to the degree of semantic relevance, attention resources are allocated to feature vector h t to generate a weighted semantic representation of the feature vector and enhance text feature expression. The calculation formula is as follows:
a t = t = 1 m p t h t
  • Output Layer
In this study, we give the training set s i , y i , i = 1 , , N , where the category label y i 1 , , k ( k is the category number of the possible). For text sentiment classification, the distributed representation v i generated from text s i is input into softmax layer to obtain the predicted probability distribution of discrete category labels as shown below:
p i = S o f t m a x W s v i + b s k
The loss function of this model is average cross-entropy error plus Frobenius norm constraint of Softmax layer weight matrix, as shown in the following formula:
J θ = 1 N i = 1 N log p i y i + λ W s F 2
where θ indicates all parameters in the network; p i y i is the y i th component of p i ; λ is the penalty coefficient, which measures the importance of two items; and the subscript F denotes the Frobenius norm.

4. Data Sources and Experimental Settings

4.1. Data Sources

This study uses Python programming technology to capture 70,158 consumer online text comments about the EVs on social media from 1 January 2019 to 16 August 2021, with third-party data sources including Weibo, Zhihu, Toutiao, XiguaVideo, Tiktok, and Kuaishou. This paper chose these social media comments as data sources for the following reasons. Weibo is the leader among social platforms for sharing brief, real-time information. Founded in 2009, it has more than 340 million active users. Zhihu is the leader in the high-quality Q&A community on the Chinese Internet, and has more than 2.5 million monthly active paying users, more than 3 million total content posters, and more than 3 billion annual visitors since 2011. Toutiao is the number one most recommended engine based on data mining and has 260 million active users monthly. Tiktok and Kuaishou are the top two short video publishing platforms in China, with 620 million and 380 million daily active users, respectively. But more importantly, unlike the comment data on e-commerce platforms, these third-party consumer comments based on social media are more objective in commenting on individuals, events, social issues, social groups, and organizations. Obviously, social media comments express the consumers’ perceptions of events and emotional feelings. The original data of this paper can be found by this link: https://pan.baidu.com/s/1gm6HlAy6zFITJaGV9ADd_Q (accessed on 20 January 2022), with the access code: ubk6.

4.2. Model Parameters Setup

After the Optimization processes in the experiments, the parameters of the TextCNN and Att-BiLSTM model applied in this study are finally set as shown in Table 2. This paper uses the BERT-Base edition with Chinese Simplified and Traditional support, 12 layers, 768 hidden, 12 heads, and the GELU activation function.

4.3. Model Performance Evaluation Index

The emotion classification experiment results used the three indicators to evaluate model performance. Precision index (P) is the calculation of how many of the data classified as positive examples are true. Recall index (R) is the calculation of how many positive samples are correctly classified, and the (F1) value is the average of precision and recall, which is commonly used in the text classification field. Slightly differently, the multi-label classification experiment results using the four indicators to evaluate model performance. Among them, macro average composite index (MaF1) is the weighted average of macro accuracy (MaP) and macro average recall rate (MaR), all marked with (+), indicating that the higher the value of these three evaluation indexes, the better. The hamming loss (HL) index is the number of classification labels that are wrong in predicting the evaluation model. In particular, (−) is used as the mark of this index, indicating that the lower the model’s prediction error value, the better.

5. Result Analysis and Discussion

5.1. The Result of First NLP Task

The result of first NLP task comes from the qualitative and quantitative analysis, and the specific generation process is shown in Figure 5. The first step is to qualitatively analyze the preprocessed data according to sociology, psychology, and management theories and obtain m (1, 2, …, m) preset consumer perceived risks of EVs. The second step is to extract the abstract information of preprocessed data through the feature word prediction function of the Bert model and get n (1, 2, …, n) abstracts of consumers’ perception of EVs risk. The third step is to match m qualitative analysis results with n quantitative analysis results proposed by the researchers. Valid matching results have two types. First, the preset perceived risk with matched abstracts is valid. The abstracts without preset perceived risk will also be valid and be named. This study obtained five perceived risks. Then, to study in finer granularity, the five perceived risks are divided into 15 sub risks or topics according to the corresponding abstracts.
As shown in Figure 5, the consumer perceived risk for EVs consists of 5 dimensions, namely “Performance Risk” (PR1), “Physical Risk” (PR2), “Financial Risk” (PR3), “Time Risk” (PR4), and “Social Risk” (PR5). Each dimension successfully matched 3 relevant abstracts and a total of 15 abstracts. The abstracts related to the “Performance Risk” (PR1) dimension were “Range Anxiety” (A11), “Climatic Conditions” (A12), and “Technology Maturity” (A13). The abstracts related to “Physical Risk” (PR2) were “Radiation Injury” (A21), “Physical Discomfort” (A22), and “Accident” (A23). The abstracts related to “Financial Risk” (PR3) were “Cost-in-use” (A31), “Acquisition Cost” (A32), and “Maintenance of Value” (A33). The abstracts related to “Time Risk” (PR4) were “EV Charging Facilities” (A41), “Charging Time” (A42), and “Charging Convenience” (A43). The abstracts related to “Social Risk” (PR5) were “Social Needs” (A51), “Preference and Trust Rank” (A52), and “Environmental Conservation” (A53). In particular, the list of feature words extracted by the Bert model is also crucial to better understand each dimension of perceived risk and allow researchers to obtain more accurate classification labels for later studies. Therefore, all 15 abstracts (A11, A12, …, A53) will be the labels for multi-classification to study all five dimensions of the consumer perceived risk in finer granularity.

5.2. The Result of Second NLP Task

The result of the second NLP task is that, based on the classification labels determined by the first NLP task, semantic recognition of social media comment data is achieved by integrating the fine-tuning function of the BERT model and the TextCNN multi-label classification model. Table 3 shows that the macro average composite index (MaF1) value reaches 0.90, reflecting the excellent performance of the classification model from the precise. The hamming loss (HL) index value is 0.0012, indicating that the number of wrongly predicted label pairs is small, and the classification model performance is better from the perspective of loss. It can also reflect the effectiveness of the multi-label classification model used in the quantitative semantic analysis.
In addition, we further visualized the comment data of consumer perceived risk towards EVs. Figure 6 is the histogram of the distribution of consumer perceived risks. Different colors represent five different dimensions of perceived risk, among which 47,473 comments are related to EV “Performance Risk” (PR1), followed by “Social Risk” (PR5) 36,335, “Financial Risk” (PR3) 30,411, “Time Risk” (PR4) 16,025, and “Physical Risk” (PR2) 12,352. This reflects the strength of users’ perception of risk toward EVs in different dimensions. At a finer granular level, “Technology Maturity” (A13) 25,329, “Accident” (A23) 9630, “Cost-in-use” (A31) 12,601, “EV Charging Facilities” (A41) 6433, and “Preference and Trust Rank” (A52) 22,324 ranked at first in their corresponding dimensions. Notably, in the “Social Risk” (PR5) dimension, abstract “Social Needs” (A51) received only 3224 comments and “Preference and Trust Rank” (A52) reached 22,324 comments—this is a noticeable gap.

5.3. The Result of Third NLP Task

The third NLP task result, the emotion classification experiment, analysis emotional intensity of each perceived risk dimension and granularity. Table 4 shows that the precision index (P) value reaches 0.91, the recall index (R) value reaches 0.92, and the average (F1) value reaches 0.91. It can also reflect the effectiveness of the method used in the paper.
The results are visualized as shown in Figure 7. It can be seen from the figure that there are five different pie graphs of perceived risk emotion classification. The emotion classification of each risk dimension is obtained from three fine-grained abstract emotion classifications, so the arrow of the fine-grained emotion classification pie graph points to the emotion classification pie graph t of each risk dimension. The grey part represents neutral emotion in the 20 pie graphs, the blue part represents negative emotion, and the orange part represents positive emotion.
The “Time Risk” (PR4)-related comments expressed the strongest negative emotions, reaching 54%, followed by “Financial Risk” (PR3) 49%, “Physical Risk” (PR2) 45%, “Performance Risk” (PR1) 43% and “Social Risk” (PR5) 40%. On a finer scale, the top three negative emotions are “Charging Time” (A42) 58%, “EV Charging Facilities” (A41) 56%, and “Maintenance of Value” (A33) 53%. Notably, the biggest grey and orange portion in the emotional classification pie graph of the five risk dimensions are both shown in the “Social Risk” (PR5) pie graph. From a fine-grained perspective, positive emotional comments of “Social Needs” (A51) reached 38%, higher than 35% of negative emotions.

5.4. The Analysis of NLP Tasks Results

Based on the results above, to obtain the interpretation of consumers’ overall and fine-grained perception risks about EVs, the analysis procedure should require conjoint the results of three NLP tasks, including the feature word lists, semantic recognition results, and emotion analysis results. Consumers are most significantly concerned with the perceived risks in ascending order of “Performance Risk” (PR1), “Social Risk” (PR5), “Financial Risk” (PR3), “Time Risk” (PR4), and “Physical Risk” (PR2). As shown in Figure 7, the pie graph of each perceived risk dimension’s emotional classification shows that negative emotions make up more than 40% in total. This exceeds neutral or positive emotions, indicating that most consumers keep negative emotions when commenting on the risks involved in EVs on social media. Some results are interesting as follows:
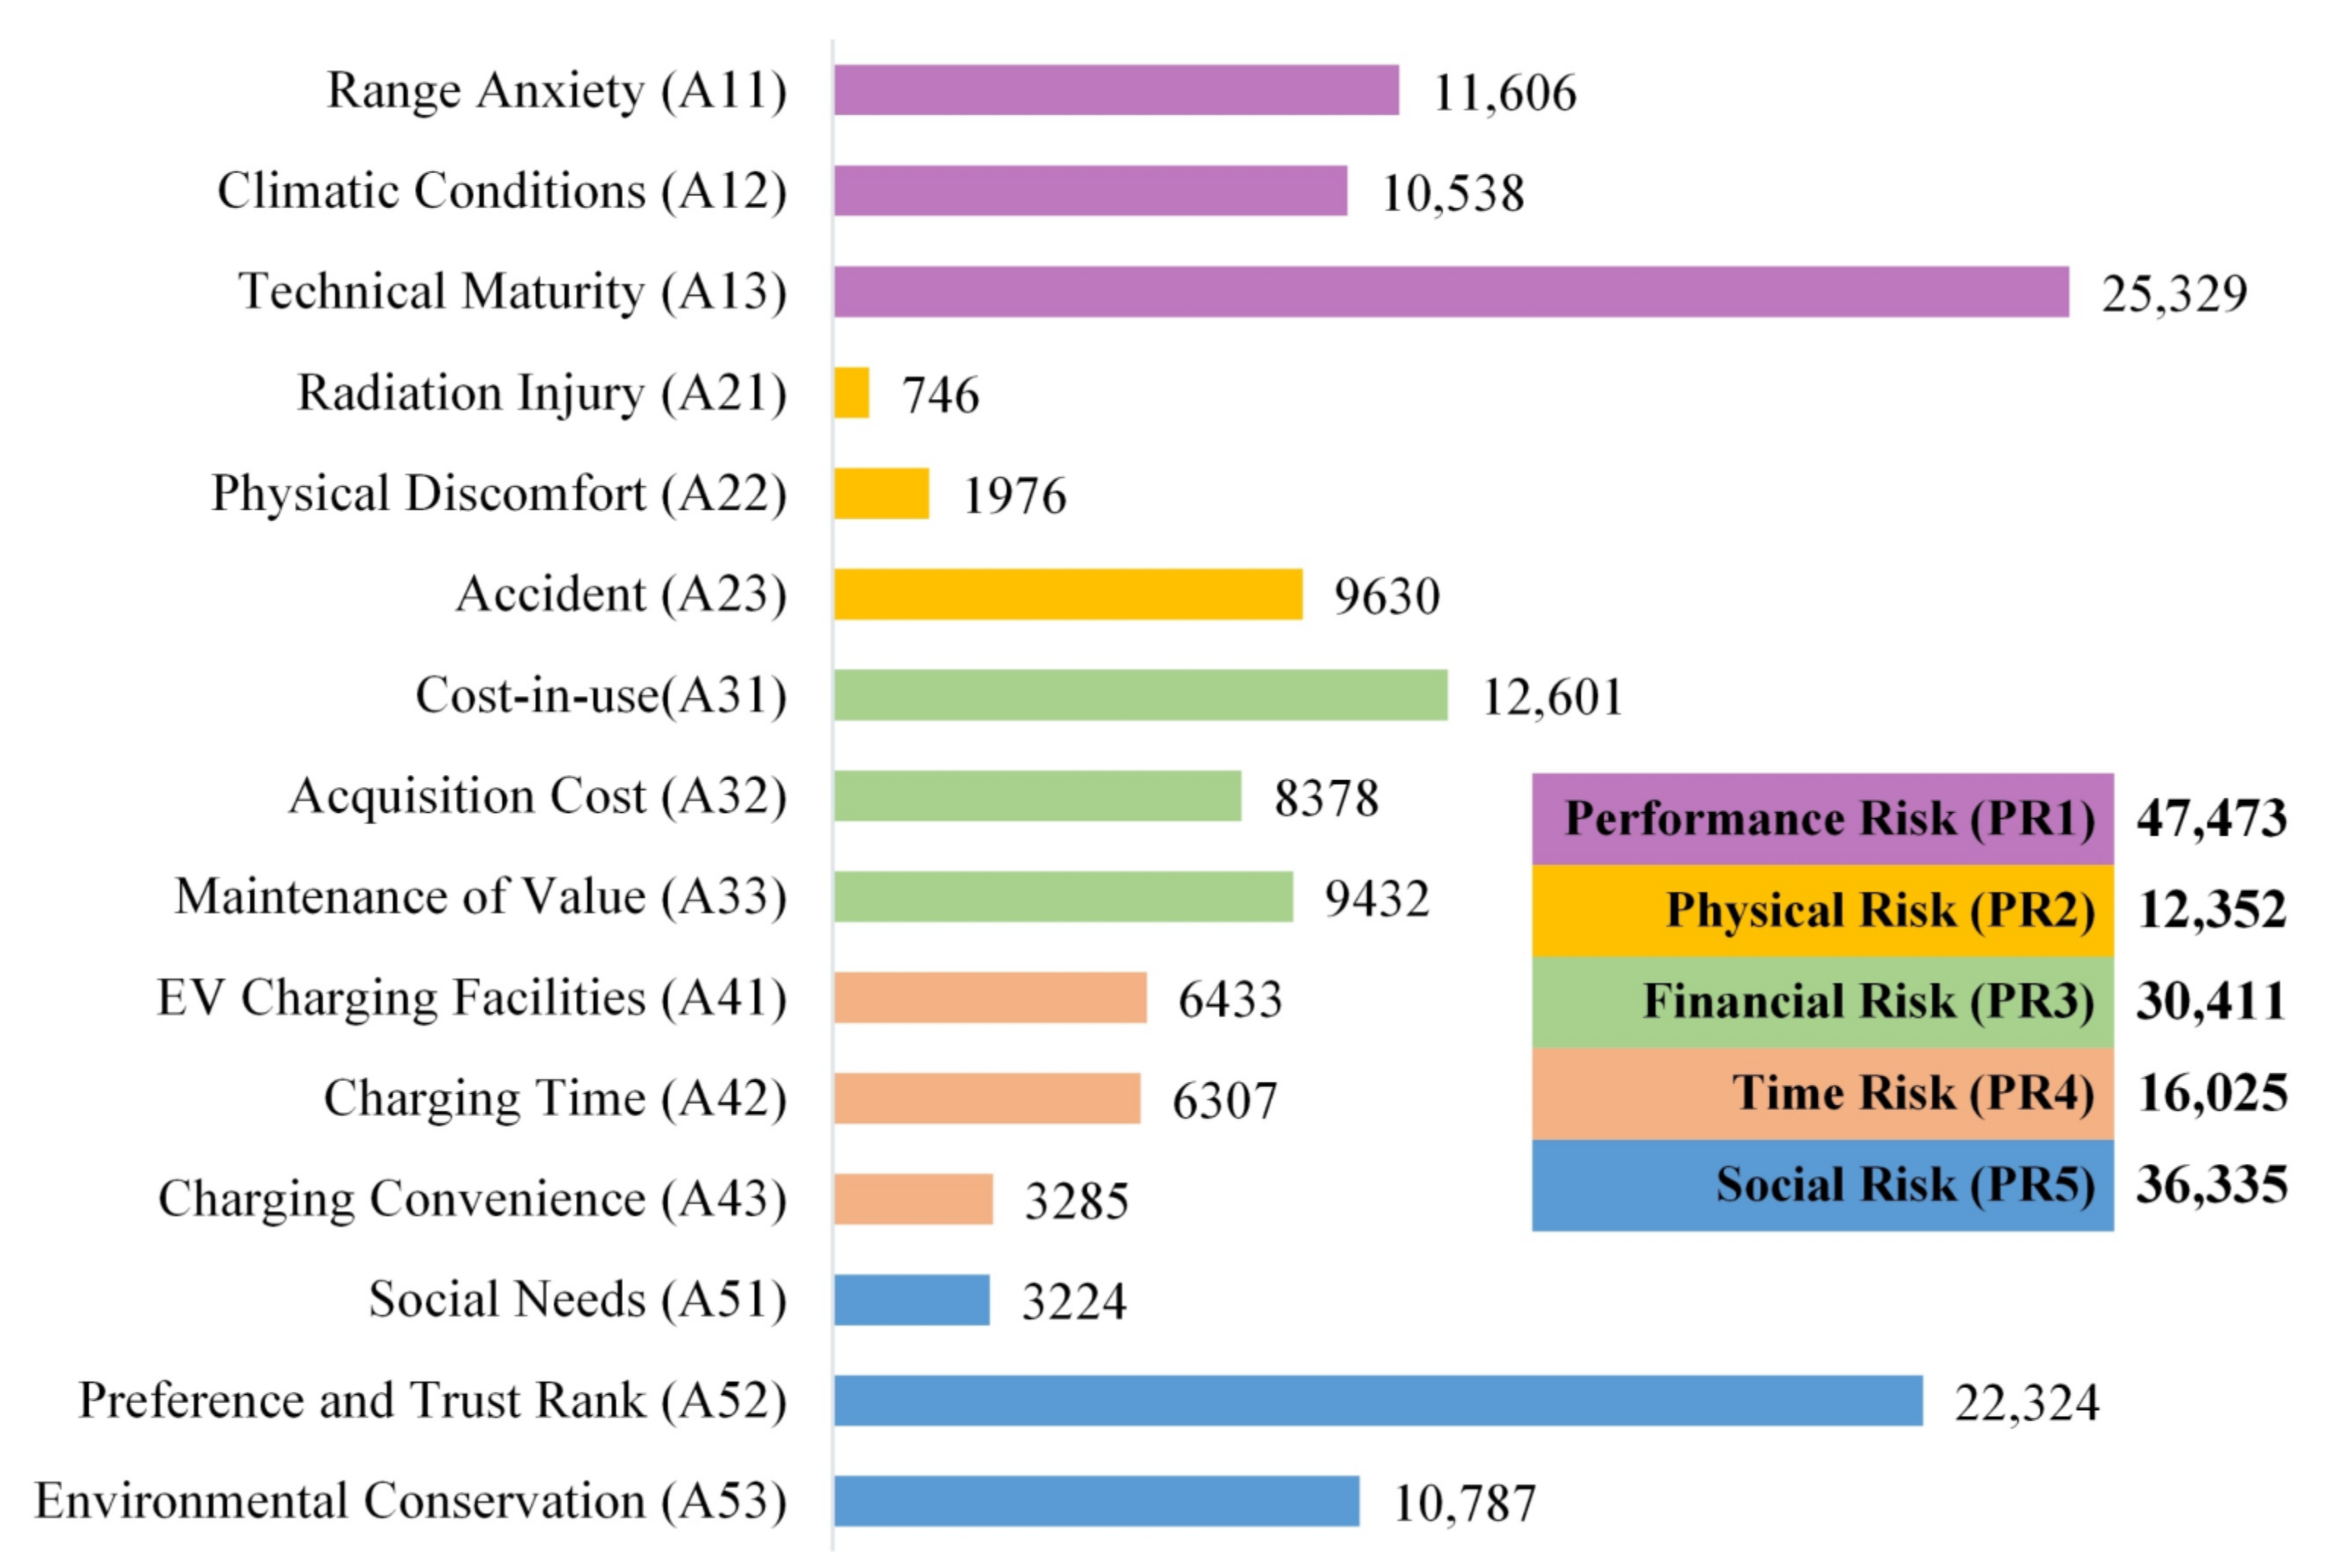
  • Of particular note is that the comment amounts related to the “Technology Maturity” (A13) and “Preference and Trust Rank” (A52) abstracts are more additional than other abstracts. Combined with the feature words list of “Technology Maturity” (A13), such as “Workmanship”, “Maturity”, “Limitations”, “Degree of Attenuation”, “Hydrogen Fuel”, etc., it follows that Chinese consumers take the technical maturity issue of EVs the problem that needs the most attention. The same situation also occurs in “Preference and Trust Rank” A52, with the feature words list as “Preference”, “Believe”, “Dislike”, “Domestic”, “Foreign”, etc. The negative emotional comments (A13, 38%; A52, 39%) of these 2 abstracts also significant more than positive ones (A13, 32%; A52, 28%). The experiments show that the discussion mainly focuses on the disadvantages and limitations of technology, and the still fragile confidence of new technology or new EVs brands. Meanwhile, as shown in Table 5 the “Technology Maturity” (A13) is also the most occurred abstract in top 10 combined labels, accounting for seven times. It can be concluded that the abstract in performance risk dimension “Technology Maturity” (A13) in “Performance Risk” (PR1) dimension is the key factor to effect consumers perceived risks.
  • Accounting for 54% of negative-in-emotion results, the comments about the “Time Risk” (PR4) occupy first place in the five dimensions of risks. Though the total related comments are relatively more minor, the consumers discussed much more about “EV Charging Facilities” (A41, 40.1%) or “Charging Time” (A42, 39.3%) than “Charging Convenience” (A43, 20.6%). Combined with the sentimental results of negative emotions, “Charging Time” (A42, 58%) is the first of all 15 abstracts. “EV Charging Facilities” (A41, 53%) is also very high negatively emotional. Consumers are obviously unsatisfied with the charging facility and its quantity put into use and efficiency.
  • The number of comments related to “Physical Risk” (PR2) ranked at the end shows that the majority of consumers do not think safety is an exclusive problem to EVs. Even this, in a finer granular, 78% of comments related to “Physical Risk” (PR2) expressed concerns about “Accident” (A23). Not only that, 46% of the comments about the “Accident” (A23) abstract tested to be negative emotions. Analysis of the feature words list connected to “Accident” (A23) shows that consumers worried about the battery burning or and exploding, the brake system, etc.
  • In the dimension of financial risk, the number of public comments about each abstract are relatively close. Combined with emotion analysis, consumers have more negative emotions about the value maintenance of EVs, which indicates that consumers have low evaluation on the second-hand value of EVs;
  • Finally, there is a significant change when consumers discuss the social risk of EVs. In previous studies, questionnaires and interviews paid great attention to measuring the risk that consumers’ purchase or use of EVs may cause adverse effects such as family and friends’ incomprehension. However, through the measurement method proposed in this paper, the measurement results of consumers’ perceived social risk dimension show only 3224 comments related to “Social Needs” (A51). This is a sharp contrast to the comments of “Preference and Trust Rank” (A52), 22,324, in the same dimension. It implies that consumers have come to accept EVs as a regular, considerable commodity rather than a new, poorly practicable and experimental novelty.

5.5. The Discussion of Key Risks in Co-occurrence Network

(1)
Based on the co-occurrence mathematical matrix Table 5, this paper selects the top 10 co-occurrence risk abstracts to form a co-occurrence network, as shown in Figure 8. The abstract “Technology Maturity” (A13) in the “Performance Risk” (PR1) dimension is obliviously the central node of the network. As it has the largest number (25,329) of comments and forms a co-occurrence relationship with 7 other abstracts, it is the key factor that affects consumers’ perceived risks.
  • In the same dimension, the relationship between “Technology Maturity” (A13), “Range Anxiety” (A11), and “Climatic Conditions” (A12) shows that consumers’ doubts about the technological maturity of EVs, especially the uncertainty of battery performance, leads to consumers’ range anxiety and anxieties about performance in cold weather.
  • “Technology Maturity” (A13) and “Accident” (A23) also have co-occurrence, suggesting that it may be due to the lack of reliable and intelligent driving and control systems that consumers worry about accidents of EVs.
  • The “Technology Maturity” (A13) and “Environmental Conservation” (A53) co-occurrence, occurring 5837 times, suggests that the EVs potential pollution risks of battery scrapping, damage, and existing pollution and emission in the power generation industry make consumers doubt the authenticity of EVs’ environmental friendliness. Consumers also expressed other environmentally friendly energy products that are potential alternatives to fuel or electric vehicles, such as hydrogen vehicles. Then the joint action of “Technology Maturity” (A13) and “Environmental Conservation” (A53) pulls down the evaluation of “Maintenance of Value” (A33).
(2)
More importantly, four risk nodes, which are “Technology Maturity” (A13), “Preference and Trust Rank” (A52), “Cost-in-use” (A31), and “Maintenance of Value” (A33), form a local network.
  • “Technology Maturity” (A13) has direct relationships with all other risks in the local network. The connection of “Technology Maturity” (A13) and “Cost-in-use” (A31) shows that the immaturity of EVs technology also leads to some consumers worrying about the high cost of battery repair, replacement, and the correspondingly high cost of insurance. Moreover, they will question whether EVs can meet the manufacturer’s promise of low cost-in-use.
  • Finally, the joint action of “Technology Maturity” (A13) and “Environmental Conservation” (A53) pulls down the evaluation of “Maintenance of Value” (A33). Most importantly, the co-occurrence of “Preference and Trust Rank” (A52) and “Technology Maturity” (A13) is the most frequent of all, occurring 9869 times. Moreover, the connections between “Preference and Trust Rank” (A52) and “Cost-in-use” (A31) are 4621, and between “Preference and Trust Rank” (A52) and “Maintenance of Value” (A33) are 4225. This represents that consumers’ perceived risk of EVs’ technology maturity is closely related to EV brands’ preference and trust ranking, directly or indirectly. That is to say, consumers’ concerns about technology maturity will affect their choice of fuel vehicles and EVs and focus on comparing the technology maturity of different EVs brands.

6. Conclusions

This study used the NLP method to measure and analyze the perceived risk of 70,158 consumer comments towards EVs on social media with a multi-dimensional and fine-granular method. The measurement results show 15 abstracts related to perceived risk which match five perceived risk dimensions. Compared with most previous studies, the comments data set is without geographical limit, is timelier, and is big-data based and thus more objective. By machine-learning-based NLP methods, the experiment results are quantitative, accurate, and timely to validate previous studies.
Additionally, this paper also has the fine-granular ability to investigate difference, change, or inversion. However, compared with previous studies, the most apparent inversion is consumers’ emotional change on “Social Needs” (A51). This indicates that the Chinese consumer market gradually accepts EVs. The high growth of the EVs market in 2021 confirms this point. In 2021, 2.99 million new energy vehicles were sold in China, increasing 169% over 2020. The sales of new energy vehicles accounted for 14.9% of the total sales of all passenger vehicles, an increase of 159% compared with 5.76% of the year 2020. With the increasing acceptance of EVs and the strong policy support of the Chinese government, the trend of EVs replacing traditional fuel vehicles on a large scale is taking shape in the mainstream vehicle consumption fields.
Despite the rapid acceptance in China’s EVs market, Chinese consumers still have a wide range of perceived risks with negative emotions, especially performance, financial, and time risks. In addition, there are also complicated relationships among the risks. So, at present, Chinese and international manufacturers carrying out business activities in China are facing the same opportunities and challenges.
The results of this study showed that, as a manufacturer, the fundamental way to improve the brand and product market acceptance of EVs is to improve the product performance, reliability, and follow-up service level and reduce the use cost. As a greater number of safer, and more economical EVs are put into use, when the retention of EVs increases to a certain amount and the stability is further improved, the insurance premium will decrease. At the same time, the second-hand EVs market will be activated by itself, and value preservation will increase.
In order to achieve the goal of energy conservation and emission reduction, based on the existing support policies, the Chinese government, or capital guided by the government’s policy, needs to invest more in the construction and upgrading of charging infrastructure to reduce the time consumption of EVs charging. In addition, the Chinese government should lead the formulation of EVs battery standards to realize the sharing of batteries of different brands of electric vehicles, improve battery using efficiency, and reduce the total cost to society.
Though this research has some interesting findings and implications, it is important to highlight the limitations which present valuable opportunities for future research. With more data, we can better prove the advantages of the study frameworks in this paper. We will collect more data for supplementary experiments in the future. It should be feasible to compare the perceived risk differences of consumers for different manufacturers or brands on a more fine-granular scale, but this paper ignored this point. Both classification and sentiment analysis models need to strengthen training to improve classification accuracy. More NLP methods or models should be introduced to optimize the research frameworks. Furthermore, we will study the evolution trend of consumer perceived risk by introducing the timeline. Thus, we can catch the invention interval and analysis why and when the invention occurred.

Author Contributions

Conceptualization, T.S.; methodology, T.S.; writing—original draft preparation, T.S.; writing—review and editing, T.S., Z.W., L.L., H.J. and J.Z. All authors have read and agreed to the published version of the manuscript.

Funding

This research received no external funding.

Institutional Review Board Statement

Not applicable.

Informed Consent Statement

Not applicable.

Data Availability Statement

https://pan.baidu.com/s/1gm6HlAy6zFITJaGV9ADd_Q (accessed on 20 January 2022), with the access code: ubk6.

Conflicts of Interest

The authors declare no conflict of interest.

References

  1. Ma, L.; Zhong, W.; Mei, S. Research on “Fall off” Problem of Subsidy Policies for New-Energy Vehicles. Soft Sci. 2018, 32, 26–30. [Google Scholar]
  2. Li, L.; Wang, Z.; Chen, L.; Wang, Z. Consumer preferences for battery electric vehicles: A choice experimental survey in China. Transp. Res. Part D Transp. Environ. 2020, 78, 102185. [Google Scholar] [CrossRef]
  3. Wang, S.; Li, J.; Zhao, D. The impact of policy measures on consumer intention to adopt electric vehicles: Evidence from China. Transp. Res. Part A Policy Pract. 2017, 105, 14–26. [Google Scholar] [CrossRef]
  4. Kongklaew, C.; Phoungthong, K.; Prabpayak, C.; Chowdhury, M.S.; Khan, I.; Yuangyai, N.; Yuangyai, C.; Techato, K. Barriers to Electric Vehicle Adoption in Thailand. Sustainability 2021, 13, 12839. [Google Scholar] [CrossRef]
  5. Zhong, K.; Wang, P.; Pei, J.; Xu, J.; Han, Z.; Xu, J. Multiobjective Optimization regarding Vehicles and Power Grids. Wirel. Commun. Mob. Comput. 2021, 2021, 5552626. [Google Scholar] [CrossRef]
  6. Du, H.; Liu, D.; Sovacool, B.K.; Wang, Y.; Ma, S.; Li, R.Y.M. Who buys New Energy Vehicles in China? Assessing social-psychological predictors of purchasing awareness, intention, and policy. Transp. Res. Part F Traffic Psychol. Behav. 2018, 58, 56–69. [Google Scholar] [CrossRef] [Green Version]
  7. Wang, S.; Wang, J.; Li, J.; Wang, J.; Liang, L. Policy implications for promoting the adoption of electric vehicles: Do consumer’s knowledge, perceived risk and financial incentive policy matter? Transp. Res. Part A Policy Pract. 2018, 117, 58–69. [Google Scholar] [CrossRef]
  8. Brown, D.E.; Abbasi, A.; Lau, R.Y.K. Predictive analytics: Predictive modeling at the micro level. IEEE Intell. Syst. 2015, 30, 6–8. [Google Scholar] [CrossRef] [Green Version]
  9. Zhong, K.; Wang, Y.; Pei, J.; Tang, S.; Han, Z. Super Efficiency SBM-DEA and Neural Network for Performance Evaluation. Inf. Process. Manag. 2021, 58, 102728. [Google Scholar] [CrossRef]
  10. Abbasi, A.; Lau, R.Y.K.; Brown, D.E. Predicting behavior. IEEE Intell. Syst. 2015, 30, 35–43. [Google Scholar] [CrossRef]
  11. Rust, J.; Golombok, S. Modern Psychometrics: The Science of Psychological Assessment, 3rd ed.; Routledge: London, UK, 2014. [Google Scholar]
  12. Li, J.; Larsen, K.R.; Abbasi, A. TheoryOn: A Design Framework and System for Unlocking Behavioral Knowledge through Ontology Learning. MIS Q. 2020, 44, 1733–1772. [Google Scholar] [CrossRef]
  13. Li, C.; Ye, L.; Wang, L. The Influence of New Energy Vehicle Consumption Promotion Policy on the Purchase Intention of Potential Consumers. Chin. J. Manag. Sci. 2021, 29, 151–164. [Google Scholar]
  14. Ye, F.; Kang, W.; Li, L.; Wang, Z. Why do consumers choose to buy electric vehicles? A paired data analysis of purchase intention configurations. Transp. Res. Part A Policy Pract. 2021, 147, 14–27. [Google Scholar] [CrossRef]
  15. Gefen, D.; Larsen, K.R. Controlling for Lexical Closeness in Survey Research: A Demonstration on the Technology Acceptance Model. J. Assoc. Inf. Syst. 2017, 18, 727–757. [Google Scholar] [CrossRef] [Green Version]
  16. Choudhury, P.; Wang, D.; Carlson, N.A. Machine learning approaches to facial and text analysis: Discovering CEO oral communication styles. Strateg. Manag. 2019, 40, 1705–1732. [Google Scholar] [CrossRef]
  17. Choi, J.; Menon, A.; Tabakovic, H. Using machine learning to revisit the diversification-performance relationship. Strateg. Manag. 2021, 42, 1632–1661. [Google Scholar] [CrossRef]
  18. Wang, Y.-Y.; Chi, Y.-Y.; Xu, J.-H.; Li, J.-L. Consumer Preferences for Electric Vehicle Charging Infrastructure Based on the Text Mining Method. Energies 2021, 14, 4598. [Google Scholar] [CrossRef]
  19. Qian, M.; Xu, Z. A Study of Dynamic Recognition of Consumer Brand Decision-making Preference Based on Machine Learning Method. Nankai Bus. Rev. 2019, 22, 66–76. [Google Scholar]
  20. Wang, W.; Ying, S.; Lyu, J.; Qi, X. Perceived image study with online data from social media: The case of boutique hotels in China. Ind. Manag. Data Syst. 2019, 119, 950–967. [Google Scholar] [CrossRef]
  21. Dou, Z.; Cheng, Z.; Huang, D. Research on Migrant Works’ Concern Recognition and Emotion Analysis Based on Web Text Data. Front. Psychol. 2021, 12, 741928. [Google Scholar] [CrossRef]
  22. Bauer, R.A. Consumer behavior as risk taking. In Proceedings of the 43rd National Conference of the American Marketing Association, Chicago, IL, USA, 15–17 June 1960; pp. 389–398. [Google Scholar]
  23. Cunningham, M.S. The major dimensions of perceived risk. In Risk-Taking and Information-Handling in Consumer Behavior; Cox, D.F., Ed.; Harvard University Press: Boston, MA, USA, 1967; pp. 82–108. [Google Scholar]
  24. Cox, D.F. Risk handling in consumer behavior—An intensive study of two cases. In Risk-Taking and Information-Handling in Consumer Behavior; Cox, D.F., Ed.; Harvard University Press: Boston, MA, USA, 1967; pp. 34–81. [Google Scholar]
  25. Dowling, G.R.; Staelin, R. A Model of Perceived Risk and Intended Risk-handling Activity. J. Consum. Res. 1994, 21, 119–134. [Google Scholar] [CrossRef]
  26. Kotler, P. Marketing Management: Analysis, Planning, Implementation and Control; Prentice-Hall PTR: Hoboken, NJ, USA, 1998. [Google Scholar]
  27. Mitchell, V.W. Consumer Perceived Risk: Conceptualization and Models. Eur. J. Mark. 1999, 100, 171–183. [Google Scholar] [CrossRef]
  28. Chen, R.; He, F. Examination of brand knowledge, perceived risk and consumers’ intention to adopt an online retailer. Total Qual. Manag. Bus. Excell. 2003, 14, 677–693. [Google Scholar] [CrossRef]
  29. Featherman, M.S.; Pavlou, P.A. Predicting e-services adoption: A perceived risk facets perspective. Int. J. Hum. Comput. Stud. 2003, 59, 451–474. [Google Scholar] [CrossRef] [Green Version]
  30. Burgess, M.; King, N.; Harris, M.; Lewis, E. Electric vehicle drivers’ reported interactions with the public: Driving stereotype change? Transp. Res. Part F Traffic Psychol. Behav. 2013, 17, 33–44. [Google Scholar] [CrossRef]
  31. Qian, L.; Yin, J. Linking Chinese cultural values and the adoption of electric vehicles: The mediating role of ethical evaluation. Transp. Res. Part D Transp. Environ. 2017, 56, 175–188. [Google Scholar] [CrossRef]
  32. White, L.V.; Sintov, N.D. You are what you drive: Environmentalist and social innovator symbolism drives electric vehicle adoption intentions. Transp. Res. Part A Policy Pract. 2017, 99, 94–113. [Google Scholar] [CrossRef] [Green Version]
  33. Li, W.; Long, R.; Chen, H.; Geng, J. Household factors and adopting intention of battery electric vehicles: A multi-group structural equation model analysis among consumers in Jiangsu Province, China. Nat. Hazards 2017, 87, 945–960. [Google Scholar] [CrossRef]
  34. Lee, M.C. Factors influencing the adoption of internet banking: An integration of TAM and TPB with perceived risk and perceived benefit. Electron. Commer. Res. Appl. 2009, 8, 130–141. [Google Scholar] [CrossRef]
  35. Park, E.; Ohm, J.Y. Factors influencing the public intention to use renewable energy technologies in South Korea: Effects of the Fukushima nuclear accident. Energy Policy 2014, 65, 198–211. [Google Scholar] [CrossRef]
  36. Peter, J.P.; Tarpey, S.; Lawrence, X. A comparative analysis of three-consumer decision strategic. J. Consum. Res. 1975, 2, 29–37. [Google Scholar] [CrossRef]
  37. Zhang, X.; Bai, X.; Shang, J. Is subsidized electric vehicles adoption sustainable: Consumers’ perceptions and motivation toward incentive policies, environmental benefits, and risks. J. Clean. Prod. 2018, 192, 71–79. [Google Scholar] [CrossRef]
  38. Stone, R.N.; Gronhaug, K. Perceived Risk: Further Considerations for the Marketing Discipline. Eur. J. Mark. 1993, 27, 173–180. [Google Scholar] [CrossRef]
  39. Chaudhuri, A. Product class effects on perceived risk: The role of emotion. Int. J. Res. Mark. 1998, 15, 157–168. [Google Scholar] [CrossRef]
  40. Mitchell, V.W.; McGoldrick, P.J. Consumer’s risk-reduction strategies: A review and synthesis. Int. Rev. Retail. Distrib. Consum. Res. 1996, 6, 1–33. [Google Scholar] [CrossRef]
  41. Jensen, A.F.; Cherchi, E.; Mabit, S.L. On the stability of preferences and attitudes before and after experiencing an electric vehicle. Transp. Res. Part D Transp. Environ. 2013, 25, 24–32. [Google Scholar] [CrossRef] [Green Version]
  42. Flamm, B.J.; Agrawal, A.W. Constraints to green vehicle ownership: A focus group study. Transp. Res. Part D Transp. Environ. 2012, 17, 108–115. [Google Scholar] [CrossRef]
  43. Egbue, O.; Long, S. Barriers to widespread adoption of electric vehicles: An analysis of consumer attitudes and perceptions. Energy Policy 2012, 48, 717–729. [Google Scholar] [CrossRef]
  44. Zhang, X.; Wang, K.; Hao, Y.; Fan, J.; Wei, Y. The impact of government policy on preference for NEVs: The evidence from China. Energy Policy 2013, 61, 382–393. [Google Scholar] [CrossRef]
  45. Degirmenci, K.; Breitner, M.H. Consumer purchase intentions for electric vehicles: Is green more important than price and range? Transp. Res. Part D Transp. Environ. 2017, 51, 250–260. [Google Scholar] [CrossRef] [Green Version]
  46. Dumortier, J.; Siddiki, S.; Carley, S.; Cisney, J.; Krause, R.M.; Lane, B.W.; Rupp, J.A.; Graham, J.D. Effects of providing total cost of ownership information on consumers’ intent to purchase a hybrid or plug-in electric vehicle. Transp. Res. Part A Policy Pract. 2015, 72, 71–86. [Google Scholar] [CrossRef] [Green Version]
  47. Ko, W.; Hahn, T. Analysis of Consumer Preferences for Electric Vehicles. IEEE Trans. Smart Grid 2013, 4, 437–442. [Google Scholar] [CrossRef]
  48. Schuitema, G.; Anable, J.; Skippon, S.; Kinnear, N. The role of instrumental, hedonic and symbolic attributes in the intention to adopt electric vehicles. Transp. Res. Part A Policy Pract. 2013, 48, 39–49. [Google Scholar] [CrossRef]
  49. Barth, M.; Jugert, P.; Fritsche, I. Still underdetected—Social norms and collective efficacy predict the acceptance of electric vehicles in Germany. Transp. Res. Part F Traffic Psychol. Behav. 2016, 37, 64–77. [Google Scholar] [CrossRef]
  50. Wang, Y.; Hazen, B.T. Consumer product knowledge and intention to purchase remanufactured products. Int. J. Prod. Econ. 2016, 181, 460–469. [Google Scholar] [CrossRef]
  51. Ciampa, P.J.; Osborn, C.Y.; Peterson, N.B.; Rothman, R.L. Patient Numeracy, Perceptions of Provider Communication, and Colorectal Cancer Screening Utilization. J. Health Commun. 2010, 15, 157–168. [Google Scholar] [CrossRef] [Green Version]
  52. Osborne, R.H.; Batterham, R.W.; Elsworth, G.R.; Hawkins, M.; Buchbinder, R. The grounded psychometric development and initial validation of the Health Literacy Questionnaire (HLQ). BMC Public Health 2013, 13, 658. [Google Scholar] [CrossRef] [Green Version]
  53. Ahmad, F.; Abbasi, A.; Li, J.; Dobolyi, D.G.; Netemeyer, R.G.; Clifford, G.D.; Chen, H. A Deep Learning Architecture for Psychometric Natural Language Processing. ACM Trans. Inf. Syst. 2020, 38, 1–29. [Google Scholar] [CrossRef] [Green Version]
  54. Xu, K.; Huang, J.; Qi, G. A new sentiment and topic model for short texts on social media. Proceedings of Joint International Semantic Technology Conference, Gold Coast, Australia, 10–12 November 2017; pp. 183–198. [Google Scholar]
  55. Huang, M.; Qian, Q.; Zhu, X. Encoding Syntactic Knowledge in Neural Networks for Sentiment Classification. ACM Trans. Inf. Syst. 2017, 35, 1–27. [Google Scholar] [CrossRef]
  56. Vieira, J.P.A.; Moura, R.S. An analysis of convolutional neural networks for sentence classification. In Proceedings of the 2017 XLIII Latin American Computer Conference, Cordoba, Argentina, 4–8 September 2017; pp. 1–5. [Google Scholar]
  57. Chen, H.; Han, F.X.; Niu, D.; Liu, D.; Lai, K.; Wu, C. MIX: Multi-channel information crossing for text matching. In Proceedings of the 24th ACM SIGKDD International Conference on Knowledge Discovery & Data Mining, London, UK, 19–23 August 2018; pp. 110–119. [Google Scholar]
  58. Zimbra, D.; Abbasi, A.; Zeng, D.; Chen, H. The State-of-the-Art in Twitter Sentiment Analysis: A Review and Benchmark Evaluation. ACM Trans. Manag. Inf. Syst. 2018, 9, 1–29. [Google Scholar] [CrossRef]
  59. Devlin, J.; Chang, M.; Lee, K.; Toutanova, K. BERT: Pre-training of Deep Bidirectional Transformers for Language Understanding. arXiv 2019, arXiv:1810.04805. [Google Scholar]
  60. Duan, R.; Chao, W.; Zhang, Y. Application of pre-trained language model BERT in downstream tasks. J. Beijing Inf. Sci. Technol. Univ. 2020, 35, 77–83. [Google Scholar]
  61. Yang, W.; Xie, Y.; Lin, A.; Li, X.; Tan, L.; Xiong, K.; Li, M.; Lin, J. End-to-end open-domain question answering with BERTserini. In Proceedings of the 2019 Conference of the North American Chapter of the Association for Computational Linguistics (Demonstrations), Minneapolis, MN, USA, 2–7 June 2019; pp. 72–77. [Google Scholar]
  62. Yang, L.; Huang, X.; Wang, J.; Ding, L.; Li, Z.; Li, J. Clinical Trial Disease Subtype Identification based on BERT-TextCNN. Data Anal. Knowl. Discov. 2021, 1–17. [Google Scholar]
  63. Sun, C.; Qiu, X.; Xu, Y.; Huang, X. How to fine-tune BERT for text classification? In Proceedings of the 18th China National Conference on Chinese Computational Linguistics, Kunming, China, 18–20 October 2019; pp. 194–206. [Google Scholar]
  64. Li, K.; Chen, Y.; Niu, S. Social E-commerce Text Classification Algorithm Based on BERT. Comput. Sci. 2021, 48, 87–92. [Google Scholar]
  65. Xu, H.; Liu, B.; Shu, L.; Yu, P.S. BERT Post-Training for Review Reading Comprehension and Aspect-based Sentiment Analysis. arXiv 2019, arXiv:1904.02232. [Google Scholar]
  66. Yang, J.; Yang, W. Text comment sentiment analysis based on BERT model. J. Tianjin Univ. Technol. 2021, 27, 12–16. [Google Scholar]
  67. Chen, Z.; Trabelsi, M.; Heflin, J.; Xu, Y.; Davison, B.D. Table search using a deep contextualized language model. In Proceedings of the 43rd International ACM SIGIR Conference on Research and Development in Information Retrieval, Online, China, 25–30 July 2020; pp. 589–598. [Google Scholar]
  68. Du, L.; Cao, D.; Lin, S.; Qu, Y.; Ye, H. Extraction and Automatic Classification of TCM Medical Records Based on Attention Mechanism of BERT and Bi-LSTM. Comput. Sci. 2020, 47, 416–420. [Google Scholar]
  69. Lecun, Y.; Bottou, L.; Bengio, Y.; Haffner, F. Gradient-Based Learning Applied to Document Recognition. Proc. IEEE 1998, 86, 2278–2324. [Google Scholar] [CrossRef] [Green Version]
  70. Collobert, R.; Weston, J.; Bottou, L.; Karlen, M.; Kavukcuoglu, K.; Kuksa, P. Natural Language Processing (Almost) from Scratch. J. Mach. Learn. Res. 2011, 12, 2493–2537. [Google Scholar]
  71. Zhang, X.; Zhao, J.; LeCun, Y. Character-level Convolutional Networks for Text Classification. Adv. Neural Inf. Process. Syst. 2015, 28, 649–657. [Google Scholar]
  72. Kim, Y. Convolutional neural networks for sentence classification. In Proceedings of the 2014 Conference on Empirical Methods in Natural Language Processing (EMNLP), Doha, Qatar, 25–29 October 2014; pp. 1746–1751. [Google Scholar]
  73. Elman, J.L. Finding Structure in Time. Cogn. Sci. 1990, 14, 179–211. [Google Scholar] [CrossRef]
  74. Hochreiter, S.; Schmidhuber, J. Long Short-Term Memory. Neural Comput. 1997, 9, 1735–1780. [Google Scholar] [CrossRef] [PubMed]
  75. Cho, K.; Merrienboer, B.V.; Bahdanau, D.; Bengio, Y. On the Properties of Neural Machine Translation: Encoder-Decoder Approaches. arXiv 2014, arXiv:1409.1259. [Google Scholar]
  76. Jiang, W.; Jin, Z. Text Classification Based on Phrase Attention Mechanism. J. Chin. Inf. Process. 2018, 32, 103–119. [Google Scholar]
  77. Lyu, X.; Peng, C.; Zhang, L.; Dong, Z.; You, X. Text mutli-label classification method incorporating BERT and label semantic attention. J. Comput. Appl. 2022, 42, 57–63. [Google Scholar]
  78. Wu, X.; Chen, L.; Wei, T.; Fan, T. Sentiment Analysis of Chinese Short Text Based on Self-Attention and Bi-LSTM. J. Chin. Inf. Process. 2019, 33, 100–107. [Google Scholar]
  79. Vaswani, A.; Shazeer, N.; Parmar, N.; Uszkoreit, J.; Jones, L.; Gomez, A.N.; Kaiser, L. Attention is all you need. In Proceedings of the 31st International Conference on Neural Information Processing Systems, Long Beach, CA, USA, 4–9 December 2017; pp. 6000–6010. [Google Scholar]
  80. Yao, X. Attention-based BiLSTM neural networks for sentiment classification of short texts. Proceedings of Information Science and Cloud Computing (ISCC 2017), Guangzhou, China, 16–17 December 2017; pp. 110–117. [Google Scholar]
  81. Zhao, Q.; Cai, X.; Li, B.; Lyu, L. Text feature extraction method based on LSTM-Attention neural network. Mod. Electron. Tech. 2018, 41, 167–170. [Google Scholar]
  82. Zhang, Y.; Zheng, J.; Huang, G.; Jiang, Y. Microblog sentiment analysis method based on a double attention model. J. Tsinghua Univ. 2018, 58, 122–130. [Google Scholar]
  83. Yang, Z.; Dai, Z.; Yang, Y.; Carbonell, J.; Salakhutdinov, R.R.; Le, Q.V. XLNet: Generalized Autoregressive Pretraining for Language Understanding. arXiv 2019, arXiv:1906.08237. [Google Scholar]
  84. Graves, A. Long Short-Term Memory. Supervised Seq. Label. Recurr. Neural Netw. Stud. Comput. Intell. 2012, 385, 37–45. [Google Scholar] [CrossRef]
Figure 1. NLP Architecture of Customer Perceived Risk towards EVs.
Energies 15 01637 g001
Figure 2. Network Structure of BERT Model.
Energies 15 01637 g002
Figure 3. Semantic Identification Based on Bert-TextCNN.
Energies 15 01637 g003
Figure 4. Emotion classification based on BERT-Att-BiLSTM.
Energies 15 01637 g004
Figure 5. Perceived Risk Labels Match Process and Results.
Energies 15 01637 g005
Figure 6. Histogram of Distribution of Customer Perceived Risks about EVs.
Energies 15 01637 g006
Figure 7. Emotion Pie Graph of Customer towards EVs.
Energies 15 01637 g007
Figure 8. Co-occurrence Network Analysis.
Energies 15 01637 g008
Table 1. Review of Perceived Risk Dimension Research.
Products TypeDimensionsDescriptionAuthor(s)
Generic Products
  • Performance Risk
The purchased product does not perform as expected.[38,39,40]
2.
Physical Risk
The personal injury caused by purchasing the product.[38,39,40]
3.
Financial Risk
The purchase products will result in a loss of money or other resources.[38,39,40]
4.
Time Risk
The time loss caused by purchasing or retaining products.[38,39,40]
5.
Psychological Risk
The product leads to an inconsistent self-image.[38,39,40]
6.
Social Risk
The products are not accepted by relatives and friends.[38,39,40]
EVs
  • Performance Risk
Consumers worry about the performance differences between EVs and traditional gasoline vehicles.[5,37]
Consumers tend to have general perceptions that EVs offer several lower levels of performance, such as reduced range, low maximum speed, less powerful acceleration.[30,32]
EVs might not perform well because of long recharging time, short driving distance, and limited charging stations.[7,33]
2.
Physical Risk
There can be safety and reliability issues in EVs, such as spontaneous combustion which can cause physical damages.[7,41]
EVs can cause contingency, such as batteries to burst into flames, and result in physical damages.[33,42]
3.
Financial Risk
The batteries in EVs cannot be insured in China. When the battery fails, it is difficult for consumers to ask for compensation.[43,44]
The total purchase cost of EVs is higher than that of conventional gasoline cars.[45,46]
4.
Time Risk
Consumers may loss time in the using process of EVs, such as spending long time to recharge the battery.[33,47]
The lack of charging infrastructure leads to consumers spending a lot of time looking for charging stations and charging piles.[18,48]
5.
Psychological Risk
Consumers’ social status maybe improved or decreased lies on how EVs are viewed.[7,49]
Consumers’ purchases of EVs may be misunderstood by other people, damaging their social status and self-image in social groups.[31,50]
Table 2. Parameter Setting of Three Models.
ParameterValue
TextCNNAtt-BiLSTM
Batch size64128
Epochs50120
Internal layer33
No of hidden layers33
Activation functionRELURELU
Learning optimizerAdam(stochastic)Adam(stochastic)
RegularizationL2-regularization = 0.0001L2-regularization = 0.003
Table 3. Performance of Multi-Label Classification Model.
ModelMaP(+)MaR(+)MaF1(+)HL(−)
BERT-TextCNN0.930.910.920.0011
Table 4. Performance of Emotion Classification Model.
ModelPRF1
BERT-Att-BiLSTM0.910.920.90
Table 5. Top 10 Combined Labels.
Combined LabelsNumber of Comments
Technology Maturity (A13)+Preference and Trust Rank (A52)9869
Technology Maturity (A13)+Cost-in-use (A31)5993
Technology Maturity (A13)+Environmental Conservation (A53)5837
Technology Maturity (A13)+Range Anxiety (A11)5744
Technology Maturity (A13)+Climatic Conditions (A12)5358
Cost-in-use (A31)+Preference and Trust Rank (A52)4621
Technology Maturity (A13)+Maintenance of Value (A33)4403
Technology Maturity (A13)+Accident (A23)4226
Maintenance of Value (A33)+Preference and Trust Rank (A52)4225
Maintenance of Value (A33)+Environmental Conservation (A53)4186
Publisher’s Note: MDPI stays neutral with regard to jurisdictional claims in published maps and institutional affiliations.

