Abstract
Accurate characterization of the micro- and nano-pore radius values in a tight sandstone reservoir is the key work to reasonably evaluate reservoir properties. The previous exploration of pore-stitching methods is mainly based on the morphological extension of similar segments. However, few scholars compare and verify the image and non-image stitching methods, so they cannot clarify the application scope of different pore-stitching methods. In this study, the pore structures of eight selected tight sandstone samples were evaluated using high-pressure mercury injection, nuclear magnetic resonance, scanning electron microscope, and the helium porosity test. Then, the C-value fitting, interpolation fitting, and morphological fitting were used to establish high-pressure mercury injection and Nuclear Magnetic Resonance (NMR) pore distribution curves to evaluate the differences among the micro-nano-scale pore radius values determined by the three fitting methods. Finally, the pore radius distribution is extracted from the binary image of Scanning Electron Microscope (SEM). After correcting the helium porosity data, the application scope of different fitting methods is evaluated by using the mean standard deviation verification method, and the optimal solution of the stitching method of pore radius distribution in each application scope is found. Compared to other studies, this research demonstrated three relatively simple methods for the determination of the full range of pore size distributions, providing a reliable method to evaluate the prerequisites of the range of application. This study provides a new idea for the micro-nano-scale pore radius splicing method of a tight sandstone reservoir, and the research results can provide a reference for the actual reservoir evaluation of oil and gas fields.
1. Introduction
A tight sandstone reservoir is one of the hotspots of petroleum exploration and development at present [1,2]. Its micro-geological characteristics, pore genetic mechanism, distribution heterogeneity, and fluid seepage mechanism are different from conventional and general low-permeability reservoirs [3,4,5]. The characterization of the micro-nano-pore structure of a tight sandstone reservoir is not only one of the important factors to evaluate the quality of the oil and gas reservoir, but also the basic research work to point out the key research direction of exploration and development theory and technology, so it has attracted much attention in academic circles [6,7,8]. In view of the difficulty in characterizing the micro- and nano-pores of unconventional reservoirs by conventional methods, the fine identification and characterization of micro-nano-scale pores and throats of reservoirs can be realized by using high-resolution testing technologies such as field emission scanning electron microscope, double beam electron microscope, constant velocity mercury injection, high-pressure mercury injection, maps imaging analysis, and Computerized Tomography (CT) imaging, combined with conventional testing [9,10,11]. However, because tight sandstone oil and gas reservoirs have low dispersion micro-nano-pore size information, its testing and characterization technology and theoretical methods are not perfect, which is an important scientific problem to be studied urgently [12,13,14]. At the same time, the quantitative characterization model of full pore size structure characteristics of micro- and nano-pores as well as the influence mechanism of connectivity and pore heterogeneity on fluid occurrence and mobility in different scales are not clear [4,15,16]. The existence of these problems has been perplexing the majority of scientific researchers and oil and gas field workers. Therefore, it is urgent to clarify the splicing method of micro-nano-scale pore radius distribution so as to provide a favorable basic guarantee for the subsequent production and scientific research activities.
However, there are many kinds of splicing methods, and there is no unified standard, resulting in large differences in splicing results among different researchers, and the splicing work is mainly based on experience rather than principle [3,5]. The capillary curves obtained by different testing techniques mostly adopt the theories of the least square method, interpolation method, and information entropy, and they are piecewise fitted based on morphology and sorting curvature, but they all ignore the interfacial tension and contact angle between gas, mercury, water, oil, and other fluids [17,18]. Therefore, the quantitative characterization technology and theoretical research of full pore size of micro-and nano-pores need to be deepened.
In this paper, high-pressure mercury injection and NMR experiments are used to sort out the accuracy range of the pore radius that can be characterized by each experiment. Then, based on C-value fitting, interpolation fitting, and morphological fitting, the differences of the pore radius obtained by different fitting methods are compared. Finally, the pore radius obtained by splicing is compared with the pore size distribution extracted by scanning electron microscope after helium porosity correction, and the application scope, advantages, and disadvantages of each method are analyzed in order to provide a basic reference for the actual reservoir evaluation.
2. Materials and Methods
2.1. Geological Background and Experimental Pretreatment
Bohaiwan Basin, located in East China, is one of the important energy industry distribution centers in China (Figure 1). The core samples of this study are taken from the sandstone of Sha 4 member of the Shahejie Formation in the south of the basin. The age of the Shahejie Formation belongs to Eocene, and it is composed of a set of dark sand mudstone dominated by gray and dark gray mudstone, with a thickness of more than 2000 m [19]. It is the main oil source rock series, which is divided into four sections from bottom to top [20]. Sha 4 member is typical sandstone [20]. The sandstone in this part belongs to low permeability dense sandstone, with low porosity and permeability. The sedimentary facies belong to argillaceous sediments and widely distributed underwater fans in semi-deep lake—deep lake brackish—semi-saline water environments [21]. The sampling depth distribution of the sample is relatively concentrated, ranging from 4123 to 4159 m. All experimental samples were drilled to a 2.5 cm × 5 cm core column; then, the oil was washed with chloroform for 48 h and dried at 60 °C for 12 h, after which we carried out follow-up experiments.
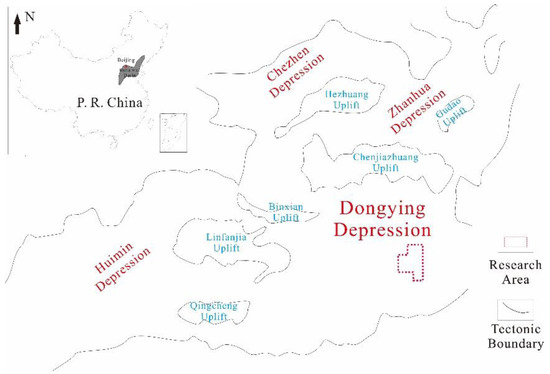
Figure 1.
Structural diagram of the Bohaiwan Basin (modified after ref. [22]).
2.2. High-Pressure Mercury Injection
The Micro-meritics Autopore IV 9520 Mercury Porosimeter (Micromeritics, Norcross, GA, USA) was used to carry out a high-pressure mercury injection test to clarify the pore radius distribution. The maximum mercury inlet pressure used in this experiment is 200 MPa, and the experimental temperature is 25 °C. According to the Young–Laplace formula, the corresponding minimum pore radius is 3.6 × 10⁻³ μm [23].
2.3. Nuclear Magnetic Resonance
Mini-mr NMR apparatus (Niumag, Suzhou, China) is a measuring instrument for nuclear magnetic resonance experiments. After the core is washed and dried, the saturated brine is injected into the core through quasi-static displacement and soaked in the rock core with the same concentration for more than 24 h. The temperature of this experiment is 25 °C.
2.4. Scanning Electron Microscope
Microscopic identification was carried out by FEI Quanta 400 FEG SEM (FEI company, Hillsboro, OR, USA). After the initial cutting and grinding of the sample to 0.15 cm, we wrapped the sample with gold foil to obtain a better-reflected signal. The accuracy of this study is 3.5 nm.
2.5. Helium Porosity
In this experiment, helium is used to measure porosity. All measurements are carried out at room temperature (25 °C) and atmospheric pressure. The instrument used is a QKY-2 Porosity Meter (Haian County Petroleum Scientific Research Instruments Co., Ltd., Haian, China).
2.6. X-ray Diffraction
Then, XRD analysis was carried out. All analytical spectra were directly converted into mineral components based on the specified signal source. All measurements were carried out at room temperature (25 °C) and atmospheric pressure.
3. Results
3.1. Capillary Pressure Curve of High-Pressure Mercury Injection
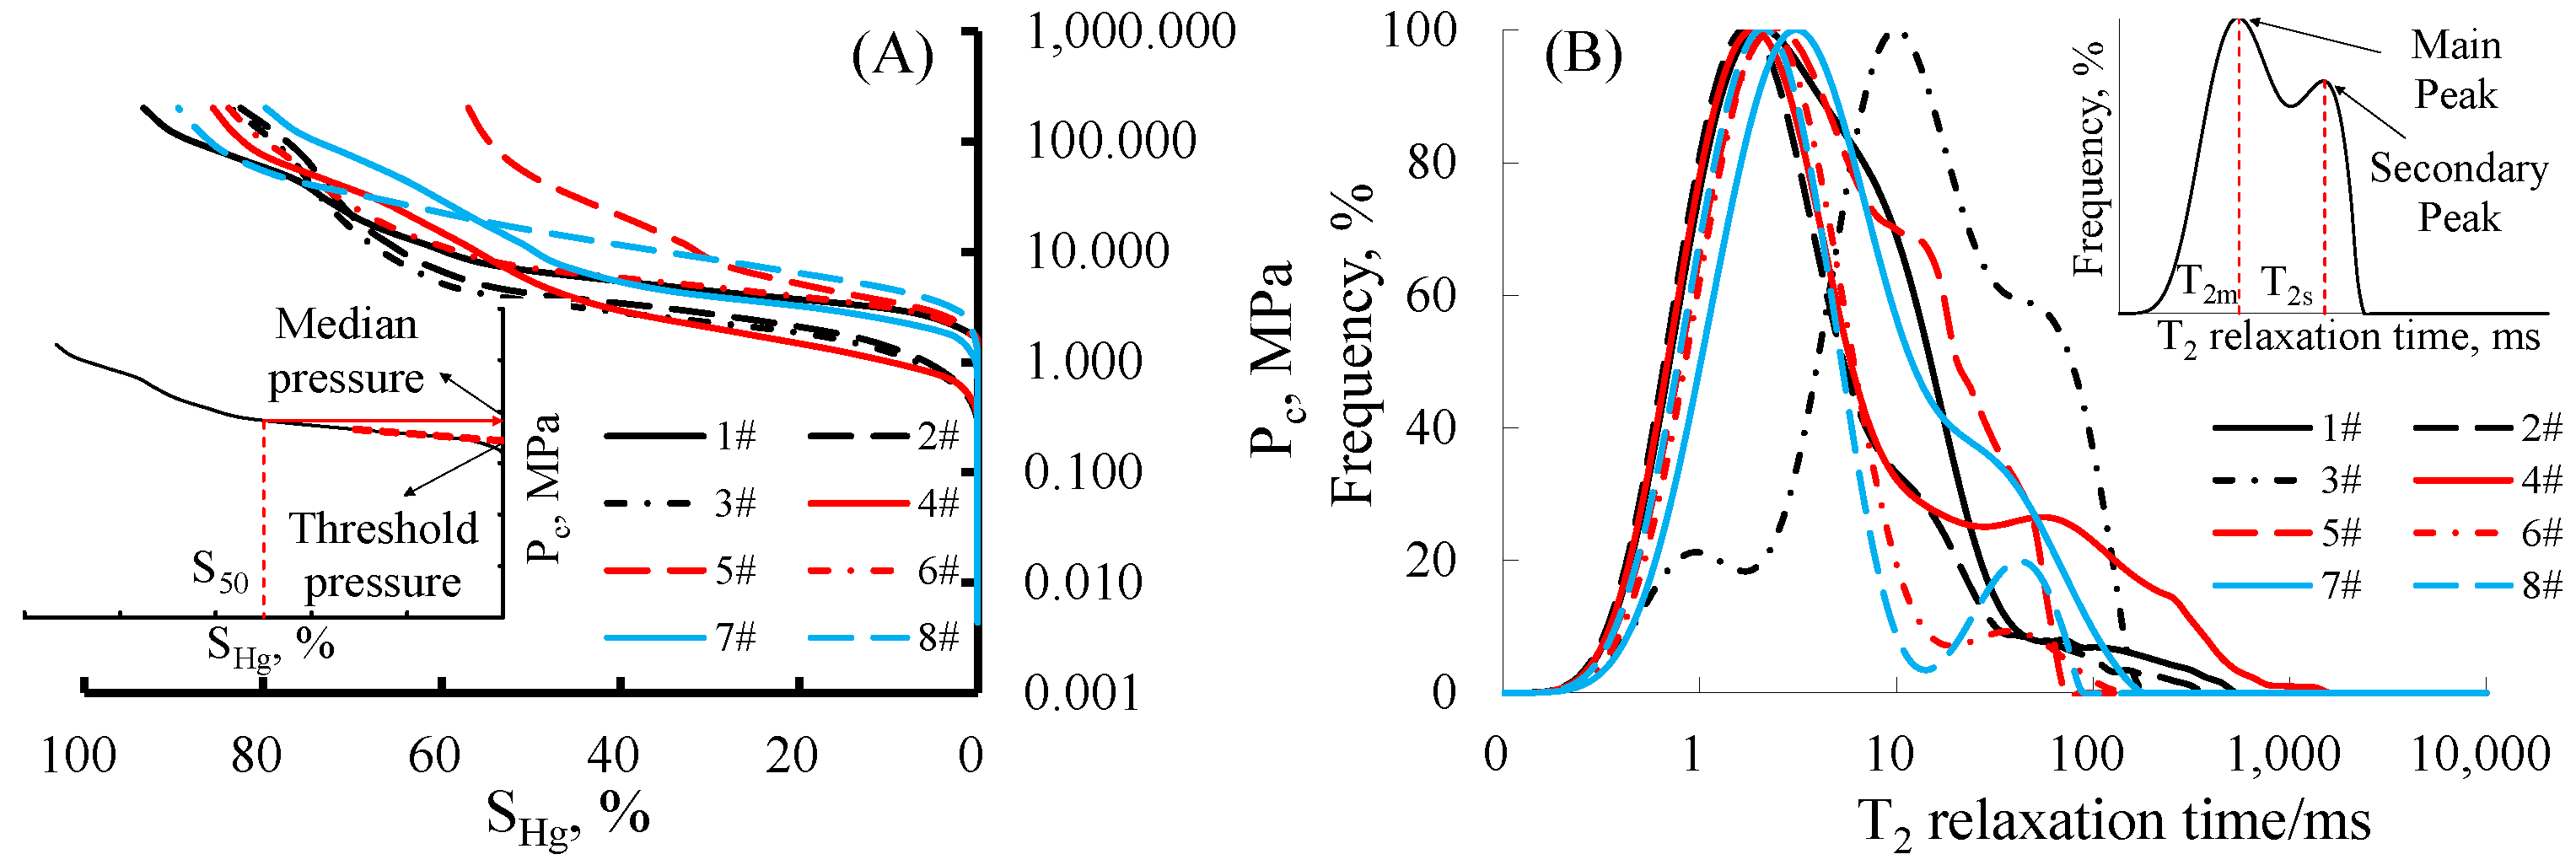
The experimental results of eight high-pressure mercury injection samples show that the threshold pressure of the samples is between 0.853 and 8.543 MPa, with an average of 1.807 MPa. The median pressure is between 3.749 and 72.985 MPa, with an average of 7.020 MPa (Figure 2A). All samples have median pressure, and the final mercury saturation of seven samples exceeds 80%, indicating that although the samples are dense, the overall pore connectivity is good.
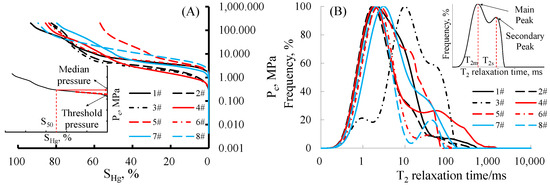
Figure 2.
(A) Capillary pressure from high-pressure mercury injection methods; (B) T2 curves from nuclear magnetic resonance tests. T2m—mainstream peak of T2 curves; T2s—secondary peak of T2 curves.
3.2. Nuclear Magnetic Resonance T2 Spectrum Curve
The results of T2 NMR spectra of eight samples show that the vast majority of samples belong to the left-leaning bimodal type, the peak value is basically between 1.0 and 2.3 ms, and the absolute height of the peak of the main peak is significantly greater than that of the secondary peak, indicating that micro-pores account for a high proportion in the total pore volume. At the same time, most samples have a “tailing” effect; that is, the signal >1000 ms shows a small-scale continuous decline, indicating that the overall connectivity of pores is strong (Figure 2B).
3.3. Microscopic Identification Results
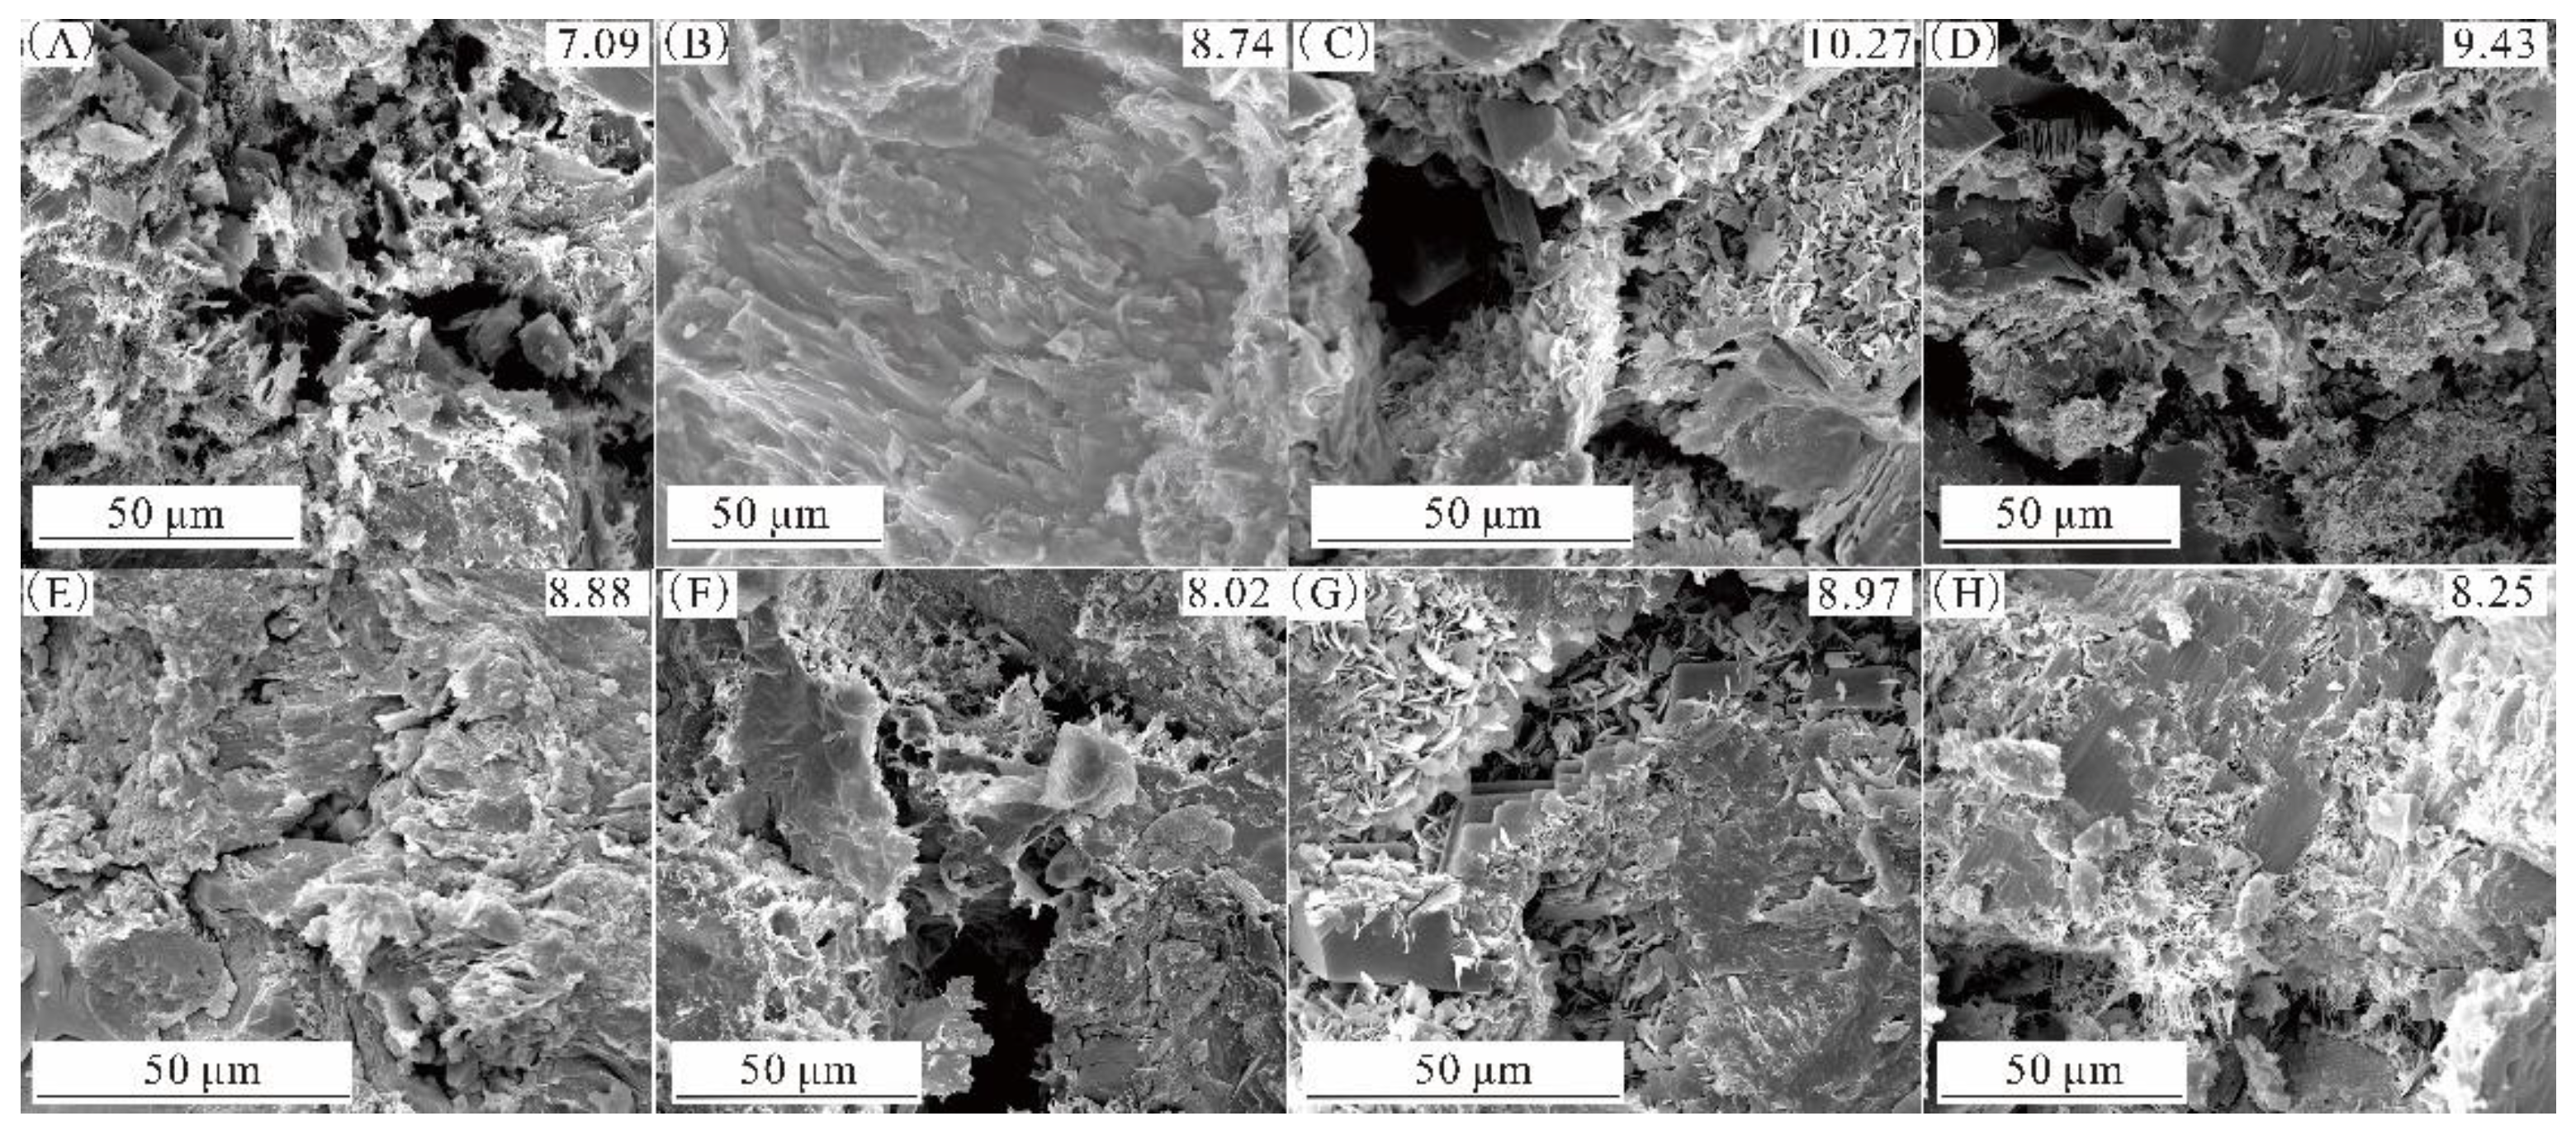
The SEM results show that the sample is relatively dense as a whole, the intergranular pores are almost undeveloped, and the intergranular pores of clay minerals contribute most of the reservoir space (Figure 3). Using software X to perform binary segmentation on the image, the pores can be extracted separately (Figure 4A,B). The extracted pores are measured, and 0.2 μm is the pore radius size interval. While solving the porosity, the pore distribution is output to provide a graphical basis for the subsequent verification of correction means (Table 1, Figure 4C).
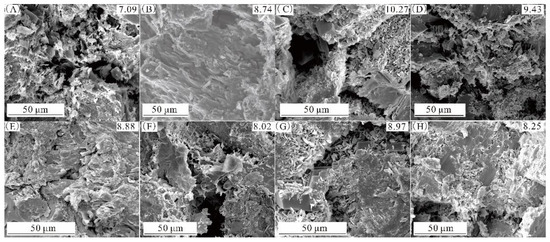
Figure 3.
SEM images for sample (A) 1#; (B) 2#; (C) 3#; (D) 4#; (E) 5#; (F) 6#; (G) 7#; (H) 8#.
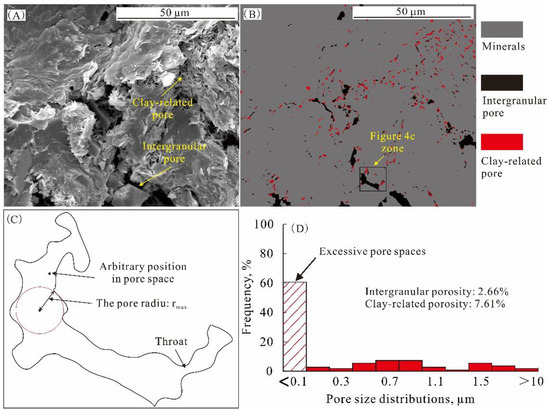
Figure 4.
(A) Microscopic images; (B) revised images after binary segmentation; (C) method for extracting radius of irregular pores; (D) pore size distributions from the binarized images. Sample #3 for exemplary show.

Table 1.
Results from SEM measurements. IP—interparticle pore proportion; CP—clay-related pore proportion; M—mineral proportion; IPo—interparticle porosity; CPo—clay-related porosity; NP—nitrogen tested porosity; RCPo—reality clay-related porosity; EP—excessive porosity; EPP—excessive porosity proportion.
3.4. X-ray Diffraction Results
X-ray diffraction results show that quartz and feldspar are the main rock-forming minerals, and the content of clay minerals is no more than 10%. Illite and chlorite are the main clay mineral types (Table 2). The mineral types show that the samples taken belong to typical dense sandstone samples.
Table 2.
Results from XRD measurements. Il—illite; Cl—chlorite; Ka—kaolinite; Mo—montmorillonite; Q—quartz; F—feldspar; Ot—other minerals (including rock fragments, mica, and carbonate).
4. Discussion
Since the calculation method of relaxation rate cannot be unified, how to convert T2 relaxation time into corresponding pore radius is still a difficult problem in the stitching of pore size distribution [24,25]. The current stitching method is mainly based on morphology and realizes the mutual transformation between T2 relaxation time and pore radius through C-value fitting, interpolation fitting and ordinary morphology fitting. This study uses these three pore radius-stitching fitting methods to draw the pore radius distribution curves fitted by the three methods. Finally, it compares with the pore size distribution extracted from SEM images and obtains the optimal solution of pore radius stitching of dense sandstone in each applicable range based on the average standard deviation comparison method.
4.1. C Value Fitting of Capillary Pressure Curve and T2 Spectrum Curve
Since the T2 relaxation time is directly proportional to the pore radius r, the T2 spectrum distribution curve is modified by comparing and adjusting the C value, and the most appropriate C value is obtained based on the trend similarity principle, to convert the T2 relaxation time curve into the pore radius distribution curve. The specific methods are as follows.
(1) Taking the same frequency as the ordinate, the capillary pressure curve and T2 relaxation time curve are drawn in the same coordinate system. (2) Then, we adjust the C value based on the flat section of the capillary pressure curve to obtain the C value of T2 correction curve closest to capillary pressure curve (Figure 5). (3) All T2 relaxation times are converted to pore radius with the calculated C value.
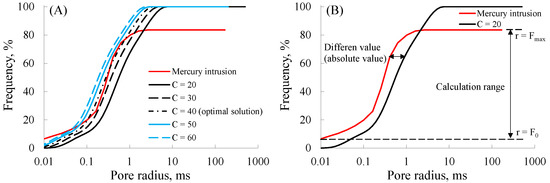
Figure 5.
Figures for (A) C-value and (B) analytical method.
4.2. Interpolation Fitting of Capillary Pressure Curve and T2 Spectrum Curve
Interpolation fitting is mainly based on the corresponding relationship between the cumulative distribution frequencies of the two curves to obtain the functional relationship between different curves with the same frequency and finally establish the corresponding relationship between T2 relaxation time and pore radius. The specific methods are as follows.
(1) The cumulative T2 relaxation time curve and cumulative capillary pressure curve are drawn on the same X-axis coordinate system. (2) Adjust the range of pore radius to ensure that the slopes of the gentle sections of the two curves are the same. (3) Select a point of T2 cumulative relaxation time in the gentle section to obtain the linear relationship between pore radius and T2 relaxation time, and select at least 10 points to obtain the functional relationship between them (Figure 6). (4) Taking the maximum mercury saturation as the constraint condition, the T2 relaxation time curve is transformed into the pore radius distribution interval curve.
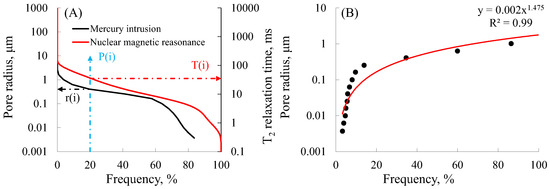
Figure 6.
Figures for (A) interpolation and (B) analytical method.
4.3. Morphological Fitting of Capillary Pressure Curve and T2 Spectrum Curve
The main principle of the morphological fitting method is the correspondence of main peaks, but this principle has one premise: the number of significant peaks is the same. If the number of significant peaks is inconsistent, it is necessary to translate the T2 relaxation time curve to ensure that the pore radius distribution curve derived based on capillary pressure is less than 0.01 μm. The proportion of pores in M is higher than that in T2 spectrum frequency (Figure 7).
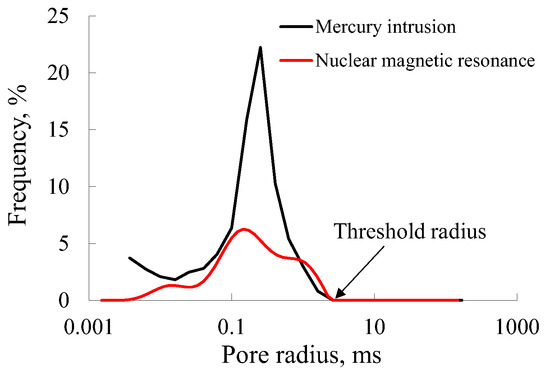
Figure 7.
Figures for morphological fitting.
4.4. Comparison of Three Fitting Methods and their Image Verification
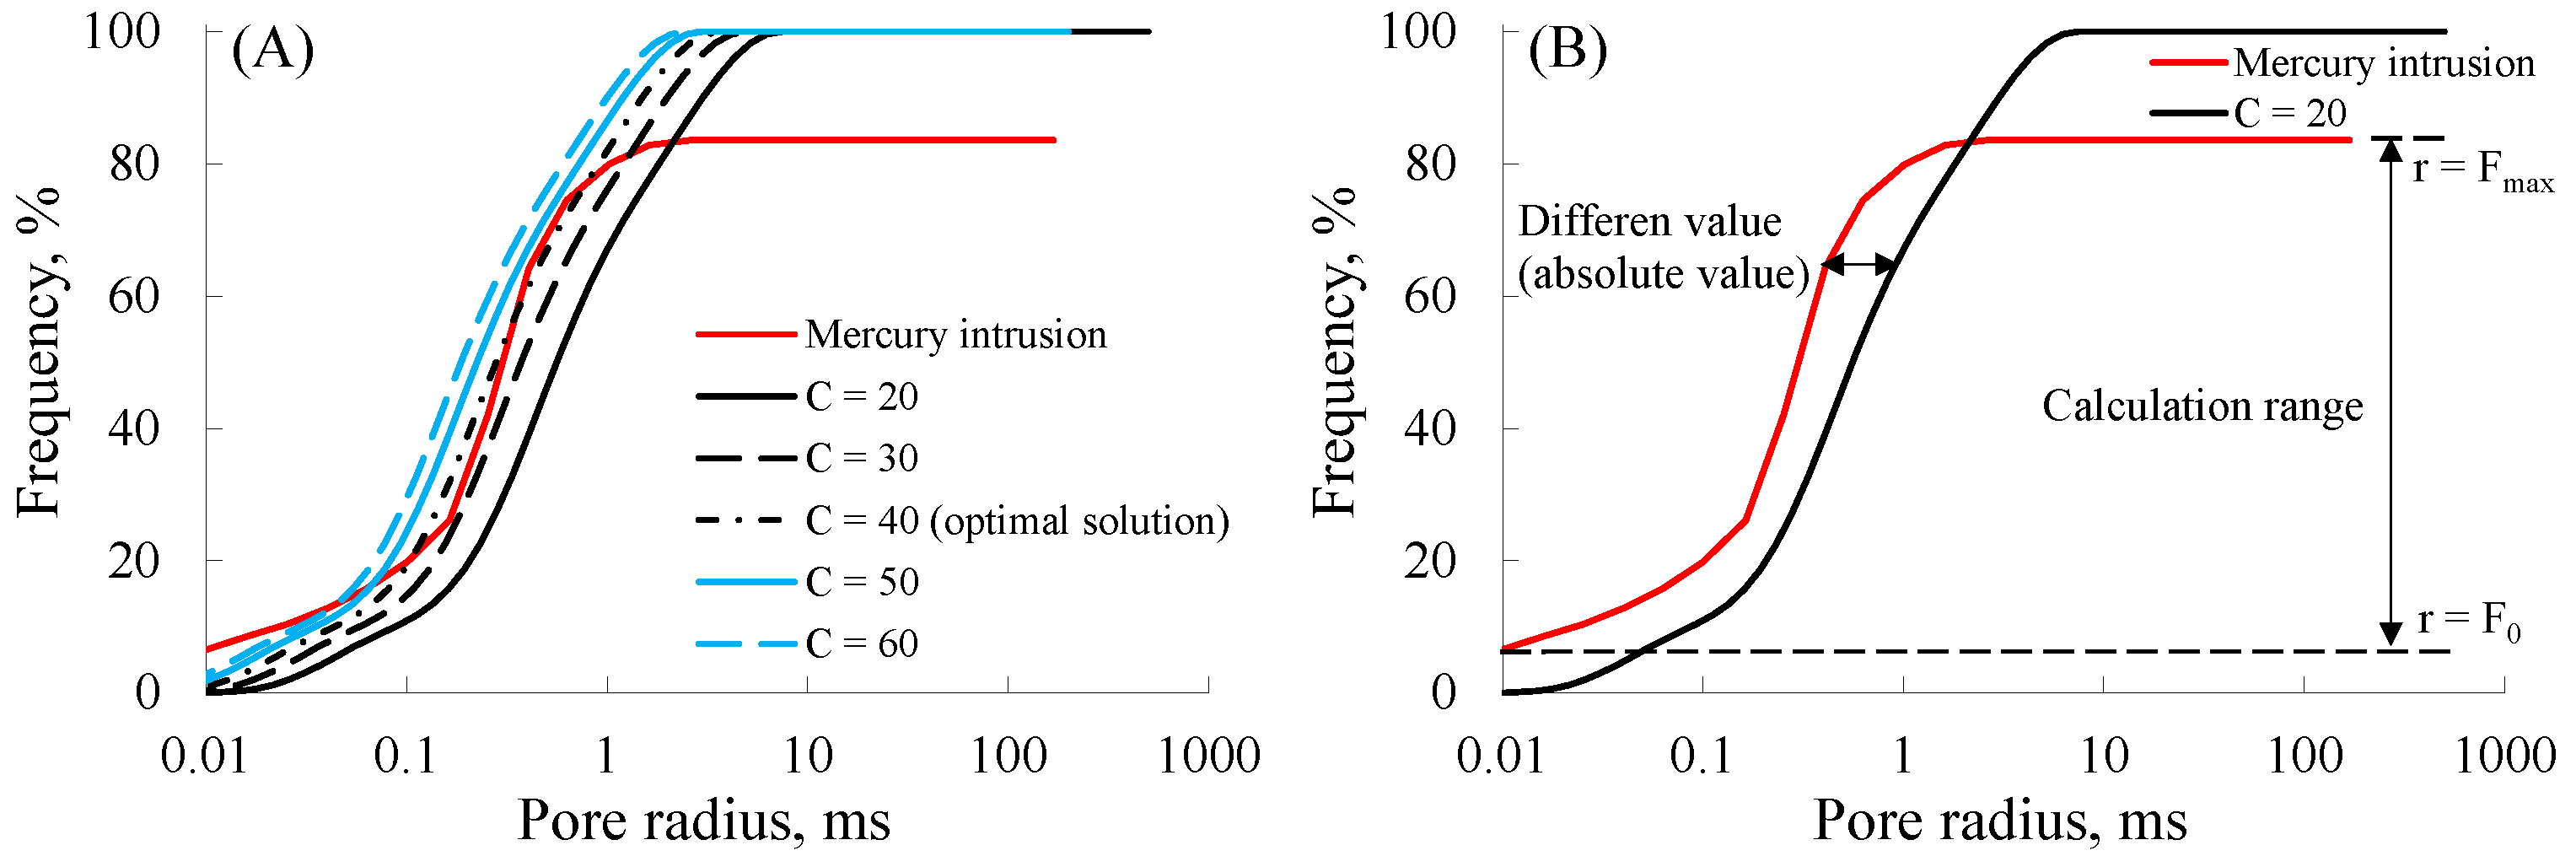
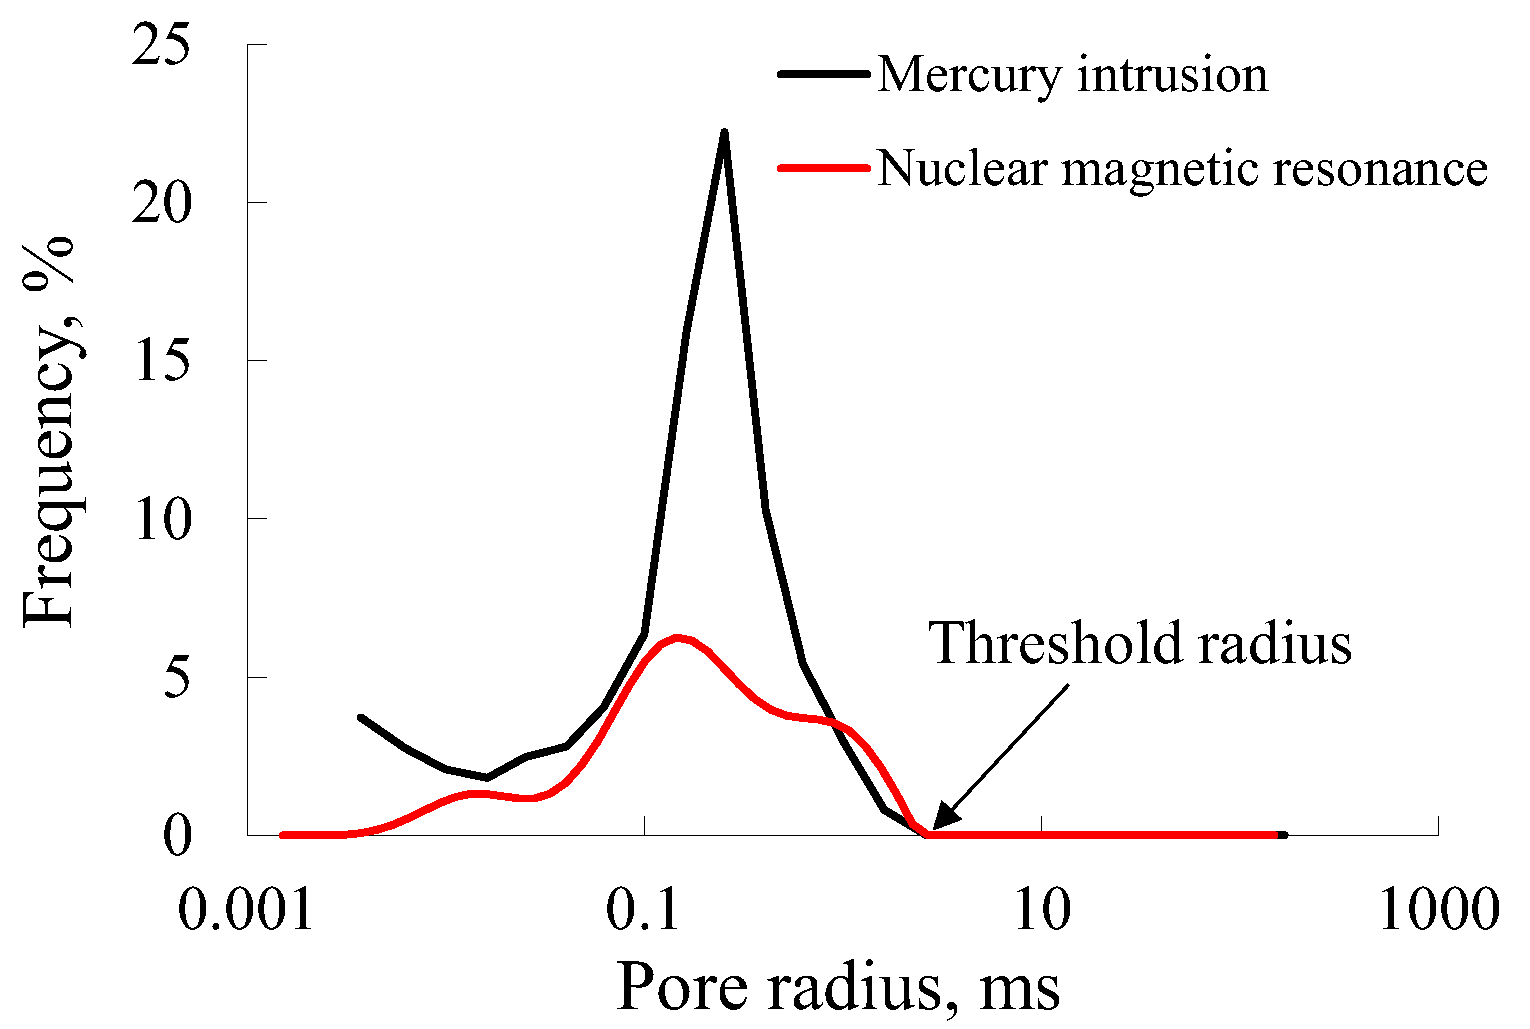
The three common fitting methods have their advantages and disadvantages: C-value fitting has high confidence in prediction, but the program is complex and the operation efficiency is low; the efficiency of the morphological fitting is high, but the confidence of prediction is questionable; and interpolation fitting is between the two, which is a confirmatory fitting method. Therefore, for fieldwork, it is necessary to evaluate the specific scene to select which fitting method is appropriate. For example, if it is necessary to carry out rapid inversion of pore distribution of nuclear magnetic logging, morphological fitting is the optimal solution. For an accurate evaluation, these three fitting methods need to be carried out at the same time and then compared with the real image to obtain the optimal solution (Figure 8A).
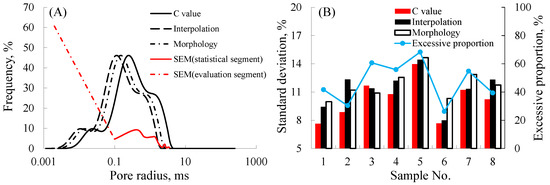
Figure 8.
(A) Pore size distributions derived from different approaches; (B) standard deviation of different methods. Sample #3 for exemplary show.
In order to carry out the verification of pore distribution interval, it is necessary to compare the similarity between the fitting curve and the SEM image inversion curve. The specific evaluation method is the standard deviation distribution frequency method; that is, in the comparison image of the non-image curve, the standard deviation of different pore radius differences and the fitting method with the smallest average standard deviation is the optimal solution. Due to the limitation of the resolution of SEM, some micro- and nano-pores cannot be identified. Therefore, for the verification work, this part of the pore space should be ignored (Figure 8A).
As shown in Figure 8B, the standard deviation of the C-value fitting method is generally low, indicating that this method is suitable for pore splicing of most dense sandstones. However, for a small number of samples (such as #3, #5), the results of morphological fitting or interpolation fitting are more in line with the actual situation. According to the distribution of excess pore ratio, it can be inferred that most micro- and nano-pores cannot be recognized directly due to the limitation of image resolution. Due to the limitation of the lower limit of NMR frequency, micro-pores cannot be reflected in the T2 spectrum. Therefore, for samples with more excess, such as sample #3, the C-value fitting cannot provide a better pore distribution range, and the standard deviation is generally high, so it is necessary to explore a new fitting and splicing mode. Therefore, we then discuss the formation mechanism of excess porosity and the correlation between the selection of the pore splicing method and mineral composition.
4.5. Study on the Formation Mechanism of Excess Porosity and Its Coupling Relationship with Mineral Composition
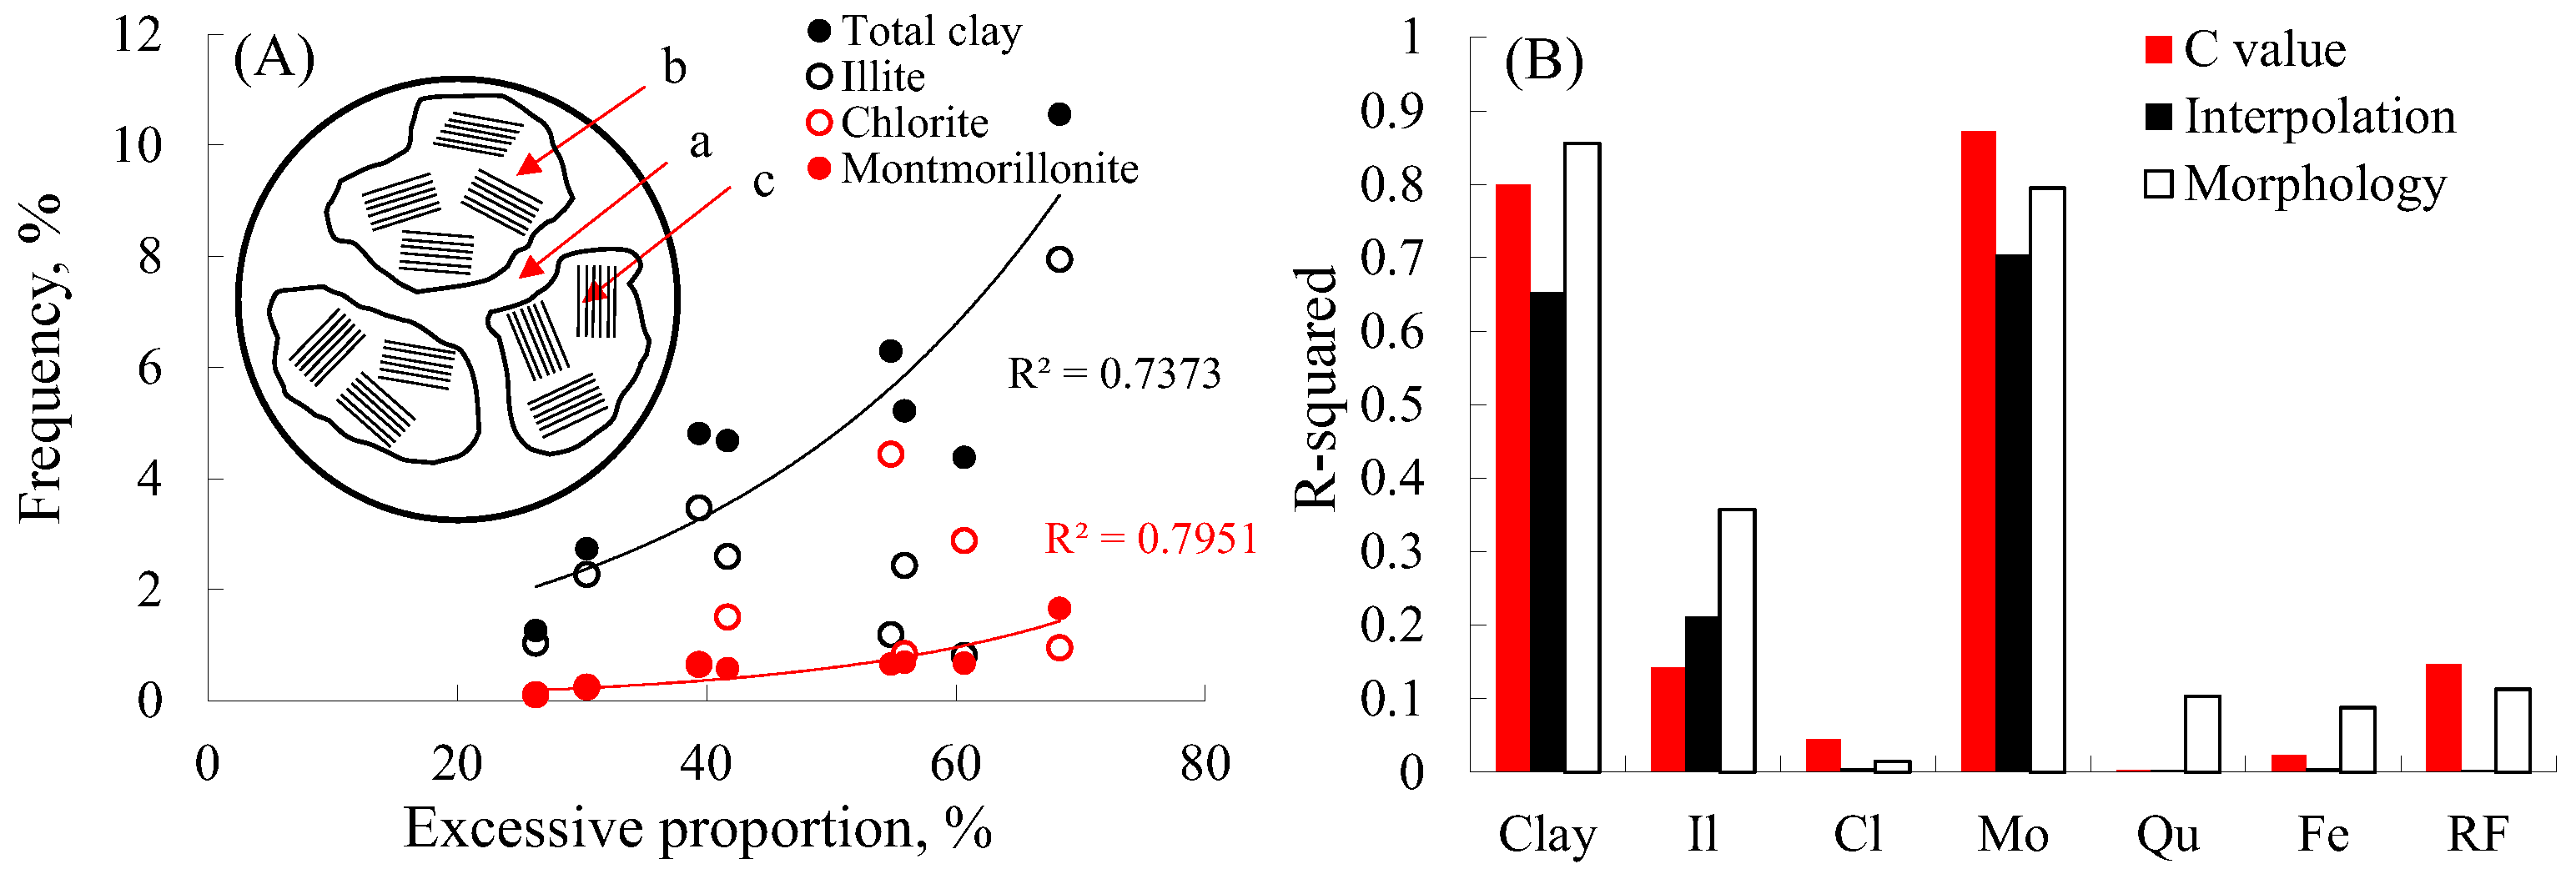
Previous studies have shown that clay minerals are rich in intergranular pores. However, after an in-depth investigation, it is found that the intergranular pores of clay minerals do not exist in the same form as intergranular pores. As shown in Figure 9A, intergranular pores of clay minerals mainly include intergranular pores (a), pores within aggregates (b), and pores of aggregate structure (c). For SEM, all the identified pores are interaggregate pores. Therefore, there is a large amount of excess porosity in the pores identified by the image method. Saltwater can penetrate the aggregate and even bridge with the aggregate through a hydrogen bond to change the morphology of clay minerals, which is also one of the mechanisms of water sensitivity (the property of reservoir pore structure and permeability flourishing and changing due to various physical or chemical interactions between the reservoir and water. We have revised the related parts). The higher the composition proportion of clay minerals, the more excess porosity, and montmorillonite with the strongest water sensitivity contributes the most to the excess porosity (Figure 9A). Therefore, the distribution interval obtained by the NMR T2 spectrum can be regarded as the overall pore size distribution space of the core. However, the T2 relaxation time needs some fitting work, and the basic work of fitting needs the cooperation of the mercury injection experiment. Therefore, the sensitivity of mercury injection experiments to mineral composition has become the key to fitting work. We compared the coupling relationship between the standard deviation of the three fitting methods and various minerals and found that the impact of clastic minerals on the fitting accuracy can be almost ignored, and clay minerals are the key factor affecting the fitting accuracy. However, montmorillonite with strong water sensitivity has a great impact on the whole, while montmorillonite accounts for a small proportion in the absolute value of mineral composition. Therefore, the fitting method can provide a more accurate spatial distribution of pore size (Figure 9B).
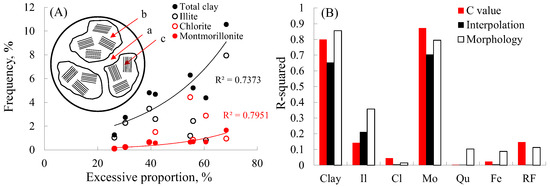
Figure 9.
(A) The relationship between clay content and excessive proportion; (B) standard deviation distributions versus different minerals.
5. Conclusions
- (1)
- C-value fitting, interpolation fitting, and shape fitting are the three main ways of pore size splicing of tight sandstone. The three methods are mainly based on the similar extension trend of the gentle section curve by different experimental methods.
- (2)
- Different fitting methods have different application ranges. The C-value fitting method has high applicability for tight sandstone with few micro-pores. Shape fitting can effectively improve the efficiency of pore splicing.
- (3)
- A large number of clay mineral micro-pores are the main contributors to the pore space of tight sandstone, and they also play a decisive role in the selection of fitting methods and the control of fitting accuracy.
Author Contributions
Conceptualization, S.Z.; methodology, D.L.; validation, C.Y. and J.S.; formal analysis, J.S.; investigation, J.S.; data curation, D.L.; writing—original draft preparation, D.L.; writing—review and editing, S.Z.; visualization, D.L.; supervision, S.Z.; project administration, C.Y.; funding acquisition, J.S. All authors have read and agreed to the published version of the manuscript.
Funding
This research was funded by National Natural Science Foundation of China, grant number 52074226 and 12072256; Shaanxi Province Key Research and Development Plan, grant number 2021JQ-029 and 2021GXLH-Z-071.
Institutional Review Board Statement
Not applicable.
Informed Consent Statement
Not applicable.
Data Availability Statement
All data are shown in the paper.
Acknowledgments
The authors appreciated Wei Wang from Northwest University in China for valuable advice.
Conflicts of Interest
The authors declare no conflict of interest.
References
- Yu, Y.; Wang, Y.; Wang, H.; Zhao, Q.; Liu, D.; Zhan, L.; Wu, J.; Lin, W.; Shi, J. Examining and applying the theory of “exploring petroleum inside source kitchens” for continental shale oil: A case study from the Kong 2 member of the Cangdong sag in the Bohai Bay Basin, China. Energy Rep. 2022, 8, 1174–1190. [Google Scholar] [CrossRef]
- Verma, A.K.; Deb, D.; Dey, A.C.; Roy, S.; Singh, A.K.; Avadhani, V.L.N.; Tiwari, R.R. Development of one dimensional geomechanical model for a tight gas reservoir. Sci. Rep. 2021, 11, 21433. [Google Scholar] [CrossRef] [PubMed]
- Qiao, J.; Zeng, J.; Feng, X.; Yang, Z.; Zhang, Y.; Feng, S. Characteristics of nano-micro pore networks and petroleum microscopic occurrence state in ultra-low permeability (tight) sandstone reservoir. J. Nanosci. Nanotechnol. 2017, 17, 6039–6050. [Google Scholar] [CrossRef]
- Yu, S.; Bo, J.; Ming, L.; Chenliang, H.; Shaochun, X. A review on pore-fractures in tectonically deformed coals. Fuel 2020, 278, 118248. [Google Scholar] [CrossRef]
- Liu, D.; Ren, D.; Du, K.; Qi, Y.; Ye, F. Impacts of mineral composition and pore structure on spontaneous imbibition in tight sandstone. J. Pet. Sci. Eng. 2021, 201, 108397. [Google Scholar] [CrossRef]
- Ren, D.; Zhou, D.; Liu, D.; Dong, F.; Ma, S.; Huang, H. Formation mechanism of the Upper Triassic Yanchang Formation tight sandstone reservoir in Ordos Basin—Take Chang 6 reservoir in Jiyuan oil field as an example. J. Pet. Sci. Eng. 2019, 178, 497–505. [Google Scholar] [CrossRef]
- Qin, Y.; Yao, S.; Xiao, H.; Cao, J.; Hu, W.; Sun, L.; Tao, K.; Liu, X. Pore structure and connectivity of tight sandstone reservoirs in petroleum basins: A review and application of new methodologies to the Late Triassic Ordos Basin, China. Mar. Pet. Geol. 2021, 129, 105084. [Google Scholar] [CrossRef]
- Xu, Z.; Zhao, P.; Wang, Z.; Ostadhassan, M.; Pan, Z. Characterization and consecutive prediction of pore structures in tight oil reservoirs. Energies 2018, 11, 2705. [Google Scholar] [CrossRef] [Green Version]
- Krzyżak, A.T.; Habina-Skrzyniarz, I.; Machowski, G.; Mazur, W. Overcoming the barriers to the exploration of nanoporous shales porosity. Microporous Mesoporous Mater. 2020, 298, 110003. [Google Scholar] [CrossRef]
- Klewiah, I.; Berawala, D.S.; Walker, H.C.A.; Andersen, P.; Nadeau, P.H. Review of experimental sorption studies of CO2 and CH4 in shales. J. Nat. Gas Sci. Eng. 2020, 73, 103045. [Google Scholar] [CrossRef]
- Wang, H.; Kou, Z.; Bagdonas, D.A.; Phillips, E.H.; Alvarado, V.; Johnson, A.C.; Jiao, Z.; McLaughlin, J.F.; Quillinan, S.A. Multiscale Petrophysical Characterization and Flow Unit Classification of the Minnelusa Eolian Sandstones. J. Hydrol. 2022, 60, 127466. [Google Scholar] [CrossRef]
- Yu, H.; Xu, H.; Fan, J.; Zhu, Y.-B.; Wang, F.; Wu, H. Transport of shale gas in microporous/nanoporous media: Molecular to pore-scale simulations. Energy Fuels 2020, 35, 911–943. [Google Scholar] [CrossRef]
- Baveye, P.C.; Otten, W.; Kravchenko, A.; Balseiro-Romero, M.; Beckers, É.; Chalhoub, M.; Darnault, C.; Eickhorst, T.; Garnier, P.; Hapca, S.; et al. Emergent properties of microbial activity in heterogeneous soil microenvironments: Different research approaches are slowly converging, yet major challenges remain. Front. Microbiol. 2018, 9, 1929. [Google Scholar] [CrossRef] [PubMed]
- Singh, A.; Das, S.; Craciun, E.-M. Effect of thermomechanical loading on an edge crack of finite length in an infinite orthotropic strip. Mech. Compos. Mater. 2019, 55, 285–296. [Google Scholar] [CrossRef]
- Sun, Z.; Li, X.; Liu, W.; Zhang, T.; He, M.; Nasrabadi, H. Molecular dynamics of methane flow behavior through realistic organic nanopores under geologic shale condition: Pore size and kerogen types. Chem. Eng. J. 2020, 398, 124341. [Google Scholar] [CrossRef]
- Cristescu, N.D.; Craciun, E.-M.; Soós, E. Mechanics of Elastic Composites; Chapman and Hall/CRC: Boca Raton, Fl, USA, 2003. [Google Scholar]
- Cui, R.; Feng, Q.; Chen, H.; Zhang, W.; Wang, S. Multiscale random pore network modeling of oil-water two-phase slip flow in shale matrix. J. Pet. Sci. Eng. 2019, 175, 46–59. [Google Scholar] [CrossRef]
- Zhang, P.; Lu, S.; Li, J. Characterization of pore size distributions of shale oil reservoirs: A case study from Dongying sag, Bohai Bay basin, China. Mar. Pet. Geol. 2019, 100, 297–308. [Google Scholar] [CrossRef]
- Zhu, X.; Pan, R.; Li, S.; Wang, H.; Zhang, X.; Ge, J.; Lu, Z. Seismic sedimentology of sand-gravel bodies on the steep slope of rift basins—A case study of the Shahejie Formation, Dongying Sag, Eastern China. Interpretation 2018, 6, SD13–SD27. [Google Scholar] [CrossRef]
- Wang, Y.; Li, M.; Pang, X.; Zhang, S.; Shi, D. Fault-fracture mesh petroleum plays in the Zhanhua Depression, Bohai Bay Basin: Part 2. Oil-source correlation and secondary migration mechanisms. Org. Geochem. 2005, 36, 203–223. [Google Scholar] [CrossRef]
- Youshu, B.; Yongshi, W.; Zheng, L.; Shouchun, Z.; Rifang, Z.; Lianbo, W. Accumulation conditions for deep light oil and condensate gas from Member 4 of Shahejie Formation in Jiyang depression. Acta Pet. Sin. 2021, 42, 1615. [Google Scholar]
- Yu, C.; Wang, S.; Zhang, Y.; Wang, J. Study on two dimensional channeling distribution of unconsolidated sandstone reservoir. Geoscience 2016, 30, 1134–1140. [Google Scholar]
- Washburn, E.W. The dynamics of capillary flow. Phys. Rev. 1921, 17, 273. [Google Scholar] [CrossRef]
- Xie, Z.; Zhang, N.; Wang, J.; Xiang, Z.; Zhang, C. Study on magnetic resonance characteristics of coal sample under progressive loads. Appl. Sci. 2020, 10, 6526. [Google Scholar] [CrossRef]
- Wang, L.; Wang, S.; Zhang, R.; Wang, C.; Xiong, Y.; Zheng, X.; Li, S.; Jin, K.; Rui, Z. Review of multi-scale and multi-physical simulation technologies for shale and tight gas reservoirs. J. Nat. Gas Sci. Eng. 2017, 37, 560–578. [Google Scholar] [CrossRef]


Publisher’s Note: MDPI stays neutral with regard to jurisdictional claims in published maps and institutional affiliations. |
© 2022 by the authors. Licensee MDPI, Basel, Switzerland. This article is an open access article distributed under the terms and conditions of the Creative Commons Attribution (CC BY) license (https://creativecommons.org/licenses/by/4.0/).