Article

Technical and Economic Assessment of Supermarket and Power Substation Waste Heat Integration into Existing District Heating Systems

Department of Energy, Power and Environmental Engineering, Faculty of Mechanical Engineering and Naval Architecture, University of Zagreb, 10000 Zagreb, Croatia
*
Author to whom correspondence should be addressed.
Energies 2022, 15(5), 1666; https://doi.org/10.3390/en15051666
Submission received: 10 January 2022 / Revised: 18 February 2022 / Accepted: 19 February 2022 / Published: 23 February 2022
(This article belongs to the Topic District Heating and Cooling Systems)

Abstract

:
District heating systems are almost always located in densely populated urban areas where various heat sources are available, such as cooling and refrigeration systems in supermarkets, shopping malls, and power transformers. These urban sources often have a large share of waste heat, which is usually emitted into the environment. This waste heat could be used to partially cover the thermal load in district heating systems. The biggest challenge for their integration is the spatial distribution of urban heat sources in relation to the existing heat network and the temporal distribution of the availability of waste heat energy throughout the year. In this paper, we have developed an economic assessment model for the integration of urban heat sources into existing district heating systems. By the hourly merit order of waste heat utilization technologies based on pinch analysis, we have defined the most suitable integration of urban heat sources into existing district heating systems. Different temperature regimes of the urban source and the existing heat network have been considered. Finally, the method was tested on the case study of a supermarket and power substation located in Zagreb, while the sensitivity analysis was carried out with a focus on various technical and economic boundary conditions.

1. Introduction

The role of district heating and cooling in the reduction of greenhouse gasses and the increase of energy efficiency has previously been emphasized by the EU [1]. These systems can produce energy in the most efficient way using large-scale cogeneration [2], providing power–heat sector coupling [3], integrating large shares of renewable energy, and even recycling thermal energy from various waste heat sources [4,5]. The potential of the last two features is heavily affected by the temperature regimes of thermal networks. The trend of temperature reduction through the years is evident. The temperatures are decreasing with each upcoming generation of district heating, reaching around 55 °C for the so-called 4th generation district heating [6]. Low-temperature networks are even commonly integrated into existing high-temperature systems as a sub-network [7]. However, during the last several years, the new generation has been defined, usually called 5th generation [8,9], which enables the higher utilization of low-temperature waste heat sources and unlocks the possibility of bidirectionality in thermal networks [10]. In other words, some customers can serve both as end-users and suppliers of the network [11]. For example, by covering their cooling demand with a thermal network, they inject thermal energy into the grid, which is then used for heating substations of other users. Their integration into the system has additional challenges as operating reliability [12] and shift from the classical pricing method currently used [13]. The role of the central supply unit is to maintain the balance between all of the final customers, while the waste heat from other sources presents a crucial matter which should be treated with care. The most important technology is central or booster heat pumps [14]. Although district heating is a common topic of research, the district cooling potential is usually left untapped [15].
There are numerous waste heat sources that can be utilized in thermal networks. The most common, and currently the most often used, are industrial waste heat sources due to their temperature levels, which are usually higher than temperature regimes in the district heating networks [16]. Papapetrou et al. [17] provided an analysis of thermal energy and temperature levels across different industries. The obtained results show that around 300 TWh/year is available on the European level, while one-third of it corresponds to temperature levels below 200 °C. These temperature levels are excellent for utilization in district heating systems or even for heat-to-power conversion processes, such as organic Rankine [18] or Kalina [19] cycles. Miró et al. [20] carried out a similar analysis and included mapping results. However, the mapping is carried out only on a national level without considering the exact location of industry sites. Yuan et al. [21] analyzed the trade-off between the integration of industrial waste heat and heat pumps in the future energy smart systems using a multi-objective optimization approach. For the Aalborg case study, they concluded that the most suitable solution is 40% of waste heat and 20% of heat pumps in district heating systems, while obtaining a carbon–neutral system with the least cost. Doračić et al. analyzed the implementation of district heating wholesale market pricing based on waste heat sources [22]. Wheatcroft et al. [23] stated that urban waste heat recovery is not well spread, and it is still an immature technology. To boost its implementation, investments should be encouraged, and a legal framework must be created. The authors also emphasized that the development of different pilot projects must be implemented to reduce the gap between potential investors and actual heat recovery projects. Nielsen et al. [24] analyzed urban heat sources in a national energy system context, while focusing on data centers, wastewater treatment plants, metros, and service sector buildings. They also refer to these sources as “unconventional” due to their low temperature levels, which require an a heat pump integration for their successful utilization in current district heating systems.
Data centers are one of the first low-temperature waste heat recovery solutions that are implemented in numerous projects. They are an excellent waste heat source due to their constant operation throughout the year. However, due to their low temperature regimes, heat pumps should be integrated for utilization in current district heating systems. Ebrahimi et al. [25] provided an overview of all the commonly available waste heat recycling technologies, while focusing on data centers. On the other hand, Huang et al. [26] focused solely on data center waste heat utilization in district heating systems and how data centers can act as prosumers in the energy system. Furthermore, the authors have provided cooling system schematics of data centers, which could be water or air based. Finally, they have suggested different heat recycling solutions depending on the cooling system. All of the solutions are based on a heat pump that uses data center waste heat as a heat source and district heating as a heat sink. Oró et al. [27] carried out a more detailed model of data center waste heat utilization in district heating systems through the scenario analysis. The authors modeled different combinations of temperature regimes and heat recovery solutions. Finally, the solutions were compared based on investment and running costs, and the payback period. Wahlroos et al. [28] presented a list of the data center waste heat utilization projects in Nordic countries. Finland has been shown as a promising country since they have the highest number of these projects. Furthermore, they listed barriers to the expansion of waste heat utilization projects. Barriers are usually non-technical and related to the economic feasibility of these projects for data center operators, while existing business models are scarcely transparent. Khosravi et al. [29] analyzed the integration of waste data center 5G smart poles to low-temperature district heating. The case study is in Finland. The obtained results have shown that the levelized cost of energy is 31–35 EUR/MWh, depending on the source of electricity. On-site electricity production through solar photovoltaic panels provides a 10% lower levelized cost of heat.
Supermarkets have also been recognized as excellent sources of waste heat. The constant refrigeration load for frozen food products and cold beverages represents waste heat, which is usually emitted into the ambient air. Furthermore, the temperature of this waste heat is usually relatively high, more than 50 °C. Therefore, it causes supermarkets to be great urban waste heat sources, which could be integrated into district heating systems. Giunta and Sawalha [30] carried out a techno-economic analysis of economic profitability by considering various parameters, such as heating demand, price ratios, and temperature levels of the district heating network. Mateu-Royo et al. [31] carried out a similar analysis of integrating supermarket waste heat into district heating, through the heat pump. However, the authors focused on industrial consumers and the operation of high temperature heat pumps. In other words, district heating has been used as a heat sink (at the supermarket location) and as a heat source (at the industrial customer location). Arnaudo et al. [32] analyzed the integration of supermarket waste heat with geothermal energy storage. They obtained the techno-economic and environmental impact of a control strategy. The scenarios were developed for a district in Stockholm. Gross et al. [33] studied supermarkets as prosumers in low and ultra-low temperature district heating networks. They modeled the district heating network using the graph theory. It has been shown that the implementation of prosumers greatly reduces demand from a central heat source. A crucial issue that should be considered during the analysis of supermarket waste heat utilization in district heating systems is the on-site recuperation of waste heat. In some cases, supermarkets are recycling part of the waste heat for internal space heating demands. A detailed analysis of this recuperation was carried out by Maouris et al. [34]. They have shown that using integrated heating and cooling systems in the supermarkets results in 17–18% of energy and 12–13 greenhouse gasses reduction.
Power transformers are part of the electrical transmission and distribution systems that enable change in voltage levels between two electrical circuits. This process is highly efficient, reaching more than 95%. The losses represent heat that should be taken away from the power transformer, usually using oil-based cooling systems. In other words, power transformers are also waste heat sources that could be utilized in district heating systems. According to our knowledge, not many research papers have been published on this topic. Petrović et al. [35] developed a simple model in order to calculate the potential of using power transformers in Danish district heating systems. Around 50% of the total waste heat could be recoverable in district heating systems. A more detailed technical analysis was published by Trbušić et al. [36]. They performed a numerical investigation or 150 MVA 220/115 kV transformer unit, cooled by an oil-water heat exchanger. Moreover, they analyzed different waste heat recuperation schemes based on heat pumps and heat exchanger units. Furthermore, they estimated that the available waste heat capacity of a 150 MVA power transformer is around 450 kW. Gilfanov et al. [37] carried out a detailed numerical analysis of electromagnetic and thermophysical processes in the power oil-filled power transformer. They obtained the temperature and heat flux fields of the transformer and calculated the potential waste heat, which could be utilized for the heating purposes of a building. The district heating network has not been studied.
Urban rail transport systems are also a significant source of waste heat that is available for use in district heating systems. Waste heat from these systems due to the constant load is available throughout the year, while its temperature is relatively high as shown in the following studies. In [38], Nikas et al. studied an installation of a water source heat pump (WSHP) to utilize heat from wastewater in the subway system in order to support an eco-friendly heating system. The study showed not only the financial benefits, but also the energy and carbon reduction of this trial. The authors in [39] demonstrated that the performance of a typical air source heat pump (ASHP), exploiting a stable air temperature within a subway environment is high, even during the peak heating months.
Another notable waste heat source in densely populated areas is different urban water networks. For example, Guo et al. [40] analyzed the urban water network potential for heating and cooling in thermal networks. The analysis was carried out on the case study of Paris. Somogyi et al. [41] focused on wastewater treatment plants as a waste heat source in urban areas. They have calculated the potential for district heating networks in Hungary. The obtained aspatial results have shown that systems under a 14,000. population equivalent are not possible. The major issues include the distance from existing district heating networks, expenditures for heat pumps, and the required pipelines. Finally, Nagpal et al. [42] carried out a detailed review of using wastewater on different scales within sewer systems in the component, building, sewer network or wastewater treatment plant level. They have considered various technical, economic, and environmental aspects, while focusing on attributes, such as temperature and flow dynamics of the sewer system.
According to the literature carried out, we have noticed that many papers do not consider a detailed analysis of waste heat sources, thus neglecting the hourly variations of thermal load and temperature levels throughout the year. Furthermore, some authors neglect the importance of different temperature regimes in the district heating network and do not investigate the minimum temperature difference between a waste heat source and thermal network using pinch analysis. Although all of the papers consider heat pumps and heat exchangers as heat recycling technologies, some authors do not consider cascading utilization. Finally, we have not found a paper that considers the optimization of the connection pipe between the waste heat source and thermal network. Therefore, we have defined the scientific contribution of this paper as follows:
  • Development of the detailed hourly model based on the pinch analysis for different waste heat sources: Supermarkets and power transformers.
  • Optimization of waste heat connection to the district heating network by considering different connection pipe diameters and the calculation of system cost in correlation to the distance between the waste heat source and district heating network.
  • Cost analysis of optimal connection and comparison of waste heat sources with respect to temperature regimes in the network.
The paper is organized as follows. Section 2 presents the method based on hourly modeling of waste heat sources and pinch analysis. Section 3 demonstrates the input data used for a case study, while Section 4 demonstrates the obtained results and discusses the main findings. Finally, Section 4 concludes the paper.

2. Materials and Methods

An overview of the method is shown in Figure 1. The overall procedure can be divided into several steps. First, a waste heat source is modeled using various input data obtained in the literature and the available databases. In this step, the available heat and temperature regimes of the waste heat source are obtained. This information serves as input data for pinch analysis, which enables the calculation of actually utilized heat through the heat exchanger and heat pump. This process is repeated for different DH network connection capacities to define the optimal one. Finally, economic analysis is carried out and the results are compared.
The time variable approach is presented in the next sub-section.
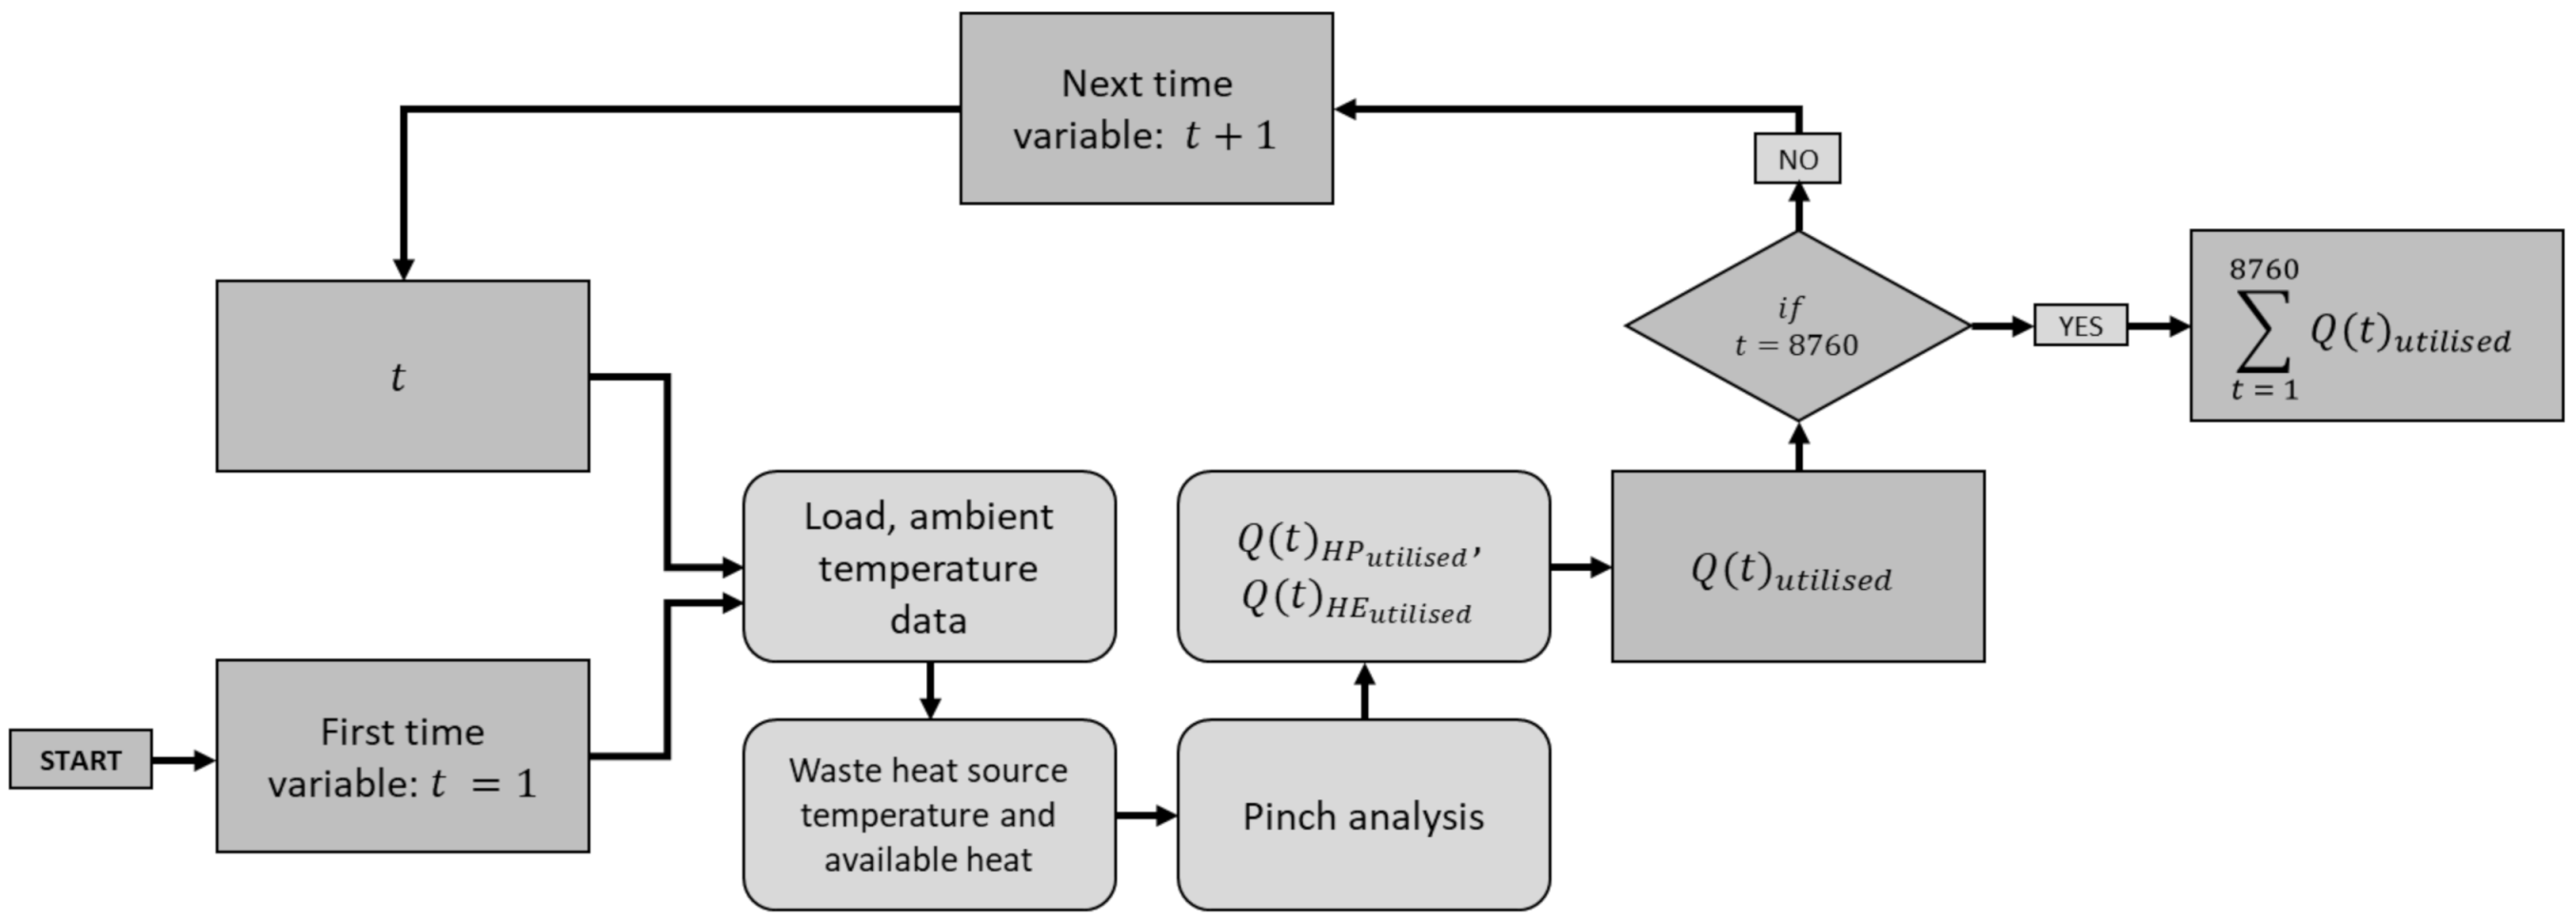
The time variable is considered as shown in Figure 2. The analysis and calculation were conducted for over 1 year with a time step of 1 h. Therefore, 8760 time steps were considered, which represents the number of hours in 1 year. For the time variable in the first step, the first hour in a year is associated with input data, i.e., load and ambient temperature in the first hour. The model uses input data to calculate utilised heat, Q ( t ) u t i l i s e d , using pinch analysis and considering the waste heat source temperature and available waste heat. Utilised heat is the sum of the heat utilised with HP, Q ( t ) H P u t i l i s e d , and heat utilised with HE, Q ( t ) H E u t i l i s e d . The following time variable for calculating utilised heat is obtained by adding the time step on a previous time variable. With a new time variable, the calculation is repeated. The calculation is repeated until the time variable reaches a value of 8760 h. Finally, all of the calculated amounts of utilised heat are added to obtain the amount of utilised heat in 1 year. The amount of utilised heat is necessary for further calculation, i.e., sensitivity and techno-economic analysis.

2.1. Time Variable Approach

This time variable approach allows for the knowledge of conditions of heat exchange, such as load, ambient temperature, waste heat source temperature, and available heat, at any time of the year.

2.2. Supermarket Refrigeration

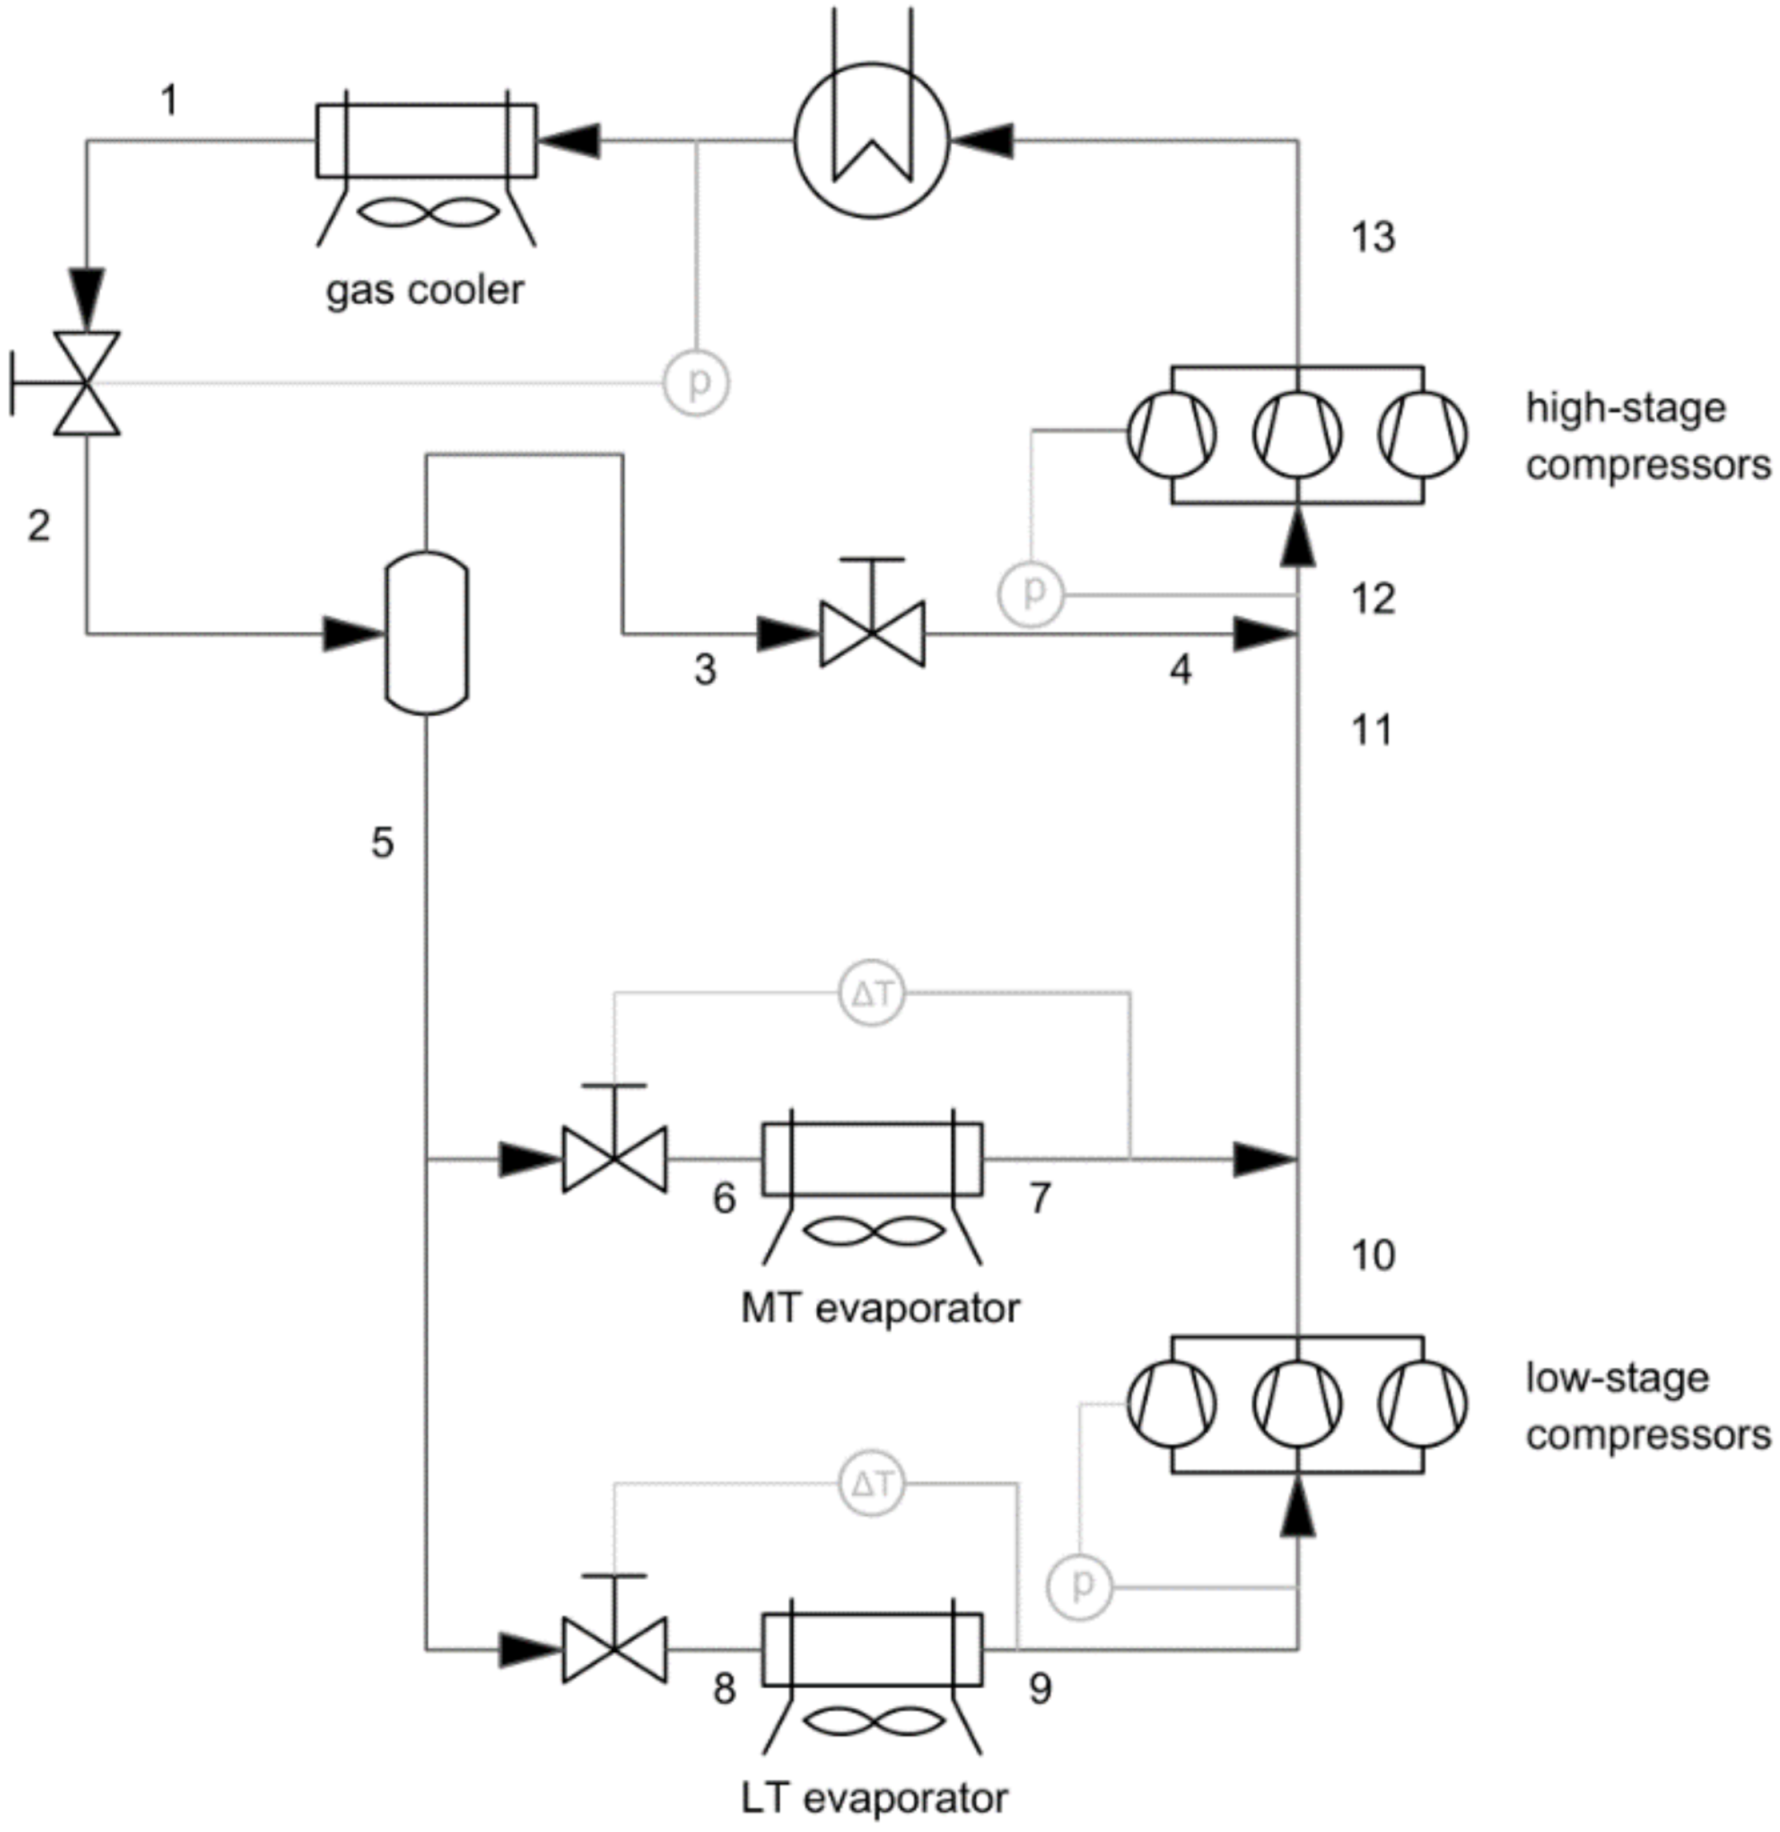
The main source of waste heat in supermarkets originates from refrigeration cycles. In the EU, refrigeration systems are usually based on the transcritical CO2 (R744) thermodynamic cycle. For this paper, we have developed a model for the reference refrigeration system, which is shown in Figure 3. The main system components are low-temperature and mid-temperature evaporators, i.e., refrigeration and cooling cabinets, low-stage and high-stage compressors, gas cooler, receiver, and expansion valves. Gas coolers are used for waste heat rejection into the atmosphere, usually using ambient air heat exchangers. This is also a location where heat recuperation can take place, as shown in Figure 3.
As previously mentioned, a supermarket refrigeration system usually has two temperature levels. The first is for chilled food on the temperature levels and the second is for frozen food [43]. To secure food safety standards, the temperature of CO2 evaporation for low-temperature cabinets is between −40 and −30 °C and for mid-temperature cabinets is between −15 and −5 °C. In this paper, we have used an evaporation temperature of −30 and −5 °C for LT. The assumed refrigeration loads are 20 kW for low-temperature evaporators and 120 kW for mid-temperature evaporators [44]. The assumed temperature difference for superheating of CO2 (to ensure the avoidance of liquid phase in the compressor) is taken as 10 °C [45]. The receiver is an existential part for high efficiency and controlling the liquid content in evaporators.
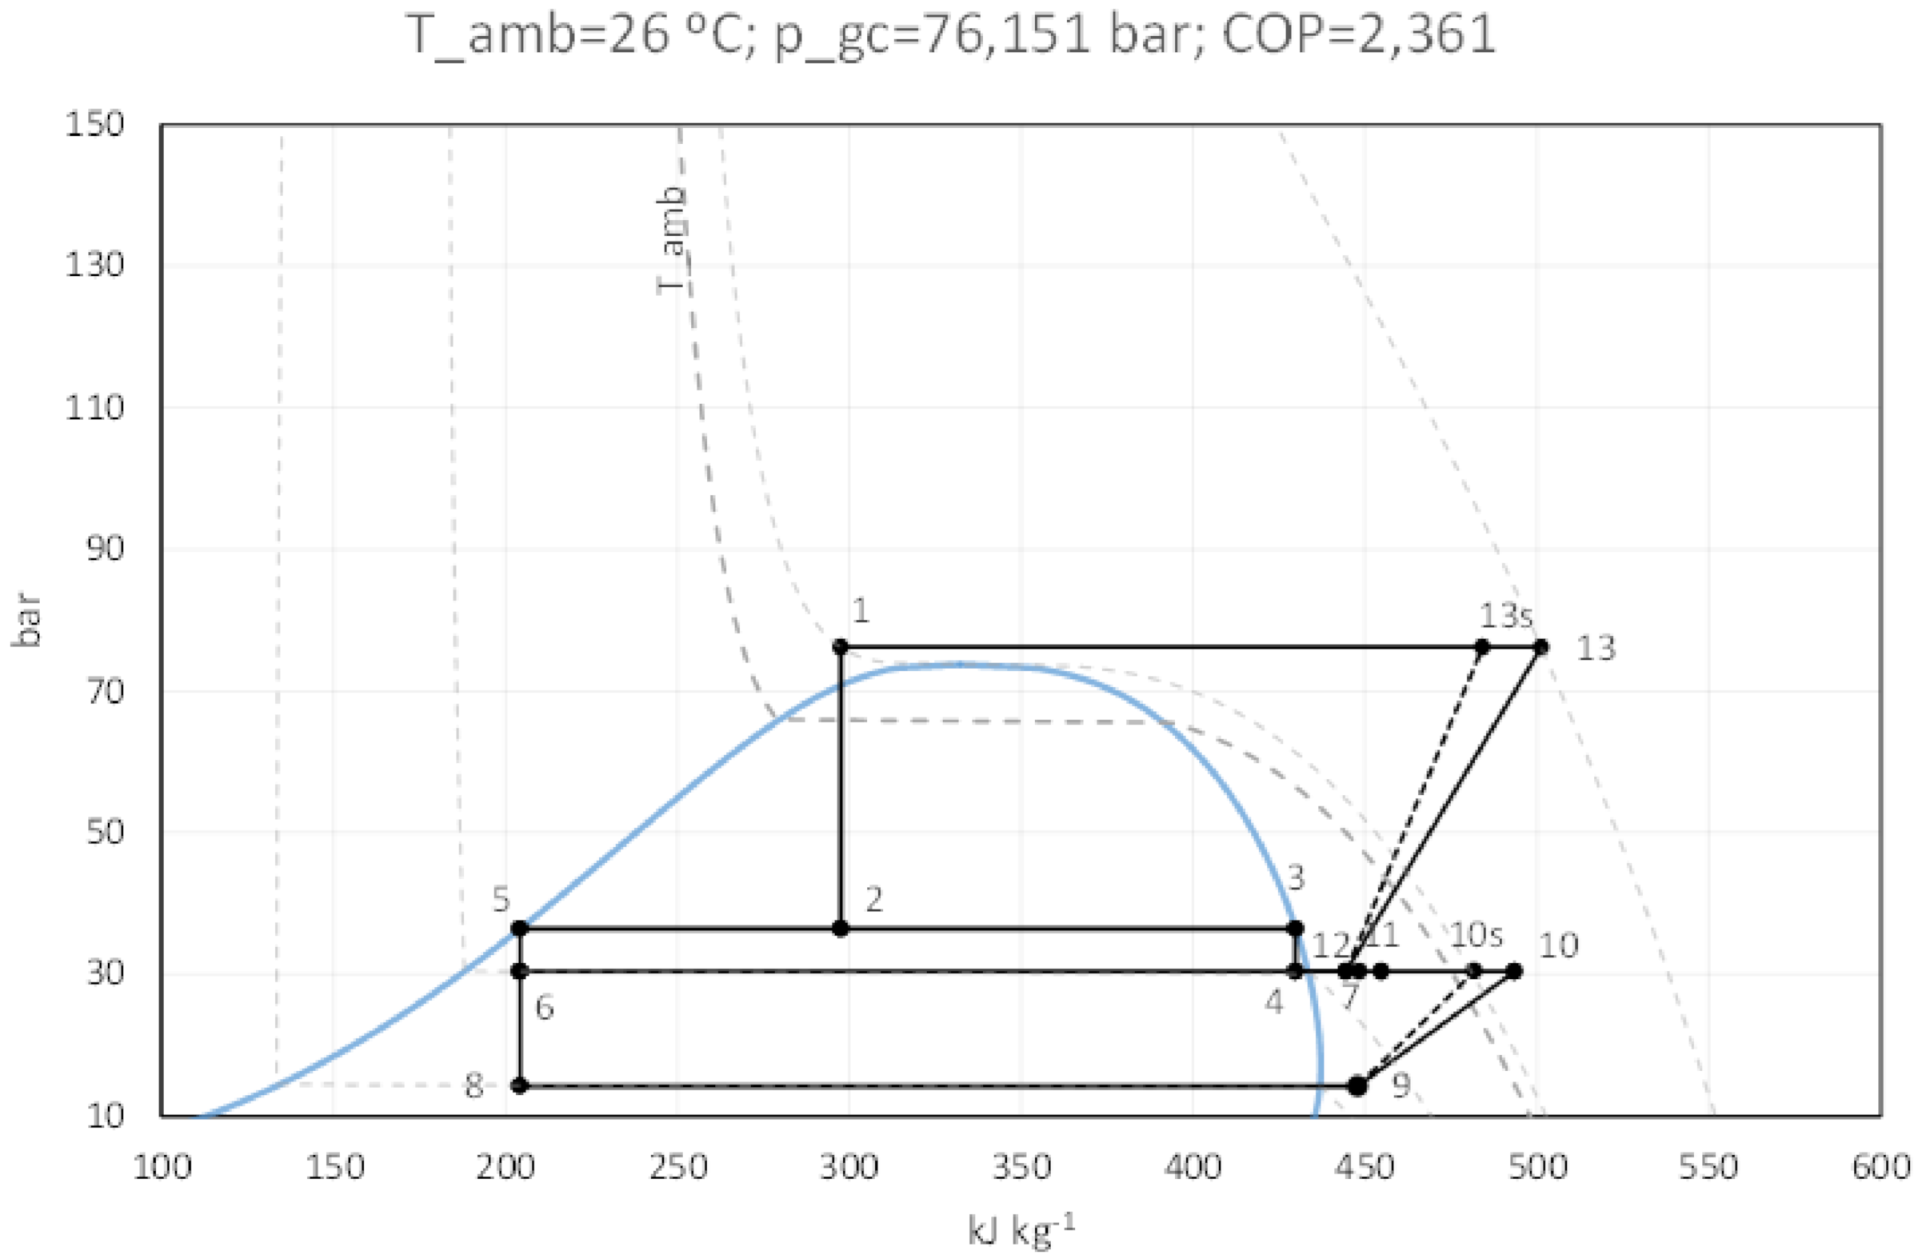
The refrigeration cycle is also represented in p–h diagram, as shown in Figure 4. The thermodynamic cycle has been modeled using CoolProp in combination with Excel VBA. The developed model was used to obtain a correlation between ambient air temperature and the following:
  • Temperature levels of waste heat source (points 1 and 13);
  • Available waste heat load (enthalpy difference between points 1 and 13);
  • Coefficient of performance (COP) of refrigeration cycle.
Of note, the discharge pressure of high stage compressors has been optimized to secure the maximum refrigeration cycle COP for different ambient air temperatures. In this case, the efficiency of compressors had to be considered. The efficiency of compressors is a function of the compressor ratio modeled using Equation (1) [46].
η   = 1003 . 0.121 p o u t p i n ,
where p i n is the pressure on the compressor inlet side, while p o u t is the pressure on the compressor outlet side. The numeric coefficients in Equation (1) are data obtained by an experimental examination by Danffos A/S.
To optimize the compressor discharge pressure, the exit temperature in the gas cooler had to be assumed as shown in Equation (2), where T 1 is the gas cooler outlet temperature and Δ T p p is the pinch point temperature difference.
T 1 = f ( T amb ) = { 20   , | T amb < 20   T amb + Δ T p p , | T amb 20   ,
Finally, heat recovery is a very common practice in CO2 refrigeration systems in order that the ratio of recovered heat for space heating is modeled by data, as shown in [31]. Heat recovery exists in the heating period, i.e., when temperatures are below 10 °C. Heat recovery could be in the range between 5% and 45% of the overall thermal loads of the refrigeration system.
The result of the model is heat source temperature (compressor discharge and gas cooler exit temperature) and amount of heat (thermal load of gas cooler reduced by recovered heat) for various ambient air temperatures.

2.3. Power Substation

Power substations, i.e., power transformers, are used to transfer electrical energy from one electrical circuit to the other. The efficiency of this process is relatively high, reaching around 98% for high-power transformers. This small loss is heat that must be dissipated to the environment and represents a potential for its recuperation in nearby district heating systems.
The model of waste heat for power substations is represented by the referent power transformer and referent power substation. The used referent power transformer is a high voltage (220/23.8 kV) with nominal power of 63 MVA. Waste heat is adopted as the total losses of the transformer in the function of load [36], as shown in Equation (3).
Q t o t ( K ) = Q 0 + K 2 Q k ,  
where Q t o t represents the total load losses, K is a relative load of the transformer, Q 0 are no-load losses, while Q k are load losses. No-load and load losses are defined for each power transformer, while relative load can be obtained from the transmission or distribution of grid operators for a specific power substation.
To convert data losses from the referent transformer to the transformer from a case study, the property of similarity electrical machinery is used as shown in Equation (4).
Q = Q ( P P ) 3 4 ,
where P ,   P is the nominal power of referent and case used transformer (kW),   and   Q ,   Q are the losses (no-load and load) of referent and case used transformer (kW).
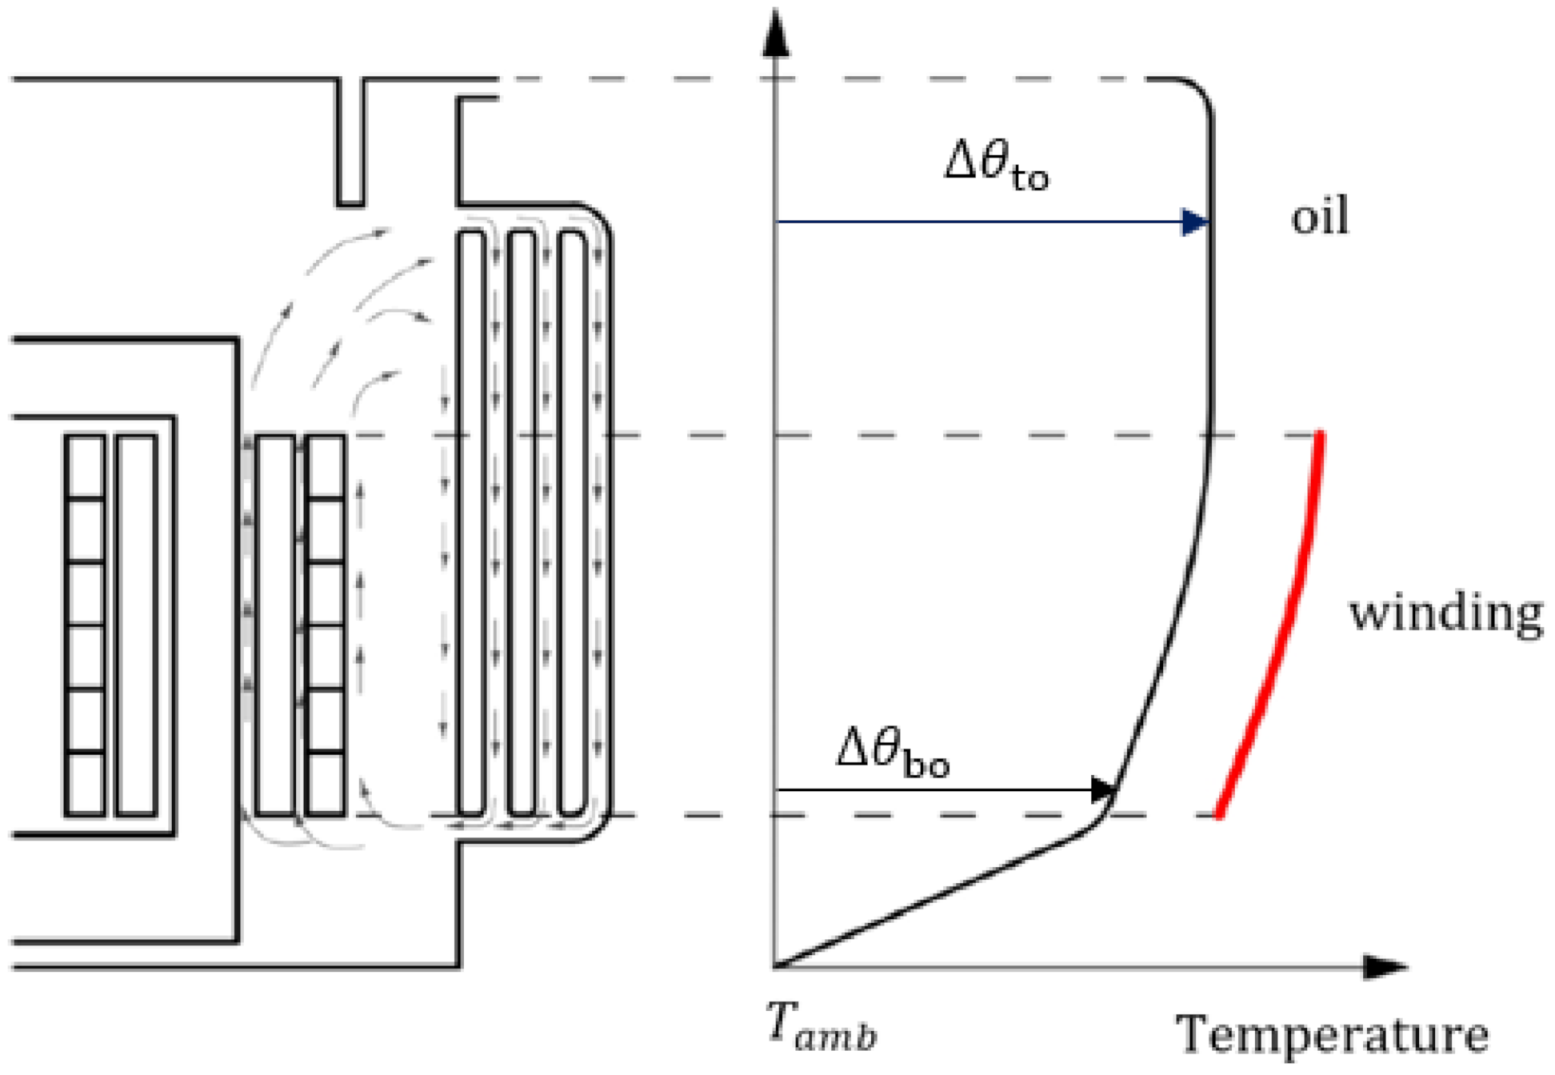
Oil-immersed transformers are most commonly used. Their main characteristic is oil temperature stratification by their height, as shown in Figure 5. The considered referent transformer is oil-natural and air-natural cooled (ONAN) with radiators. To calculate heat source temperature regimes, the thermal model from [35] is adopted. Source temperature is the sum of rise and ambient temperatures, as shown in Equations (5) and (6).
Δ θ to = Δ θ tor ( 1 + R K 2 1 + R ) χ ,
where Δ θ to is the steady-state top oil rise temperature, Δ θ tor is the rated steady-state top oil rise temperature, R is the load losses-to-core losses ratio at the rated load, K is the load, while χ is the oil exponent.
Δ θ b o = Δ θ t o ( Δ θ t o r Δ θ b o r ) ( 1 + R K 2 1 + R ) χ ,
where Δ θ bo is the steady-state bottom oil rise temperature and Δ θ bor is the rated steady-state bottom oil rise temperature. The second term on the right side of the equation Δ θ tor Δ θ bor represents the rated top-to-bottom oil temperature gradient.
The result of this model is a heat source temperature (bottom and top oil rise temperature) and amount of heat (losses in function load of the grid) in correlation with ambient air temperatures.

2.4. Pinch Method Analysis

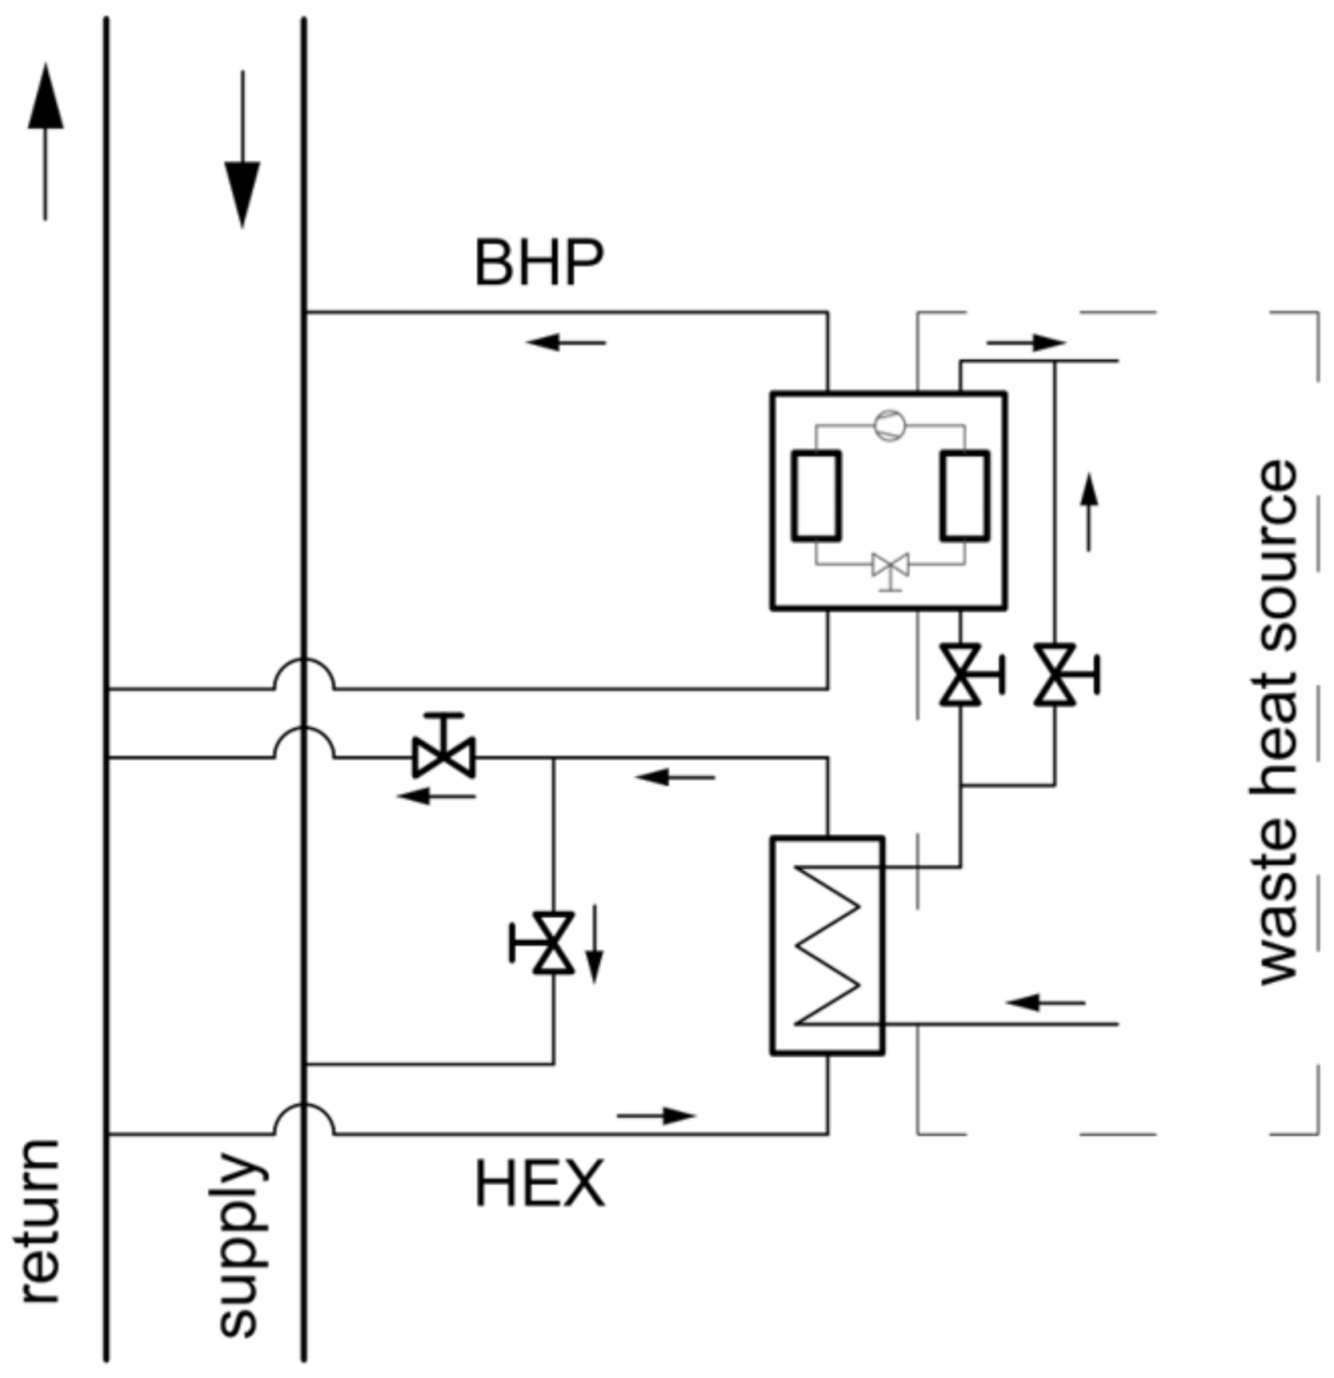
In this paper, the waste heat utilization model is developed, as shown in Figure 6. Waste heat could be injected into the district heating network through two different technologies—heat exchanger (HEX) and booster heat pump (BHP). District heating return flow is brought to the waste heat source location and is heated in the direct heat exchanger. If the temperature reaches the supply temperature, it is injected into the supply pipe of the thermal network. If the supply temperature is not reached, the flow is sent back to the return pipe to pre-heat for the central thermal supply unit, which is not analyzed in this paper. The rest of the available waste heat is utilized in the booster heat pump, which always provides the required supply temperature. Of note, the heat exchanger has a higher waste heat utilization priority than the booster heat pump. In other words, high temperature waste heat is first used in the heat exchanger, while the remaining heat (if available) is used in the booster heat pump. To calculate how much of the available heat could be used in which technology, the pinch analysis has been implemented.
Pinch analysis is visualized in T–Q, i.e., temperature–heat diagrams. Figure 7 shows all of the possible outcomes of the pinch analysis. The X-axis presents the available heat load in correlation with temperature levels (Y-axis). The dark blue line presents a waste heat source, orange is the heat utilized in heat exchanger, while green is the heat injected in the district heating network through the booster heat pump condenser.
In Figure 7A, there is no waste heat utilization since the temperature regimes of the network (dashed blue and red lines) are higher than the heat source (HS) temperature. On the other hand, part of the waste heat is utilized in the heat exchanger (HE_DH) since the temperature regimes are suitable, as shown in Figure 7B. In Figure 7C, a booster heat pump (BHP) utilizes low temperature waste heat and increases the temperature of return flow, until the required supply temperature is reached. As previously mentioned, the green line shows the T-Q diagram for the condenser of a booster heat pump. Finally, Figure 7D shows a situation where the waste heat potential is utilized both in a direct heat exchanger and booster heat pump.
The temperature regimes shown in Figure 7 are district heating network temperature regimes taken from a case study region, the City of Zagreb. The temperature regimes shown in Figure 7 are selected to show the different ways of utilizing waste heat using a heat pump and a heat exchanger. It can be seen that the temperature regimes presented in Figure 7A,B,D, where the medium temperature regime is shown, are different than in the case of Figure 7D, where the high temperature regime is shown. In [47], the different temperature regimes shown in Figure 6 are due to the temperature regimes’ dependence on the outdoor temperature.
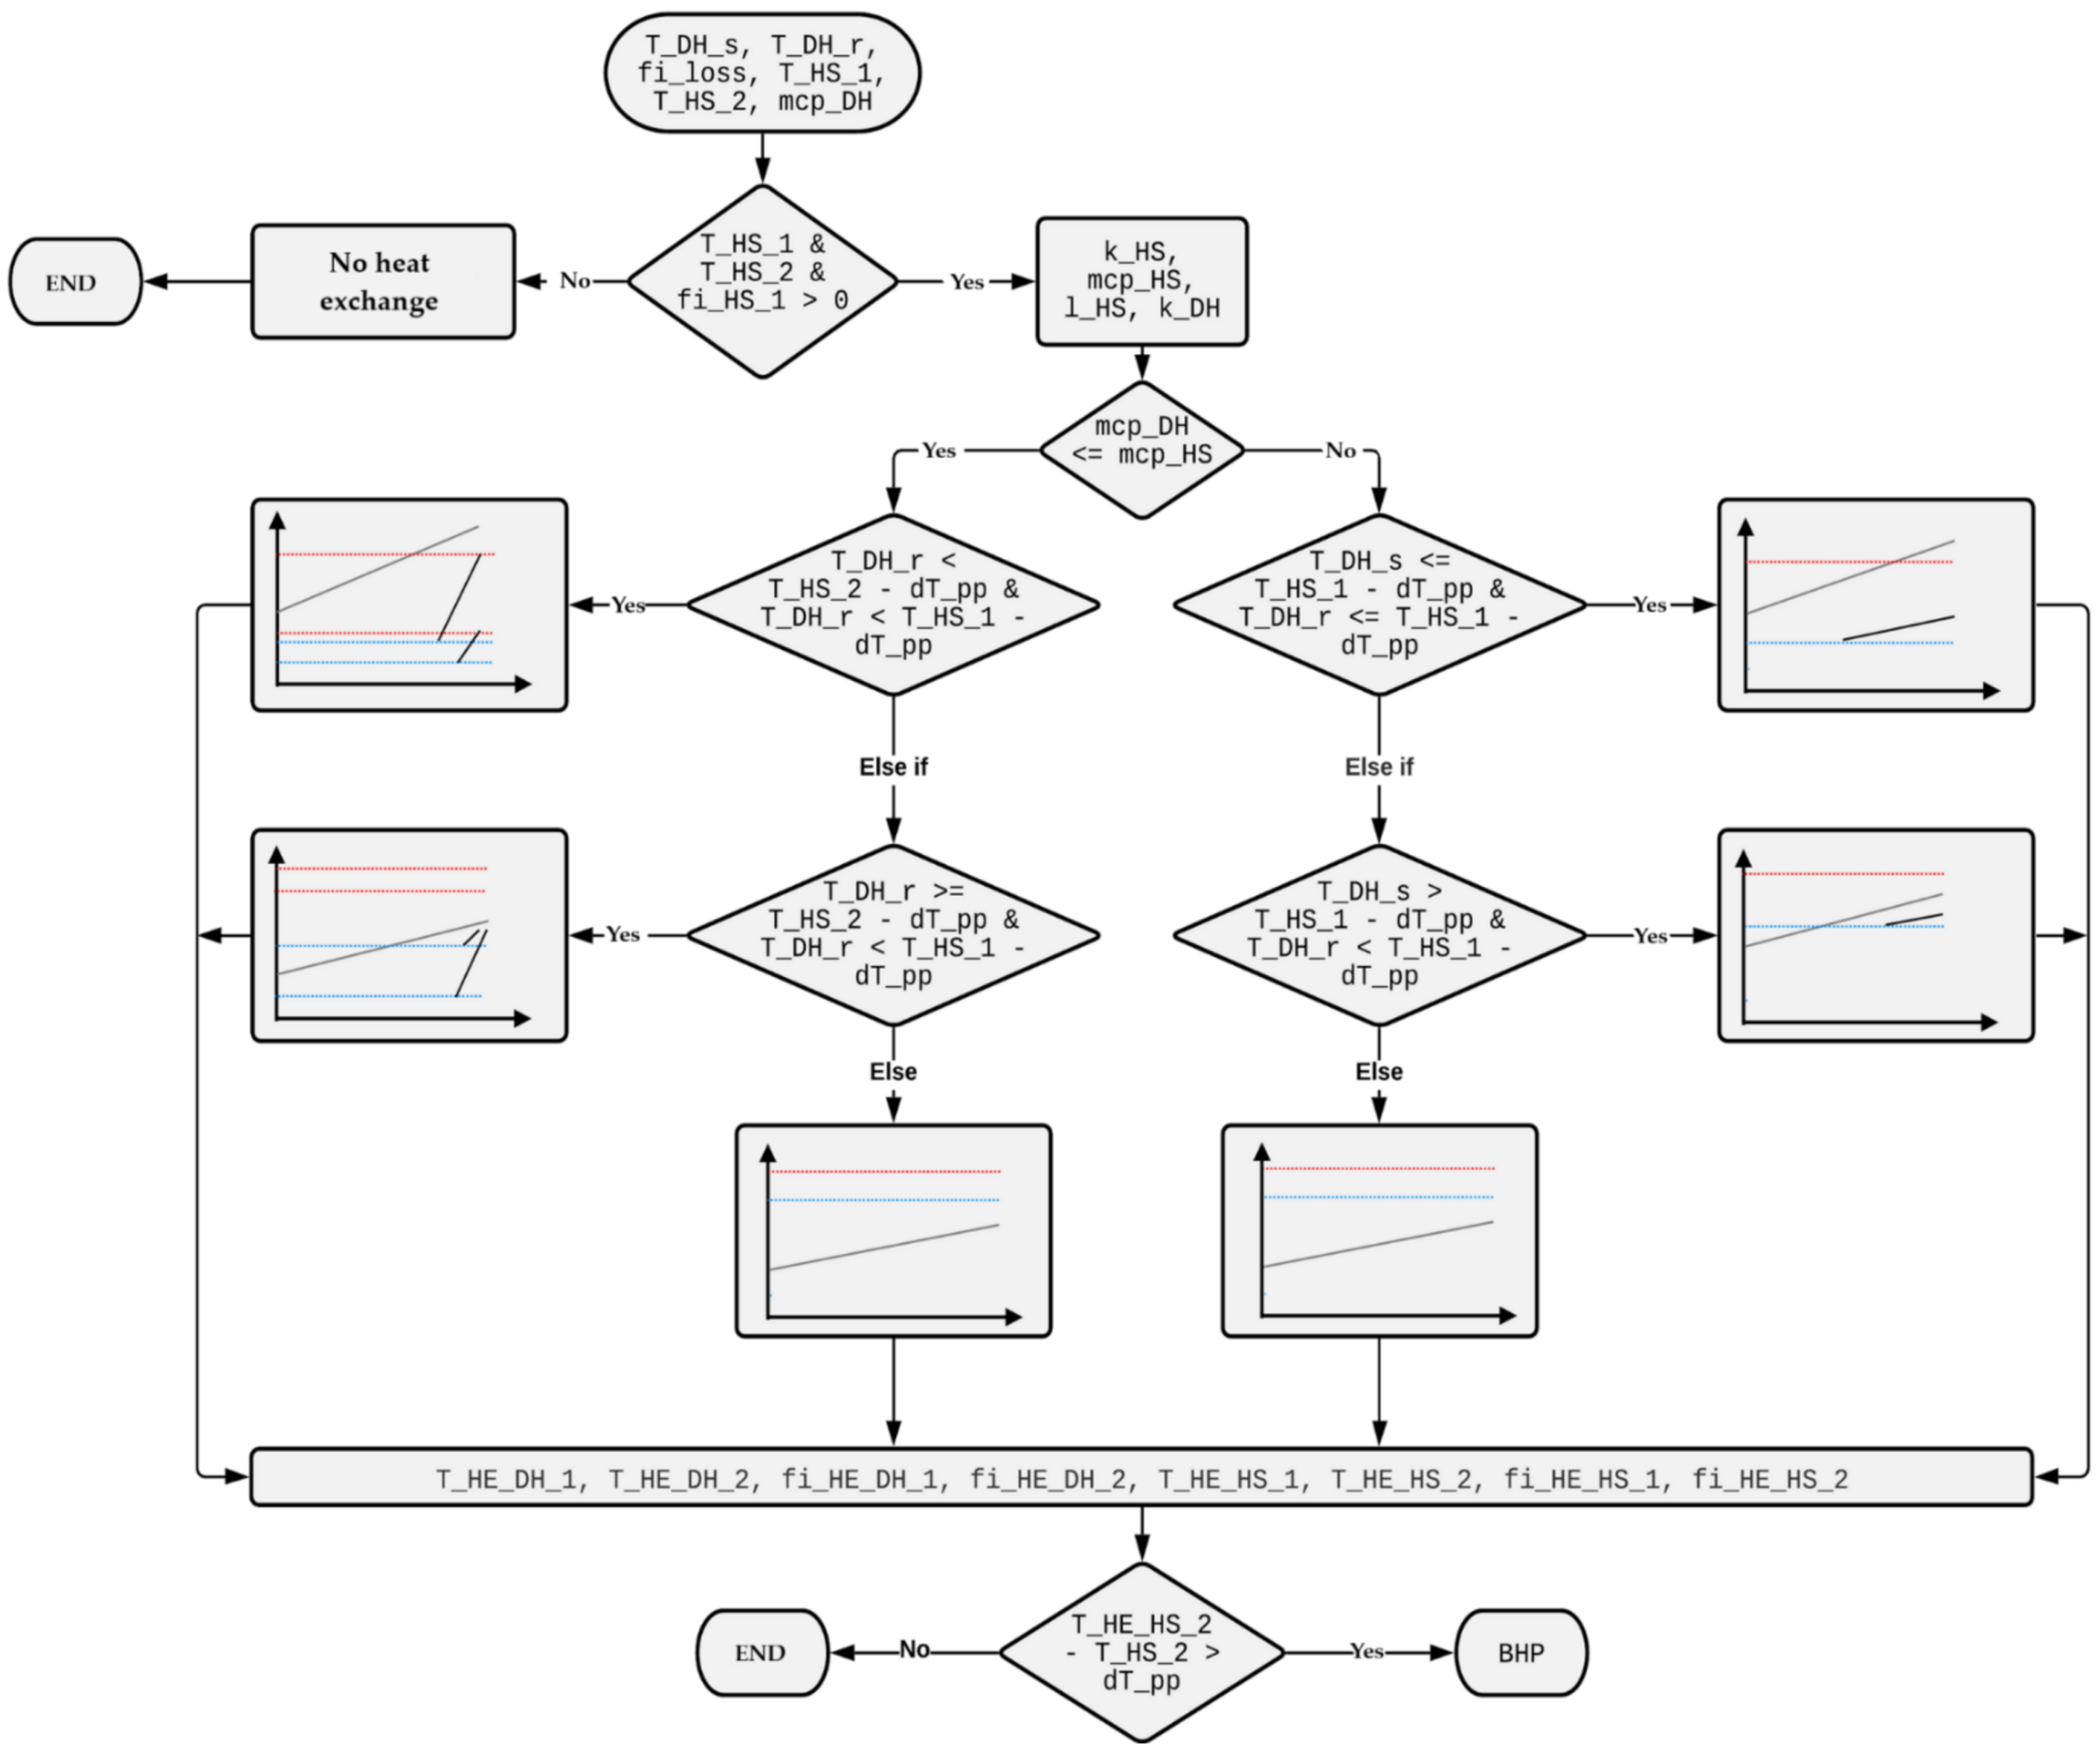
Pinch analysis has been performed using the decision-making workflow shown in Figure 8. The most important input data are the temperature regimes of district heating and waste heat source, the amount of available waste heat, and the thermal capacity of the district heating connection. The last parameter is directly correlated to the size (diameter) of the connection pipe, the larger the pipe diameter, the higher the thermal capacity of the flow entering the waste heat utilization system. Using this principle, it is possible to compare the results for various temperature regimes and to determine the optimal connection pipe diameter for each temperature regime. An explanation of the labels shown on Figure 8 is shown in Table 1.
Depending on the combination of input parameters, different results could be obtained, such as the amount of heat utilized and the temperature increase of the district heating flow.

2.5. Booster Heat Pump

In the proposed waste heat utilization system, a booster heat pump is used to boost the temperature of the district heating flow using a waste heat source. In other words, waste heat represents the heat source (evaporator), while district heating flow represents the heat sink (condenser). In this paper, the Lorenz efficiency model enables the calculation of booster heat pump COP without detailed heat pump modeling. The model is explained in detail in [48]. Equation (7) shows the general approach, where COP is the calculated COP of the booster heat pump, while COP Lor is the theoretical Lorenz COP of the heat pump. To obtain the realistic value, Lorenz efficiency η L o r is used. Lorenz COP COP Lor can be calculated using Equation (8), where T ¯ H is the mean heat sink temperature and Δ T ¯ l i f t is the mean heat sink and heat source temperature difference, sometimes called the temperature lift. Finally, T ¯ C is the mean temperature of the heating source. Visualization of all the parameters is shown in Figure 9. Of note, Lorenz efficiency η L o r is not constant, but directly correlated to the temperature lift, as shown in Equation (9) [48].
C O P = C O P Lor · η Lor
C O P Lor = T ¯ H Δ T ¯ lift = T ¯ H T ¯ H T ¯ C = Δ T H ln ( T H , o T H , i ) Δ T H ln ( T H , o T H , i ) Δ T C ln ( T C , o T C , i )
η Lor = 0.1312 ln ( Δ T ¯ l i f t ) 0.0406

2.6. Connection Pipe Diameter Analysis

As shown in Figure 1, after the calculation of utilized heat through the heat exchanger and booster heat pump, the analysis of connection pipe diameter is applied to select the optimal one.
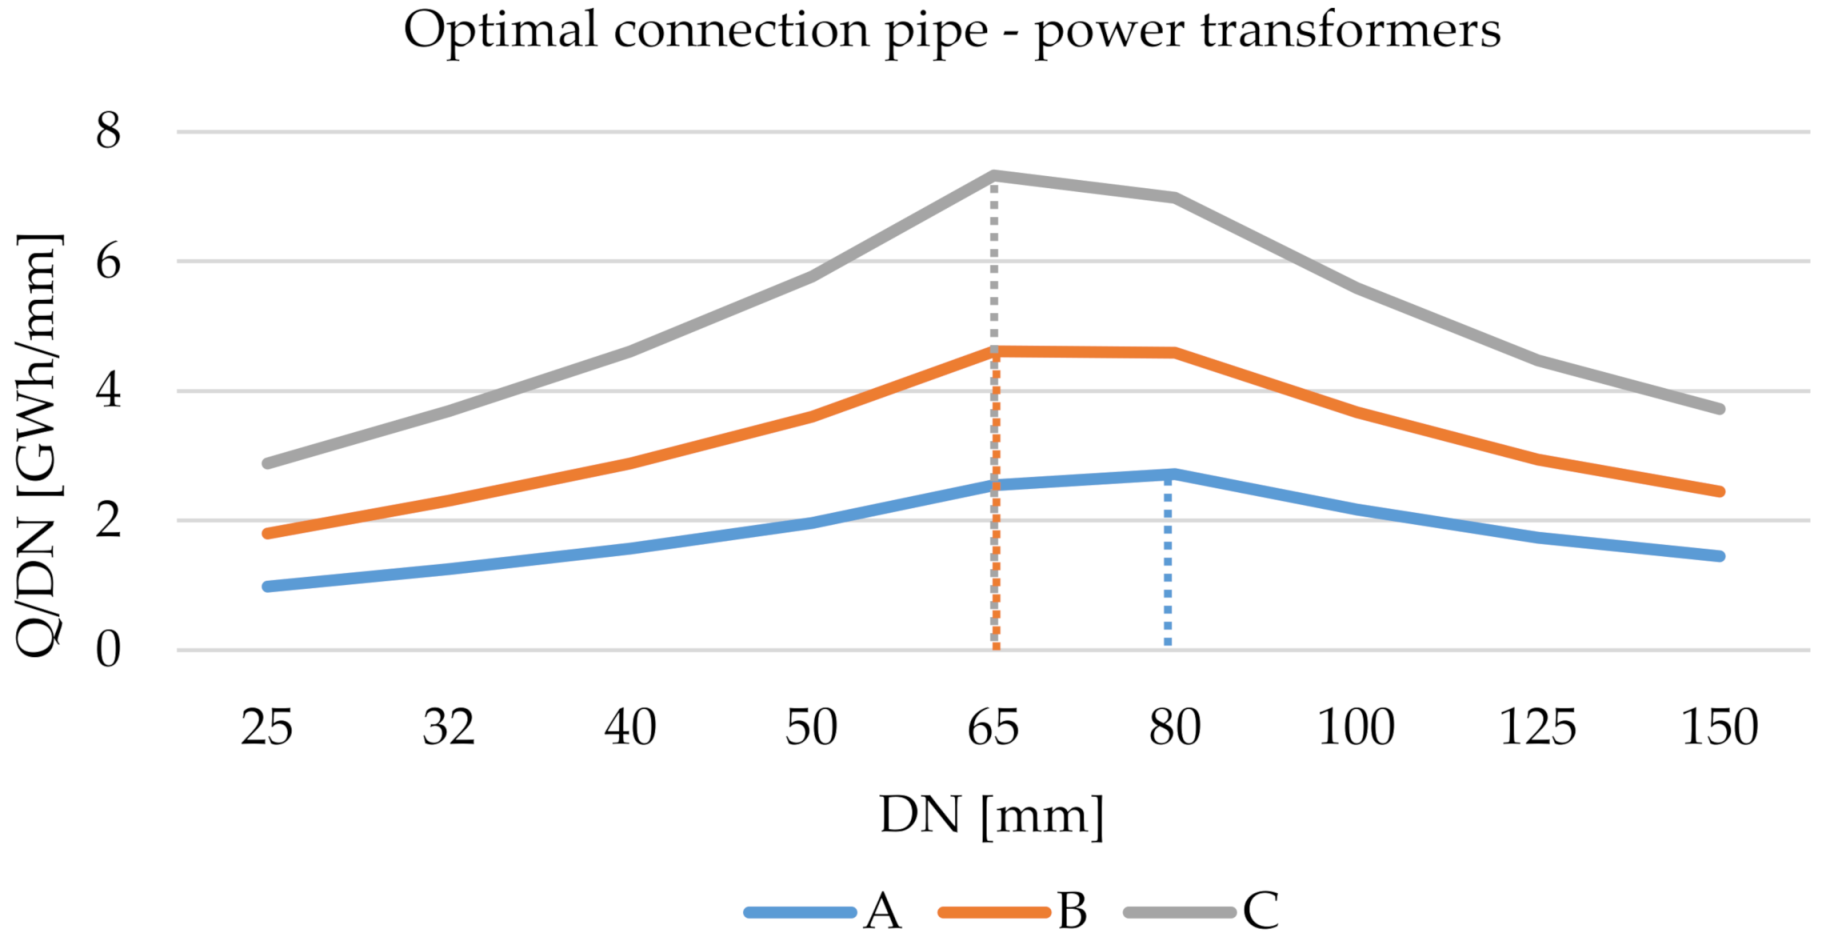
The analysis of connection capacity is carried out for the pipe’s diameter in the range from DN 25 to 150. For each diameter in the range, the yearly amount of utilized heat is calculated, as illustrated on the left diagram in Figure 10. In this diagram, the X-axis presents the pipe diameter, while the Y-axis presents the total yearly utilized waste heat. It can be seen that with the increase of connection pipe diameter, the total yearly utilized heat also increases. However, the increase of total yearly utilized heat becomes saturated with the increase of pipe diameter. In other words, for the pipe diameter D N 1 , we can utilize Q 1 amount of heat, while for the larger pipe diameter D N 2 , we can utilize more waste heat, marked as Q 2 . It is evident that Q 2 is larger than Q 1 . However, this represents the higher cost of pipe connection investment [49]. Here, we should ask ourselves whether it is optimal to significantly increase the connection pipe capacity for a small increase of utilized waste heat. In other words, which connection capacity provides the highest amount of utilized waste heat for the given connection pipe diameter. For this purpose, we propose the following approach, which is illustrated on the right diagram in Figure 10. First, we should calculate the ratio of utilized heat and pipe diameter Q / D N , as shown on the Y-axis of the mentioned diagram. This ratio implicitly presents the connection pipe investment efficiency, which is the ratio of energy obtained and the required investment (which is directly correlated to the pipe diameter).
Once we plot the Q / D N ratio with respect to the pipe diameter D N , it can be seen that the maximum value could be obtained. The optimal pipe capacity D N o p t is the one which provides the highest Q / D N ratio, called Q o p t / D N o p t . Moreover, it can be seen that Q 1 ( D N 1 ) < Q o p t ( D N o p t ) < Q 2 ( D N 2 ) . These values are illustrated on the right diagram in Figure 10.
The value of the optimal pipe diameter will be used for techno-economic analysis.

2.7. Techno-Economic Analysis

The economic feasibility of the waste heat utilization solution is measured using the levelized cost approach. The levelized cost of heat (LCOH) is defined as shown in Equation (10), where L C O H is the levelized cost of heat, C A P E X are the capital cost, O P E X are the operational expenditures, and Q DH ,   recover is the amount of heat recovered from a waste heat source and injected into the district heating network.
L C O H = C A P E X + O P E X Q DH ,   recover
C A P E X includes all of the capital costs which occur during the start of the projects, such as investment in heat exchangers, heat pumps, and district heating networks. Of note, capital costs have been discounted using the capital recovery factor C R F and predefined discount rated, as shown in Equation (11).
C A P E X = C R F · i n v = d ( 1 + d ) n ( 1 + d ) n 1 · i n v
On the other hand, O P E X is an operational cost that is paid every year and is not discounted. It consists of variable and fixed parts. The variable part includes the variable operational and maintenance (O and M) costs of equipment and electricity consumption for driving the booster heat pump compressor. The fixed part includes the fixed O and M costs of equipment.

2.8. Case Study and Input Data

The method was tested on the case study of a supermarket and power substation located in the City of Zagreb, Croatia.
The referent supermarket refrigeration system based on transcritical CO2 is modeled, according to the data presented in [50]. Table 2 shows data for the referent supermarket refrigeration system: Low- and medium-temperature refrigeration load conditions (temperature, pressure, and load). The superheating temperature difference of CO2 is equal to 10 °C to secure the operating conditions for low-stage and high-stage compressors. Using the specific electricity consumption data for supermarket refrigeration, which is available in [50], the hourly waste heat potential has been obtained.
To identify the referent power substation for the City of Zagreb, a publicly available national report [51] was used. The referent power substation data are shown in Table 3. The relative load for the transformers is taken from the national grid operator [52].
In this paper, three different temperature regimes of the district heating network have been defined: A, B, and C. Figure 11 shows all of the temperature regimes as a function of ambient temperature. The highest temperature regime is obtained in Scenario A, which is equal to 120 °C for the supply side of the DH network. The lowest temperature of supply is in Scenario C, which is equal to 70 °C. Table 4 shows the input data required for the district heating connection pipe, which is necessary for pinch analysis.
The ambient temperature for Zagreb is taken from [53] for an average meteorological year on the hourly level. As the referent period of observation is the taken period between 2007 and 2016, the precise location is 45°48’25.2” N latitude, 15°58’04.8” E longitude, and 120 m above sea level.
Finally, Table 5 shows the different input data required for techno-economic analysis.

3. Results

The obtained results are presented as follows. Section 3.1 presents the connection DH network optimization results for the supermarket refrigeration waste heat source, while Section 3.2 is focused on the power substation as a waste heat source. Both sections present the analysis for the heat exchanger and heat pump utilization technology. Section 3.3 demonstrates the techno-economic results of the obtained solutions, while Section 3.4 provides the sensitivity analysis for investment and electrical energy prices. The hourly results of waste heat utilization are shown in Section Appendix A.

3.1. Supermarket Refrigeration

As previously explained in Section 2, the size optimization of the connection pipe between the DH network and heat source is carried out using the serial hourly merit order analysis for different DN pipe diameters, ranging from DN 25 to 150.
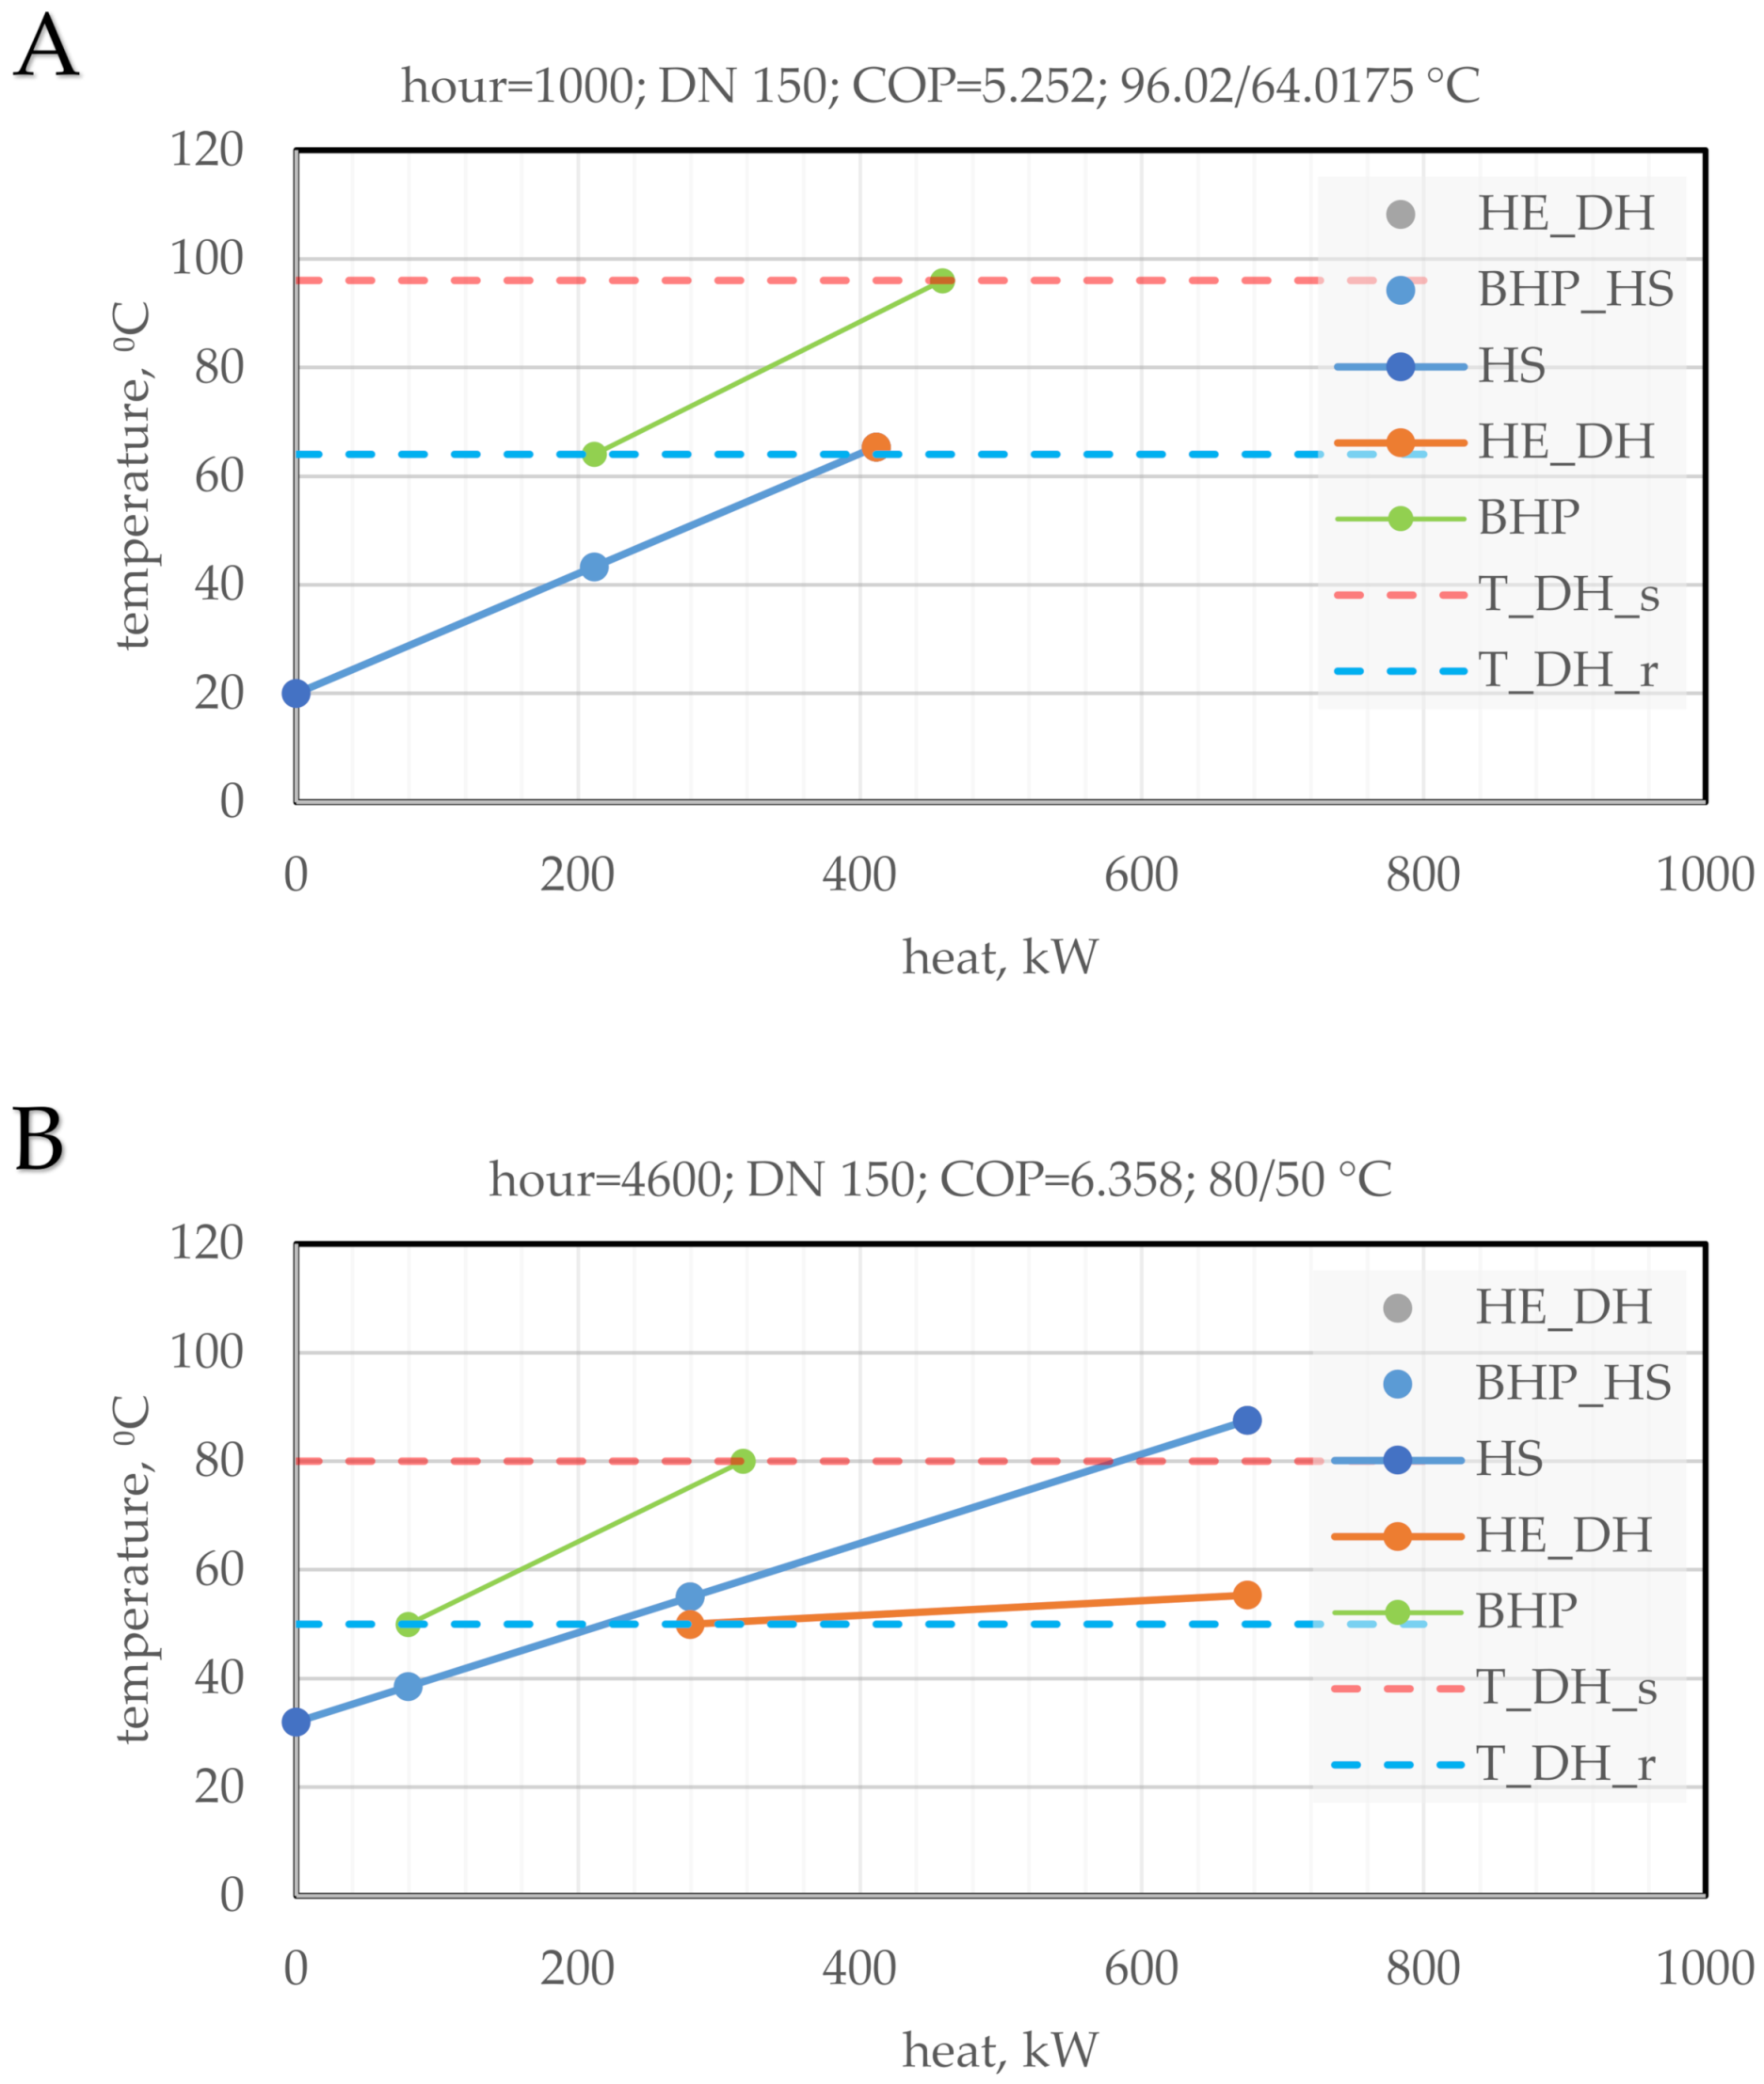
Figure 12 shows the pinch analysis for the supermarket refrigeration system—Scenario A if the connection pipe diameter is DN 150. Figure 12A shows the waste heat utilization for the winter period (h = 1000, month: February). It can be seen that the heat source temperature level is lower than the temperature regime of DH. In the case of Figure 12A, BHP is used for heat utilization. Figure 12B shows the utilization for the summer period (h = 4600, month: July). Compared with Figure 12A, it can be seen that the temperature regime during the summer period is lower than in the winter period due to the higher ambient temperature (see Figure 11). The temperature level of the heat source in Figure 12B is higher than the temperature regime of DH. In the case of Figure 12B, waste heat utilization is possible with BHP or HEX.
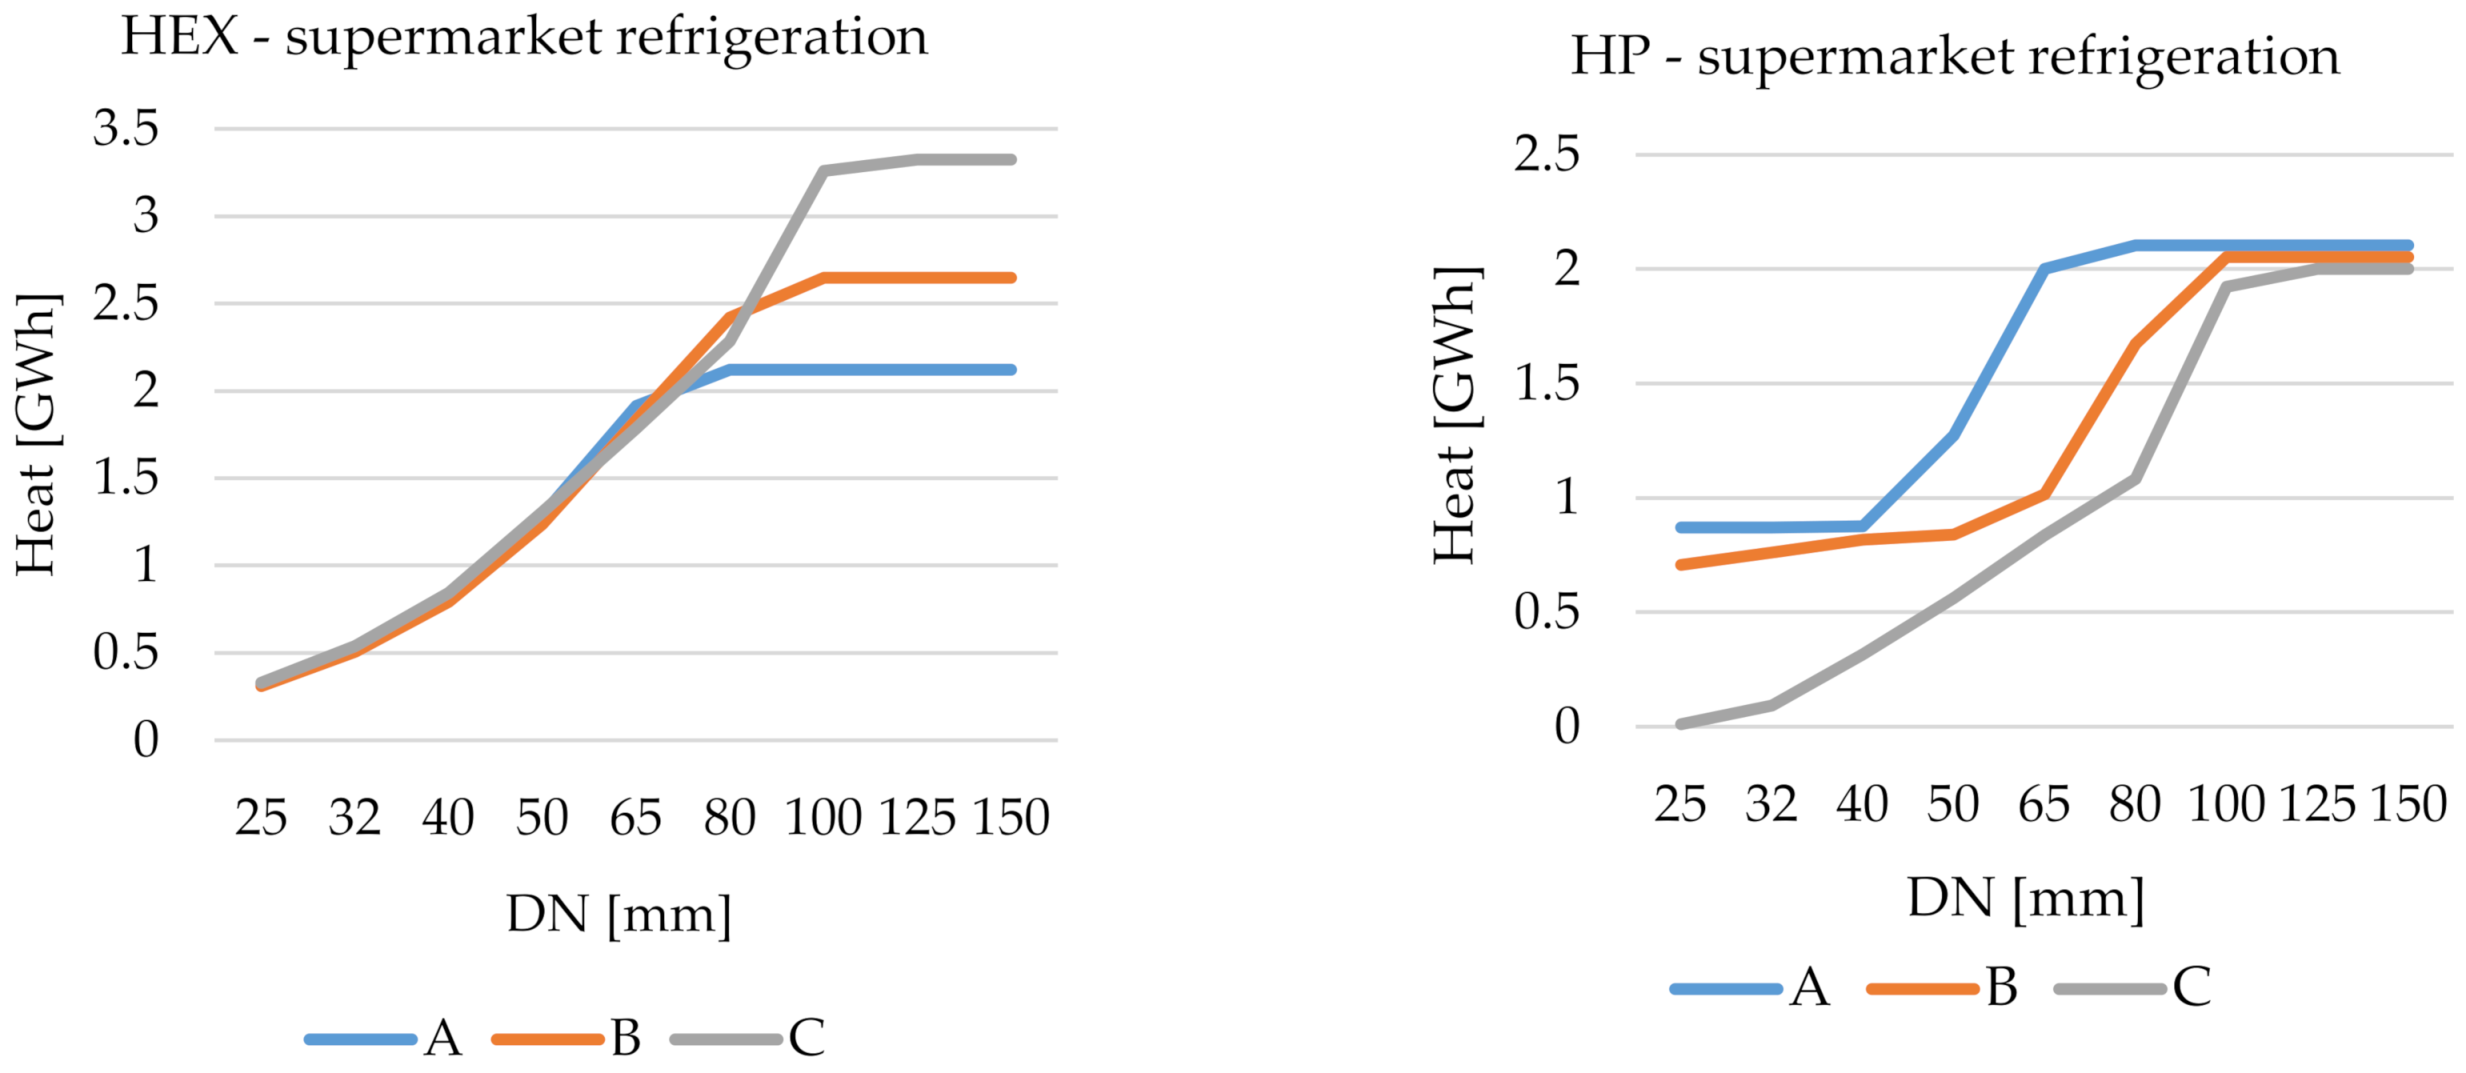
Figure 13 presents the amount of thermal energy injected into the grid from the supermarket waste heat source for different connection pipe sizes and DH network temperature regimes. The left diagram demonstrates the yearly thermal energy utilized through the heat exchanger. The right diagram demonstrates the thermal energy injected into the DH network using a heat pump. In other words, it presents the thermal energy released into the thermal network (sink) from the heat pump’s condenser. As expected, the increase of connection pipe size allows for the higher amount of thermal energy to be recovered from the waste heat source and injected into the DH network. However, saturation occurs with pipe sizes larger than DN 80 for the given waste heat boundary conditions. Of note, the reduction of DH network temperature regimes (from A to C) enables the higher utilization of heat exchangers for the given connection pipe size. However, this is not noticeable for the heat pump. Therefore, the proposed merit order–heat exchanger comes first in the utilization of the available thermal energy, while the heat pump can utilize the remaining waste heat available.
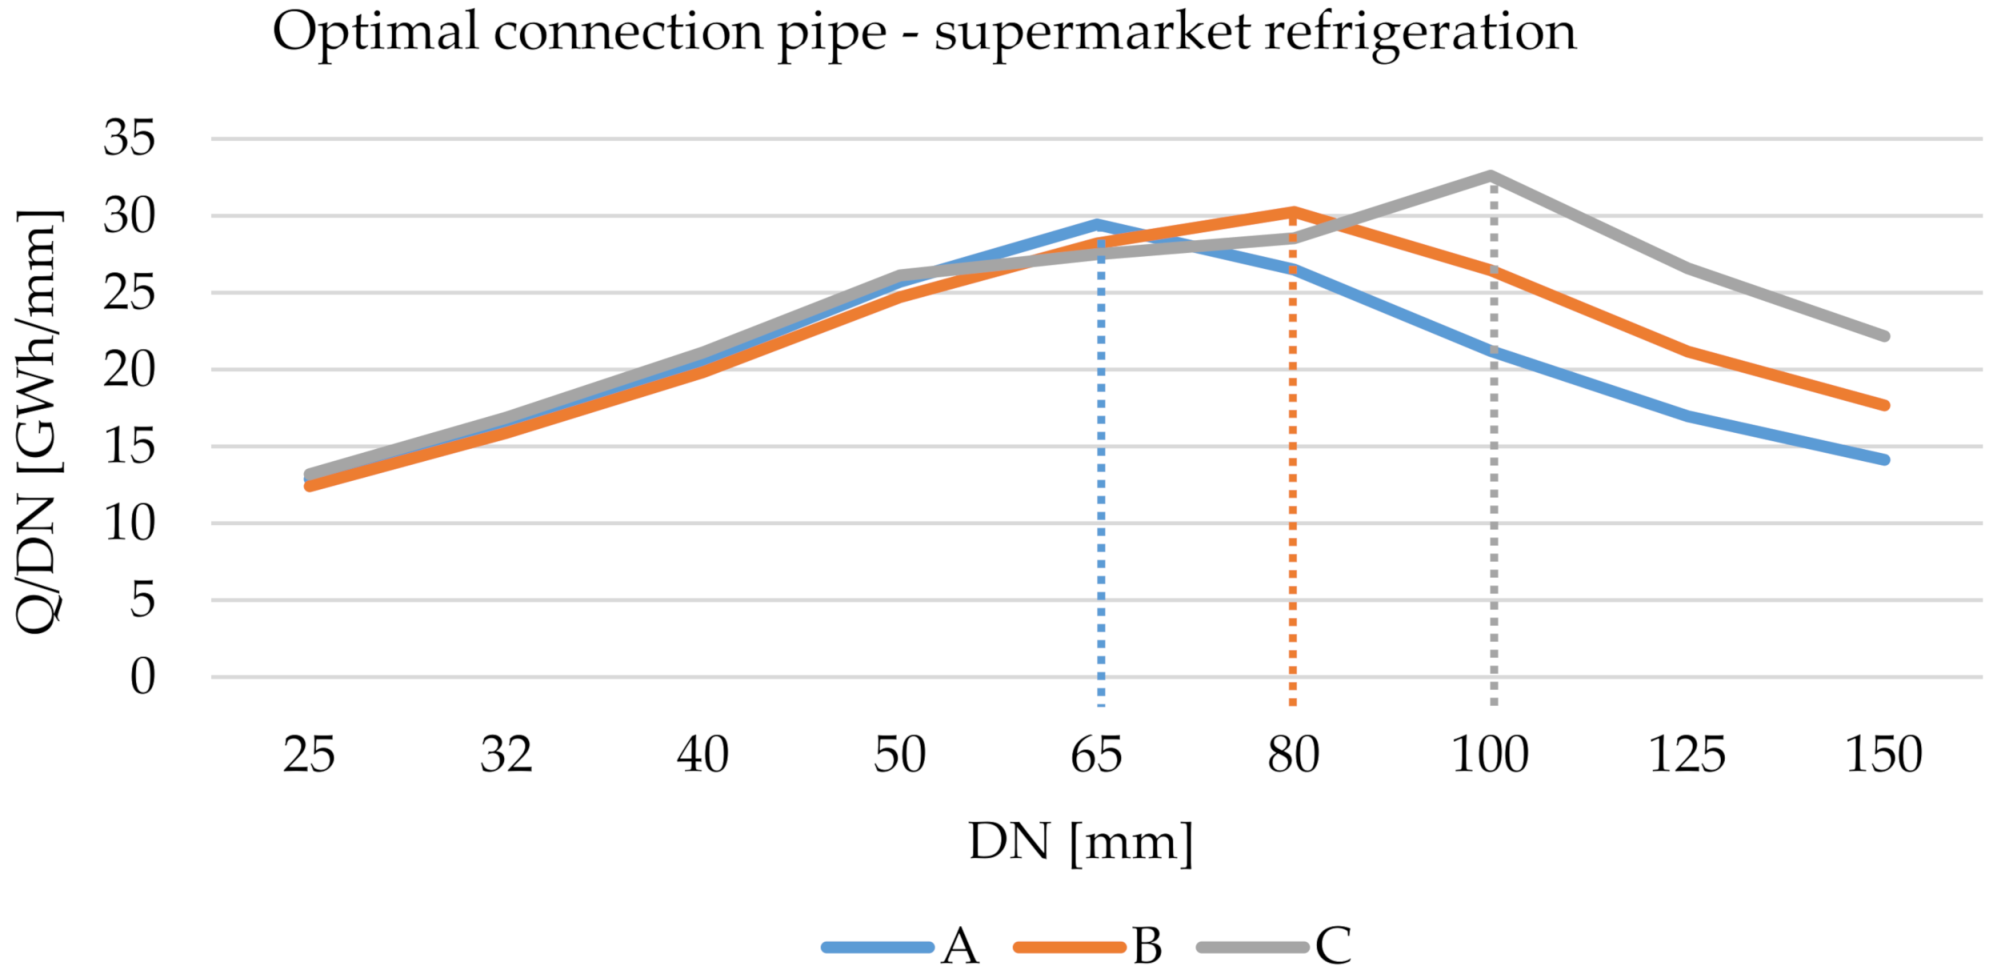
From the results shown in Figure 13, we have obtained the optimal connection pipe size. Figure 14 shows the ratio of recovered heat in the heat exchanger and connection pipe size (Y-axis) in a correlation with the connection pipe size (X-axis). It can be seen that the ratio reaches a maximum value for the specific connection pipe size. This value also presents the optimal value that will be used for the techno-economic analysis. The connection pipe size increases with the reduction of DH network temperature regimes. The optimal value is DN 65, 80, and 100 for temperature regimes A, B, and C. The optimal pipe diameter, together with the maximum ratio values, are indicated in Figure 14.
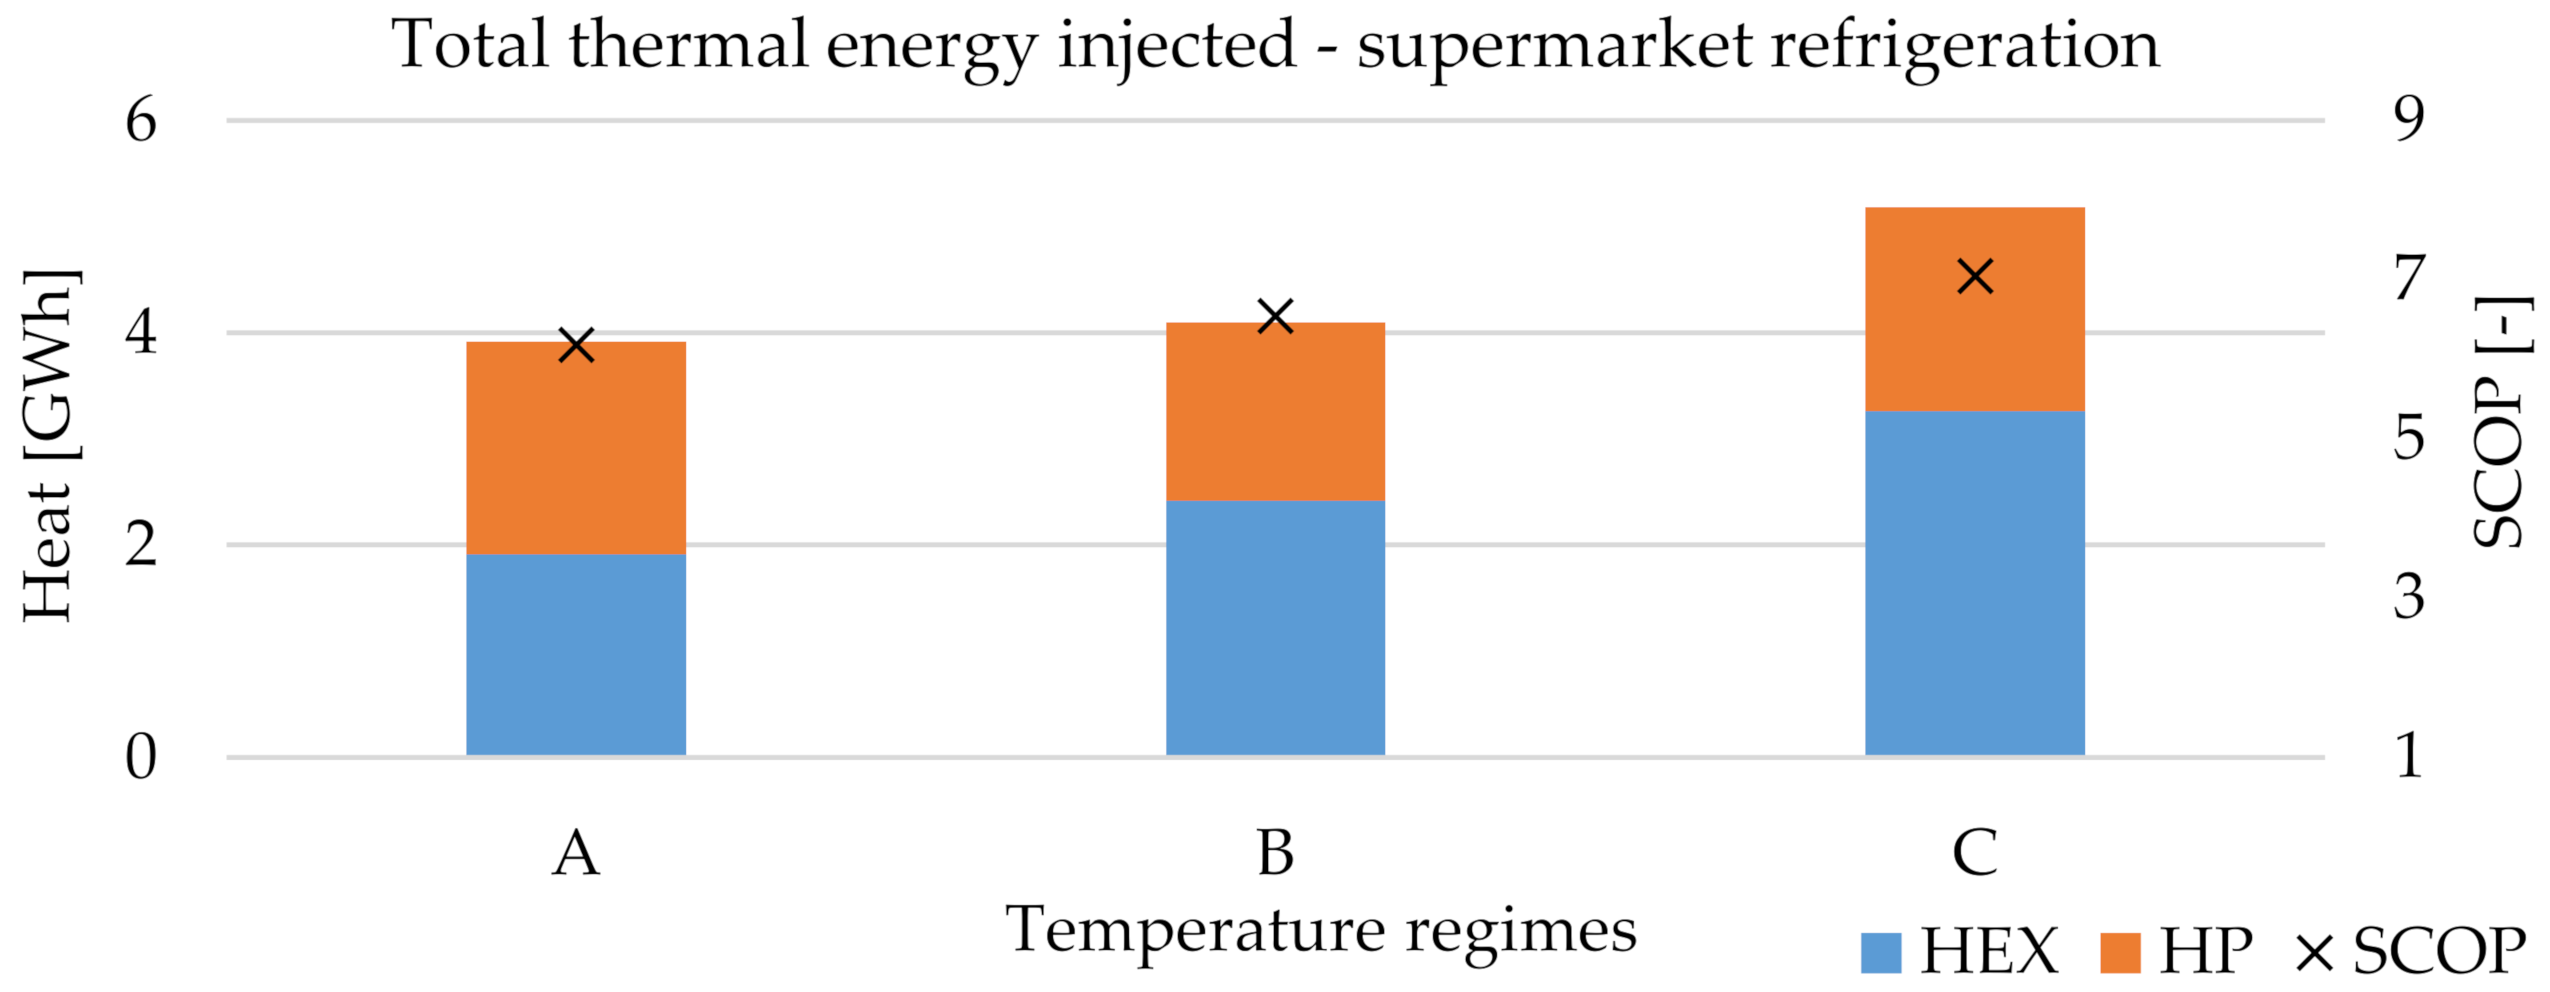
A comparison of total thermal energy injected for different temperature regimes and utilization technologies is shown in Figure 15. As expected, the amount of thermal energy which could be directly used in heat exchangers is gradually increasing with the reduction of temperature regimes. However, the amount of heat released in the thermal network through the heat pump’s condensers remains almost the same. One of the reasons behind this is an increase in the pump’s seasonal COP (SCOP), which is also shown in Figure 15. In this case, it increases from 6.2 to 7.0 for temperature regimes C. In other words, consumption of the compressor’s electrical energy is reduced for the given conditions, while the available energy in the evaporator is also decreased due to the priority of the heat exchangers in the merit order.

3.2. Power Substations

The display of results obtained for power substation waste heat follows a similar structure, as shown in Section 3.1.
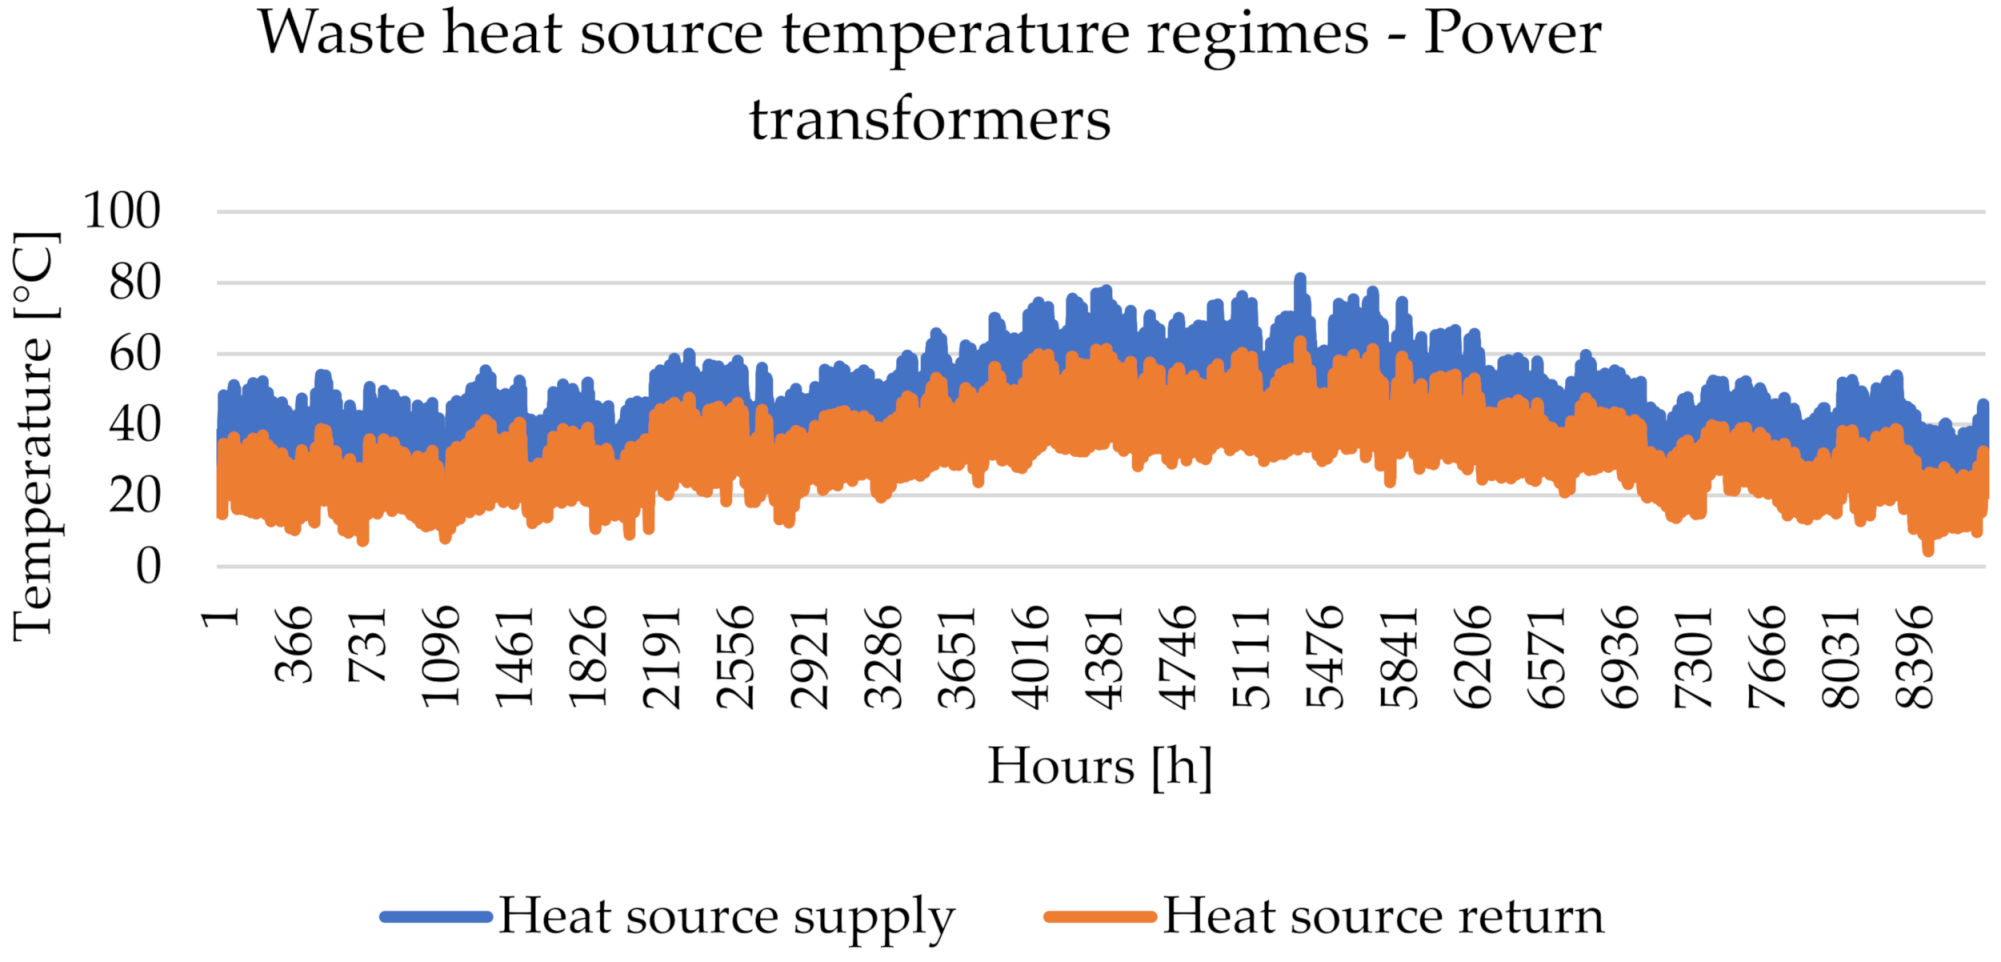
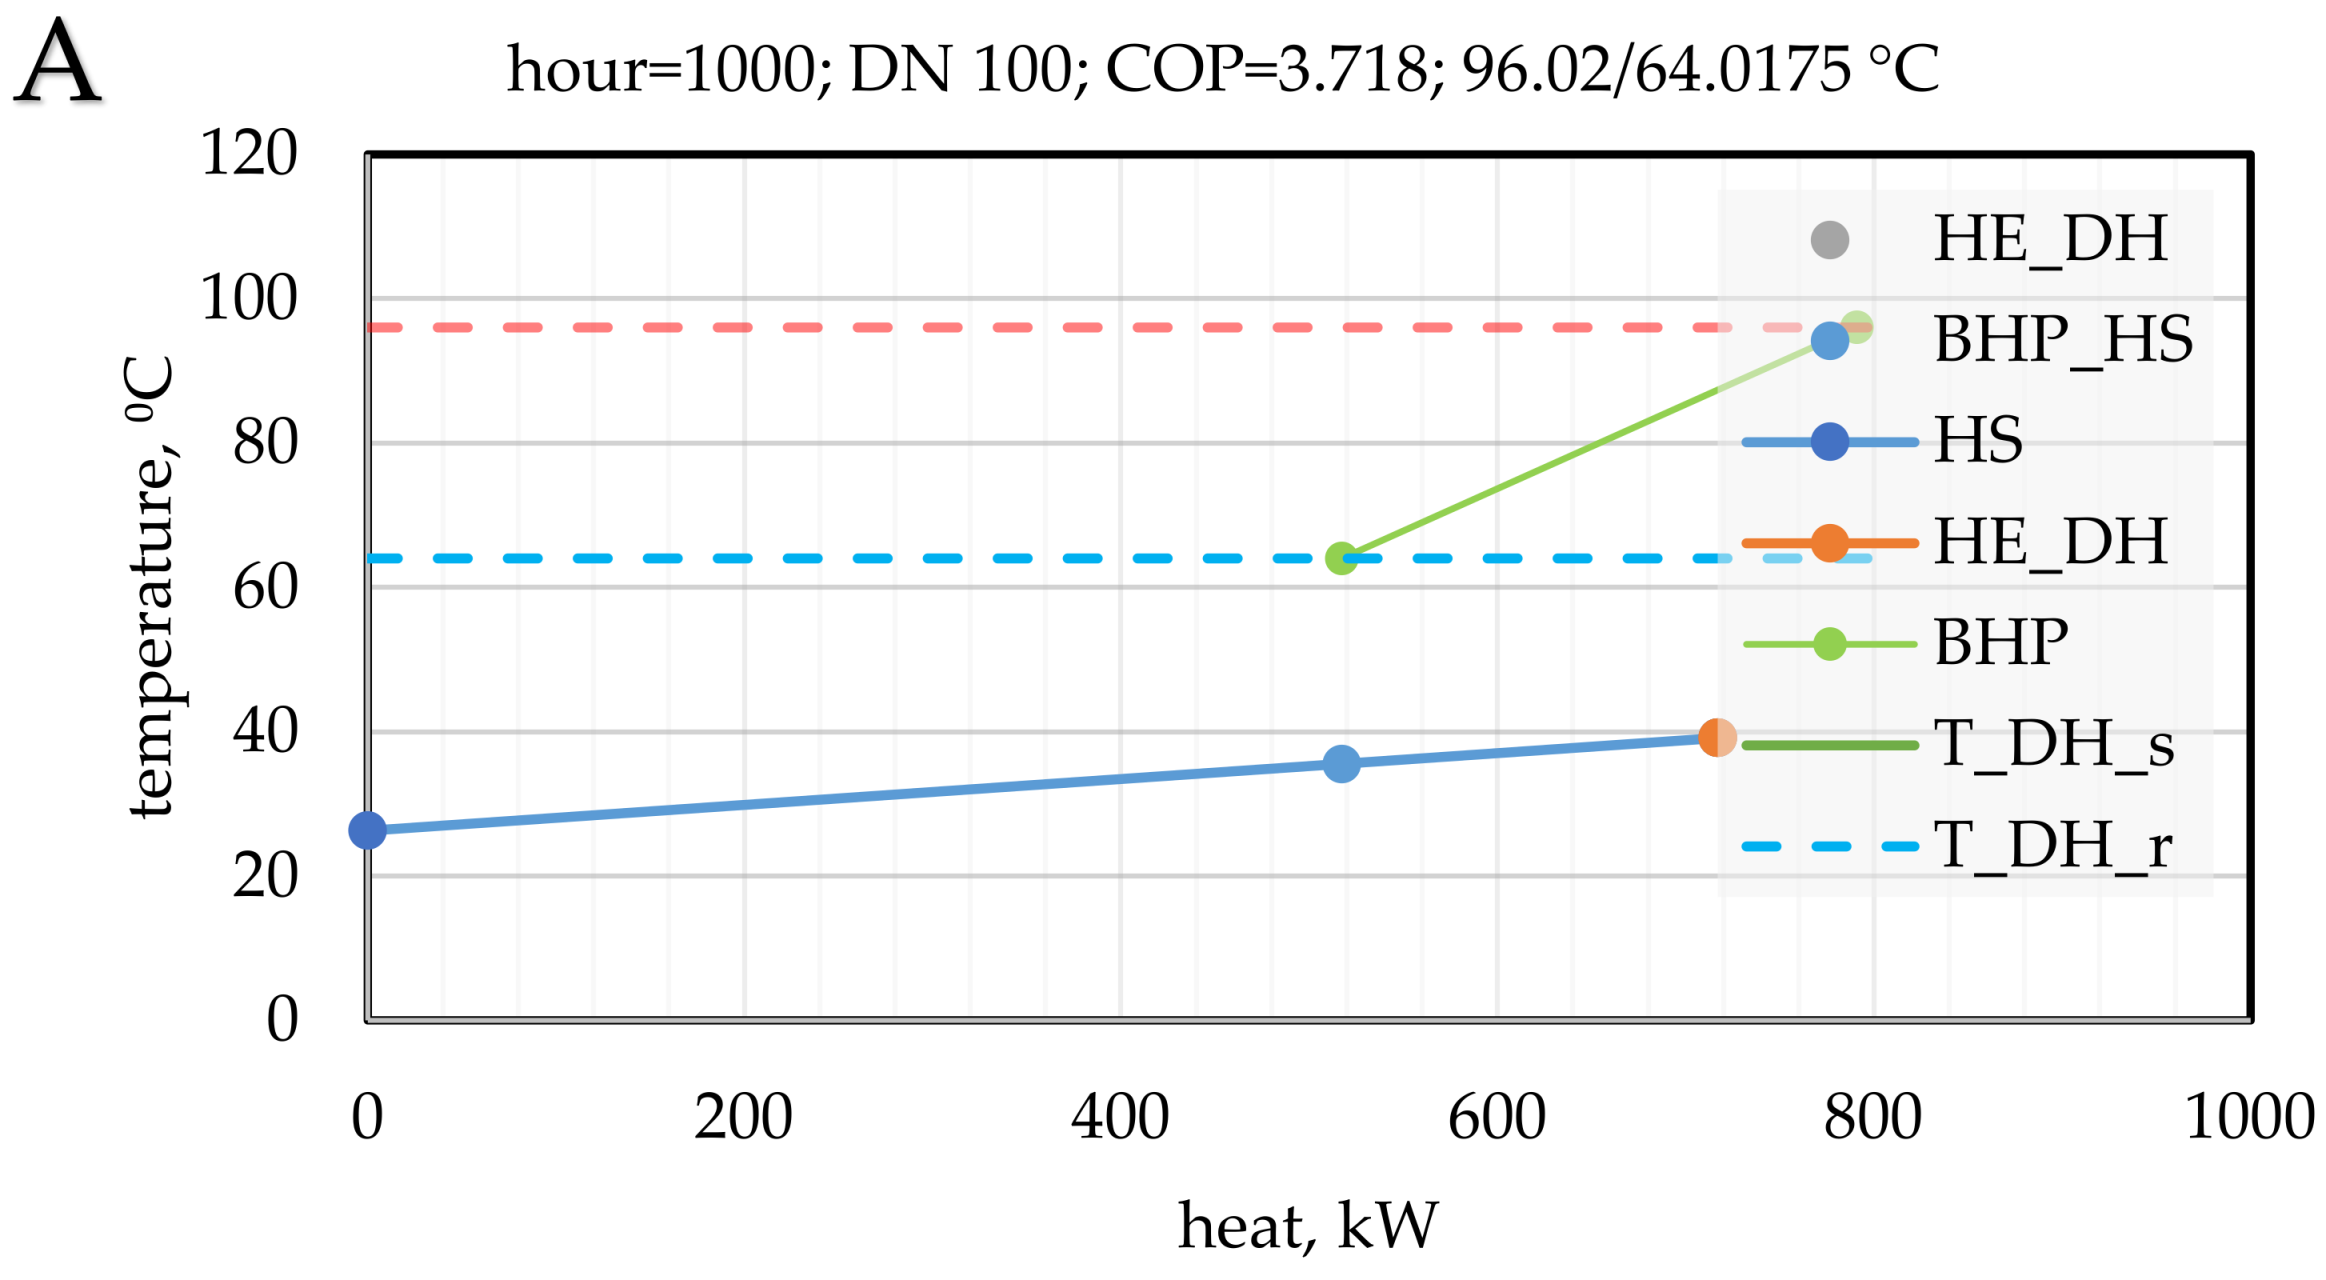
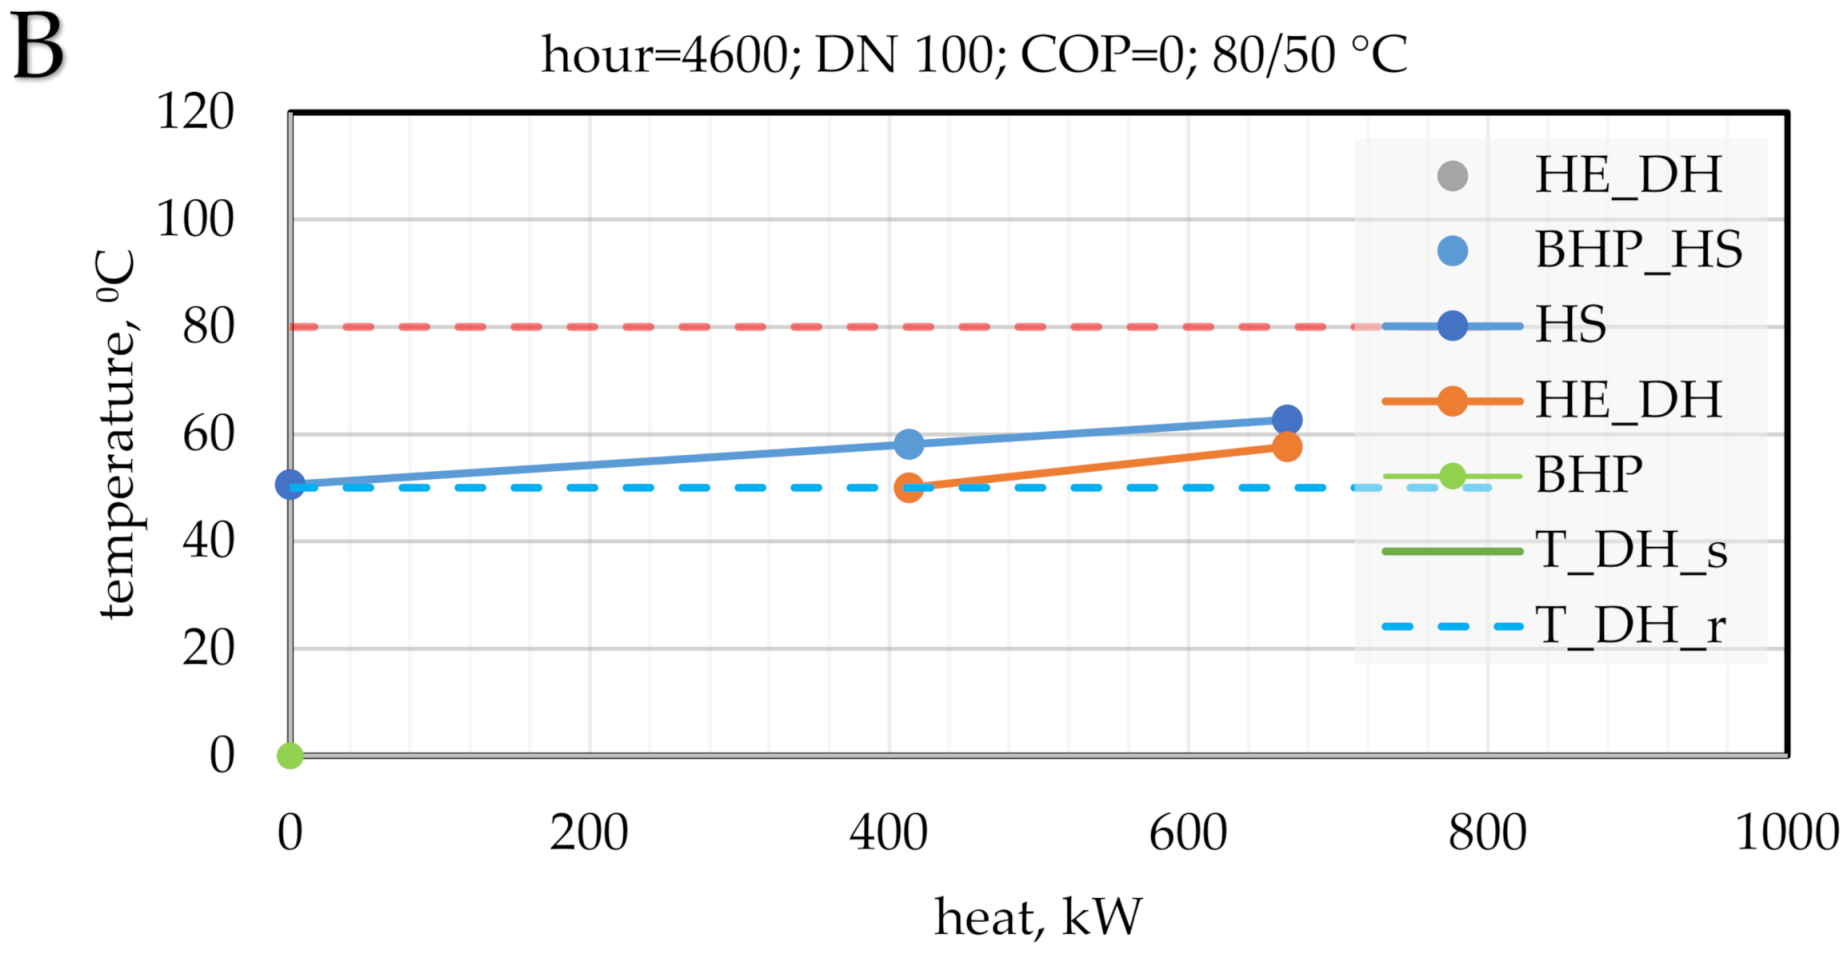
Figure 16 shows the pinch analysis for the power substation system—Scenario A if the connection pipe diameter is DN 100. Figure 16A shows the waste heat utilization for the winter period (h = 1000, month: February). It can be seen that the heat source temperature level is lower than the temperature regime of DH. In the case of Figure 16A, BHP is used for heat utilization. Figure 16B shows the utilization for the summer period (h = 4600, month: July). Compared with Figure 16A, it can be seen that the temperature regime during the summer period is lower than the winter period due to the higher ambient temperature (see Figure 10). The temperature of the heat source in Figure 16B is lower than the temperature of the supply side of DH, but higher than the return side of DH. In the case of Figure 16B, waste heat utilization is possible with HEX.
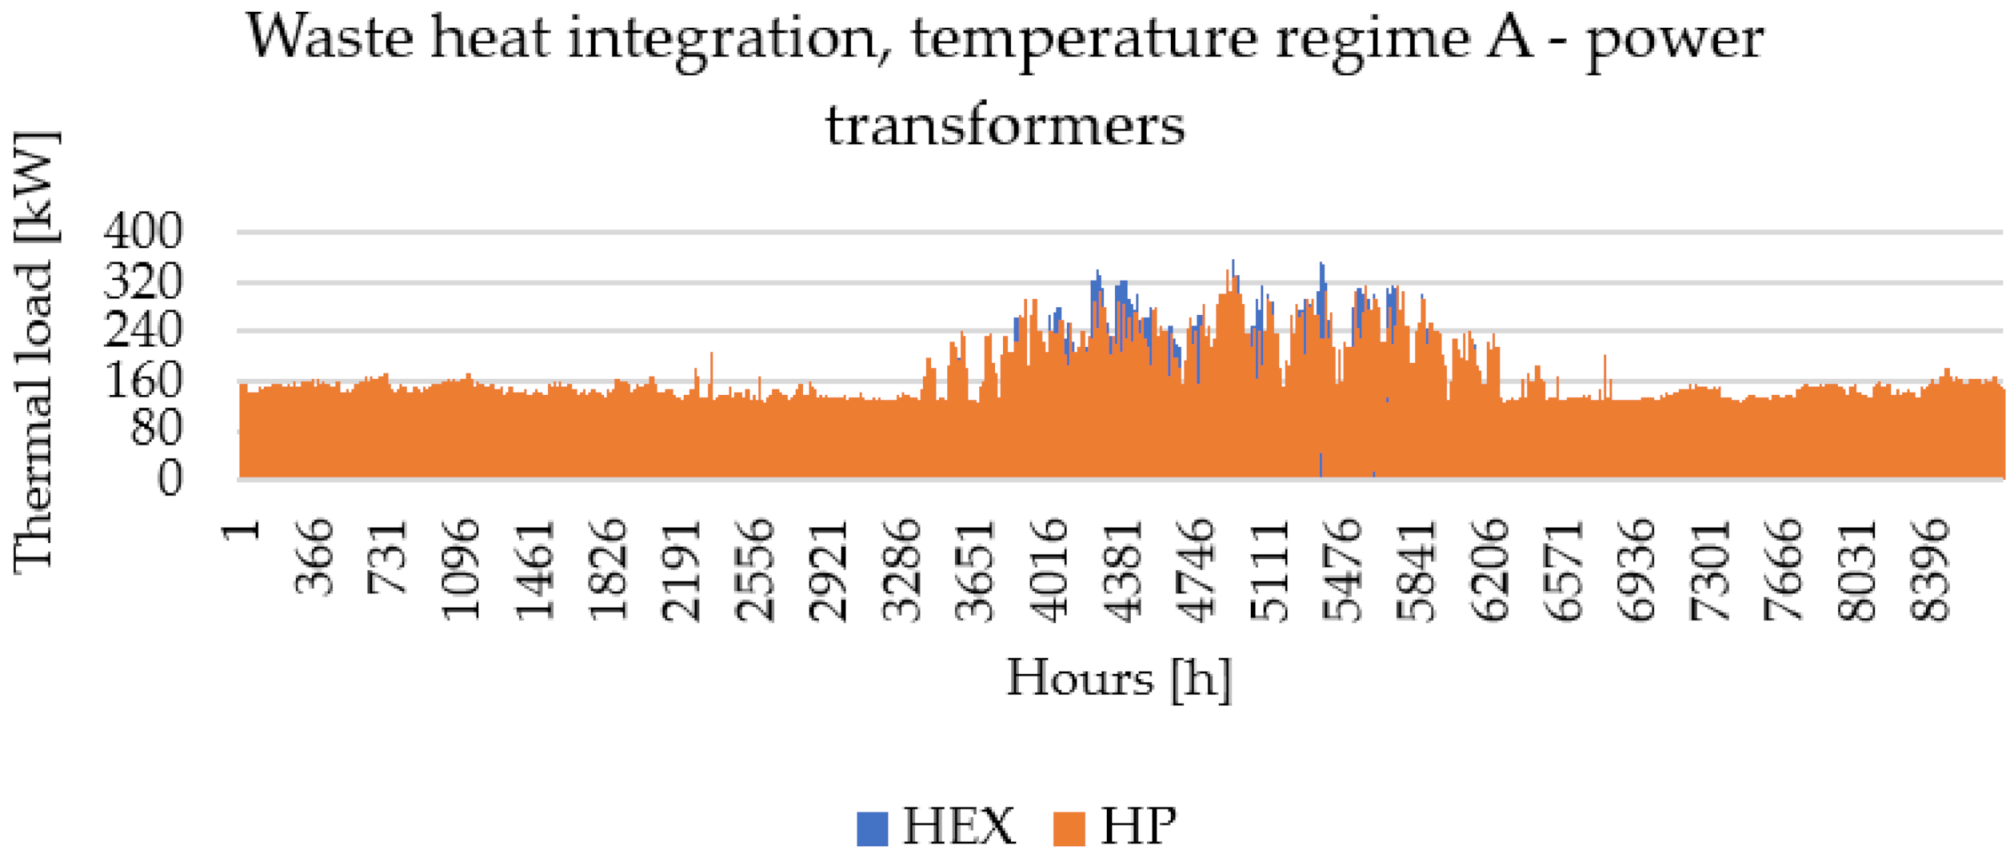
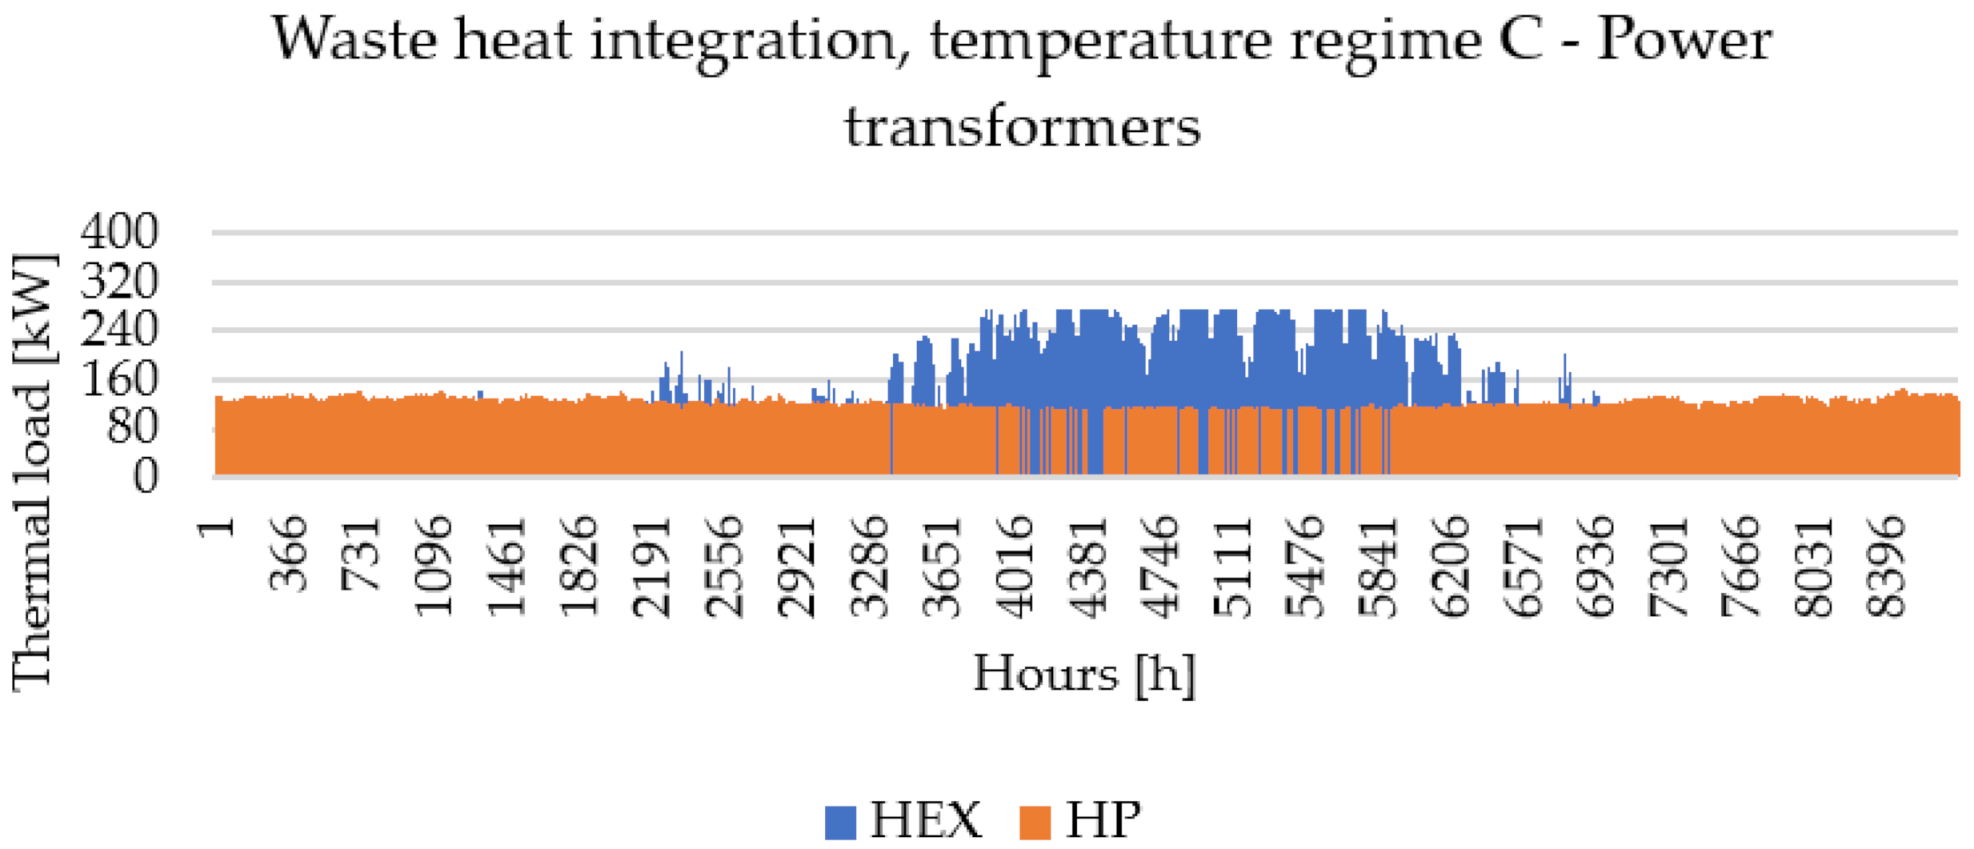
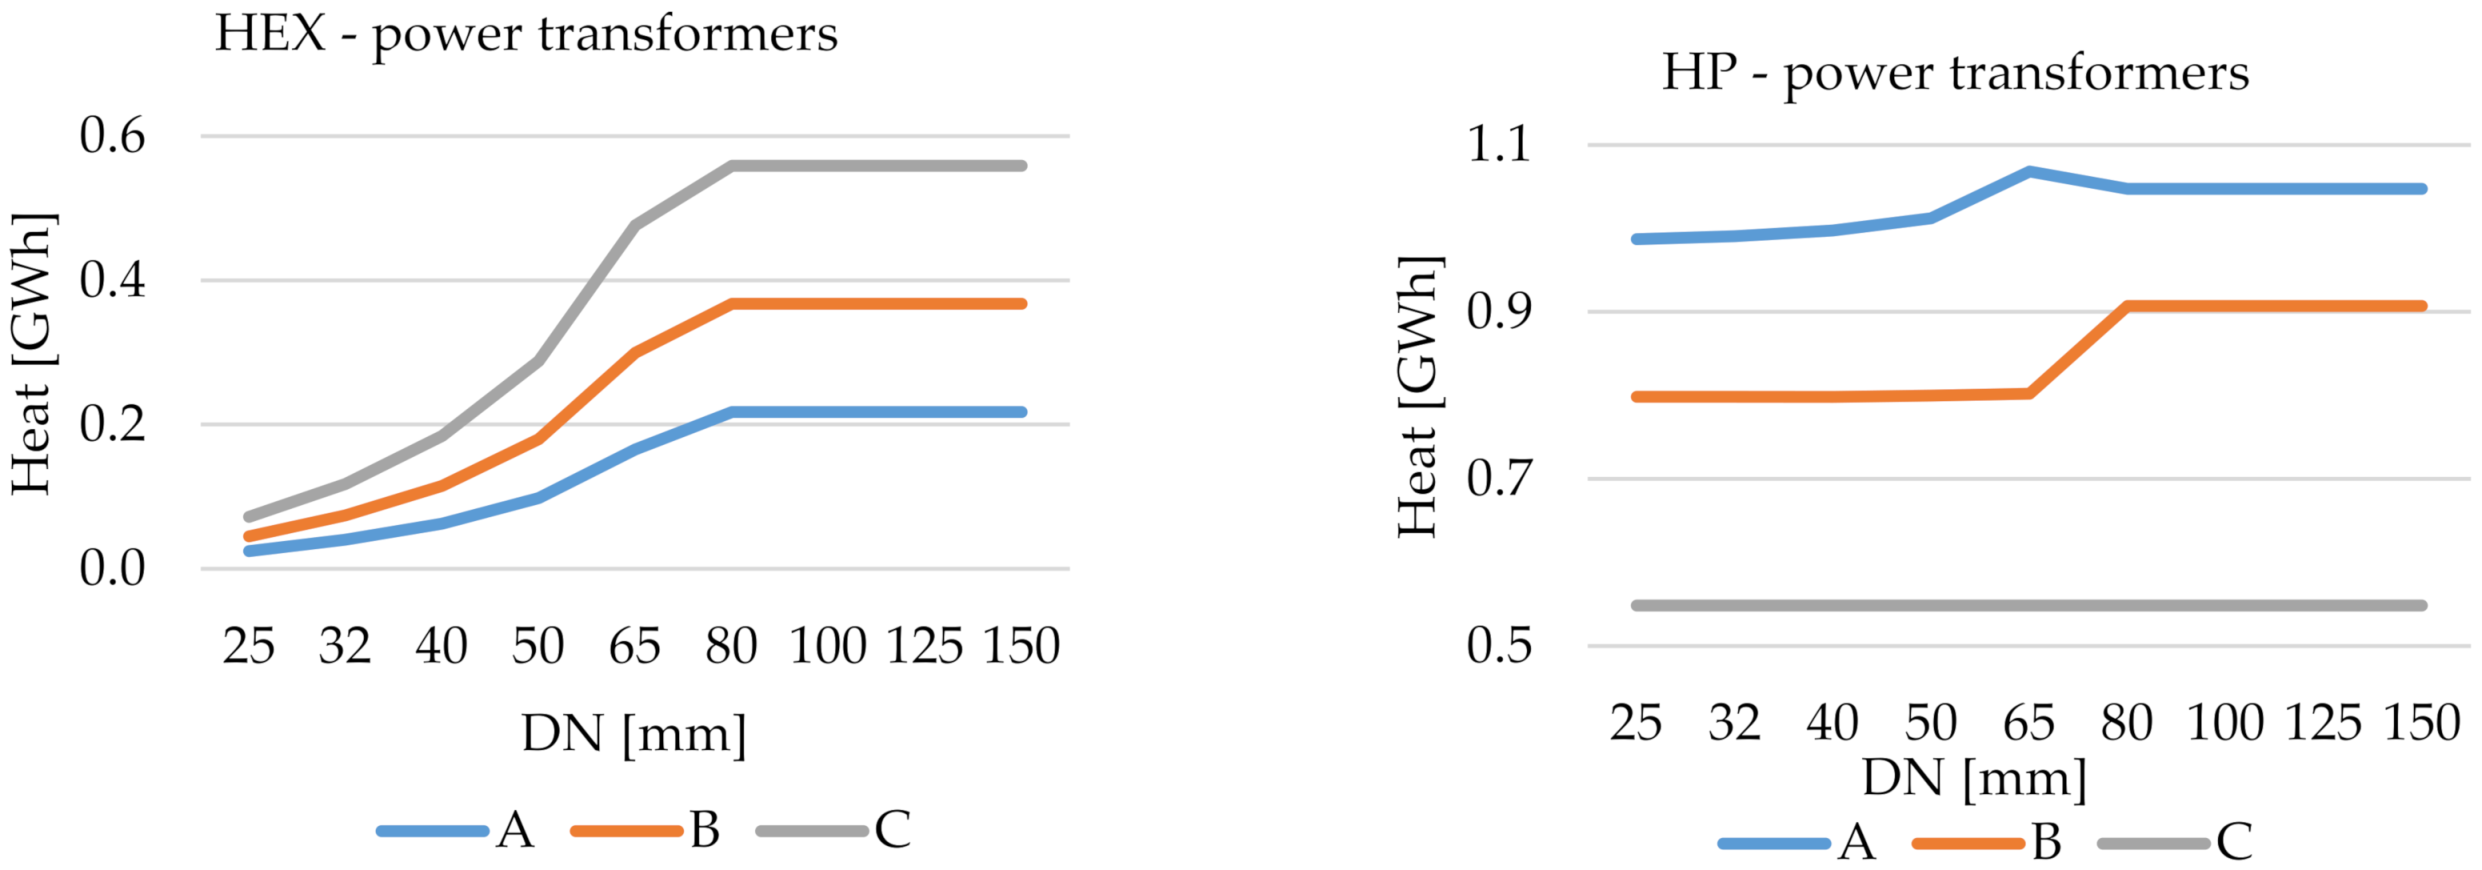
Figure 17 shows the amount of heat injected for different connection pipe sizes and temperature regimes. Of note, the utilization of heat exchanger (left diagram) is significantly smaller than the heat pump (right diagram). The reason behind this is the temperature regimes of power substation waste heat source, as shown in Appendix A in Figure A5. However, as the temperature regimes of the DH network are reduced (from A to C), the heat exchanger can utilize more available waste heat, thus reducing the thermal energy available for heat pumps. This is also visible in the hourly thermal load diagrams shown for DH temperature regimes B and C, as shown in Annex in Figure A6, Figure A7 and Figure A8. During the summer period, when waste heat source temperatures are high and DH network temperatures are low, heat exchangers can use most of the available heat. This is not the case for temperature regime A, when heat exchangers have low utilization. Furthermore, it is worth mentioning that the increase in pipe connection diameter has a small effect on heat pump utilization. However, this is not the case for the heat exchanger. Its utilization rises with the increase of connection pipe size. Nevertheless, it reaches saturation at DN 80 for all of the temperature regimes.
Figure 18 shows the optimal connection pipe size for the power transformers waste heat source. Similar to the case with supermarkets, we also defined a parameter called the ratio of injected heat and connection pipe site. It can be seen that the ratio reaches a maximum value for a specific connection pipe size, while the optimal connection pipe size does not change drastically with a change of DH network temperature regimes. It is equal to DN 80 for temperature regime A and DN 65 for temperature regimes B and C. Once again, these values are indicated in Figure 17.
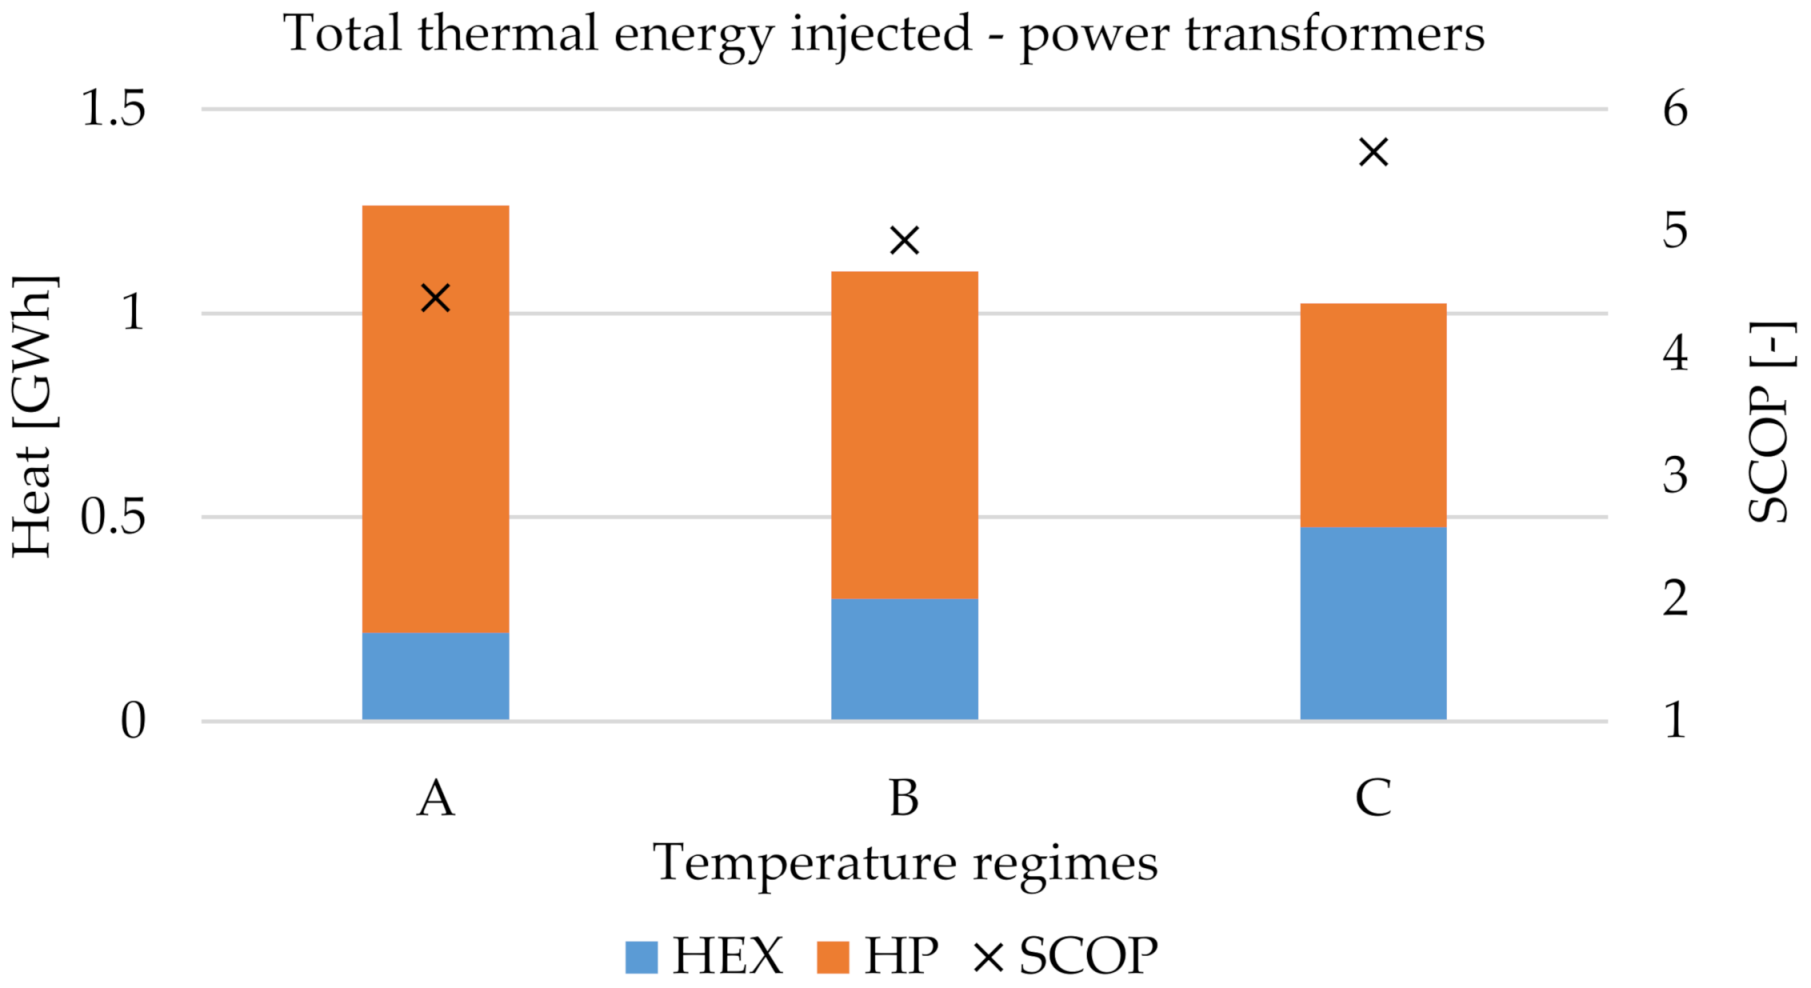
Figure 19 shows the total thermal energy injected into the DH network for the selected connection pipe size and different temperature regimes. As previously explained, heat exchanger utilization increases with temperature regime reduction and reduces the waste heat available for the heat pump evaporator. Furthermore, the reduction of temperature regimes increases the SCOP of the heat pump. It increases from 4.5 to 5.7 for lower temperature regimes. Consequently, thermal energy injected into the DH network through the heat pump condenser is reduced.

3.3. Techno-Economic Analysis

To compare the obtained results, we have performed a techno-economic analysis which is based on the levelized cost of heat (LCOH). It represents the cost of thermal energy injected into the thermal grid using the analyzed waste heat sources. The overall expenditure includes capital investment costs of heat utilization technologies and connection pipe. In addition, there are numerous operational costs, such as operation and maintenance (fixed and variable), electrical energy to drive the heat pump compressor, etc.
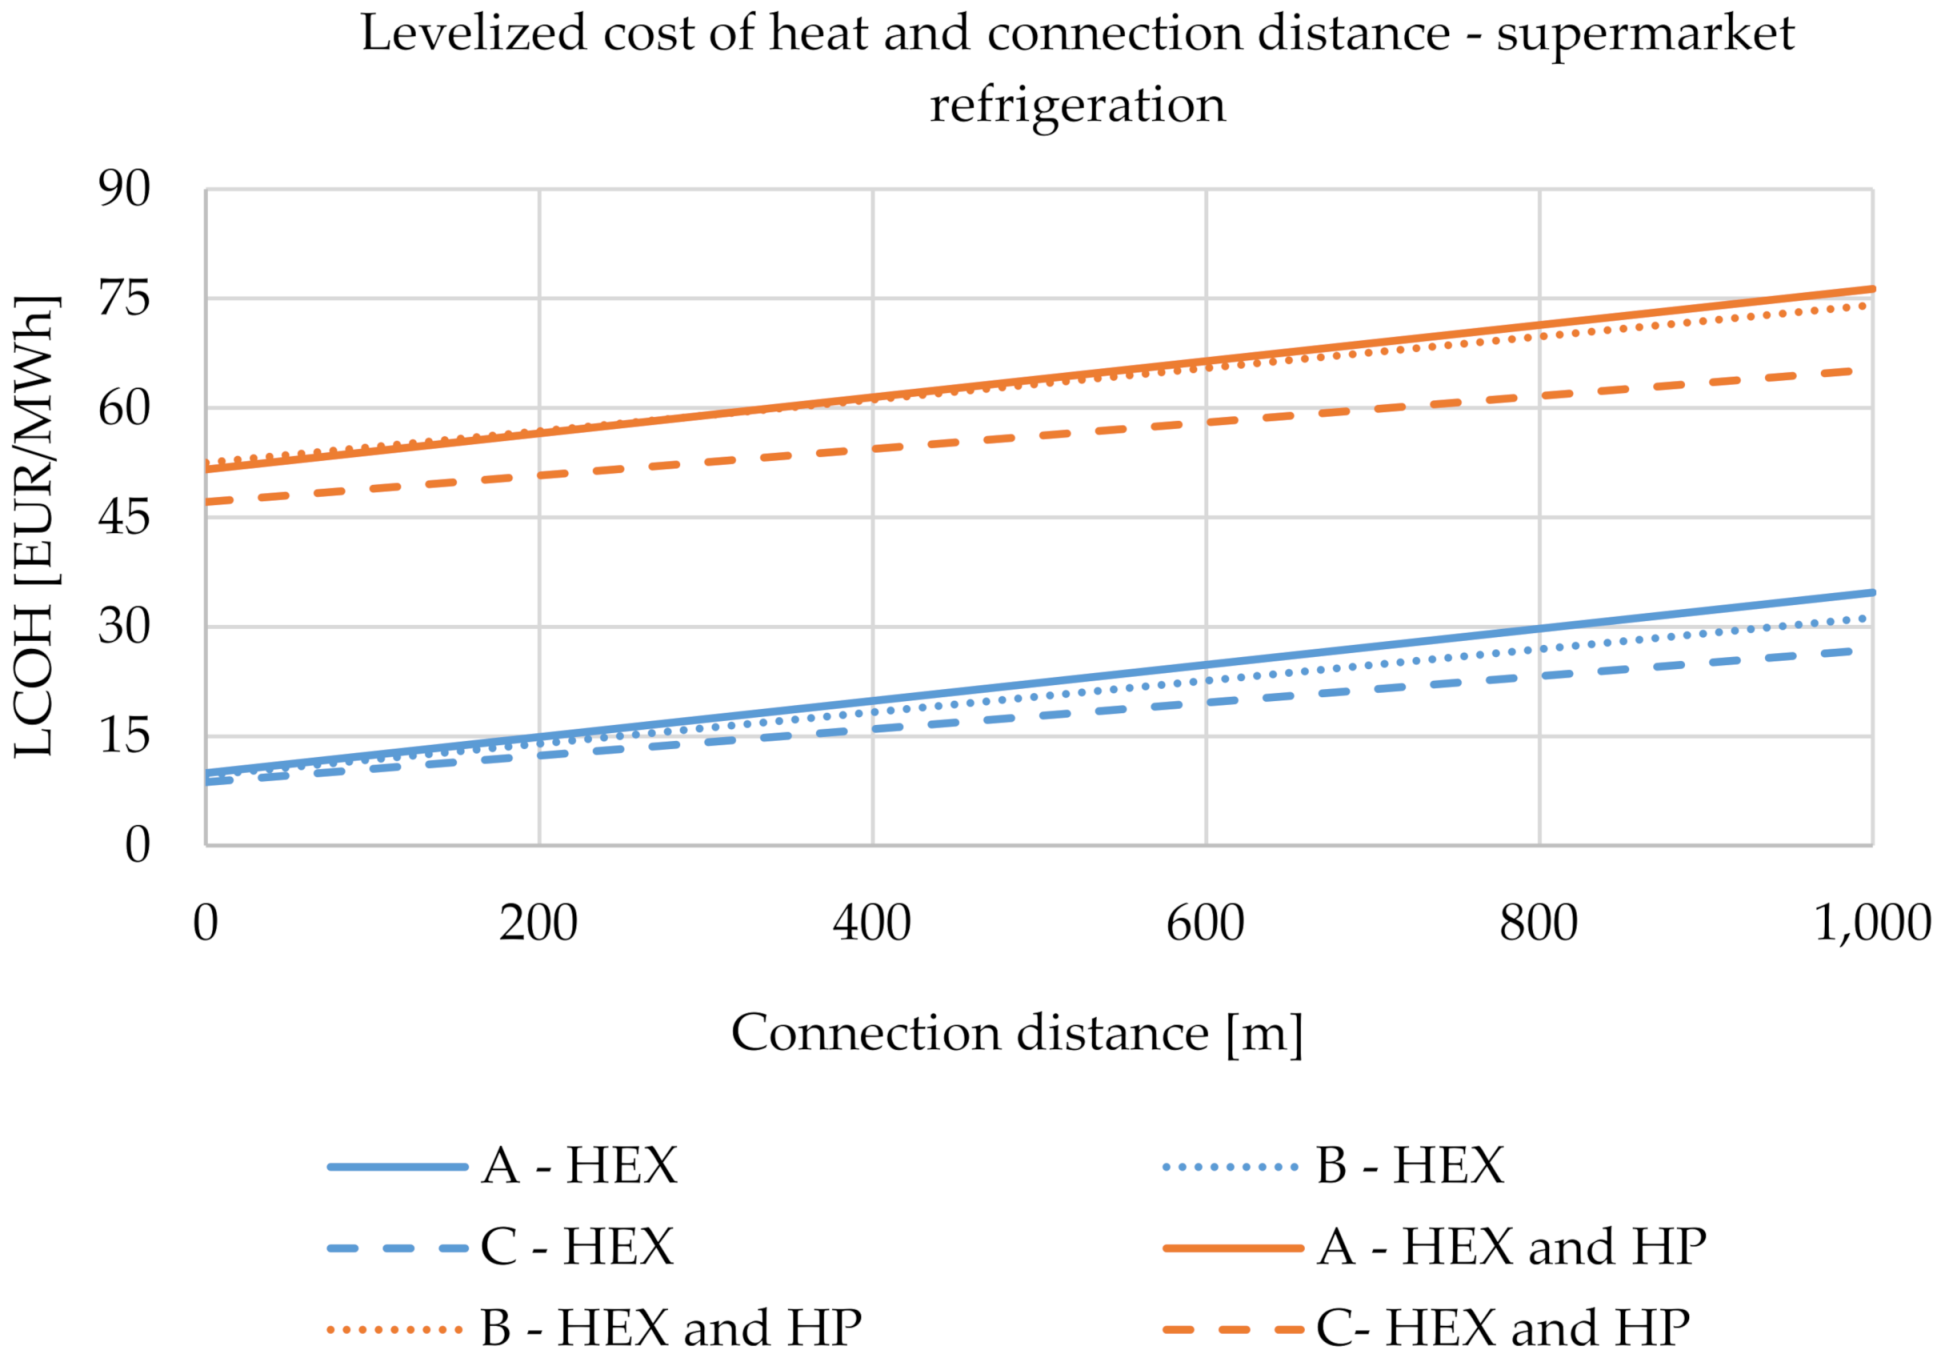
Figure 20 shows a comparison of supermarket waste heat LCOH for the different utilization technologies and temperature regimes. It can be seen that the cost of thermal energy increases with the distance between the waste heat source and DH network, the so-called connection distance. Of course, an additional investment is required for every meter of connection distance. In the case of utilizing waste heat only through a heat exchanger, LCOH is relatively low and around 9 EUR/MWh. However, this price could rise to around 30 EUR/MWh if the connection distance is 1000 m. Adding the heat pump into the system increases LCOH four times, reaching 50 EUR/MWh, i.e., 70 EUR/MWh in the case of high connection distance. Of note, the reduction of DH network temperature regimes lowers LCOH, but the impact is limited. For example, for the 1000 m connection distance, the price reduction is around 20% for the heat exchanger and around 15% if a heat pump is added.
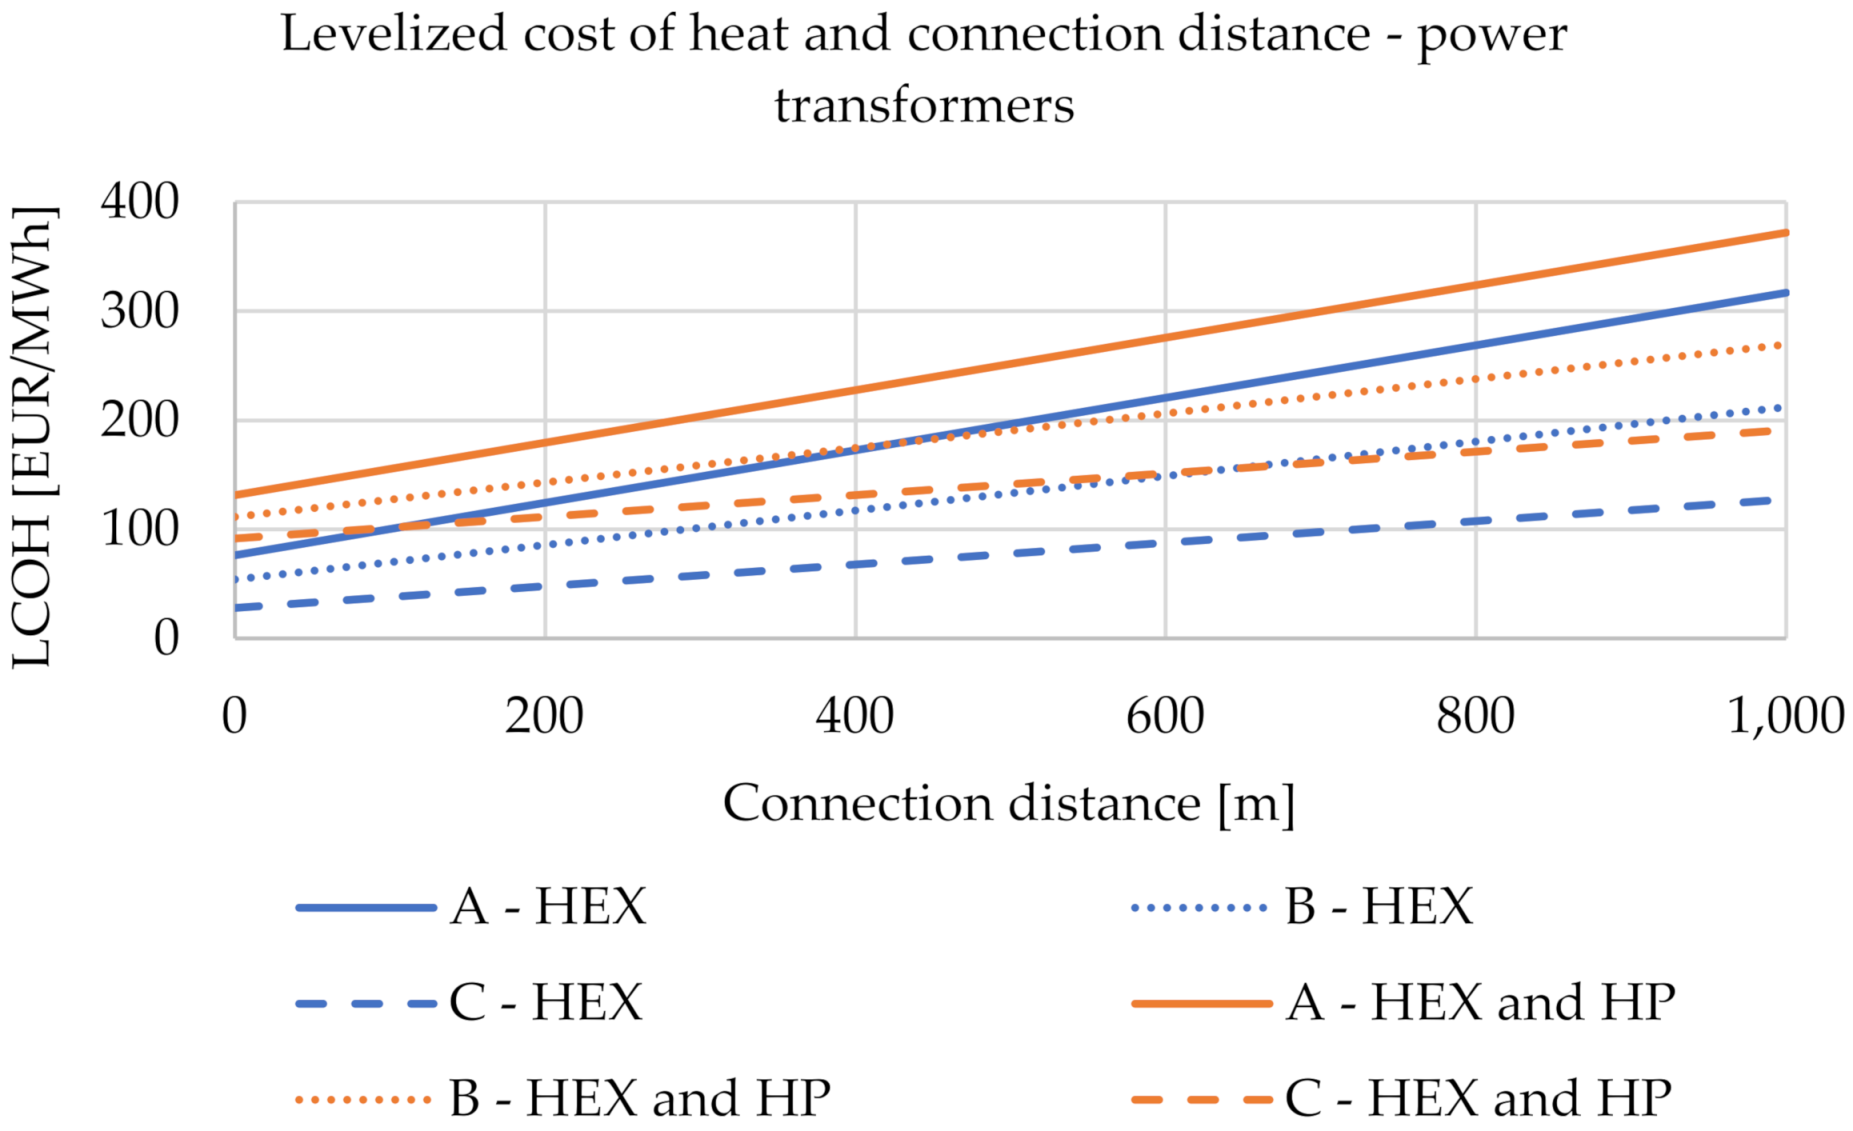
Similarly, Figure 21 shows LCOH for power transformers waste heat for different temperature regimes and utilization technologies in relation to the connection distance. As expected, due to lower waste heat temperatures, LCOH for power transformers is higher than for supermarkets. For heat exchanger technology, the price is between 30 and 70 EUR/MWh, depending on the temperature regimes. If a heat pump is added, the cost could rise to around 120 EUR/MWh, depending on the temperature regimes. If the connection distance rises to 1000 m, LCOH can increase almost four times, depending on the temperatures in the DH network.
Finally, it can be seen that the reduction of temperature regimes declines the slope of the diagrams shown in Figure 20 and Figure 21. In other words, it makes waste heat utilization projects less sensitive to the connection distance.
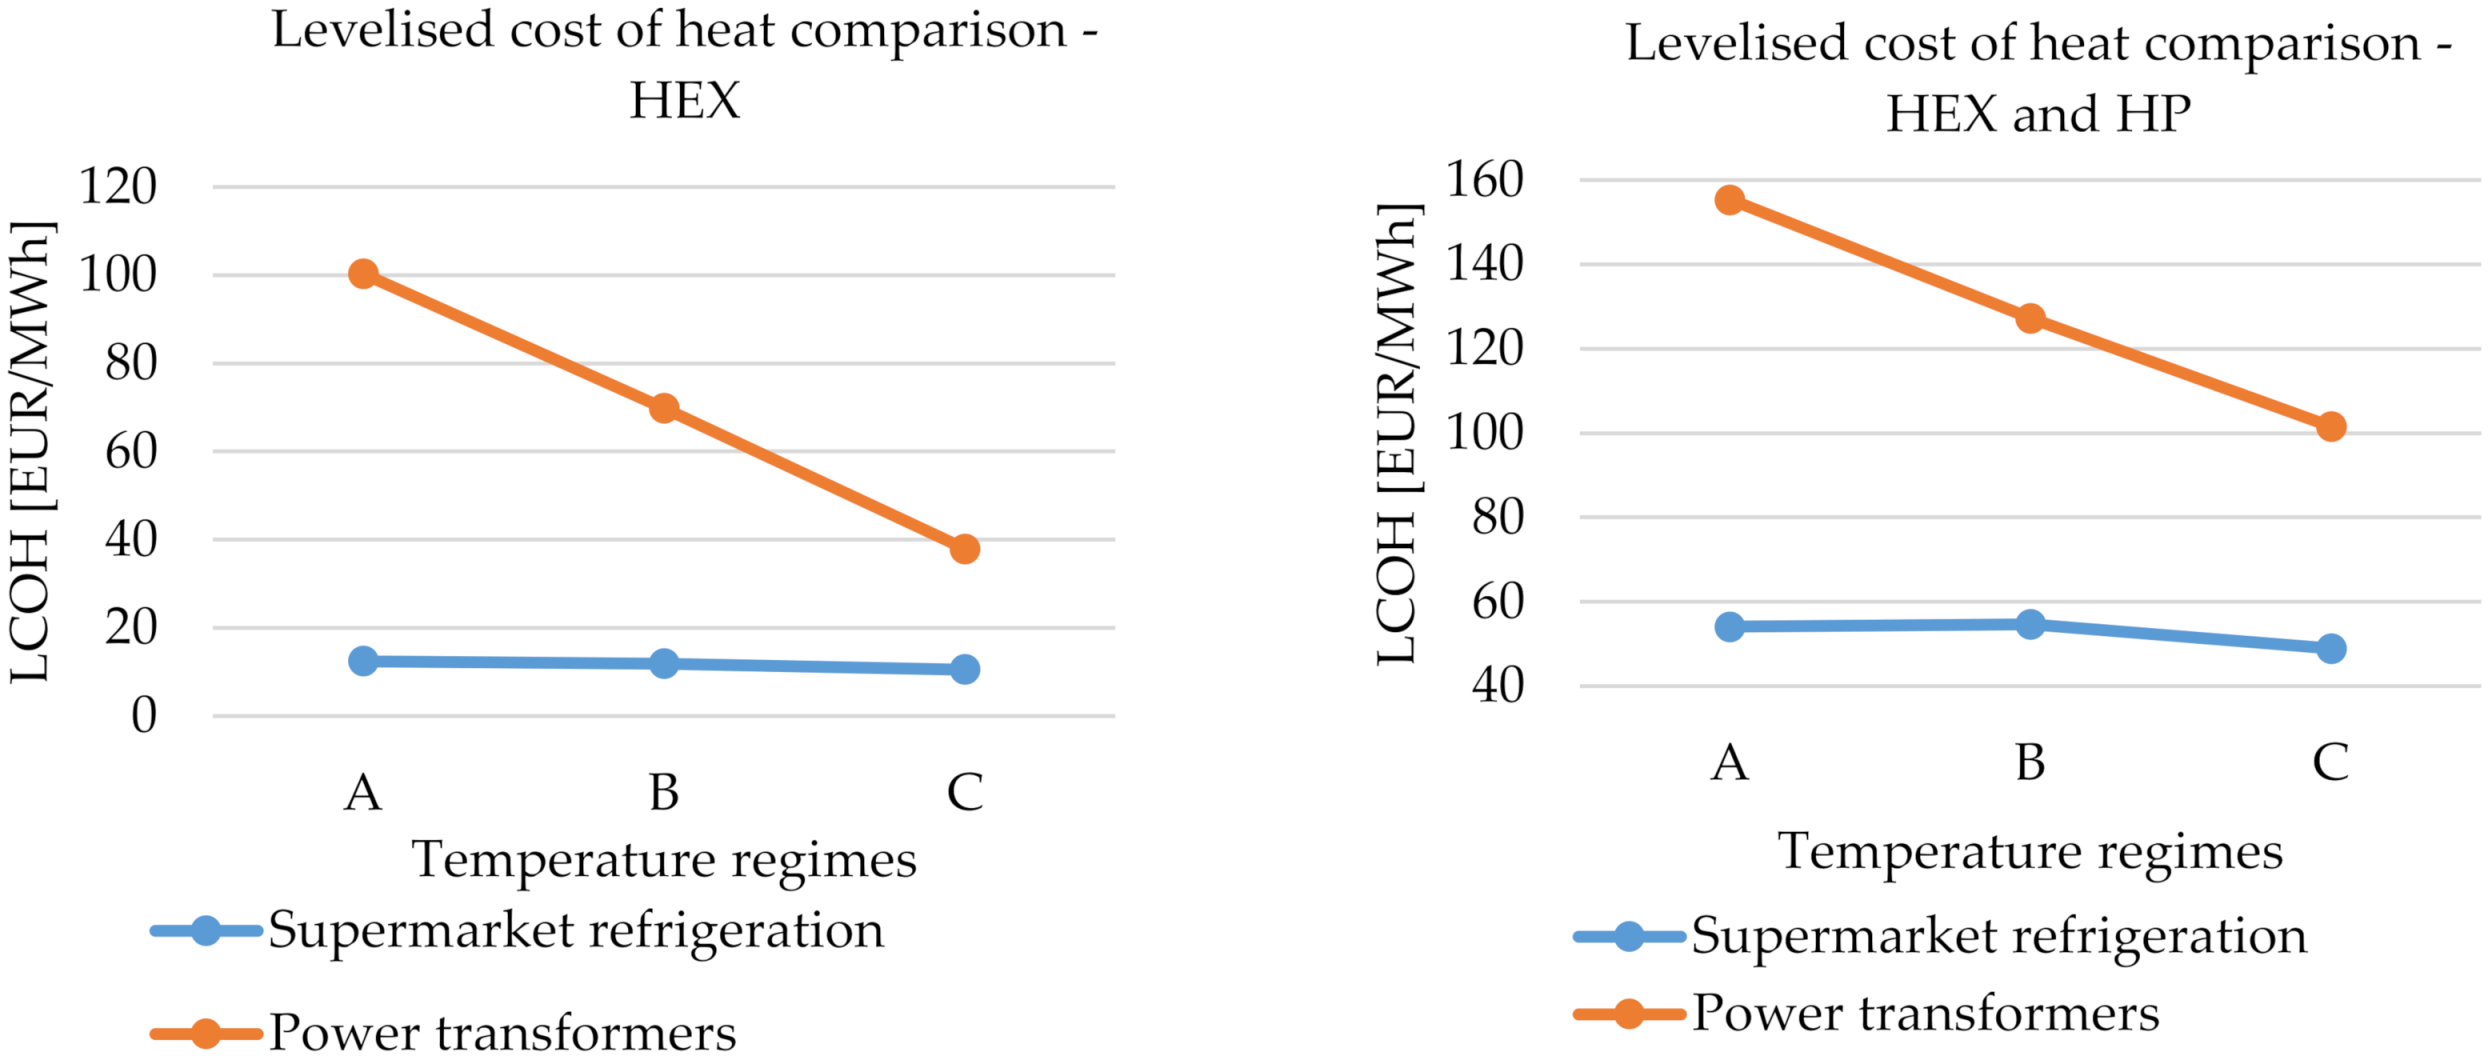
Figure 22 shows a LCOH comparison for supermarkets and power transformers waste heat sources for different temperature regimes. The assumed connection distance is 100 m. As previously mentioned, supermarkets are less expensive waste heat sources, even if heat pumps are integrated. Moreover, it can be seen that power transformers waste heat projects are more sensitive to the temperature regimes of the network.
Although integrating waste heat sources into the DH network is a relatively inexpensive option, there are some issues that should be discussed. As shown in Section 2, the heat exchanger usually is not capable of increasing the DH return to the required supply temperature. Most of the time, for the given temperature regimes, a waste heat exchanger is capable of only preheating the return line of the DH network. On the other hand, a heat pump is usually capable of providing the required supply temperatures. However, the maximum temperature lift should be considered. Although the integration of heat pumps is more expensive, it provides flexibility for the district heating operator and opens different possibilities for system optimization, such as integration of thermal storage, different pre-heating configurations, etc.

3.4. Sensitivity Analysis

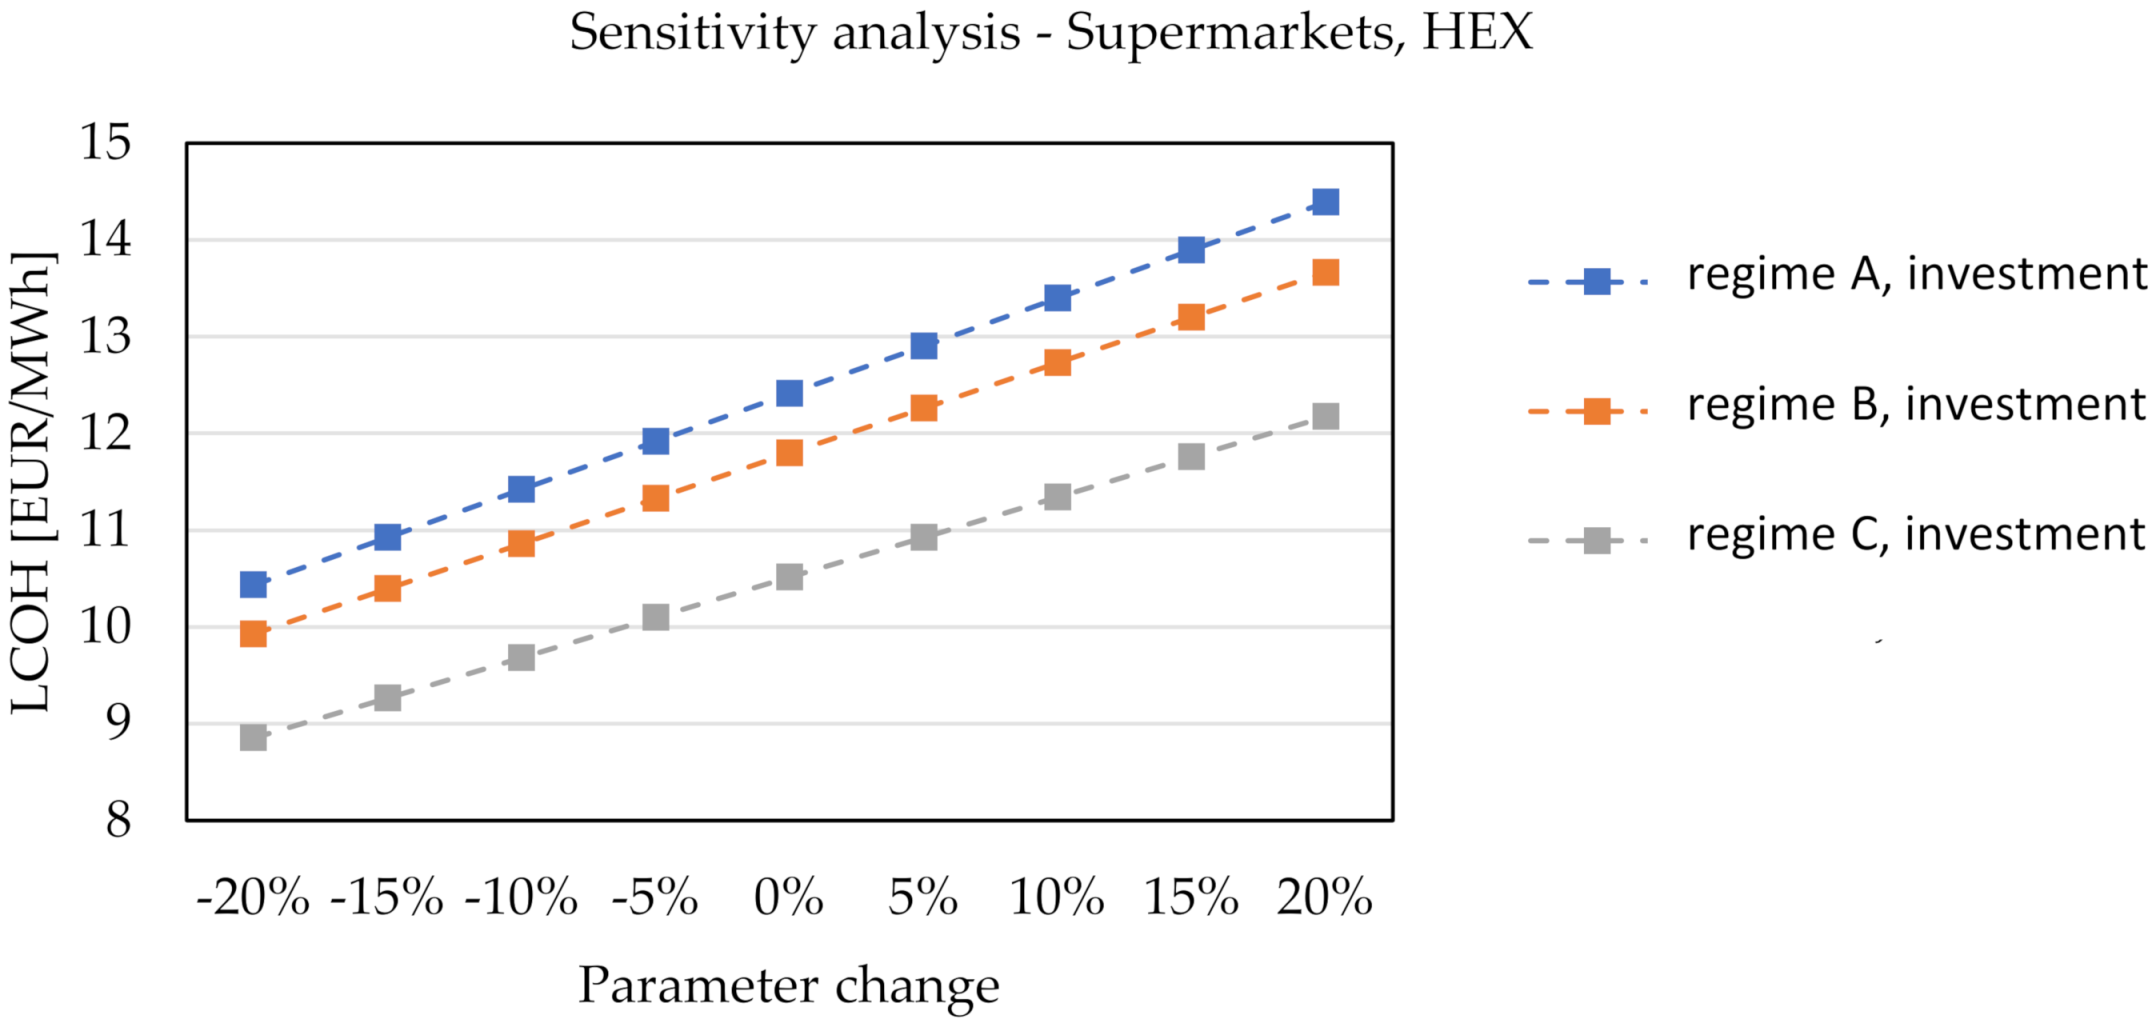
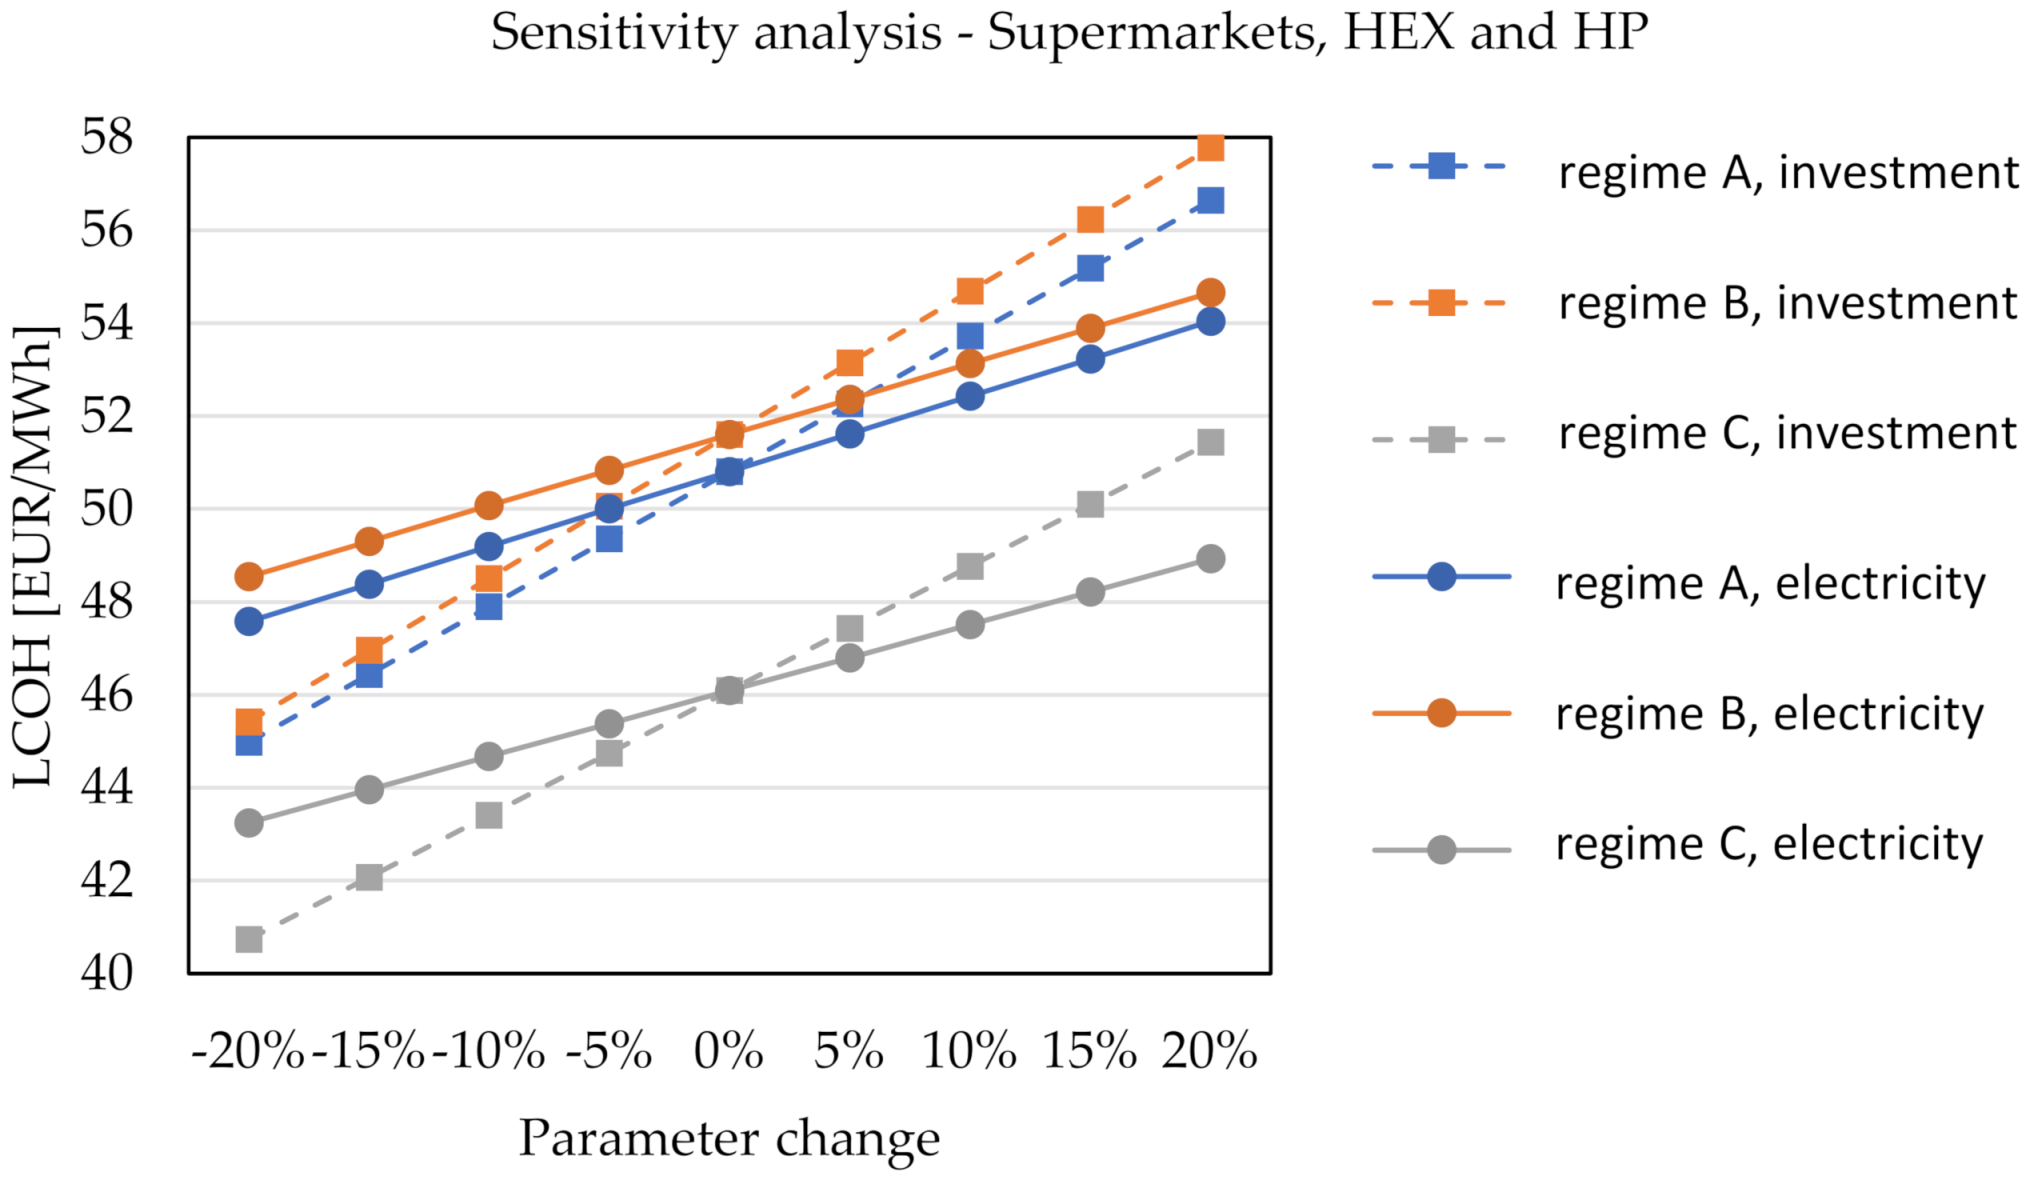
The sensitivity analysis of the levelized cost of heat was carried out for the investment cost and price of electrical energy, which drives the compressor heat pump. The analysis was carried out for both waste heat sources with different utilization technologies. Figure 23 and Figure 24 show the sensitivity analysis for supermarket waste heat utilization with the heat exchanger and heat exchanger combined with heat pump, respectively. It can be seen that the heat exchanger investment increase of 20% increases LCOH to 14.5 EUR/MWh or 12 EUR/MWh, depending on the temperature regime of the DH network. If a heat pump is added, the change of specific investment can cause a relatively high LCOH equal to 58 EUR/MWh for specific temperature regimes. Of note, LCOH is less sensitive to electricity prices than to investment change.
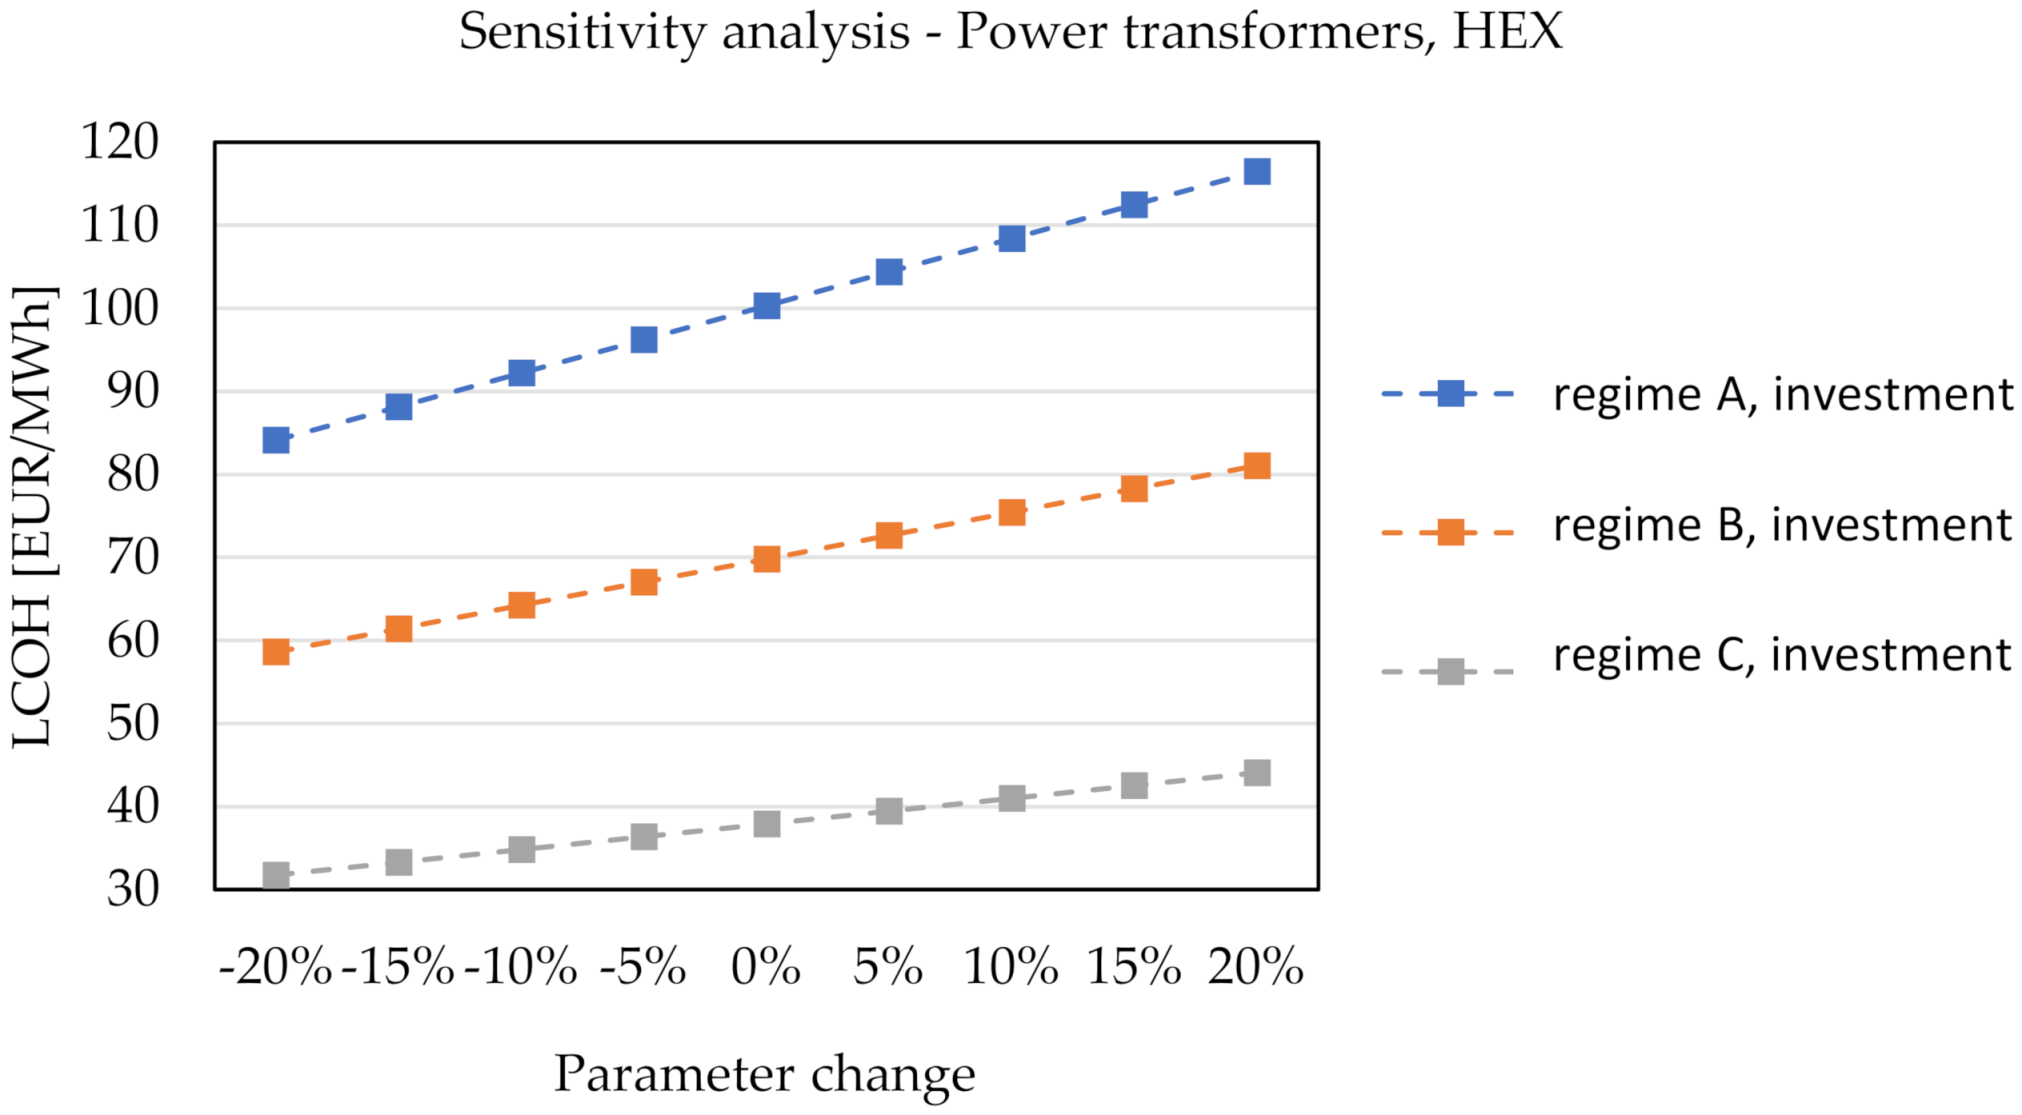
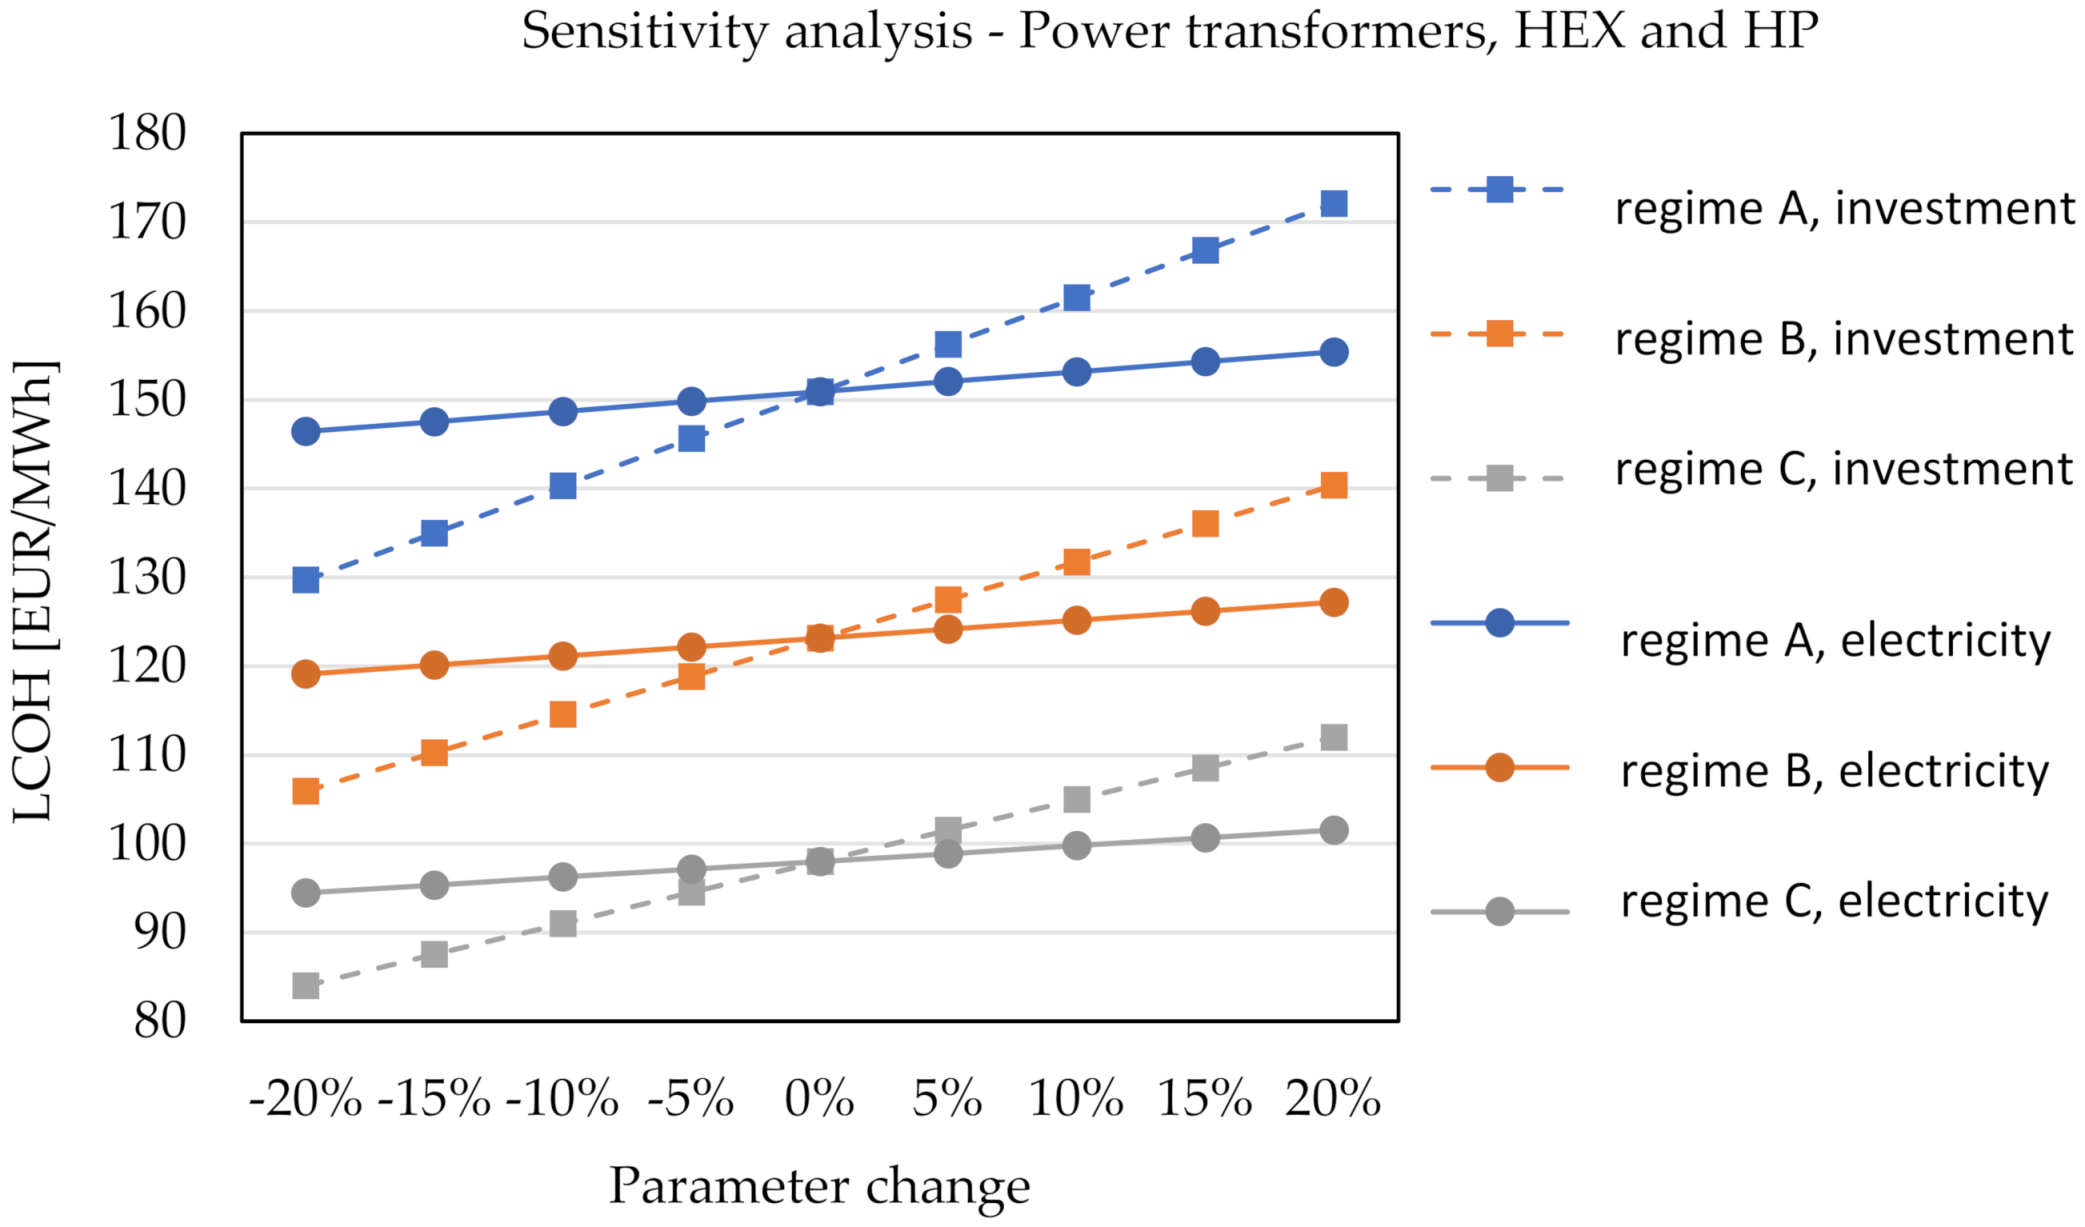
A similar analysis was carried out for power transformers waste heat source. Figure 25 shows the analysis carried out for the heat exchanger, while Figure 26 shows the sensitivity of LCOH if a heat pump is integrated. In the case of DH network temperatures, LCOH of waste heat utilization through a heat exchanger can reach around 120 EUR/MWh. However, in the case of temperature regime C, LCOH is not higher than 45 EUR/MWh. If a heat pump is added to the system, costs can increase even higher to 170 EUR/MWh. Once again, the investment cost shows significantly higher sensitivity than the specific investment. The reason behind this is the relatively high seasonal COP, even for high temperature levels of the network.

4. Discussion and Conclusions

Integration of waste heat sources into existing district heating networks is crucial to increase energy efficiency and decarbonize energy systems. Waste heat recovery was usually limited to high-temperature industrial processes. However, with the reduction of temperature regimes in the thermal networks, the new potential was unlocked in the shape of urban heat sources, such as data centers, supermarkets, power transformers, wastewater treatment plants, metro stations, and other tertiary buildings. In this paper, we have carried out an economic assessment of supermarket and power substation waste heat integration into existing district heating networks. We have focused on supermarkets and power transformers since they have excellent potential in terms of relatively constant hourly availability and high temperature. We developed an hourly merit order model based on pinch analysis, which considers both waste heat source and district heating network temperature regimes. We proposed two utilization technologies: Heat exchangers and heat pump. By carrying out a series of simulations with different connection pipe sizes, we have obtained an optimal connection capacity for each waste heat source and thermal network temperature regime. We have selected one supermarket and power transformer substation in the city of Zagreb as the case study. The obtained results have shown that the optimal connection pipe size for supermarket waste heat source is DN 65 for high temperature regimes, while it is gradually increasing with the reduction of temperature regimes, reaching DN 100. On the other hand, the optimal connection capacity for power transformers waste heat source is between DN 65 and 80 and it is not that sensitive on temperature regimes. Cost analysis has shown that supermarkets are a relatively inexpensive waste heat source, with prices starting at 12 EUR/MWh and reaching 55 EUR/MWh if a heat pump is added. Reduction of temperature regimes has shown to not have a significant impact on the cost of heat. Due to the lower waste heat source temperatures, power transformers are a more expensive waste heat source, starting at 100 EUR/MWh and reaching 160 EUR/MWh for heat pump integration. However, the cost of heat can be significantly lowered with a reduction of thermal network temperatures reaching 40 and 101 EUR/MWh, depending on the utilization technology implemented. Finally, we have also carried out the sensitivity analysis, which has shown that investment cost change has a significantly higher impact than a change of electrical energy price.

Author Contributions

Conceptualization, methodology, writing—original draft, writing—final draft, H.D.; methodology, software, visualization, writing—final draft, K.Č.; visualization, writing—final draft, J.M.; writing—review and editing, supervision, T.P.; writing—review and editing, supervision, N.D. All authors have read and agreed to the published version of the manuscript.

Funding

This research was funded by the REWARDHeat (Renewable and Waste Heat Recovery for Competitive District Heating and Cooling Networks) Horizon2020 project, Grant Agreement number 857811.

Institutional Review Board Statement

Not applicable.

Informed Consent Statement

Not applicable.

Data Availability Statement

Not applicable.

Acknowledgments

We gratefully acknowledge the consortium of the REWARDHeat (Renewable and Waste Heat Recovery for Competitive District Heating and Cooling Networks) Horizon2020 project, Grant Agreement number 857811.

Conflicts of Interest

The authors declare no conflict of interest.

Appendix A

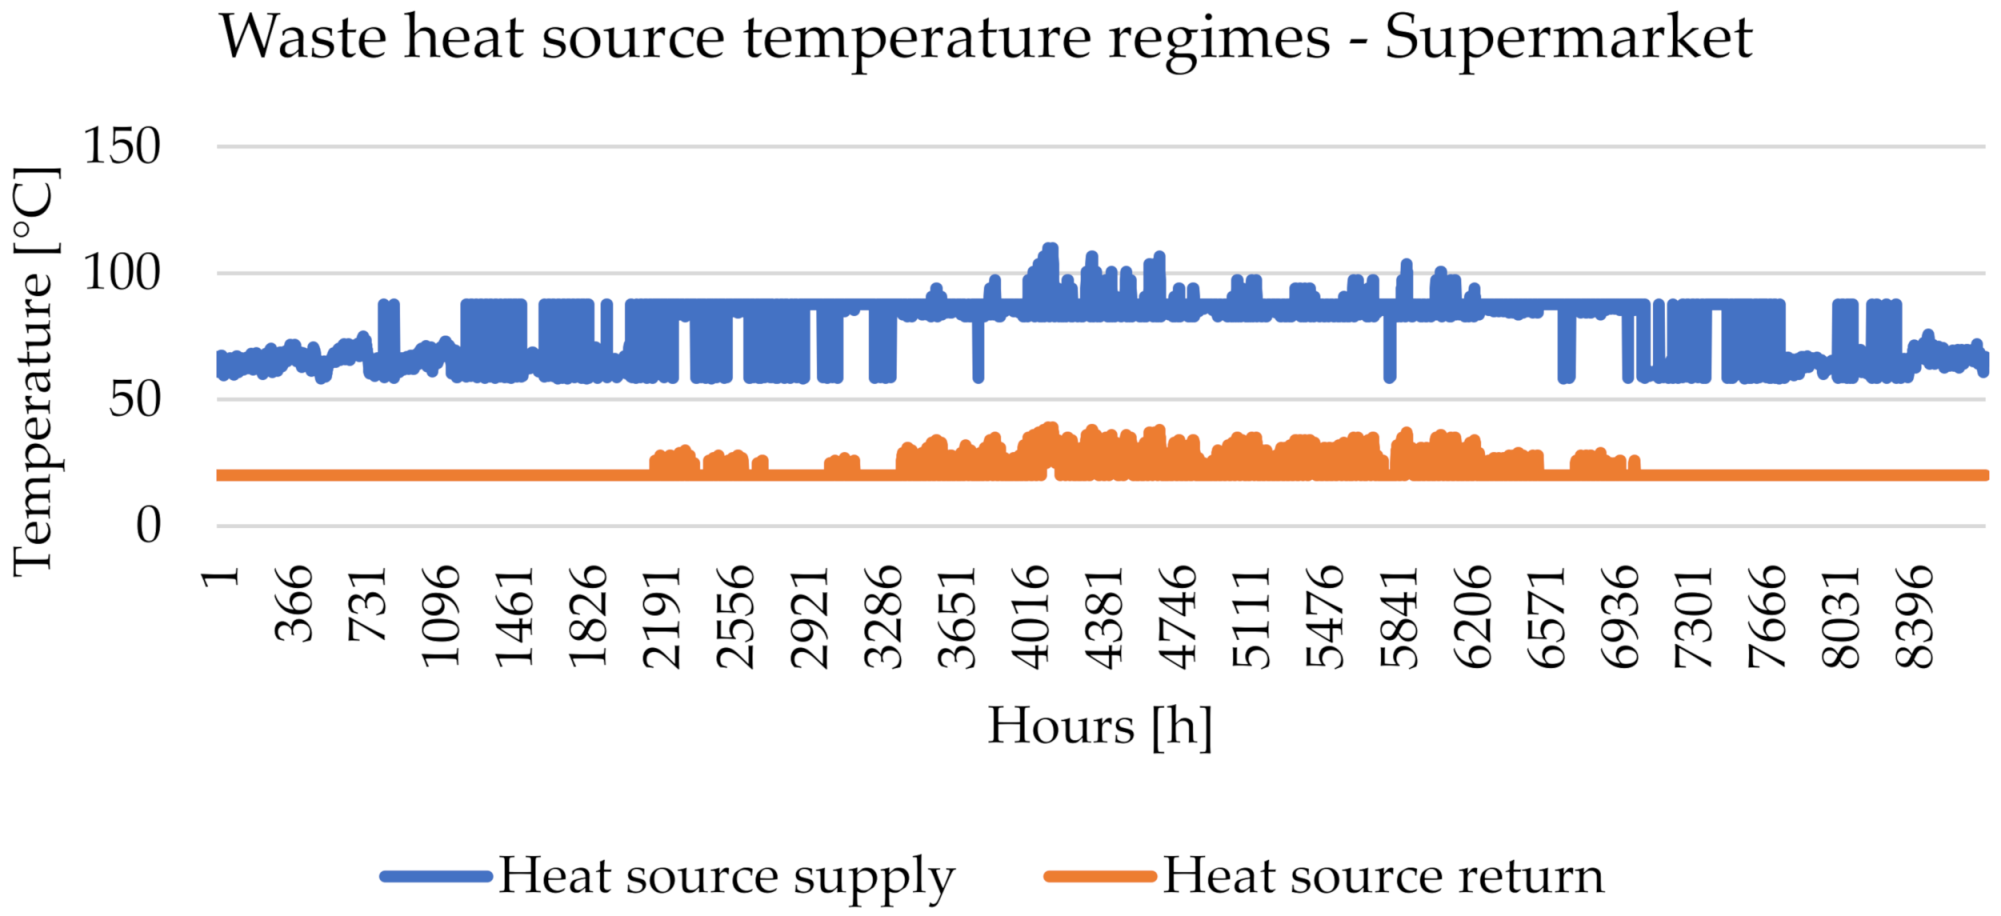
Figure A1. Waste heat temperature regimes—supermarket.
Energies 15 01666 g0a1
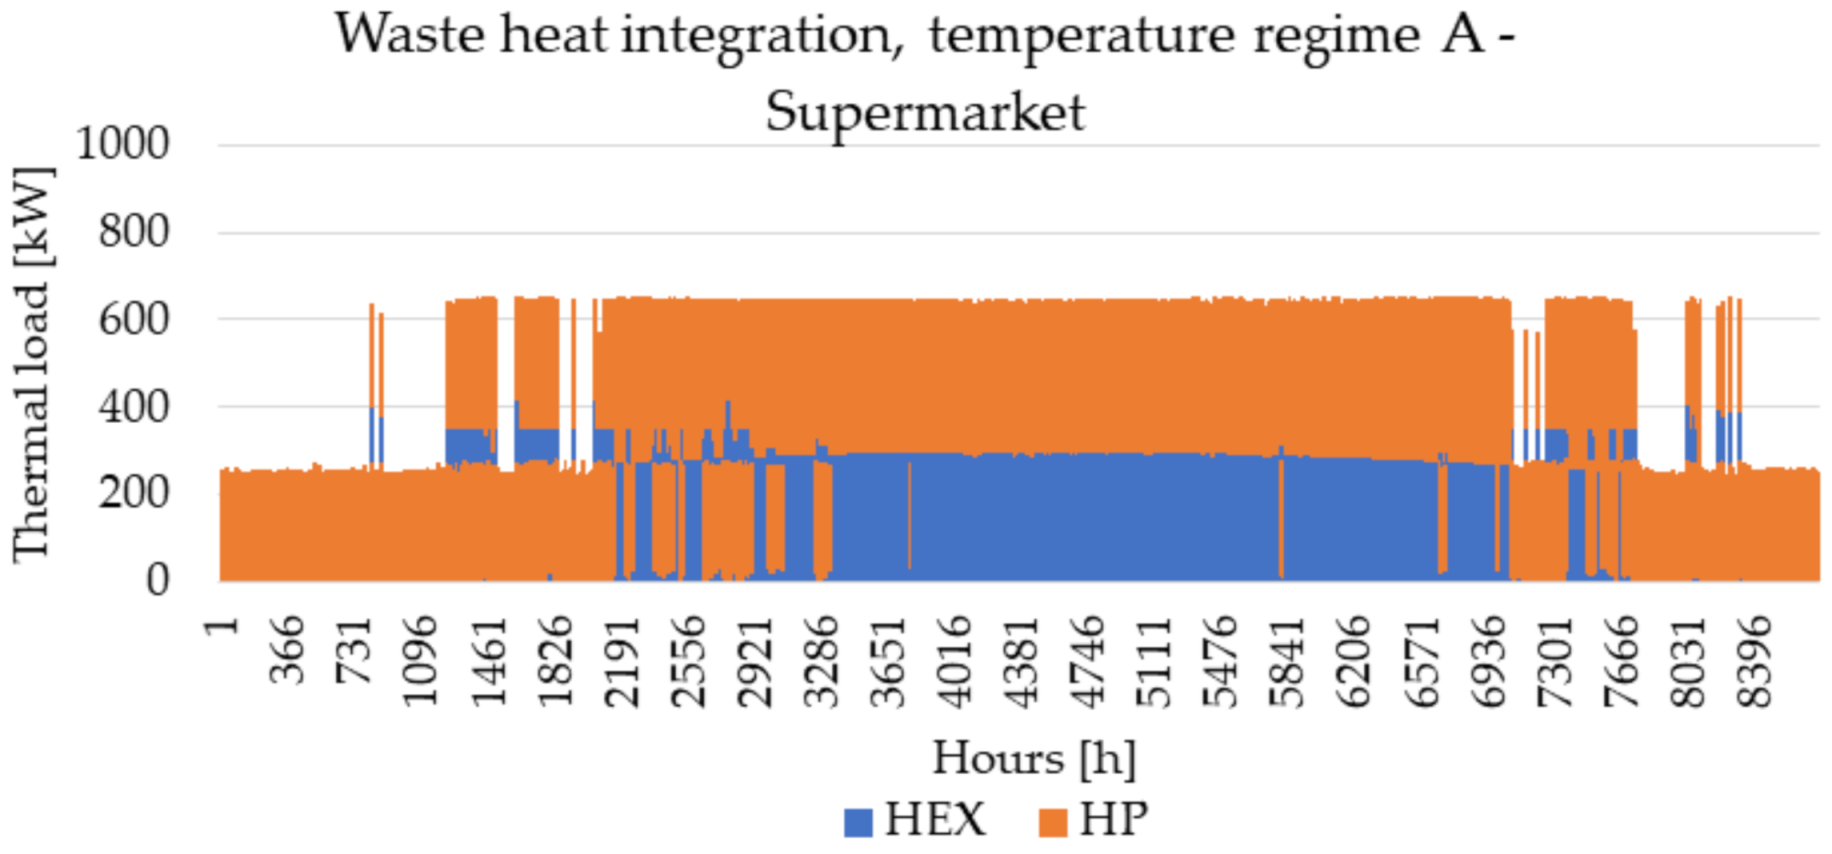
Figure A2. Waste heat utilization per technology, DH temperature regime A—supermarket.
Energies 15 01666 g0a2
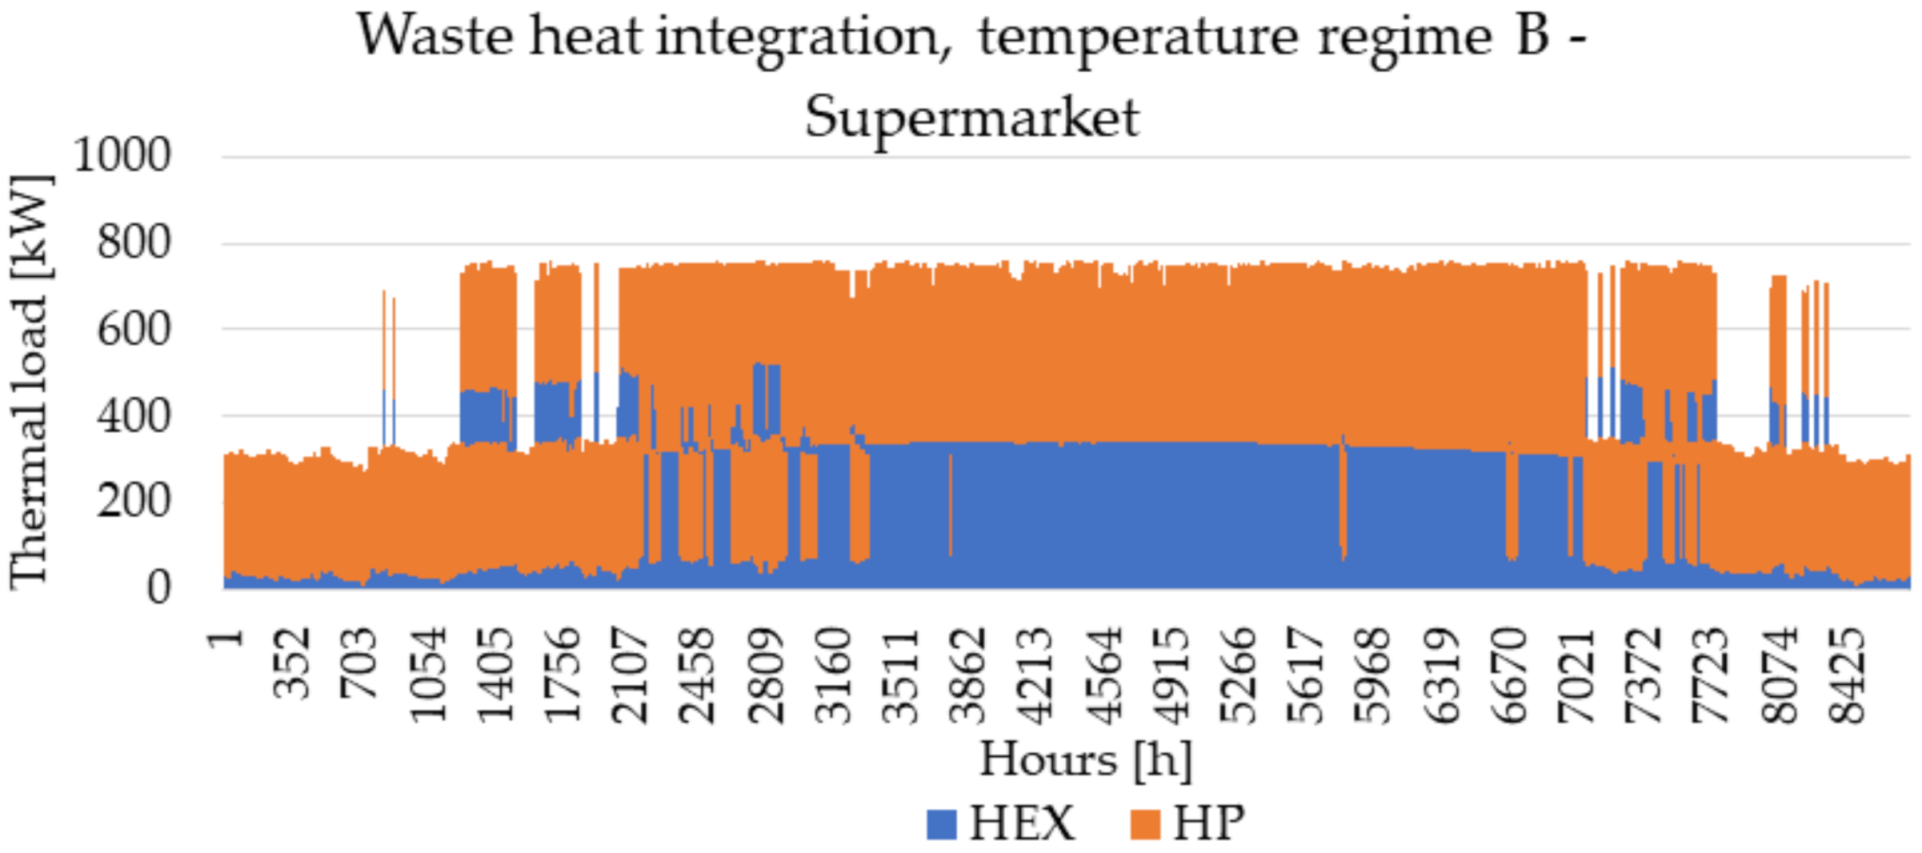
Figure A3. Waste heat utilization per technology, DH temperature regime B—supermarket.
Energies 15 01666 g0a3
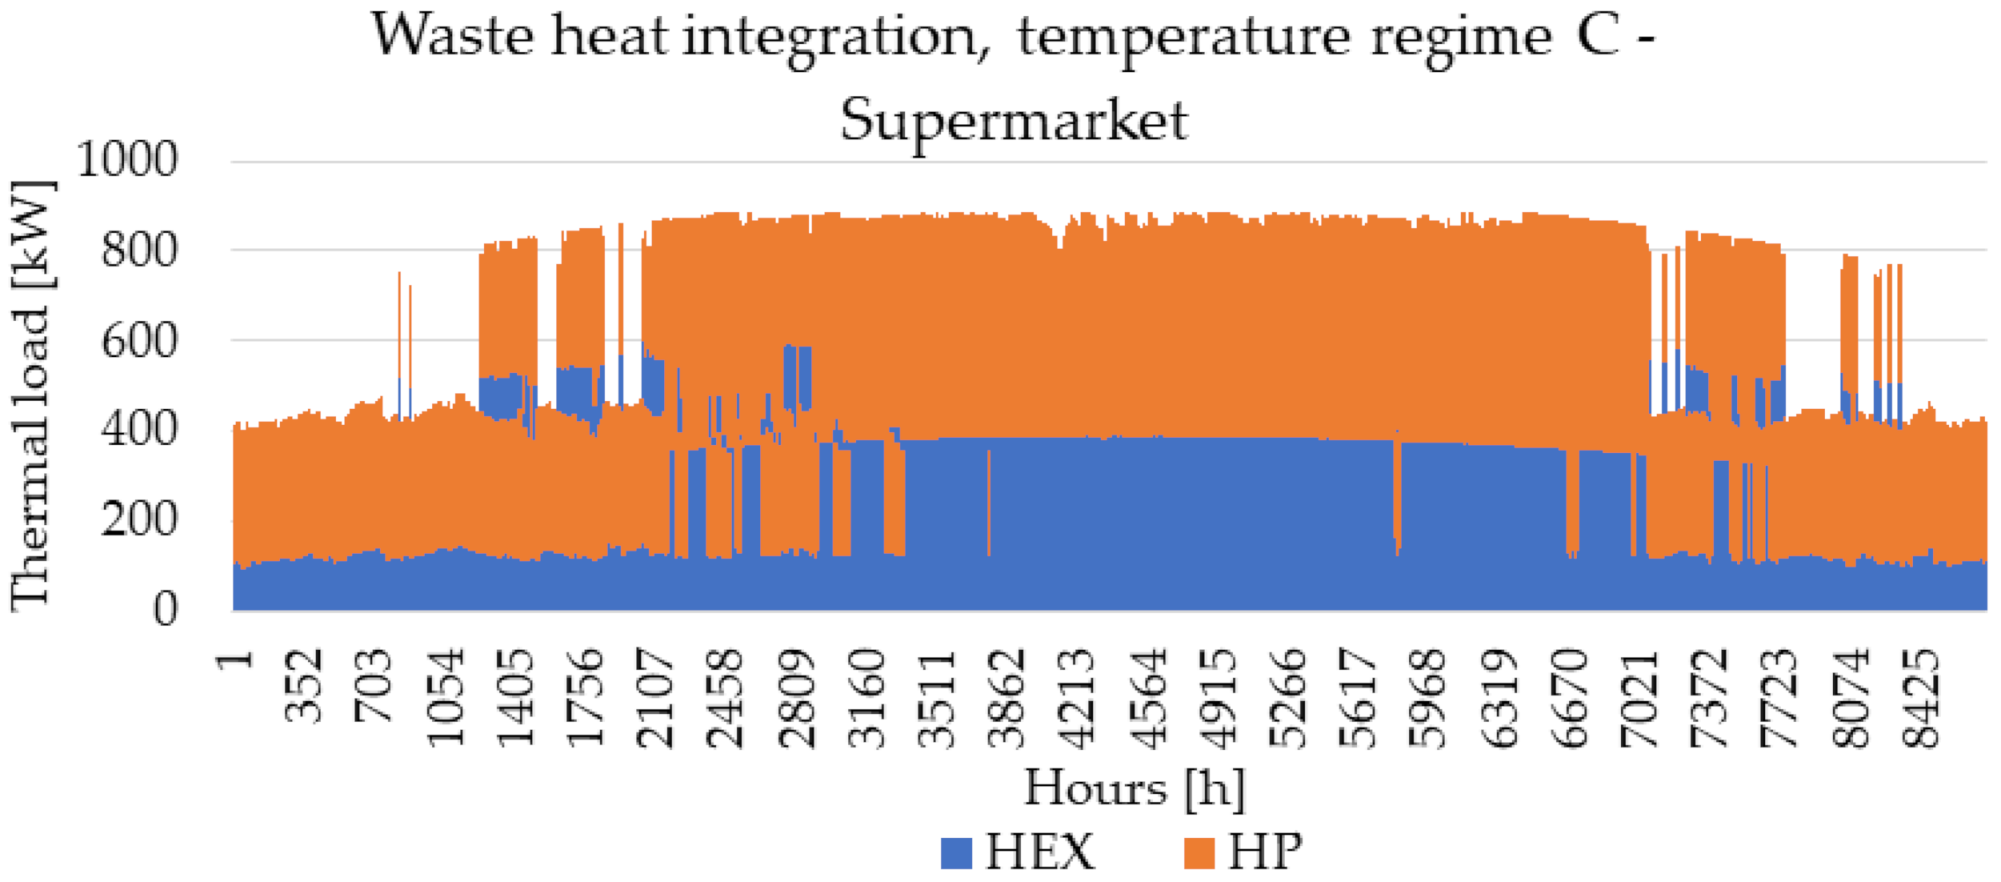
Figure A4. Waste heat utilization per technology, DH temperature regime C—supermarket.
Energies 15 01666 g0a4
Figure A5. Waste heat temperature regimes—power transformers.
Energies 15 01666 g0a5
Figure A6. Waste heat utilization per technology, DH temperature regime A—power transformers.
Energies 15 01666 g0a6
Figure A7. Waste heat utilization per technology, DH temperature regime B—power transformers.
Energies 15 01666 g0a7
Figure A8. Waste heat utilization per technology, DH temperature regime C—power transformers.
Energies 15 01666 g0a8

References

  1. Frederiksen, S.; Werner, S. District Heating and Cooling, 1st ed.; Studentlitteratur AB: Lund, Sweden, 2013. [Google Scholar]
  2. Mikulandrić, R.; Krajačić, G.; Duić, N.; Khavin, G.; Lund, H.; Mathiesen, B.V. Performance Analysis of a Hybrid District Heating System: A Case Study of a Small Town in Croatia. J. Sustain. Dev. Energy Water Environ. Syst. 2015, 3, 282–302. [Google Scholar] [CrossRef]
  3. Weiss, R.; Saastamoinen, H.; Ikäheimo, J.; Abdurafikov, R.; Sihvonen, T.; Shemeikka, J. Decarbonised District Heat, Electricity and Synthetic Renewable Gas in Wind- and Solar-Based District Energy Systems. J. Sustain. Dev. Energy Water Environ. Syst. 2021, 9, 2. [Google Scholar] [CrossRef]
  4. Sorknæs, P.; Østergaard, P.A.; Thellufsen, J.Z.; Lund, H.; Nielsen, S.; Djørup, S.; Sperling, K. The benefits of 4th generation district heating in a 100% renewable energy system. Energy 2020, 213, 119030. [Google Scholar] [CrossRef]
  5. Lund, H.; Duic, N.; Østergaard, P.A.; Mathiesen, B.V. Smart energy systems and 4th generation district heating. Energy 2016, 110, 1–4. [Google Scholar] [CrossRef] [Green Version]
  6. Lund, H.; Østergaard, P.A.; Chang, M.; Werner, S.; Svendsen, S.; Sorknæs, P.; Thorsen, J.E.; Hvelplund, F.; Mortensen, B.O.G.; Mathiesen, B.V.; et al. The status of 4th generation district heating: Research and results. Energy 2018, 164, 147–159. [Google Scholar] [CrossRef]
  7. Puschnigg, S.; Jauschnik, G.; Moser, S.; Volkova, A.; Linhart, M. A review of low-temperature sub-networks in existing district heating networks: Examples, conditions, replicability. Energy Rep. 2021, 7, 18–26. [Google Scholar] [CrossRef]
  8. Buffa, S.; Cozzini, M.; D’Antoni, M.; Baratieri, M.; Fedrizzi, R. 5th generation district heating and cooling systems: A review of existing cases in Europe. Renew. Sustain. Energy Rev. 2019, 104, 504–522. [Google Scholar] [CrossRef]
  9. Bilardo, M.; Sandrone, F.; Zanzottera, G.; Fabrizio, E. Modelling a fifth-generation bidirectional low temperature district heating and cooling (5GDHC) network for nearly Zero Energy District (nZED). Energy Rep. 2021, 7, 8390–8405. [Google Scholar] [CrossRef]
  10. Wirtz, M.; Kivilip, L.; Remmen, P.; Müller, D. Quantifying Demand Balancing in Bidirectional Low Temperature Networks. Energy Build. 2020, 224, 110245. [Google Scholar] [CrossRef]
  11. Penkovskii, A.; Stennikov, V.; Kravets, A. Bi-level modeling of district heating systems with prosumers. Energy Rep. 2020, 6, 89–95. [Google Scholar] [CrossRef]
  12. Postnikov, I. Methods for optimization of time redundancy of prosumer in district heating systems. Energy Rep. 2020, 6, 214–220. [Google Scholar] [CrossRef]
  13. Stennikov, V.; Penkovskii, A. The pricing methods on the monopoly district heating market. Energy Rep. 2020, 6, 187–193. [Google Scholar] [CrossRef]
  14. Østergaard, P.A.; Andersen, A.N. Booster heat pumps and central heat pumps in district heating. Appl. Energy 2016, 184, 1374–1388. [Google Scholar] [CrossRef]
  15. Balboa-Fernández, M.; de Simón-Martín, M.; González-Martínez, A.; Rosales-Asensio, E. Analysis of District Heating and Cooling systems in Spain. Energy Rep. 2020, 6, 532–537. [Google Scholar] [CrossRef]
  16. Simeoni, P.; Ciotti, G.; Cottes, M.; Meneghetti, A. Integrating industrial waste heat recovery into sustainable smart energy systems. Energy 2019, 175, 941–951. [Google Scholar] [CrossRef]
  17. Papapetrou, M.; Kosmadakis, G.; Cipollina, A.; La Commare, U.; Micale, G. Industrial waste heat: Estimation of the technically available resource in the EU per industrial sector, temperature level and country. Appl. Therm. Eng. 2018, 138, 207–216. [Google Scholar] [CrossRef]
  18. Al-Janabi, A.; Al-Azri, N. Effect of recovering the industrial waste heat in Oman on energy and environment. Energy Rep. 2020, 6, 526–531. [Google Scholar] [CrossRef]
  19. Varga, Z.; Palotai, B. Comparison of low temperature waste heat recovery methods. Energy 2017, 137, 1286–1292. [Google Scholar] [CrossRef]
  20. Miró, L.; Brückner, S.; Cabeza, L.F. Mapping and discussing Industrial Waste Heat (IWH) potentials for different countries. Renew. Sustain. Energy Rev. 2015, 51, 847–855. [Google Scholar] [CrossRef] [Green Version]
  21. Yuan, M.; Thellufsen, J.Z.; Sorknæs, P.; Lund, H.; Liang, Y. District heating in 100% renewable energy systems: Combining industrial excess heat and heat pumps. Energy Convers. Manag. 2021, 244, 114527. [Google Scholar] [CrossRef]
  22. Doračić, B.; Pavičević, M.; Pukšec, T.; Quoilin, S.; Duić, N. Utilizing excess heat through a wholesale day ahead heat market–The DARKO model. Energy Convers. Manag. 2021, 235, 114025. [Google Scholar] [CrossRef]
  23. Wheatcroft, E.; Wynn, H.; Lygnerud, K.; Bonvicini, G.; Leonte, D. The Role of Low Temperature Waste Heat Recovery in Achieving 2050 Goals: A Policy Positioning Paper. Energies 2020, 13, 2107. [Google Scholar] [CrossRef] [Green Version]
  24. Nielsen, S.; Hansen, K.; Lund, R.; Moreno, D. Unconventional Excess Heat Sources for District. Energies 2020, 13, 5068. [Google Scholar] [CrossRef]
  25. Ebrahimi, K.; Jones, G.F.; Fleischer, A.S. A review of data center cooling technology, operating conditions and the corresponding low-grade waste heat recovery opportunities. Renew. Sustain. Energy Rev. 2014, 31, 622–638. [Google Scholar] [CrossRef]
  26. Huang, P.; Copertaro, B.; Zhang, X.; Shen, J.; Löfgren, I.; Rönnelid, M.; Fahlen, J.; Andersson, D.; Svanfeldt, M. A review of data centers as prosumers in district energy systems: Renewable energy integration and waste heat reuse for district heating. Appl. Energy 2019, 258, 114109. [Google Scholar] [CrossRef]
  27. Oró, E.; Taddeo, P.; Salom, J. Waste heat recovery from urban air cooled data centres to increase energy efficiency of district heating networks. Sustain. Cities Soc. 2019, 45, 522–542. [Google Scholar] [CrossRef]
  28. Wahlroos, M.; Pärssinen, M.; Rinne, S.; Syri, S.; Manner, J. Future views on waste heat utilization–Case of data centers in Northern Europe. Renew. Sustain. Energy Rev. 2018, 82, 1749–1764. [Google Scholar] [CrossRef]
  29. Khosravi, A.; Laukkanen, T.; Vuorinen, V.; Syri, S. Waste heat recovery from a data centre and 5G smart poles for low-temperature district heating network. Energy 2021, 218, 119468. [Google Scholar] [CrossRef]
  30. Giunta, F.; Sawalha, S. Techno-economic analysis of heat recovery from supermarket’s CO2 refrigeration systems to district heating networks. Appl. Therm. Eng. 2021, 193, 117000. [Google Scholar] [CrossRef]
  31. Mateu-Royo, C.; Sawalha, S.; Mota-Babiloni, A.; Navarro-Esbrí, J. High temperature heat pump integration into district heating network. Energy Convers. Manag. 2019, 210, 112719. [Google Scholar] [CrossRef]
  32. Arnaudo, M.; Giunta, F.; Dalgren, J.; Topel, M.; Sawalha, S.; Laumert, B. Heat recovery and power-to-heat in district heating networks–A techno-economic and environmental scenario analysis. Appl. Therm. Eng. 2021, 185, 116388. [Google Scholar] [CrossRef]
  33. Gross, M.; Karbasi, B.; Reiners, T.; Altieri, L.; Wagner, H.-J.; Bertsch, V. Implementing prosumers into heating networks. Energy 2021, 230, 120844. [Google Scholar] [CrossRef]
  34. Maouris, G.; Escriva, E.J.S.; Acha, S.; Shah, N.; Markides, C.N. CO2 refrigeration system heat recovery and thermal storage modelling for space heating provision in supermarkets: An integrated approach. Appl. Energy 2020, 264, 114722. [Google Scholar] [CrossRef]
  35. Petrovic, S.; Bühler, F.; Radoman, U. Power transformers as excess heat sources. In Proceedings of the 32nd International Conference on Efficiency, Cost, Optimization, Simulation and Environmental Impact of Energy Systems (ECOS 2019), Wrocław, Poland, 23–28 June 2019. [Google Scholar]
  36. Trbusic, M.; Marusa, R.; Pihler, J.; Hamler, A. Utilization of dissipated heat of power transformers. Transform. Mag. 2019, 6, 84–93. [Google Scholar]
  37. Gilfanov, K.H.; Tien, N.; Gaynullin, R.N.; Hallyyev, I. Energy efficient heat supply system for electric power facilities. E3S Web Conf. 2019, 124, 01011. [Google Scholar] [CrossRef] [Green Version]
  38. Ninikas, K.; Hytiris, N.; Emmanuel, R.; Aaen, B. Recovery and Valorisation of Energy from Wastewater Using a Water Source Heat Pump at the Glasgow Subway: Potential for Similar Underground Environments. Resources 2019, 8, 169. [Google Scholar] [CrossRef] [Green Version]
  39. Ninikas, K.; Hytiris, N.; Emmanuel, R.; Aaen, B. The Performance of an ASHP System Using Waste Air to Recover Heat Energy in a Subway System. Clean Technol. 2019, 1, 154–163. [Google Scholar] [CrossRef] [Green Version]
  40. Guo, X.; Hendel, M. Urban water networks as an alternative source for district heating and emergency heat-wave cooling. Energy 2018, 145, 79–87. [Google Scholar] [CrossRef] [Green Version]
  41. Somogyi, V.; Sebestyén, V.; Domokos, E. Assessment of wastewater heat potential for district heating in Hungary. Energy 2018, 163, 712–721. [Google Scholar] [CrossRef]
  42. Nagpal, H.; Spriet, J.; Murali, M.; McNabola, A. Heat Recovery from Wastewater—A Review of Available Resource. Water 2021, 13, 1274. [Google Scholar] [CrossRef]
  43. Karampour, M.; Sawalha, S.; Arias, J. Eco-Friendly Supermarkets—An Overview; Report 2; Shecco: Bruxelles, Belgium, 2016; pp. 1–53. [Google Scholar]
  44. Meesenburg, W.; Christian, J.; Kruse, R.; Ali, Z.A. Flexible heat supply from supermarket refrigeration systems. In Proceedings of the SES Conference, Aalborg, Denmark, 6–7 October 2020. [Google Scholar]
  45. Uzbašić, I. Projekt Demonstracijskog Rashladnog Uređaja s Ugljikovim Dioksidom Kao Radnom Tvari. Ph.D. Thesis, Sveučilište u Zagrebu, Zagreb, Croatia, 2015. [Google Scholar]
  46. Liao, S.; Zhao, T.; Jakobsen, A. A correlation of optimal heat rejection pressures in transcritical carbon dioxide cycles. Appl. Therm. Eng. 2000, 20, 831–841. [Google Scholar] [CrossRef]
  47. Dorotić, H.; Pukšec, T.; Duić, N. Economical, environmental and exergetic multi-objective optimization of district heating systems on hourly level for a whole year. Appl. Energy 2019, 251, 113394. [Google Scholar] [CrossRef]
  48. Jensen, J.K.; Ommen, T.; Reinholdt, L.; Markussen, W.B.; Elmegaard, B. Heat pump COP, part 2: Generalized COP estimation of heat pump processes. Refrig. Sci. Technol. 2018, 2018, 1255–1264. [Google Scholar] [CrossRef]
  49. Best, I.; Orozaliev, J.; Vajen, K. Economic comparison of low-temperature and ultra-low-temperature district heating for new building developments with low heat demand densities in Germany. Int. J. Sustain. Energy Plan. Manag. 2018, 16, 45–60. [Google Scholar] [CrossRef]
  50. Cortella, G.; Lollini, R.; Noris, F.; D’Agaro, P.; Saro, O. Re-Conceptualizing Shopping Malls from Consumerism to Energy Conservation; Researchgate: Berlin, Germany, 2014; pp. 582–589. [Google Scholar]
  51. Majnarić, L. Procjena Ugroženosti Stanovništva, Materijalnih i Kulturnih Dobara i Okoliša od Katastrofa i Velikih Nesreća za Područje Grada Zagreba. Ph.D. Thesis, Karlovac University of Applied Sciences, Karlovac, Croatia, 2016. [Google Scholar]
  52. Hrvatska Elektroprivreda. Podaci za Izračun 2019. HEP. Available online: https://www.hep.hr/ods/opskrbljivaci/pravila-primjene-nadomjesnih-krivulja-opterecenja/podaci-za-izracun-2019/613 (accessed on 20 November 2021).
  53. Huld, T.; Müller, R.; Gambardella, A. A new solar radiation database for estimating PV performance in Europe and Africa. Solar Energy 2012, 86, 1803–1815. [Google Scholar] [CrossRef]
  54. Aromada, S.A.; Eldrup, N.H.; Normann, F.; Øi, L.E. Techno-Economic Assessment of Different Heat Exchangers for CO2 Capture. Energies 2020, 13, 6315. [Google Scholar] [CrossRef]
  55. Danish Energy Agency and Energinet, Technology Data for Generation of Electricity and District Heating, Copenhagen. 2020. Available online: https://ens.dk/en/our-services/projections-and-models/technology-data/technology-data-generation-electricity-and (accessed on 24 November 2021).
  56. Eurostat, Electricity Prices for Non-Household Consumers, Second Half 2020. 2021. Available online: https://ec.europa.eu/eurostat/statistics-explained/index.php?title=Electricity_price_statistics (accessed on 4 December 2021).
Figure 1. Method overview.
Energies 15 01666 g001
Figure 2. Time variable method overview.
Energies 15 01666 g002
Figure 3. Scheme of CO2 transcritical system.
Energies 15 01666 g003
Figure 4. Transcritical CO2 system represented in p–h diagram, for specified boundary conditions.
Energies 15 01666 g004
Figure 5. Temperature distribution in power transformer.
Energies 15 01666 g005
Figure 6. Heat utilization scheme: Heat exchanger (HEX) and booster heat pump (BHP).
Energies 15 01666 g006
Figure 7. Possible pinch analysis results: (A) No waste heat utilized; (B) only heat exchanger utilization; (C) only heat pump utilization; (D) both heat exchanger and heat pump utilization.
Energies 15 01666 g007
Figure 8. Overview of the pinch analysis procedure.
Energies 15 01666 g008
Figure 9. Booster heat pump scheme and overview of Lorenz efficiency parameters.
Energies 15 01666 g009
Figure 10. (Left) Utilized heat to the DH network in relation to the connection pipe diameter; (right) optimal DH network connection pipe diameter.
Energies 15 01666 g010
Figure 11. District heating temperature regimes.
Energies 15 01666 g011
Figure 12. Pinch analysis results—Scenario A. (A) BHP utilization; (B) BHP and HE utilization.
Energies 15 01666 g012
Figure 13. Waste heat from the supermarket refrigeration system injected into the DH network in relation to the connection pipe size, DH temperature regimes, and utilization technology. (Left) Heat exchanger; (right) heat pumps.
Energies 15 01666 g013
Figure 14. Optimal DH network connection pipe for supermarket refrigeration waste heat utilization concerning different DH network temperature regimes.
Energies 15 01666 g014
Figure 15. Seasonal COP and total supermarket refrigeration waste heat used concerning different DH network temperature regimes, for the selected connection pipe size.
Energies 15 01666 g015
Figure 16. Pinch analysis results—Scenario A. (A) BHP utilization; (B) HE utilization.
Energies 15 01666 g016aEnergies 15 01666 g016b
Figure 17. Waste heat from power substations injected into the DH network in relation to the connection pipe size, DH temperature regimes, and utilization technology: (Left) Heat exchanger; (right) heat pumps.
Energies 15 01666 g017
Figure 18. Optimal DH network connection pipe for power substation waste heat utilization in relation to different DH network temperature regimes.
Energies 15 01666 g018
Figure 19. Seasonal COP and total power substation waste heat utilized in relation to different DH network temperature regimes, for the selected connection pipe size.
Energies 15 01666 g019
Figure 20. Levelized cost of heat and connection distance for supermarket refrigeration waste heat and different utilization technologies—Scenario A: Heat exchanger and heat pump.
Energies 15 01666 g020
Figure 21. Levelized cost of heat and connection distance for power transformers waste heat and different utilization technologies—Scenario A: Heat exchanger and heat pump.
Energies 15 01666 g021
Figure 22. LCOH comparison for different DH network temperature regimes (connection distance 100 m) and utilization technology: (Left) Heat exchanger; (right) heat exchanger and heat pump.
Energies 15 01666 g022
Figure 23. Sensitivity analysis for different DH network temperature regimes—supermarkets waste heat, utilization technology heat exchanger.
Energies 15 01666 g023
Figure 24. Sensitivity analysis for different DH network temperature regimes—supermarkets waste heat, utilization technology heat exchanger and heat pump.
Energies 15 01666 g024
Figure 25. Sensitivity analysis for different DH network temperature regimes—power substation waste heat, utilization technology heat exchanger.
Energies 15 01666 g025
Figure 26. Sensitivity analysis for different DH network temperature regimes—power substation waste heat, utilization technology heat exchanger and heat pump.
Energies 15 01666 g026
Table 1. Labels in Figure 8.
LabelUnitDescription
T_DH_s°CSupply temperature of DH
T_DH_r°CReturn temperature of DH
fi_losskWAvailable heat after heat recovery
T_HS_1°CInlet temperature of heat sources
T_HS_2°COutlet temperature of heat sources
mcp_DHW/KDH–Thermal capacity
fi_HS_1kWInlet heat of heat sources
k_HSK/WInverse value of thermal capacity–HS
mcp_HSW/KHS–Thermal capacity
1_HSKTemperature drop of HS as a result of heat exchange
k_DHK/WInverse value of thermal capacity–DH
dT_pp Pinch temperature difference
T_HE_DH_1°CInlet temperature of HEX–DH side
T_HE_DH_2°COutlet temperature of HEX–DH side
fi_HE_DH_1WInlet heat of HEX–DH side
fi_HE_DH_2WOutlet heat of HEX–DH side
T_HE_HS_1°CInlet temperature of HEX–HS side
T_HE_HS_2°COutlet temperature of HEX–HS side
fi_HE_HS_1kWInlet heat of HEX
fi_HE_HS_1kWOutlet heat of HEX
Table 2. Referent supermarket refrigeration system data.
T L T   ( ° C ) p L T   ( bar ) T M T   ( ° C ) p M T   ( bar ) Φ L T   ( kW ) Φ M T   ( kW )
−3014.7−530.520123
Table 3. Referent power substation data.
U h   ( kV ) U l   ( kV ) S n   ( MVA ) Q k   ( kW ) Q 0   ( kW ) Q t o t   ( kW )
22023.86320036236
Table 4. Input data for district heating connection pipe.
LabelValueUnitName
c p 4187.00J kg−1 K−1Specific thermal capacity of water
ρ w 1000.00kg K−1Water density
w w 1.00m s−1Water flow rate
D N 25–150mmConnection pipe diameter
Table 5. Input data for techno-economic analysis.
LabelValueUnitName
d 0.10-Discount rate
n 20yearLife expectancy
γ 0.04-Part operative expenditures for HEX into an investment [54]
c BHP 1.24MEUR MW−1Specific price of BHP [55]
Φ BHP ,   nom -kWNominal power of BHP, from load duration of source
O & M fix 2.000EUR kWh−1Fixed operative expenditures for BHP [55]
O & M var 2.7EUR MWh−1Variable operative expenditures for BHP
E comp -MWhElectricity for BHP, from calculation
c e l e n 0.1EUR kWh−1Electricity price for non-households [56]
c HEX 0.26 · Φ H E X ,   n o m 0.1234 MEUR MW−1Specific price for HEX,
Φ HEX , nom nominal power for HEX
Publisher’s Note: MDPI stays neutral with regard to jurisdictional claims in published maps and institutional affiliations.