Article

Relationship between Countries’ Energy Indicators and the Indices of GVC Participation: The Case of APEC Member Economies

1
PRIMEC Publishers, Corner Lane 2, 117535 Moscow, Russia
2
Centre for Extra-curricular Professional Education, Primorskaya 32, 188800 Vyborg, Russia
3
Department of Management and General Humanitarian Disciplines, Lipetsk Branch of the Financial University under the Government of the Russian Federation, 12b International Street, 398050 Lipetsk, Russia
4
Academic Department of Management and Business Technologies, Plekhanov Russian University of Economics, Stremyanny Lane 36, 117997 Moscow, Russia
5
Faculty of Engineering Economics and Management, Non-Profit Limited Company “Karaganda Technical University”, 56, Nursultan Nazarbayev Avenue, Karaganda 100012, Kazakhstan
*
Author to whom correspondence should be addressed.
Energies 2022, 15(5), 1675; https://doi.org/10.3390/en15051675
Submission received: 6 January 2022 / Revised: 16 February 2022 / Accepted: 18 February 2022 / Published: 23 February 2022
(This article belongs to the Special Issue Economy, Social Policy and Forecast Analysis in Energy Industry)

Abstract

:
In the 21st century the importance of global value chains continues to grow. There is a scientific gap in the research on the relationship between countries’ energy indicators and the GVC participation indices. Based on the analysis of the APEC member economies’ GVC participation, the presence of quantifiable links between the countries’ energy indicators and GVC participation indices was identified. APEC member countries have a higher index of forward GVC participation compared to a rather low index of backward participation. We have confirmed the following hypotheses. Countries with higher energy consumption and countries exporting fuel have higher forward GVC participation. Energy importing countries and countries with higher energy intensity have higher backward GVC participation. Countries with higher energy intensity have lower forward GVC participation than countries with lower energy intensity. It was concluded that concerted efforts of APEC member economies are needed to increase GVC sustainability and develop unified energy policy standards. Managerial implications of energy efficient and sustainable GVCs will include competitive advantages growth for all the countries and suppliers participating in a particular GVC.

1. Introduction

Global value chains (hereinafter GVCs) are a substantial part of international trade, economic integration, and globalization. Amidst the liberalization of foreign economic activity and trade barriers reduction taking place in the 21st century, GVCs importance continues to increase. At the same time, companies operating in international markets, participating in the GVCs, tend to organize their production in those countries and regions where production costs may be lower [1].
In spite of the fact that there is a lot of research concerning the GVC participation indices and factors influencing GVCs, not many studies can be found devoted to the relationship between energy indicators and participation in GVCs.
The purpose of the study is to determine the relationship between countries’ energy indicators and the GVC participation indices.
To conduct further research, the hypotheses should be formulated (Table 1).
The rest of this paper is as follows. Section 2 is a literature review. Section 3 provides the information base and research methods. Section 4 presents an analysis of APEC member economies’ positions in the World Energy Trilemma Index, an assessment of APEC member economies participation in the GVCs, confirmation of the relationships between countries’ energy indicators and the GVC participation indices, as well as research results discussion. Section 4 presents the conclusions, concerning the authors’ opinion that it is necessary for APEC economies to make concerted efforts aimed at increasing the GVCs.
The main contribution of this study can be summarized as follows. It has been determined that there is a relationship between countries’ energy indicators and the GVC participation indices.

2. Literature Review

Over the past almost 40 years, countries’ participation in GVC has been deeply studied.
Michael Porter’s fundamental work, “Competitive Advantage: Creating and Sustaining Superior Performance”, first published in 1985, can be considered as a reference point in the GVC study. According to Porter (1985) [2,3], the GVC ultimate goal is to gain a competitive advantage over competitors in the market.
Firstly, there is a lot of research devoted to the GVC participation indices. Koopman et al. (2010) introduced the GVC participation index, particularizing that it is necessary to differentiate between backward and forward participation [4]. Johnson and Noguera (2012), and Stehrer et al. (2012) continued Koopman’s research and suggested the measures of GVC participation and GVC position [5,6]. Backward and forward GVC participation analysis, studies of the GVCs determinant and peculiarities, as well as an estimation of particular countries participation in GVCs were conducted in the research by Kowalski et al. (2015) [7], Baldwin and Lopez-Gonzalez (2013) [8], and Sidorova (2018) [9]. In particular, Sidorova (2018) wrote that for successful integration of a country into the GVC, it is necessary to reconsider the priorities of state industrial and economic policy [9].
Secondly, there are a lot of research papers concerning various factors influencing GVCs, especially economic integration and preferential trade agreements. Van der Marel (2015) has researched the variables that have an influence on GVC participation, systemizing them in three groups: structural forces and endowments (market size, GDP, GDP per capita, etc.); traditional trade and regulatory barriers (trading across borders, doing business, trade barriers, etc.); and new issue areas (FDI restrictions, innovation climate, etc.) [10]. Van der Marel found the positive impact of GDP per capita and the negative impact of market size (population), FDI restrictions, and trading across borders on backward GVC participation [10]. European Union integration and its GVCs particularities were studied by Amador, Cappariello, and Stehrer (2015) who found substantial heterogeneity between countries in the evolution of GVCs and made the conclusion that the high relevance of GVCs in the euro area is accompanied by their comparatively stronger resilience in the face of trade collapse [11]. Continuing the above-mentioned research, Amador and Cabral (2016) summarized general drivers of GVC participation, such as lowering the trade and investments costs, trade and investment liberalization, regional trade blocs (integration), EU enlargement, and technological development [12]. Another research paper for the EU-28 conducted by Kersan-Škabić (2019) showed that lack of GVC participation, GDP per capita, or GDP growth rate have a positive and significant impact on GVC participation; wages, and profit tax rates have a negative impact [13]. According to Casella, Bolwijn, Moran, and Kanemoto (2019), the relevance of GVC data for the analysis of globalization patterns, particularly at the intersection between trade, investment, and development, is obvious [14]. Some other research has discussed the relationship between preferential trade agreements and GVCs, in this case studies by Antras and Staiger (2012), Baldwin (2008, 2012) [15,16,17] should be mentioned. They explained the development of supply-chain trade and found it very regionalized, supported by a combination of deep regional trade agreements (RTAs), bilateral investment treaties (BITs), and unilateral reforms by developing countries, mostly accomplished outside the World Trade Organization (hereinafter WTO). Continuing the study of the relationship between preferential trade agreement and participation in GVCs, Osnago, Rocha, and Ruta (2015) found that the coefficient of the interaction term between depth of preferential trade agreement and participation in GVCs is consistently positive and significant across specifications, using different variables of depth and provisions. They concluded that deep preferential trade agreements have a larger impact on GVC-intensive sectors [18]. Moreover, Ruta (2017) introduced a trust dilemma that characterizes the relationship between preferential trade agreements and GVCs where countries can choose between four different strategies that go from a situation of no preferential trade agreement and no participation in GVCs (national production and no agreements) to GVCs and deep integration [19]. Lastly, Ignatenko, Raei, and Mircheva (2019) found that GVC-related trade, rather than conventional trade, has a positive impact on income per capita and productivity; however, there is large heterogeneity and the gains appear more significant for upper-middle and high-income countries [1].
Thirdly, several researches are focused on supply chain sustainability or resilience. At the international level, the standard ISO 28002:2011 “Security management systems for the supply chain—Development of resilience in the supply chain—Requirements with guidance for use” is accepted. In 2004, as a basis for the sustainability of supply chains, Lee proposed the Triple-A approach: Triple-A = Agility + Adaptability + Alignment. According to Lee (2004), the most successful, i.e., sustainable, are the companies whose supply chains have such characteristics as dynamism, adaptability, and alignment [20] (pp. 102–112). It should be mentioned that in 2003, the sustainability of the supply chain was defined as the ability to respond to unexpected failures and restore the normal operation of the supply chain [21] (pp. 22–30). Rice and Caniato (2003) considered that in today’s business environment, we need a supply network that has comprehensive security processes and procedures in place and is resilient enough to bounce back from any disruptions that do happen [21] (pp. 22–30). Another approach to GBC sustainability was suggested by Ponomarov and Holcomb (2009) who described sustainability as the adaptive ability of supply chains to prepare for unexpected events, respond to failures, and recover from them, maintaining the continuity of operations at the desired level of connectivity and control over structure and functions. According to Ponomarov and Holcomb, supply chain disruptions have adverse effects on both revenue and costs. Resilient supply chains incorporate event readiness, are capable of providing an efficient response, and often are capable of recovering to their original state or even better, post the disruptive event [22] (pp. 124–143). Day (2014) adheres to a similar interpretation, while including in it the need to predict risk and minimize its impact. A complex adaptive supply network (CASN) lens was also suggested, which is used to frame what existing literature has uncovered regarding disaster relief efforts, showing how relief organizations, their interactions, and their environmental context help determine the level of resilience that supply networks experience following disasters. This CASN characterization is leveraged to help explain why traditional supply chain management practices lead to varied results in disaster relief [23] (pp. 1970–1988). Thus, due to Liao and Fan Ziyang (2020), supply chain visibility is crucial to understanding the impact of disruption [24]. According to Miroudot (2020), in times of a pandemic, it may be premature to call for the end of GVCs or to conclude that shorter supply chains would be less vulnerable. Thereby, the relationship between GVCs and resilience or robustness in the supply of inputs is more complicated than it looks. Thus, policies in the future should support business efforts to build more robust and resilient supply chains, and not add to health and other dangers a policy risk built on misconceptions about GVCs [25]. In our opinion, the concept of GVC resilience, or the strength of an economy or a regional grouping against systemic risks, introduced by Sangaraju and Bayhaqi (2020), is of particular importance. The GVC resilience is considered as the inverse value of risk: a range of factors determining the ability of an economy to respond to risks, limit their economic and social consequences, and restore the state of the value chain at the pre-crisis level [26].
Fourthly, there are several research studies concerning the role of energy indicators in sustainability and sustainable development. The role of energy indicators for tracking sustainability in developing countries was examined Kemmler and Spreng (2007) [27]. Furthermore, Taylor et al. (2017) particularized better energy indicators for sustainable development [28], and Perea-Moreno and Hernandez-Escobedo (2021) conducted analysis of advances in renewable energy and energy saving systems for the sustainable city [29]. Sustainability outlook of thermochemical-based second-generation biofuel production was presented by Meramo et al. (2021) [30]. Two more pieces of researches should be mentioned in this case. Haddad et al. (2021) identified a framework for assessing urban energy sustainability [31], and Aldhshan et al. (2021) discussed energy consumption and spatial assessment of renewable energy penetration and building energy efficiency [32].
Finally, there is a lack of research on the relationship between countries’ energy indicators and their participation in GVCs. Nevertheless, several studies concerning energy sustainability and value chains are of particular interest. First of all, the Energy Trilemma Index suggested by Mastepanov and Chigarev (2020) is of great importance in assessing the sustainability of national energy policy and the development of safe, equally accessible, affordable, and environmentally sustainable energy [33]. Another interesting study was conducted by Palekhov and Palekhova (2018) who clarified the specific features of the modern concept of energy efficiency, which is based on three core dimensions—energy security, energy equity, and environmental sustainability. This concept was considered as the basis for further development of GVCs, as an approach for assessing energy efficiency of their links, and for planning appropriate joint actions [34]. Elemental concepts utilized in the Global Production Networks (GPNs) literature such as those used in global commodity chain, global value chain, and supply chain research were described by Van de Graaf et al. (2016). Three case studies related to energy and global production systems—solar photovoltaics, shale gas, and salmon aquaculture—were detailed [35]. Continuing GVCs researches, Bamber, Guinn, and Gereffi (2014) made use of the global value chain framework to unpack the multiple issues and constraints facing Burundi’s electrical energy sector [36]. A GVC analytic framework to analyze the wind energy value chain in South Africa and its impact on localization of goods and services was utilized by Morris, Robbins, Hansen, and Nygard (2021) [37]. One more interesting model should be mentioned here. Sarkar Biswajit et al. (2021) suggested the multi-setup multi-delivery (MSMD) concept. The model’s goal is to show bioenergy’s effect to make a sustainable supply chain of biofuel and biogas [38]. Thus, supply chain management aims to integrate environmental thinking with efficient energy consumption into supply chain management. It includes a flexible manufacturing process, more product delivery to customers, optimum energy consumption, and reduced waste. Vandana Singh et al. (2021) considered a two-echelon supply chain, particularizing a producer and supplier with two-level trade-credit policies (TLTCP) with the optimum consumption [39]. A suitable way of smart production was proposed by Bhuniya Shaktipada et al. (2020). They concluded that selling price and energy consumption-dependent demand should be considered for producer and customer benefit [40]. Another interesting model was proposed by Lim Byeongho et al. (2020). It is a quantitative approach using a computational general equilibrium (CGE) model to estimate the effects of the reverse GVC factors on the global economy, trade, and energy market [41]. A robust analysis of the global supply chain and manufacturing costs for components of Organic Rankine Cycle (ORC) turboexpanders and steam turbines used in geothermal power plants undertaken by Akar et al. (2018) [42] is of particular interest as well. Lastly, Wu et al. (2020) studied the causality between participation in GVCs and renewable energy consumption [43].
In Table 2 the contribution of different authors to the study of GVCs is given. Table 2 describes the different research gap mentioned in the literature review.
From Table 2, it is clear that research on a relationship between countries’ energy indicators and the GVC participation indices has yet not been conducted. Moreover, Table 2 has helped us to highlight these research gaps.

3. Materials and Methods

Asia-Pacific Economic Cooperation (hereinafter APEC) member economies were used as an object of the study. APEC currently includes 21 member economies. They are as follows: Australia, Brunei Darussalam, Canada, Chile, China, Hong Kong SAR (China), Indonesia, Japan, the Republic of Korea, Malaysia, Mexico, New Zealand, Papua New Guinea, Peru, Philippines, the Russian Federation, Singapore, Chinese Taipei, Thailand, the United States of America, and Vietnam. APEC is one of the few international associations to which Taiwan has joined with the full approval of China (in our study it will be referred to as Chinese Taipei). Therefore, APEC adopted the term “member economy” instead of “member country” [44] (pp. 110–120).
The data of the World Bank (hereinafter World Bank), the World Trade Organization (hereinafter WTO), the World Economic Forum (hereinafter WEF), the International Monetary Fund (hereinafter IMF), the United Nations (hereinafter UN), the Organization for Economic Cooperation and Development (hereinafter OECD), the International Energy Agency (hereinafter IEA), etc., were used as the information base of the research.
Data from the international database TiVA (Trade in Value-Added) were used to assess the countries’ participation in the GVCs [45]. TiVA is a joint product of the OECD and the WTO. The first version included information on 40 countries with a low degree of detail by economic sectors. There were only 18 economic sectors in total. The latest version of TiVA–2016 covers 64 countries with details on 34 industries. TiVA is based on the OECD Inter-Country Input–Output (ICIO) model, which allows a number of important indicators characterizing the process of value-added creation to be determined, including: foreign value added in domestic final demand, domestic value added in foreign final demand, value-added share of total final demand by country and industry, value-added share of consumption by country and industry, value-added share of gross fixed capital formation by country and industry, etc. TiVA dynamic series begin in 1995; data are published with a significant time lag of up to 5 years [9] (pp. 71–80).
In the course of the research, the methods of chronological average, economic and mathematical modeling, and econometric methods of analysis were used. The statistical time series TiVA for the eleven-year period 2005–2015 were used as an information base.
In our methodology, we develop an approach to evaluate each individual country’s GVC participation, proposed by Sidorova [9] (pp. 71–80) and based on TiVA data for assessing countries’ backward and forward GVC participation indices and total GVC participation index. Our methodology is a continuation of the approach suggested by Baldwin and Lopez-Gonzalez [8] (pp. 1682–1721), who conducted an analysis of supply-chain independence and assessed the contribution of natural resources in GVCs.
Research methodology is as follows.
Two following indices are traditionally used to assess the participation of countries and regions in the GVC:
  • The share of foreign value added in total exports, which characterizes the backward GVC participation. A high share of foreign value added in exports allows a country to import the necessary resources for the production of exported goods, components, or services [46] (pp. 589–606);
  • The share of a country’s national (domestic) value added arising from its own exports (direct and indirect through the exports of other domestic industries) included in exports of other countries, i.e., the forward GVC participation. This is an indicator of the country’s value added that is not consumed directly at the export destination, but is re-exported. A high level of the GVC participation means that the country exports more intermediate goods and services used for the export of other countries [46] (pp. 589–606).
The sum of these two indices gives the country’s GVC participation index.
Four indicators were selected to confirm the hypotheses postulated in Introduction (Table 1):
  • GDP per unit of energy consumption (PPP USD per kg of oil equivalent). This indicator is the inverse of the GDP energy intensity;
  • Energy imports, net (% of energy use);
  • Fuel exports (% of merchandise exports);
  • Energy intensity level of primary energy (mJ/USD2011 PPP GDP).
Country’s participation in GVC is assessed based on the following indices:
  • Forward GVC participation index, %;
  • Backward GVC participation index, %.
The chronological average for each indicator and index is calculated for each particular country. The calculations were made for the eleven-year period 2005–2015. As an information base, the statistical time series TiVA, OECD/IEA are used.
Then, taking into account the obtained values of the chronological averages within each indicator, the APEC member economies are divided into two groups according to the following criteria:
  • In terms of GDP per unit of energy consumption, the value of 10 PPP USD per kg of oil equivalent was chosen. Economies with the value of GDP per unit of energy consumption more than 10 PPP USD per kg of oil equivalent are classified as “the economies with higher GDP per unit of energy consumption”. Economies with the value of GDP per unit of energy consumption less than 10 PPP USD per kg of oil equivalent are classified as “the economies with lower GDP per unit of energy consumption”.
  • According to net energy imports, a positive value of the indicator was chosen as a criterion. In this case, the country is an energy importer. On the other side, the country is an energy exporter if a negative value of net energy imports is observed.
  • According to fuel exports, the value of 10% of fuel exports in merchandise exports was chosen as a criterion. Countries for which the share of fuel exports in total merchandise exports exceeds 10% are classified as fuel exporting countries. Countries for which the share of fuel exports in total merchandise exports is less than 10% are classified in the group with a low share of fuel exports in total merchandise exports.
  • According to the energy intensity level of primary energy, the value of 5 MJ per USD2011 PPP GDP was chosen as a criterion. The level of energy intensity of primary energy shows the ratio between energy supply and gross domestic product. This ratio is measured by purchasing power parity. Energy intensity shows how much energy is required to produce one unit of economic output. The lower this ratio, the less energy is used to produce one unit of production. Accordingly, such production or economy is less energy intensive. Countries for which the energy intensity level of primary energy is less than 5 MJ per USD2011 PPP GDP are classified in the group of countries with low energy intensity. Countries for which the energy intensity level of primary energy is higher than 5 MJ per USD2011 PPP GDP are classified in the group of countries with high energy intensity.

4. Results and Discussion

4.1. Analyzing APEC Member Economies Positions in the World Energy Trilemma Index

First, it seems important to analyze the positions of the APEC member economies in the ranking on the World Energy Trilemma Index for 2020–2021 (Table 3). There are 127 countries represented in the 2021 ranking. Data for 19 APEC member economies are available (with the exception of Chinese Taipei and Papua New Guinea).
Since 2010, the World Energy Trilemma Index has been providing an independent and objective assessment of a country’s energy policy and its effectiveness, using proven global and country-specific data to assess governance on three main parameters: energy security, energy equity, and environmental sustainability.
Countries develop energy policies depending on their internal conditions due to various natural resources, geographical location, and socio-economic systems. This divergence of different systems and contexts means that there is no unified path for a successful energy transition. Each country needs to determine its own best way of energy policy instead, taking into account the national situation and priorities. This means that a direct comparison of countries’ rankings and scores may be less informative, but at the same time it can help start a conversation. Countries can and should learn from each other, finding out which policies work and why such policies can be successful in some contexts and not in others. The Global Energy Trilemma Index can help countries and stakeholders in the energy sector to identify in a continuous dialogue which areas of energy policy need to be improved. Studying the examples of other countries can help determine the most suitable options.
When calculating the Global Energy Trilemma Index, 31 indicators of the national energy policy efficiency are taken into account. These indicators are grouped in three dimensions [47,48]:
  • Energy security;
  • Energy equality;
  • Environmental sustainability.
Energy security assesses a country’s ability to meet current and future energy demand, and withstand and recover quickly from systemic shocks with minimal supply disruptions. This parameter takes into account the efficiency of internal and external energy sources management, as well as the reliability and sustainability of the energy infrastructure [33].
Energy equality makes it possible to assess a country’s ability to provide universal access to reliable, fairly priced, and abundant energy resources for domestic and commercial use. This parameter takes into account basic access to electricity and environmentally friendly fuels and technologies for cooking, access to energy consumption that ensure prosperity, as well as the availability of electricity, gas, and fuel [33].
Environmental sustainability of energy systems shows the possible transition of the country’s energy system to reduce and prevent potential environmental damage and the consequences of climate change. This parameter takes into account the productivity and efficiency of energy production, transmission and distribution, decarbonization, and atmospheric pollution [33].
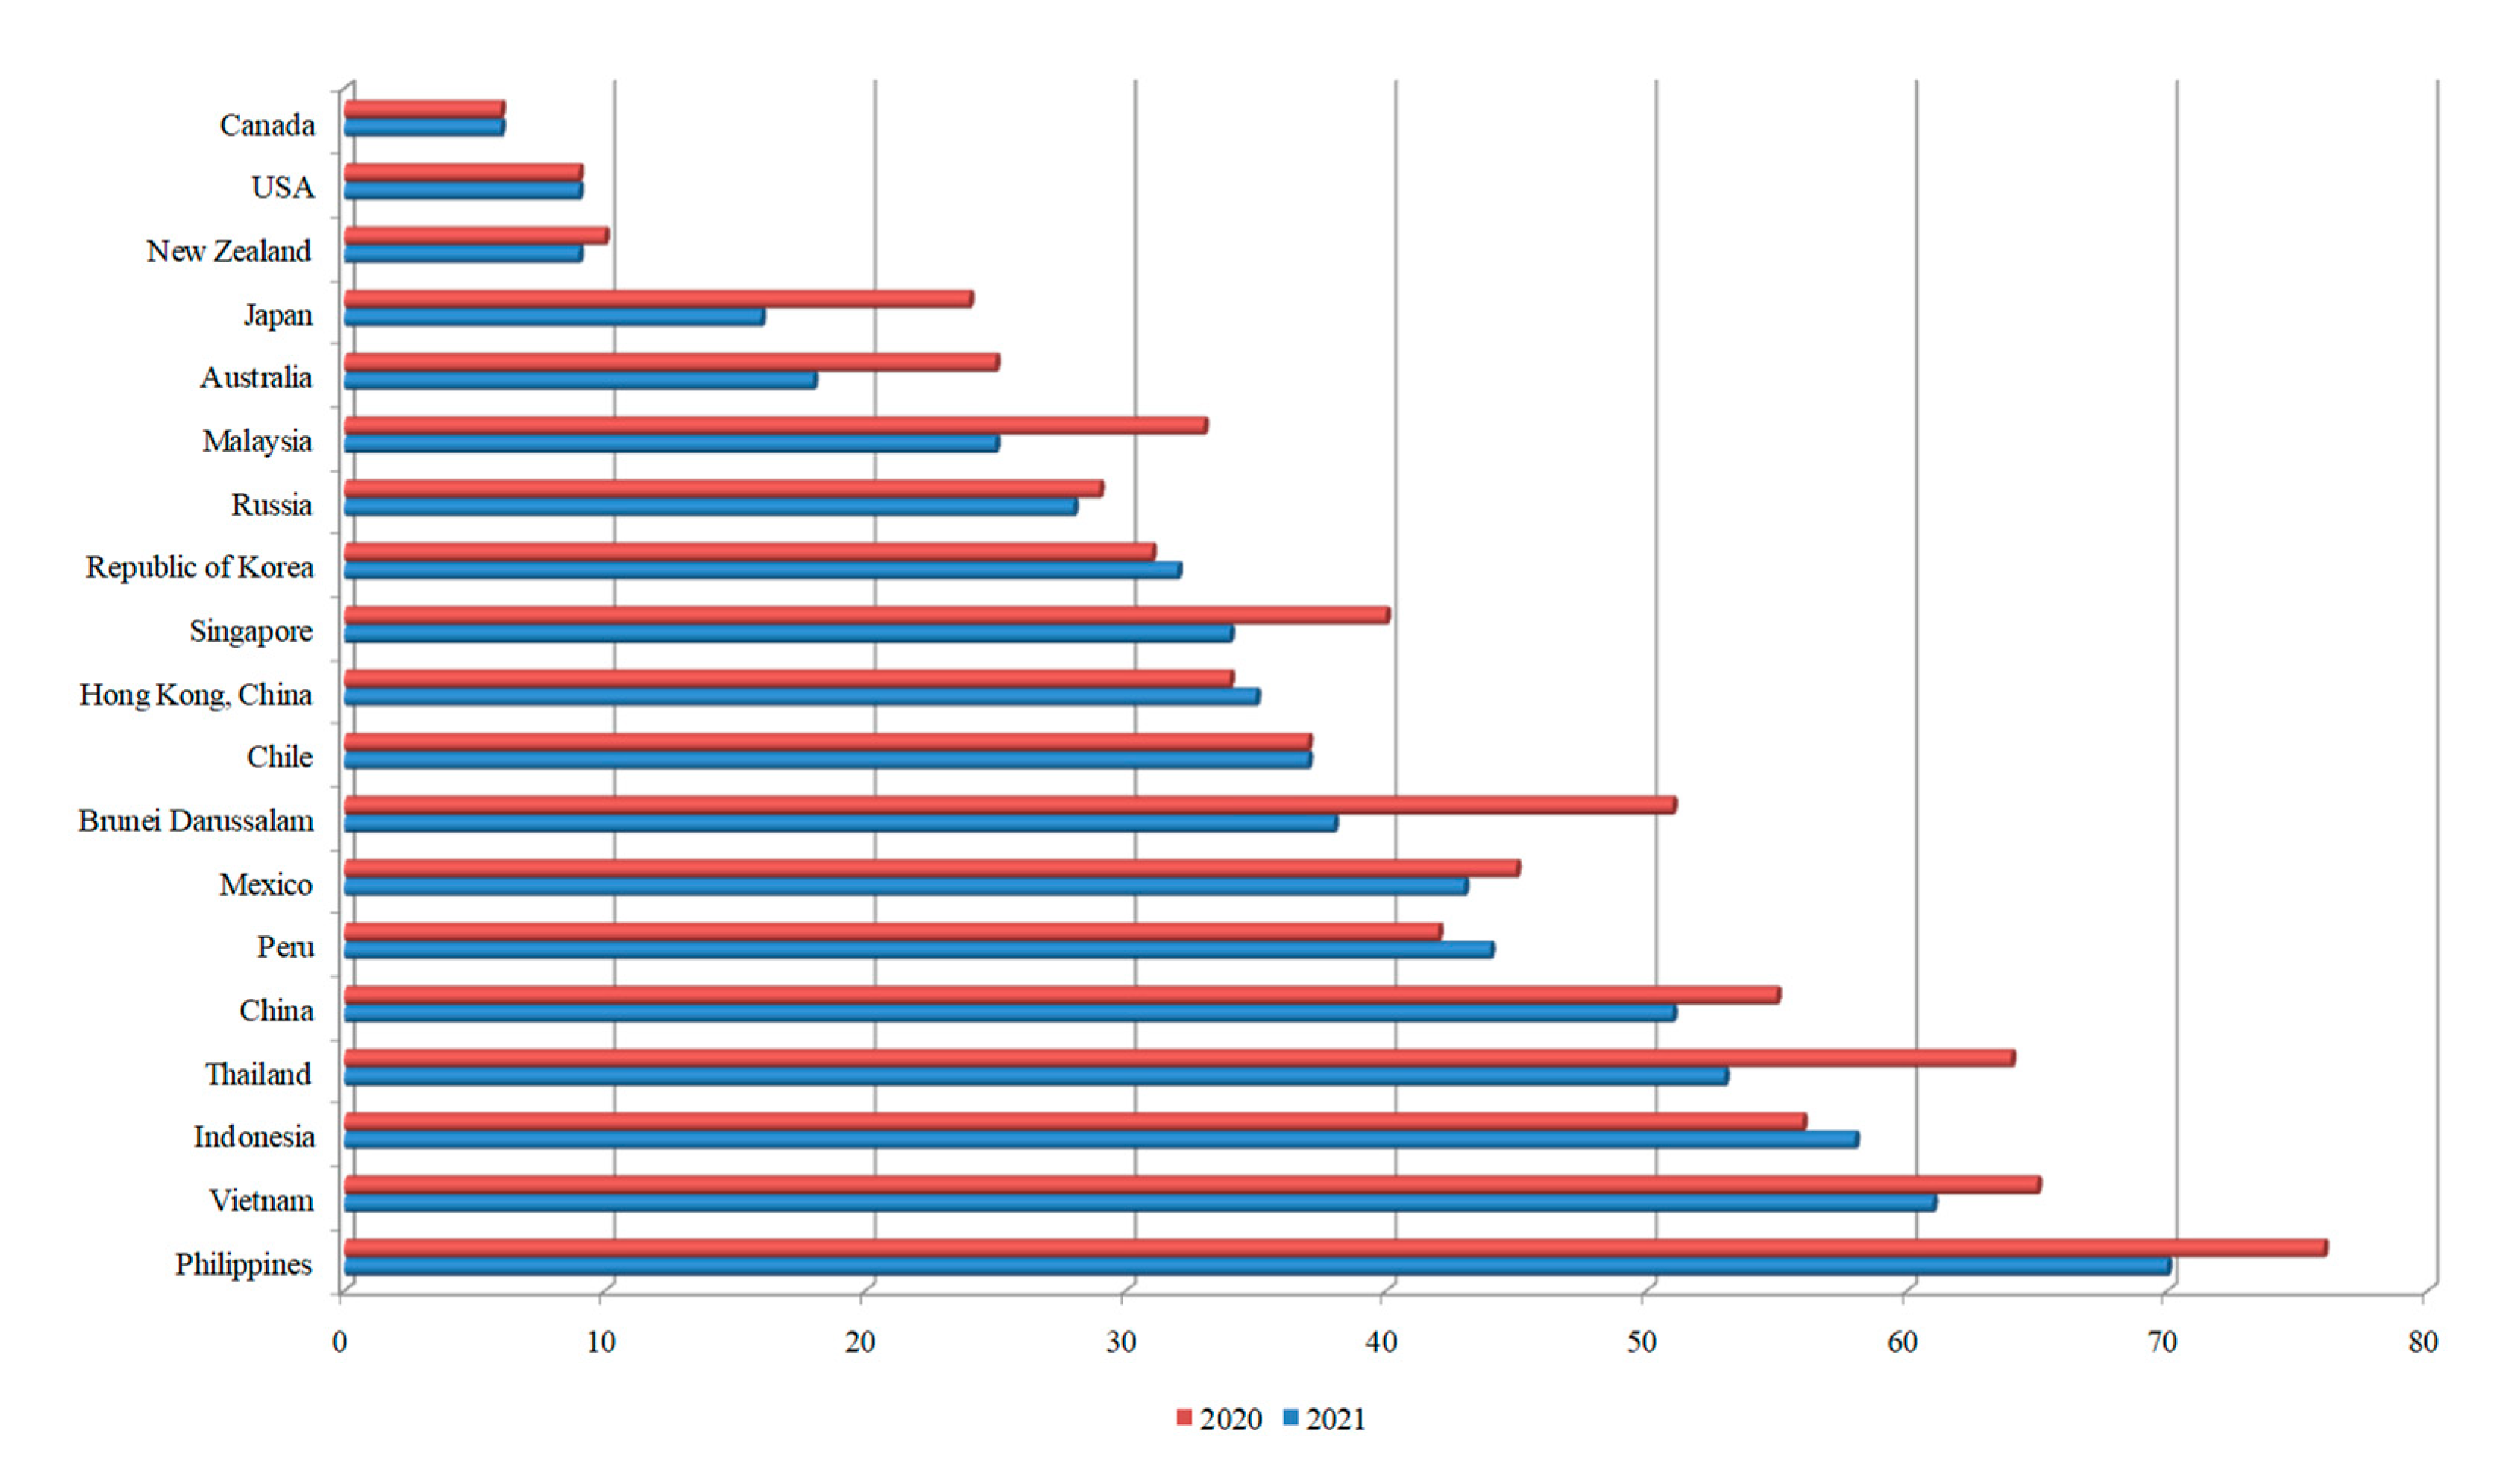
In the 2021 ranking, 127 countries were ranked in 101 positions. In the 2020 ranking, 128 countries were represented, occupying 108 positions. Among the APEC member economies, Canada (6), the USA (9), and New Zealand (9) entered the top ten countries in terms of energy policy efficiency in 2021 (Figure 1). China (51), Thailand (53), Indonesia (58), and Vietnam (61) are in the second half of the ranking. Twelve APEC member economies improved their positions in the ranking over the year: Brunei Darussalam rose by 13 positions, Thailand—by 11 positions, Malaysia and Japan—by 8, Australia—by 7, the Philippines and Singapore—by 6, China and Vietnam—by 4, Mexico—by 2, Russia and New Zealand—by 1. The positions of Canada (6), the USA (9) and Chile (37) remained unchanged. The Republic of Korea, Hong Kong SAR (China), Peru, and Indonesia dropped slightly down in the ranking.
Canada has been the leader of the ranking according to “Energy Security” for several years. This is facilitated not only by significant natural resources, but also by the consistent efforts of the Canada’s Government of to diversify its energy system. The United States is also in the top 10 countries, in the seventh position.
According to “Energy Equality”, the USA became the best of the APEC member economies in 2021 (eighth position). All countries that achieved greater energy equality are implementing progressive energy strategies aimed at encouraging investment in sustainable energy and electricity infrastructure and increasing diversification of energy sources as countries try to balance changing demand with the availability of energy resources. The countries leading in the direction of energy equality are developed countries, as well as the countries of the Arabian Peninsula, OPEC members, with well-established, stable, and complex energy systems and infrastructure. For developing countries, the challenge is to improve access to and affordability of energy to meet the growing demand for energy to support fast-growing economies.
According to “Environmental Sustainability”, none of the APEC member economies entered the top ten. Despite ongoing efforts to decarbonize energy production, ensuring continued progress in environmental sustainability remains a challenge. Countries that are improving their environmental sustainability are switching to renewable energy sources, such as wind and solar energy. APEC member economies, most of which are developing ones, are at different stages of industrialization. They continue to increase the use of mineral raw materials, fuels, and other non-renewable natural resources. Thus, the energy intensity of these economies continues to grow.

4.2. Indicators of APEC Member Economies’ Participation in Global Value Chains

To assess the participation of APEC member economies in the GVCs, the TiVA dynamic series for 10 years (2005–2015) will be used [45].
The following APEC member economies are in the lead in terms of the backward GVC participation: Vietnam, Singapore, Malaysia, Mexico, Thailand, South Korea, and Chinese Taipei. In these countries, during the time period under review, the share of foreign value added in total exports exceeded 30%. It is very significant that the countries of Southeast Asia are mainly represented among the leaders (Table 4). Thus, it can be concluded that now the GVCs begin in Asian countries and stretch to European states. However, in the future, this trend may change, and the GVCs finish in Asian countries [49] (pp. 263–272).
Concerning the forward GVC participation, over a ten-year period, the value of this index exceeded 30% on average in the five APEC member countries only. These are Brunei Darussalam, Russia, Peru, Chile, and Australia (Table 5). 
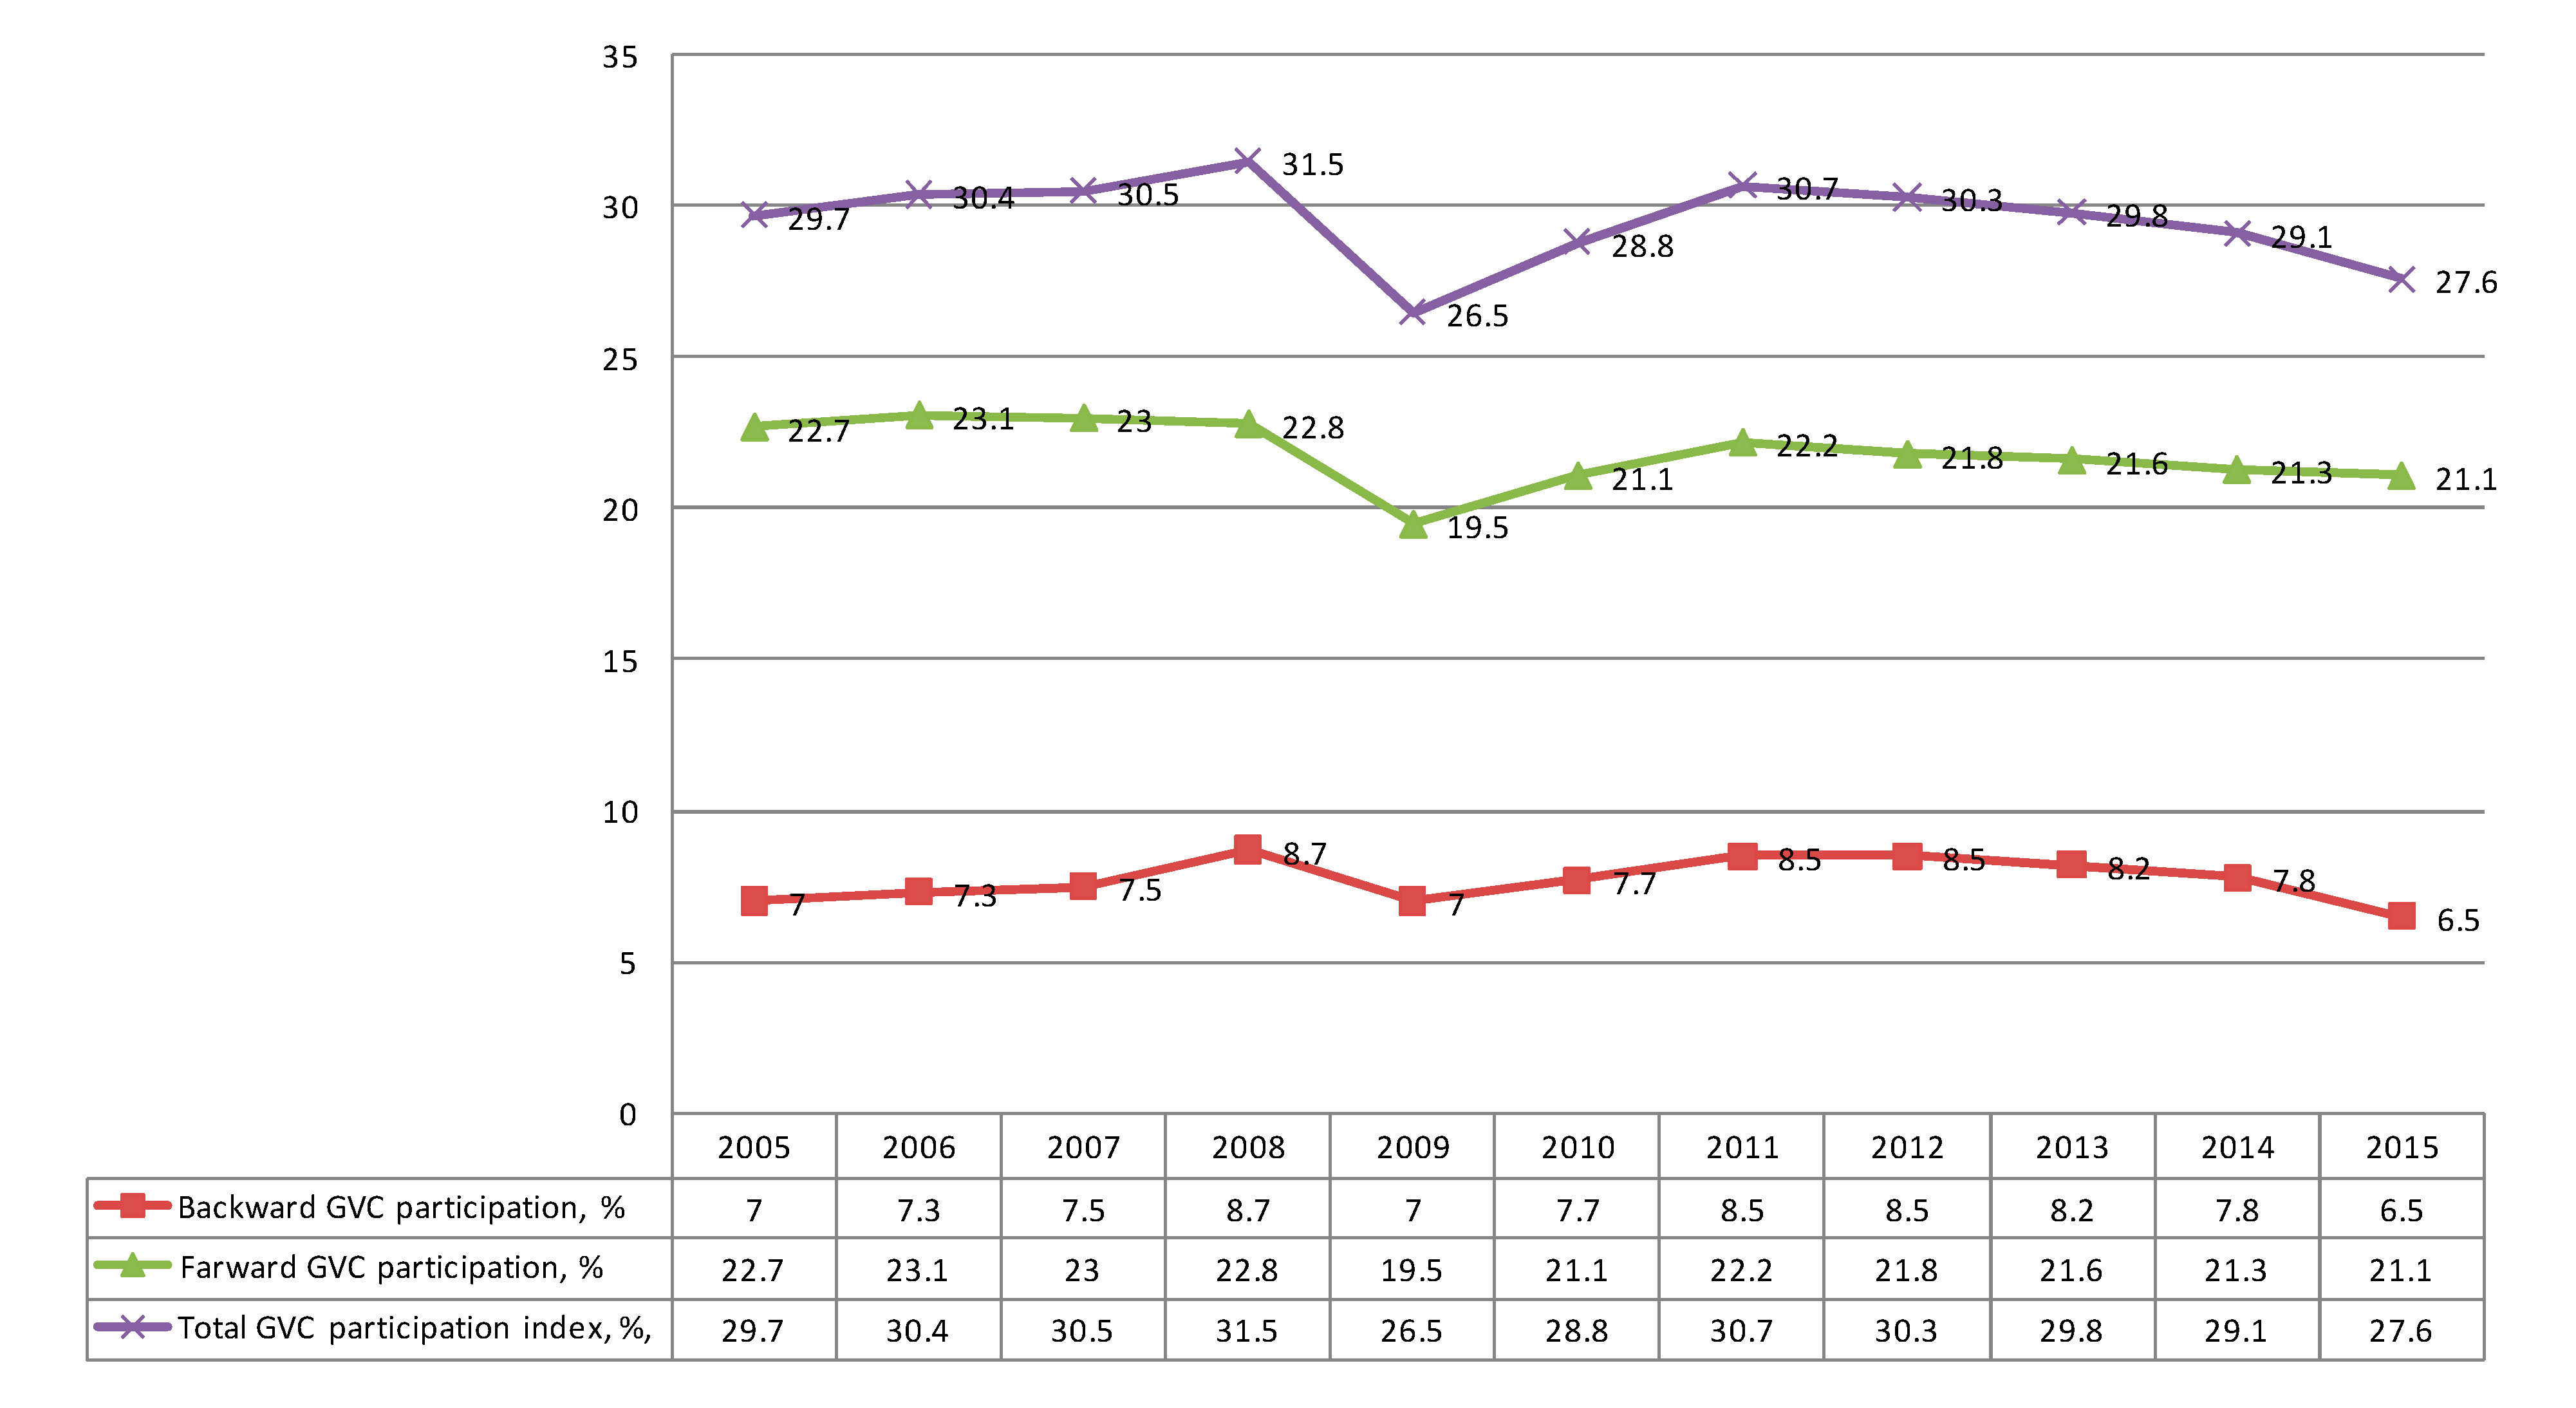
Figure 2 shows the dynamics of APEC’s cumulative participation in the GVCs. The consequences of the global financial crisis of 2009 for the GVCs in the APEC region can be seen in Figure 2 as well.

4.3. Determining the Relationships between Countries’ Energy Indicators and the GVC Participation Indices

This part of our research contains the hypotheses confirmation.
Hypothesis 1 (H1).
Countries with higher GDP per unit of energy consumption (PPP USD per kg of oil equivalent) have higher forward GVC participation.
To confirm the hypothesis, dynamic data series were used. The initial data are presented in Table A1 and in Table 5. The final results of the calculations are given in Table 6 and Table 7. APEC member economies with GDP per unit of energy consumption higher than 10 PPP USD per kg of oil equivalent (Table 6) have a forward GVC participation index equal to 23.2649629%. APEC member economies with GDP per unit of energy consumption less than 10 PPP USD per kg of oil equivalent (Table 7) have a forward GVC participation index equal to 21.3901517%.
23.2649629% > 21.3901517%.
The hypothesis is accepted.
Hypothesis 2 (H2).
Countries with lower GDP per unit of energy consumption (PPP USD per kg of oil equivalent) have higher backward GVC participation.
To confirm the hypothesis, dynamic data series were used. The initial data are presented in Table A1 and in Table 4. The final results of the calculations are given in Table 8 and Table 9. APEC member economies with GDP per unit of energy consumption higher than 10 PPP USD per kg of oil equivalent (Table 8) have a backward GVC participation index equal to 24.6805186%. APEC member economies with GDP per unit of energy consumption less than 10 PPP USD per kg of oil equivalent (Table 9) have a backward GVC participation index equal to 22.1793285%.
24.6805186% > 22.1793285%.
The hypothesis is rejected.
Hypothesis 3 (H3).
Energy importing countries have higher backward GVC participation.
To confirm the hypothesis, dynamic data series were used. The initial data are presented in Table A2 and in Table 4. The final results of the calculations are given in Table 10 and Table 11. APEC member economies—energy importers (Table 10) have a backward GVC participation index equal to 24.8790909%. APEC member economies—energy exporters (Table 11) have a backward GVC participation index equal to 21.16464646%.
24.8790909% > 21.16464646%.
The hypothesis is accepted.
Hypothesis 4 (H4).
Countries exporting fuel have higher forward GVC participation.
To confirm the hypothesis, dynamic data series were used. The initial data are presented in Table A3 and in Table 5. The final results of the calculations are given in Table 12 and Table 13.
APEC member economies—fuel exporters (Table 12) have a forward GVC participation index equal to 22.447475%. APEC member economies with low percentage of fuel exports in merchandise exports (Table 13) have a forward GVC participation index equal to 21.75091%.
22.447475% > 21.75091%.
The hypothesis is accepted.
Hypothesis 5 (H5).
Countries with higher energy intensity level of primary energy have lower forward GVC participation than countries with lower energy intensity level of primary energy.
To confirm the hypothesis, dynamic data series were used. The initial data are presented in Table A4 and in Table 5. The final results of the calculations are given in Table 14 and Table 15. APEC member economies with higher energy intensity level of primary energy (Table 14) have a forward GVC participation index equal to 19.539091%. APEC member economies with lower energy intensity level of primary energy (Table 15) have a forward GVC participation index equal to 24.90505222%.
19.539091% < 24.90505222%.
The hypothesis is accepted.
Hypothesis 6 (H6).
Countries with higher energy intensity level of primary energy have higher backward GVC participation than countries with lower energy intensity level of primary energy.
To confirm the hypothesis, dynamic data series were used. The initial data are presented in Table A4 and in Table 4. The final results of the calculations are given in Table 16 and Table 17. APEC member economies with higher energy intensity level of primary energy (Table 16) have a backward GVC participation index equal to 24.417013%. APEC member economies with lower energy intensity level of primary energy (Table 17) have a backward GVC participation index equal to 21.6383829%.
24.417013% > 21.6383829%.
The hypothesis is accepted.
In the course of the research, the following five hypotheses have been confirmed:
  • Hypothesis 1 (H1).Countries with higher GDP per unit of energy consumption have higher forward GVC participation;
  • Hypothesis 3 (H3).Energy importing countries have higher backward GVC participation;
  • Hypothesis 4 (H4).Countries exporting fuel have higher forward GVC participation;
  • Hypothesis 5 (H5).Countries with higher energy intensity level of primary energy have lower forward GVC participation than countries with lower energy intensity;
  • Hypothesis 6 (H6).Countries with higher energy intensity level of primary energy have higher backward GVC participation than countries with lower energy intensity.
Comparing the results obtained with the existing data, it should be noted that our conclusions are confirmed by similar data by Larionov and Andryushchenko (2016) [51] for South Korea, as well as Listopadov and Semenov (2019) [52] for the African region. Research conducted by Lim et al. (2021) [41] who used a computational general equilibrium (CGE) model to estimate the effects of the reverse GVC factors on the global economy, trade, and energy market for ASEAN, paying particular attention to the influence of energy source, should be mentioned as well.

5. Conclusions

The current study proves the existence of a relationship between energy indicators and APEC member economies’ GVC participation indices. The research shows that APEC member economies’ have a higher index of forward GVC participation (21.1%), compared to a rather low index of backward GVC participation (6.1%). This means that APEC member economies export more intermediate goods and services used for the export of other countries.
According to the research results, the following conclusions can be made. Countries’ energy indicators influence their GVC participation. Countries with higher GDP per unit of energy consumption, energy-importing countries, countries exporting fuel and countries with higher energy intensity level of primary energy have higher forward GVC participation. Countries with higher energy intensity level of primary energy have lower forward GVC participation than countries with lower energy intensity.
The following research will be devoted to the analyses of relationship between countries’ positions in the Energy Trilemma Index and their GVC participation. We will assess the presence or absence of a correlation between the position of countries in the Energy Trilemma Index by three dimensions (energy security, energy equality, and environmental sustainability) and the indices of their participation in GVCs.

Author Contributions

Conceptualization, E.D. and I.M.; methodology, E.D.; software, E.D. and Y.P.; validation E.D.; formal analysis, E.D.; investigation, E.D.; resources, E.D.; data curation, E.D. and I.M.; writing—original draft preparation—E.D.; writing—review and editing, E.D.; visualization, E.D.; supervision, Y.P.; project administration, E.D. and G.K. All authors have read and agreed to the published version of the manuscript.

Funding

This research received no external funding.

Conflicts of Interest

The authors declare no conflict of interest.

Appendix A

Table A1. GDP per unit of energy consumption (PPP USD per kg of oil equivalent).
APEC Member Economies20052006200720082009201020112012201320142015
Australia7.5877.4897.5197.5167.6367.7667.9138.3278.5608.8648.686
Brunei Darussalam11.4888.4408.2557.3748.4348.1267.0537.1978.8687.401NA
Canada4.9925.2615.5875.5955.6435.7595.7915.9646.0316.0226.227
Indonesia8.4338.6929.2879.6559.3459.44810.41310.64210.94711.088NA
Japan9.4149.5589.78910.0519.9439.77810.56510.95011.09111.44911.784
Korea, Rep.6.5626.7966.9156.9716.966.8166.7836.8687.0767.1787.172
Malaysia7.0797.4347.2167.2377.5017.8947.9718.2627.6707.959NA
New Zealand9.1069.3649.5419.2919.2078.9129.1488.9169.0818.8809.271
Philippines11.22911.91312.66512.73413.56813.76614.20214.27414.71314.703NA
Singapore13.27613.47015.85514.06116.34315.63816.08516.96717.56617.173NA
Thailand8.1298.3688.4658.3828.3558.2108.2898.2917.9168.051NA
USA6.9277.1927.2017.3817.5677.5847.7898.0888.1408.2198.603
Hong Kong SAR, China23.68624.03823.82324.81622.99526.38425.61926.96328.41328.601NA
China3.8273.9464.1684.4314.5374.5454.6424.8245.0365.328NA
Mexico10.55610.78511.10411.34710.73311.61411.45811.37511.50512.09212.534
Chile10.63110.85910.98311.48011.61011.76011.45310.89610.90111.89012.186
Peru15.35517.00517.05517.74517.11215.65316.35216.12817.13615.030NA
Russia4.4134.6405.0205.1605.0624.9724.94555.0195.1845.354NA
Vietnam7.9908.3418.3048.2067.9277.5998.0778.3538.806NANA
Notes: Data on Papua New Guinea and Chinese Taipei are not available. The values of all indicators are rounded to three decimal places. Source: [50].
Table A2. Energy imports. net (% of energy use).
APEC Member Economies20052006200720082009201020112012201320142015
Australia−133.666−128.348−134.100−126.271−132.236−153.605−143.738−153.237−172.438−192.015−190.190
Brunei Darussalam−849.555−608.136−542.866−495.880−522.428−473.190−382.704−383.542−458.372−357.394NA
Canada−48.953−53.809−53.291−50.428−50.197−51.374−52.962−59.114−64.443−67.927−72.528
Chile67.08267.41269.40567.93465.46170.14670.61264.99061.28864.20165.236
China6.05617.8588.4218.43510.36011.44611.86014.35914.75615.021NA
Hong Kong SAR, China99.59599.51599.54699.53299.55699.30099.22699.32099.23198.680NA
Indonesia−55.914−70.831−74.094−73.633−74.399−79.046−106.708−107.211−112.283−103.091NA
Japan80.92480.71582.64582.34580.36180.14488.93693.82793.91893.98193.019
Korea, Rep.79.56079.51980.82980.29780.66282.01981.95082.44683.47381.70481.448
Mexico−44.959−42.219−36.638−26.918−24.748−22.697−18.016−13.981−12.725−10.793−4.666
Malaysia−45.396−40.718−28.354−26.966−24.720−21.702−14.737−11.868−5.7605−5.505NA
New Zealand24.02621.72117.58413.91312.6718.14411.98116.45816.41417.08419.478
Peru20.01012.07012.97115.9354.243−3.737−23.024−14.186−18.918−14.899NA
Philippines44.93144.53742.71342.71938.54141.70840.92341.80145.32445.768NA
Russian Federation−84.628−82.950−84.232−82.133−84.021−85.847−80.004−77.856−83.841−83.670NA
Singapore98.17298.30298.12898.24697.93297.68897.70197.60897.55597.682NA
Thailand44.25743.20142.52139.40739.99840.10641.65340.21442.47341.568NA
Vietnam−47.289−46.523−38.839−26.451−25.235−12.690−15.965−15.734−15.105NANA
United States29.65927.97228.58525.26422.12422.20918.55415.69113.9439.2147.308
Note: Data on Papua New Guinea and Chinese Taipei are not available. The values of all indicators are rounded to three decimal places. Source: [50].
Table A3. Fuel exports (% of merchandise exports).
APEC Member Economies20052006200720082009201020112012201320142015
Australia25.59524.04222.75332.04029.50628.88028.14128.44525.86526.59925.290
Brunei DarussalamNA96.32596.14597.81596.06295.15095.44295.74796.52492.53992.979
Canada21.40321.13722.11429.13524.42025.32427.43225.62426.36128.89320.603
Chile2.8082.4331.8522.3791.4610.9371.1170.9900.9950.9190.763
China2.3121.8331.7112.2201.6961.6901.7001.5131.5291.4701.227
Hong Kong SAR, China1.3361.2661.5171.8991.9401.9742.0471.0831.0831.4411.806
Japan0.74860.9111.2992.4021.8131.6951.9791.6822.3322.2921.821
Mexico14.88515.45615.67117.22313.27813.76815.94514.05612.81210.4125.890
Malaysia13.40613.73114.39418.34914.76315.84617.73820.40722.27222.08916.463
New Zealand2.5192.8104.5577.1125.0064.9445.4884.9303.7193.2291.895
Peru9.3248.0028.5799.1427.7359.34210.53411.56912.96612.2997.165
Philippines1.8772.3042.8043.2761.9082.05322.9202.4283.7662.9721.320
Papua New GuineaNANANANANANA3.8022.924NANANA
Russian Federation61.78062.88261.46365.67863.01365.64867.02870.28970.55969.52562.836
Singapore12.15413.04013.70418.31815.17116.05819.45218.18216.99816.53112.190
Thailand4.3294.9824.4546.4235.1074.9375.6256.5086.2655.2663.936
Vietnam25.75824.37920.71820.17214.89911.04611.3599.9127.3356.1493.083
Korea, Rep.5.5236.4286.6309.1126.5436.9859.56110.4949.6699.1906.288
United States3.3113.7373.9626.4845.8047.1849.92410.06310.76310.9858.003
Indonesia27.68727.40025.60029.03128.27729.63933.86433.34731.44029.04223.042
Note: Data on Chinese Taipei are not available. Data on Papua New Guinea are available since 2011. The values of all indicators are rounded to three decimal places. Source: [50].
Table A4. Energy intensity level of primary energy (MJ/USD2011 PPP GDP).
APEC Member Economies20052006200720082009201020112012201320142015
Australia6.0016.0686.0496.0485.9605.8635.7595.4885.3465.1505.031
Brunei Darussalam3.3914.6164.7195.2834.6194.7945.5405.4274.3884.74993.652
Canada8.6948.3738.2578.2458.1768.0127.9687.7387.6617.6477.341
Chile4.2794.2664.2084.0343.9683.9214.0364.2374.2383.7683.776
China10.2819.9749.4468.8888.6938.6798.5028.1907.8517.1046.690
Hong Kong SAR, China1.8871.8591.8761.8011.9431.6941.7441.6571.5731.5531.488
Indonesia4.8644.7194.4164.2484.3894.3413.9393.8543.7473.6833.525
Japan5.0154.9244.7754.6424.6834.7354.4034.2334.2063.8713.742
Mexico4.5144.3994.2354.1344.3434.0144.0544.0694.0233.8533.738
Malaysia5.7735.4975.6635.6475.4485.1775.1274.9465.3275.1344.682
New Zealand5.3435.1935.1055.2535.3225.5075.3425.4555.4145.5195.423
Peru2.7472.4812.4742.3772.4662.6932.5752.6152.4612.7822.790
Philippines3.9453.7213.4973.4843.2803.2243.1313.1213.0193.0343.122
Papua New Guinea11.36411.27613.17310.98110.6569.4959.0648.1588.5237.9429.283
Korea, Rep.7.1606.9206.8226.7806.7966.9596.9936.9156.7296.6256.548
Russian Federation9.8379.3608.6498.4118.5758.7318.7818.6958.4568.3458.413
Singapore3.4203.3752.8653.2332.8022.9102.8332.7062.6182.4842.394
Thailand5.4965.3395.2795.3315.3505.4455.3945.3935.6485.5565.411
Vietnam6.0155.7615.7875.8566.0626.3245.9675.7445.6185.7455.944
United States6.6016.3696.3676.2226.0846.0725.9095.6925.6765.6215.408
Note: Data on Chinese Taipei are not available. The values of all indicators are rounded to three decimal places. Source: [50].

References

  1. Ignatenko, A.; Raei, F.; Mircheva, B. Global Value Chains: What Are the Benefits and Why Do Countries Participate?; IMF: Washington, DC, USA, 2019; Available online: https://www.imf.org/~/media/Files/Publications/WP/2019/wp1918.ashx (accessed on 5 December 2021).
  2. Porter, M. Competitive Advantage: Creating and Sustaining Superior Performance; The Free Press: New York, NY, USA, 1985; 592p. [Google Scholar]
  3. Porter, M. Competitive Strategy: Techniques for Analyzing Industries and Competitors; Alpina Publisher: Moscow, Russia, 2011; 454p. [Google Scholar]
  4. Koopman, R.; Powers, W.; Wang, Z.; Wei, S.-J. Give Credit Where Credit Is Due: Tracing Value Added in Global Production Chains; NBER Working Paper 16426. 2010. Available online: http://www.nber.org/papers/w16426 (accessed on 5 January 2021).
  5. Johnson, R.C.; Noguera, G. Accounting for intermediates: Production sharing and trade in value added. J. Int. Econ. 2012, 86, 224–236. [Google Scholar] [CrossRef] [Green Version]
  6. Stehrer, R.; Foster, N.; de Vries, G. Value Added and Factors in Trade: A Comprehensive Approach; World Input-Output Database (WIOD): Brussels, Belgium, 2012. [Google Scholar]
  7. Kowalski, P.; Lopez Gonzalez, J.; Ragoussis, A.; Ugarte, C. Participation of Developing Countries in Global Value Chains: Implications for Trade and Trade-Related Policies; OECD Trade Policy Papers; OECD Publishing: Paris, France, 2015. [Google Scholar] [CrossRef]
  8. Baldwin, R.; Lopez-Gonzalez, J. Supply-chain trade: A portrait of global patterns and several testable hypotheses. World Econ. 2013, 38, 1682–1721. [Google Scholar] [CrossRef]
  9. Sidorova, E. Russia in Global Value Chains. World Econ. Int. Relat. 2018, 62, 71–80. [Google Scholar] [CrossRef]
  10. Van der Marel, E. Positioning on the Global Value Chain Map: Where do You Want to Be? ECIPE Occasional Paper No.1. 2015. Available online: https://ecipe.org/publications/gvc-map/ (accessed on 5 January 2021).
  11. Amador, J.; Cappariello, R.; Stehrer, R. Global Value Chains: A View from the Euro Area; Working Paper, No. 1761; ECB: Frankfurt, Germany, 2015. [Google Scholar]
  12. Amador, J.; Cabral, S. Global value chains: A survey of drivers and measures. J. Econ. Surv. 2016, 30, 278–301. [Google Scholar] [CrossRef]
  13. Kersan-Škabić, I. The drivers of global value chain (GVC) participation in EU member states. Econ. Res.-Ekon. Istraživanja 2019, 32, 1204–1218. [Google Scholar] [CrossRef]
  14. Casella, B.; Bolwijn, R.; Moran, D.; Kanemoto, K. Improving the Analysis of Global Value Chains: The UNCTAD-Eora Database. Transnatl. Corp. 2019, 26, 115–142. Available online: https://unctad.org/system/files/official-document/diaeia2019d3a5_en.pdf (accessed on 28 December 2021).
  15. Antras, P.; Staiger, R. Offshoring and the role of trade agreements. Am. Econ. Rev. 2012, 102, 3140–3183. [Google Scholar] [CrossRef] [Green Version]
  16. Baldwin, R. Big-Think Regionalism: A Critical Survey; NBER: Cambridge, MA, USA, 2008. [Google Scholar]
  17. Baldwin, R. WTO 2.0: Global governance of supply-chain trade. In CEPR Policy Insight 64; Centre for Economic Policy Research: London, UK, 2012. [Google Scholar]
  18. Osnago, A.; Rocha, N.; Ruta, M. Deep Trade Agreements and Vertical FDI: The Devil Is in the Details, Policy Research; World Bank: Washington, DC, USA, 2015. [Google Scholar]
  19. Ruta, M. Preferential trade agreements and global value chains, theory, evidence and open questions. In IBRD: Measuring and Analyzing the Impact of GVCs on Economic Development; World Bank Group: Washington, DC, USA, 2017; Available online: https://www.semanticscholar.org/paper/Preferential-Trade-Agreements-and-Global-Value-and-Ruta/18333880b6701e95c4bd528c82dd912aec9d9942 (accessed on 5 January 2021).
  20. Lee, H.L. The triple-A supply chain. Harv. Bus. Rev. 2004, 82, 102–112. [Google Scholar]
  21. Rice, J.B.; Caniato, F. Building a Secure and Resilient Supply Network. Supply Chain Manag. Rev. 2003, 7, 22–30. [Google Scholar]
  22. Ponomarov, S.Y.; Holcomb, M.C. Understanding the Concept of Supply Chain Resilience. Int. J. Logist. Manag. 2009, 20, 124–143. [Google Scholar] [CrossRef]
  23. Day, J.M. Fostering Emergent Resilience: The Complex Adaptive Supply Network of Disaster Relief. Int. J. Prod. Res. 2014, 52, 1970–1988. [Google Scholar] [CrossRef]
  24. Liao, R.; Fan, Z. Supply Chains Have Been Upended. Here’s How to Make Them More Resilient; World Economic Forum: Cologny, Switzerland, 2020; Available online: https://www.weforum.org/agenda/2020/04/supply-chains-resilient-covid-19/ (accessed on 5 November 2021).
  25. Miroudot, S. Resilience vs. Robustness in Global Value Chains: Some Policy Implications; VoxEU and CEPR: London, UK, 2020; Available online: https://voxeu.org/article/resilience-versus-robustness-global-value-chains (accessed on 5 November 2021).
  26. Sangaraju, D.; Bayhaqi, A. Managing Risks in Global Value Chains: Strengthening Resilience in the APEC Region; APEC Secretariat, APEC Policy Support Unit: Singapore, 2020; Available online: https://www.apec.org/Publications/2020/12/Managing-Risks-in-Global-Value-Chains (accessed on 5 December 2021).
  27. Kemmler, A.; Spreng, D. Energy indicators for tracking sustainability in developing countries. Energy Policy 2007, 35, 2466–2480. [Google Scholar] [CrossRef]
  28. Taylor, P.; Abdalla, K.; Quadrelli, R.; Vera, I. Better energy indicators for sustainable development. Nat. Energy 2017, 2, 17117. [Google Scholar] [CrossRef] [Green Version]
  29. Perea-Moreno, A.-J.; Hernandez-Escobedo, Q. The Sustainable City: Advances in Renewable Energy and Energy Saving Systems. Energies 2021, 14, 8382. [Google Scholar] [CrossRef]
  30. Meramo, S.; Puello, P.; Rodríguez, J. Sustainability Outlook of Thermochemical-Based Second-Generation Biofuel Production: Exergy Assessment. Appl. Sci. 2021, 11, 8851. [Google Scholar] [CrossRef]
  31. Haddad, A.; Hammad, A.; Castro, D.; Vasco, D.; Soares, C.A.P. Framework for Assessing Urban Energy Sustainability. Sustainability 2021, 13, 9306. [Google Scholar] [CrossRef]
  32. Aldhshan, S.R.S.; Abdul Maulud, K.N.; Wan Mohd Jaafar, W.S.; Karim, O.A.; Pradhan, B. Energy Consumption and Spatial Assessment of Renewable Energy Penetration and Building Energy Efficiency in Malaysia: A Review. Sustainability 2021, 13, 9244. [Google Scholar] [CrossRef]
  33. Mastepanov, A.; Chigarev, B. The Energy Trilemma Index as an Assessment of Energy Security. Energy Policy 2020, 8, 66–83. Available online: https://energypolicy.ru/a-mastepanov-b-chigarev-the-energy-trilemma-index-kak-oczenk/energetika/2020/17/21/ (accessed on 5 December 2021).
  34. Palekhov, D.; Palekhova, L. Methodical Approaches to Increasing the Energy Efficiency of Global Value Chains. Nauk. Visnyk Natsionalnoho Hirnychoho Universytetu 2018, 6, 165–172. [Google Scholar] [CrossRef]
  35. Energy and Global Production Networks. The Palgrave Handbook of the International Political Economy of Energy; Van de Graaf, T., Sovacool, B.K., Ghosh, A., Kern, F., Klare, M.T., Eds.; Palgrave Macmillan: London, UK, 2016. [Google Scholar] [CrossRef]
  36. Bamber, P.; Guinn, A.; Gereffi, G. Burundi in the Energy Global Value Chain: Skills of Private Sector Development; Technical Report; CGGC Duke University: Durham, NC, USA, 2014. [Google Scholar]
  37. Morris, M.; Robbins, G.; Hansen, U.E.; Nygard, I. The wind energy global value chain localisation and industrial policy failure in South Africa. J. Int. Bus. Policy 2021, 1–22. [Google Scholar] [CrossRef]
  38. Sarkar, B.; Mridha, B.; Pareek, S.; Sarkar, M.; Thangavelu, L. A flexible biofuel and bioenergy production system with transportation disruption under a sustainable supply chain network. J. Clean. Prod. 2021, 317, 128079. [Google Scholar] [CrossRef]
  39. Singh, S.R.; Yadav, D.; Sarkar, B.; Sarkar, M. Impact of energy and carbon emission of a supply chain management with two-level trade-credit policy. Energies 2021, 14, 1569. [Google Scholar] [CrossRef]
  40. Bhuniya, S.; Pareek, S.; Sarkar, B.; Sett, B. A Smart Production Process for the Optimum Energy Consumption with Maintenance Policy under a Supply Chain Management. Processes 2020, 9, 19. [Google Scholar] [CrossRef]
  41. Lim, B.; Yoo, J.; Hong, K.; Cheong, I. Impacts of Reverse Global Value Chain (GVC) Factors on Global Trade and Energy Market. Energies 2021, 14, 3417. [Google Scholar] [CrossRef]
  42. Akar, S.; Augustine, C.; Kurup, P.; Mann, M. Global Value Chain and Manufacturing Analysis on Geothermal Power Plant Turbines; Technical Report NREL/TP-6A20-71128; National Renewable Energy Laboratory: Washington, DC, USA, 2018. [Google Scholar]
  43. Wu, Z.; Hou, G.; Xin, B. The Causality between Participation in GVCs, Renewable Energy Consumption and CO2 Emissions. Sustainability 2020, 12, 1237. [Google Scholar] [CrossRef] [Green Version]
  44. Ribalko, M. The Issue to Set up South Pacific Ocean States Collective Decisions for Making Integrative Units in the Region. In Australia and Oceania: History, Culture, Politics, Economy; Zakhariev, Y.O., Ed.; Ontoprint Publishing House: Moscow, Russia, 2021; pp. 110–120. [Google Scholar]
  45. Organisation for Economic Co-operation and Development. TiVA 2018; OECD Statistics: Paris, France, 2021; Available online: https://stats.oecd.org/Index.aspx?datasetcode=TIVA_2018_C1 (accessed on 5 December 2021).
  46. Drobot, E.V.; Makarov, I.N. Russia in the global value chain: Efficiency and threats to economic security in the context of COVID-19. Econ. Secur. 2021, 4, 589–606. [Google Scholar] [CrossRef]
  47. World Energy Council. World Energy Trilemma Index 2020; World Energy Council: London, UK, 2020; Available online: https://www.worldenergy.org/assets/downloads/World_Energy_Trilemma_Index_2020_-_REPORT.pdf (accessed on 20 November 2021).
  48. World Energy Council. World Energy Trilemma Index 2021; World Energy Council: London, UK, 2021; Available online: https://www.worldenergy.org/publications/entry/world-energy-trilemma-index-2021 (accessed on 20 November 2021).
  49. Roslyakova, N.A. Conditions for participation of Russian regions in global value chains. J. Cent. Asia Econ. 2020, 4, 263–272. [Google Scholar] [CrossRef]
  50. International Energy Agency; OECD iLibrary. IEA World Energy Statistics and Balances. Available online: https://www.oecd-ilibrary.org/energy/data/iea-world-energy-statistics-and-balances_enestats-data-en (accessed on 20 December 2021).
  51. Larionov, A.V.; Andryushchenko, K.I. The possibilities of Russia’s participation in the system of global value energy chains (on the example of South Korea). World New Econ. 2016, 2, 45–53. [Google Scholar]
  52. Listopadov, I.Y.; Semenov, E.V. Nuclear power engineering as a competitive advantage of Egypt in the organization of value chains in the African region. Mod. Sci. 2019, 12, 162–168. [Google Scholar]
Figure 1. APEC member economies’ places in the World Energy Trilemma Index for 2020–2021. Source: [47,48]. Used by permission of the World Energy Council.
Energies 15 01675 g001
Figure 2. APEC member economies’ GVC participation, 2005–2015. Source: own elaboration on the basis of [45].
Energies 15 01675 g002
Table 1. Hypotheses about the relationship between countries’ energy indicators and the GVC participation indices.
Hypothesis NumberFormulationAccepted/Rejected
Hypothesis 1 (H1)Countries with higher GDP per unit of energy consumption (PPP USD per kg of oil equivalent) have higher forward GVC participationAccepted
Hypothesis 2 (H2)Countries with lower GDP per unit of energy consumption (PPP USD per kg of oil equivalent) have higher backward GVC participationRejected
Hypothesis 3 (H3)Energy importing countries have higher backward GVC participationAccepted
Hypothesis 4 (H4)Countries exporting fuel have higher forward GVC participationAccepted
Hypothesis 5 (H5)Countries with higher energy intensity level of primary energy have lower forward GVC participation than countries with lower energy intensity level of primary energyAccepted
Hypothesis 6 (H6)Countries with higher energy intensity level of primary energy have higher backward GVC participation than countries with lower energy intensity level of primary energyAccepted
Source: own elaboration.
Table 2. Authors’ contribution to the study of GVC management and sustainability and the relationship between Countries’ Energy Indicators and the Indices of GVC Participation.
ResearchersGVC Participation MeasurementGVCs in Regional Trade Agreements and OrganizationsGVC Sustainability or ResilienceEnergy Indicators in Sustainability and Sustainable DevelopmentGVC Energy IndicatorsEnergy Indicators and GVC Indices Relations
Koopman et al. (2010) [4], Johnson and Noguera (2012) [5], Stehrer et al. (2012) [6], Kowalski et al. (2015) [7], Baldwin and Lopez-Gonzalez (2013) [8], Sidorova (2018) [9], Van der Marel (2015) [10], Amador, Cappariello and Stehrer (2015) [11], Amador and Cabral (2016) [12], Casella et al. (2019) [14], Osnago, Rocha and Ruta (2015) [18], Ruta (2017) [19]+
Amador, Cappariello and Stehrer (2015) [11], Amador and Cabral (2016) [12], Kersan-Škabić (2019) [13], Antras and Staiger (2012) [15], Baldwin (2008) [16], Baldwin (2012) [17], Osnago, Rocha and Ruta (2015) [18], Ruta (2017) [19] +
Lee (2004) [20], Rice and Caniato (2003) [21], Ponomarov and Holcomb (2009) [22], Day (2014) [23], Liao and Fan Ziyang (2020) [24], Miroudot (2020) [25], Sangaraju and Bayhaqi (2020) [26] +
Kemmler and Spreng (2007) [27], Taylor et al. (2017) [28], Perea-Moreno and Hernandez-Escobedo (2021) [29], Meramo et al. (2021) [30], Haddad et al. (2021) [31], Aldhshan et al. (2021) [32] +
Casella et al. (2019) [14], Mastepanov and Chigarev (2020) [33], Palekhov and Palekhova; (2018) [34], Van de Graaf, Sovacool, Ghosh, Kern, Klare (Eds.) (2016) [35], Bamber et al. (2014) [36], Morris et al. (2021) [37], Sarkar Biswajit et al. (2021) [38], Vandana Singh et al. (2021) [39], Bhuniya Shaktipada et al. (2020) [40], Lim Byeongho et al. (2021) [41], Akar et al. (2018) [42], Wu et al. (2020) [43] +
Note: “+” means that the term is studied in the research. Source: own elaboration.
Table 3. Positions of the APEC member economies in the ranking on the World Energy Trilemma Index.
APEC Member EconomiesWorld Energy Trilemma Index, Ranking Place 2020 World Energy Trilemma Index, Ranking Place 2021
Australia2518
Brunei Darussalam5138
Canada66
Indonesia5658
Japan2416
Republic of Korea3132
Malaysia3325
New Zealand109
Philippines7670
Singapore4034
Thailand6453
USA99
Chinese TaipeiNANA
Hong Kong SAR, China3435
China5551
Mexico4543
Papua New GuineaNANA
Chile3737
Peru4244
Russia2928
Vietnam6561
Source: own elaboration on the basis of [47,48]. Used by permission of the World Energy Council.
Table 4. APEC member economies’ backward GVC participation, %.
APEC Member Economies2005 2006 2007 2008 2009 2010 2011 2012 2013 2014 2015
Australia11.112.111.612.011.010.311.011.210.811.411.6
Brunei Darussalam7.57.05.87.37.57.59.011.312.56.85.4
Canada19.619.519.219.620.120.720.921.720.720.121.2
Indonesia18.414.914.315.012.112.512.813.313.914.112.9
Japan10.212.213.215.210.912.214.313.915.215.813.2
Republic of Korea32.734.234.441.237.138.242.442.039.537.332.6
Malaysia45.043.444.140.339.840.639.438.137.236.636.9
New Zealand14.915.814.517.114.214.915.716.414.914.713.8
Philippines26.331.724.224.821.923.923.523.921.020.422.0
Singapore42.844.641.445.242.041.343.543.842.843.040.9
Thailand38.437.136.139.034.436.038.838.437.536.733.6
USA10.811.411.712.99.411.112.712.411.511.29.5
Chinese Taipei37.139.340.643.736.341.542.141.239.538.332.4
Hong Kong SAR, China27.729.530.632.729.131.632.431.931.029.226.6
China26.325.924.823.019.521.121.720.820.319.517.3
Mexico34.034.233.433.333.633.932.333.834.634.136.1
Papua New GuineaNANANANANANANANANANANA
Chile17.715.216.119.415.413.815.815.514.915.015.1
Peru13.313.613.315.012.412.312.112.712.412.310.3
Russia9.99.39.310.410.59.79.48.78.99.410.8
Vietnam36.138.140.841.537.240.541.840.841.742.444.5
APEC, total7.07.37.58.77.07.78.58.58.27.86.5
Source: own elaboration on the basis of [45].
Table 5. APEC member economies’ forward GVC participation, %.
APEC Member Economies2005 2006 2007 2008 2009 2010 2011 2012 2013 2014 2015
Australia27.930.931.833.727.231.333.030.830.429.626.8
Brunei Darussalam29.832.433.035.728.732.434.532.635.840.341.1
Canada12.613.415.516.314.215.817.716.716.816.615.3
Indonesia24.627.527.527.925.827.930.328.427.526.424.1
Japan26.426.527.025.925.825.625.825.224.524.324.4
Republic of Korea20.621.522.218.317.217.816.016.317.017.819.1
Malaysia16.017.516.918.516.617.318.118.319.319.418.7
New Zealand12.112.613.714.012.613.114.112.812.912.511.7
Philippines20.122.423.124.022.223.022.521.523.022.822.4
Singapore20.919.420.619.118.820.619.319.119.620.520.9
Thailand15.415.616.015.014.414.914.113.913.513.613.8
USA22.523.022.722.520.921.922.522.122.222.222.2
Chinese Taipei22.823.723.821.621.820.520.521.021.922.124.4
Hong Kong SAR, China17.618.118.117.415.415.815.415.014.615.915.7
China15.616.116.517.516.016.216.616.216.316.817.5
Mexico8.38.810.110.78.910.312.312.111.210.68.8
Papua New GuineaNANANANANANANANANANANA
Chile31.937.037.533.730.435.034.232.331.030.728.9
Peru31.737.539.236.534.339.141.137.034.030.729.4
Russia33.535.536.135.729.333.836.035.334.433.730.5
Vietnam14.513.814.013.813.512.512.712.412.311.911.1
APEC, total22.723.123.022.819.521.122.221.821.621.321.1
Source: own elaboration on the basis of [45].
Table 6. APEC member economies with higher GDP per unit of energy consumption.
APEC Member EconomiesGDP per Unit of Energy Consumption (PPP USD per kg of Oil Equivalent), Chronological AverageForward GVC Participation (%), Chronological Average
Japan10.397925.582
Philippines13.3772422.45455
Singapore15.6438219.89091
Hong Kong SAR, China25.5343316.27273
Mexico11.3735310.19091
Chile11.3323632.96364
Peru16.4576635.5
Average14.8738323.2649629
Source: own elaboration on the basis of [45,50].
Table 7. APEC member economies with lower GDP per unit of energy consumption.
APEC Member EconomiesGDP per Unit of Energy Consumption (PPP USD per kg of Oil Equivalent), Chronological AverageForward GVC Participation (%), Chronological Average
Australia7.98818230.30909
Brunei Darussalam8.26407834.20909
Canada5.71614215.53636
Indonesia9.79539427.08182
Republic of Korea6.91846318.52727
Malaysia7.62298617.87273
New Zealand9.15671812.91818
Thailand8.24626814.56364
USA7.69962122.24545
China4.52880316.48182
Russia4.97745633.98182
Vietnam8.17874312.95455
Average7.42440521.3901517
Source: own elaboration on the basis of [45,50].
Table 8. APEC member economies with higher GDP per unit of energy consumption.
APEC Member EconomiesGDP per Unit of Energy Consumption (PPP USD per kg of Oil Equivalent), Chronological AverageBackward GVC Participation (%), Chronological Average
Japan10.397913.3
Philippines13.3772423.96364
Singapore15.6438242.84545
Hong Kong SAR, China25.5343330.20909
Mexico11.3735333.93636
Chile11.3323615.80909
Peru16.4576612.7
Average14.8738324.6805186
Source: own elaboration on the basis of [45,50].
Table 9. APEC member economies with lower GDP per unit of energy consumption.
APEC Member EconomiesGDP per Unit of Energy Consumption (PPP USD per kg of Oil Equivalent), Chronological AverageBackward GVC Participation (%), Chronological Average
Australia7.98818211.28182
Brunei Darussalam8.2640787.963636
Canada5.71614219.94286
Indonesia9.79539414.01818
Republic of Korea6.91846337.41818
Malaysia7.62298640.12727
New Zealand9.15671815.17273
Thailand8.24626836.90909
USA7.69962111.32727
China4.52880321.83636
Russia4.9774569.663636
Vietnam8.17874340.49091
Average7.42440522.1793285
Source: own elaboration on the basis of [45,50].
Table 10. APEC member economies—energy importers.
APEC Member EconomiesNet Energy Imports (% of Energy Use), Chronological AverageBackward GVC Participation (%), Chronological Average
Chile66.706683515.80909091
China10.857704421.83636364
Hong Kong SAR, China99.350495530.2090909
Japan86.438059213.3
Korea, Rep.81.264683737.4181818
New Zealand16.316375415.17272727
Philippines42.896953823.96363636
Singapore97.901851542.8454545
Thailand41.540216136.9090909
United States20.048046511.32727273
Average56.3321069624.8790909
Source: own elaboration on the basis of [45,50].
Table 11. APEC member economies—energy exporters.
APEC Member EconomiesNet Energy Imports (% of Energy Use), Chronological AverageBackward GVC Participation (%), Chronological Average
Australia−150.89547411.28181818
Brunei Darussalam−507.4072137.963636364
Canada−56.821007120.3
Indonesia−85.721506914.01818182
Mexico−23.487783133.9363636
Malaysia−22.573014740.1272727
Peru−0.9535711712.7
Russian Federation−82.9185799.663636364
Vietnam−27.09281740.4909091
Average−106.430107321.16464646
Source: own elaboration on the basis of [45,50].
Table 12. APEC member economies—fuel exporters.
APEC Member EconomiesFuel Exports (% of Merchandise Exports), Chronological AverageForward GVC Participation (%), Chronological Average
Australia27.01465730.309
Brunei Darussalam95.47321634.209
Canada24.7683115.536
Malaysia17.22396817.873
Russian Federation65.51860233.982
Indonesia28.94316827.082
Singapore15.618519.89091
Vietnam14.0742412.95455
Mexico13.5818410.19091
Average33.5796112822.447475
Source: own elaboration on the basis of [45,50].
Table 13. APEC member economies with low percentage of fuel exports in merchandise exports.
APEC Member EconomiesFuel Exports (% of Merchandise Exports), Chronological AverageForward GVC Participation (%), Chronological Average
Chile1.51476932.964
China1.71878516.482
Hong Kong SAR, China1.58170216.273
Japan1.72534625.582
New Zealand4.20136412.918
Peru9.69651135.5
Philippines2.51234922.455
Thailand5.25790714.564
Korea, Rep.7.85703318.527
United States7.29320422.245
Average4.33589721.75091
Source: own elaboration on the basis of [45,50].
Table 14. APEC member economies with higher energy intensity level of primary energy.
APEC Member EconomiesEnergy Intensity Level of Primary Energy (mJ/USD2011 PPP GDP), Chronological AverageForward GVC Participation (%), Chronological Average
Australia5.70615130.30909
Canada8.01061615.53636
China8.57296716.48182
Malaysia5.31162117.87273
New Zealand5.35288312.91818
Korea, Rep.6.84114518.52727
Russian Federation8.75078333.98182
Thailand5.42264214.56364
Vietnam5.89347412.95455
United States6.0024222.24545
Average6.586470219.539091
Source: own elaboration on the basis of [45,50].
Table 15. APEC member economies with lower energy intensity level of primary energy.
APEC Member EconomiesEnergy Intensity Level of Primary Energy (mJ/USD2011 PPP GDP), Chronological AverageForward GVC Participation (%), Chronological Average
Brunei Darussalam4.65308234.20909
Chile4.06695632.96364
Hong Kong SAR, China1.73453916.27273
Indonesia4.15732427.08182
Japan4.47569525.58182
Mexico4.12546210.19091
Peru2.58791835.5
Philippines3.32577322.45455
Singapore2.87685619.89091
Average3.55595611124.90505222
Source: own elaboration on the basis of [45,50].
Table 16. APEC member economies with higher energy intensity level of primary energy.
APEC Member EconomiesEnergy Intensity Level of Primary Energy (mJ/USD2011 PPP GDP), Chronological AverageBackward GVC Participation (%), Chronological Average
Australia5.70615111.28182
Canada8.01061619.94286
China8.57296721.83636
Malaysia5.31162140.12727
New Zealand5.35288315.17273
Korea, Rep.6.84114537.41818
Russian Federation8.7507839.663636
Thailand5.42264236.90909
Vietnam5.89347440.49091
United States6.0024211.32727
Average6.586470224.417013
Source: own elaboration on the basis of [45,50].
Table 17. APEC member economies with lower energy intensity level of primary energy.
APEC Member EconomiesEnergy Intensity Level of Primary Energy (mJ/USD2011 PPP GDP), Chronological AverageBackward GVC Participation (%), Chronological Average
Brunei Darussalam4.6530827.963636
Chile4.06695615.80909
Hong Kong SAR, China1.73453930.20909
Indonesia4.15732414.01818
Japan4.47569513.3
Mexico4.12546233.93636
Peru2.58791812.7
Philippines3.32577323.96364
Singapore2.87685642.84545
Average3.55595611121.6383829
Source: own elaboration on the basis of [45,50].
Publisher’s Note: MDPI stays neutral with regard to jurisdictional claims in published maps and institutional affiliations.

