Abstract
This work investigates potential cost reduction trajectories of three emerging offshore renewable energy technologies (floating offshore wind, tidal stream, and wave) with respect to meeting ambitious cost targets set out in the Strategic Energy Technology Implementation Plans (SET-Plans) for Offshore Wind and Ocean Energy. A methodology is presented which calculates target costs for current early-stage devices, starting from the 2030 SET-Plan levelised cost targets. Component-based experience curves have been applied as part of the methodology, characterised through the comparative maturity level of each technology-specific cost centre. The resultant early-stage target costs are then compared with actual costs for current devices to highlight where further cost reduction is still required. It has been found that innovation and development requirements to reach these targets vary greatly between different technologies, based on their current level of technological maturity. Future funding calls and programmes should be designed with these variables in mind to support innovative developments in offshore renewables. The method presented in this paper has been applied to publicly available cost data for emerging renewable technologies and is fully adaptable to calculate the innovation requirements for specific early-stage renewable energy devices.
1. Introduction
Offshore renewable energy (ORE) is forecast to form a significant component of energy decarbonisation for the UK, with the offshore wind sector deal specifying a 40 GW target for offshore wind deployments by 2030, including 1 GW from floating offshore wind [1]. The UK has a large marine energy resource [2], and thus also the potential to utilise other early-stage offshore renewable technologies such as wave and tidal energy to meet decarbonisation targets.
To contribute effectively to the UK energy mix and access current policy mechanisms, early-stage offshore renewables such as floating offshore wind, tidal stream and wave energy need to significantly reduce costs in order to become commercially viable. Estimates of the levelised cost of energy (LCOE) of the first commercial arrays of these technologies vary, depending on data sources, assumptions made, and the date of the study. The ranges found in literature are around 67–250 €/MWh for floating wind [3,4], 115–476 €/MWh for tidal stream and 98–804 €/MWh for wave energy [5]. LCOE targets for these technologies have been established at a European level, at 90 €/MWh, 100 €/MWh and 150 €/MWh by 2030 for floating wind, tidal stream and wave energy, respectively, as part of the Strategic Energy Technology Implementation Plans (SET-Plans) [6,7].
Therefore, it is important to build an understanding of these cost reduction requirements and the implications for current technologies to guide future developments. Addressing this need, this work focuses on deriving and analysing cost reduction trajectories for early-stage offshore renewable technologies. Technology cost reduction is often quantified through use of experience curves. Single-factor experience curves are most widely used, in which the learning rate quantifies the percentage cost reduction for each doubling of capacity. Learning rates used in this manner encompass several drivers of cost reduction:
- Learning by doing, by means of economies of volume and deployment experience.
- Learning by research, by means of innovative research and development.
- Learning by adaption, by means of knowledge and experience transfer from other sectors.
- Learning by interaction, by means of collaborations and knowledge exchange platforms.
- Economies of scale, by means of increasing scale of individual devices.
Technology-specific learning rates can be found in the literature for various electricity generation technologies. For example, Jamasb identifies a number of generation technologies as ‘mature’, ‘reviving’, ‘evolving’ and ‘emerging’ and derives learning rates for each technology, finding that learning rates vary depending on the technologies’ development stage [8]. In this study, learning rates for single-factor experience curves range from 2.1% (combined heat and power) to 57.9% (waste to electricity) and a learning rate of 8.3% is quoted for fixed offshore wind.
A range of predictions can be found in the literature for future learning rates of offshore renewable energy technologies such as floating offshore wind, tidal stream, and wave energy. The Offshore Renewable Energy Catapult has produced cost reduction analysis quoting an expected learning rate of 9.5% for floating offshore wind [9] and of 13% for capital expenditure (CAPEX) and 11% for operational expenditure (OPEX) for marine energy technologies (both wave and tidal stream) [10]. Astariz and Iglesias use learning rates of 10%, 13% and 15% within a sensitivity analysis representing a range of more pessimistic to more optimistic forecasts for projected cost reductions for wave energy [11].
For emerging technologies where little historical data is available to determine technology-specific learning rates, component-specific experience curves have been used [12,13]. Some studies have broken costs down into further detail within the categories of CAPEX and/or OPEX and applied a range of learning rates to specific cost centres and components [2,14,15]. An analysis by The Carbon Trust in 2011 applies learning rates of 2–18% for different tidal stream cost centres and 1–12% for various wave energy cost centres [2]. The lowest learning rates are applied to the electrical connection, as the most technologically mature component, due to the commercialisation of medium voltage offshore cables for the offshore wind sector. Conversely, the highest learning rates are applied to the wave and tidal devices and to the operation and maintenance activities, identified as the more novel costs centres. A further LCOE study for the CorPower Ocean wave energy converter (WEC) uses learning rates ranging from 5–15% based on the component maturity [14].
The main objective of this work is to develop a novel methodology for converting future LCOE targets into current cost targets for specific components and services. This is achieved by combining the reversed LCOE (RLCOE) methodology previously developed by de Andres et al. [16] with the use of component-specific learning rates to produce cost thresholds for early-stage ORE technologies. The SET-Plan future cost targets are used to derive the current cost requirements for emerging ORE components. This work has been undertaken with the intention of benchmarking the derived cost thresholds against current technology costs in order to identify innovation requirements to meet future cost targets. This study has the additional novelty of using a consistent methodology to apply cost-centre-specific learning rates to three early-stage renewable technologies, based on the maturity levels of individual components and services.
The remainder of this paper is structured as follows: Section 2 details the methodology for the cost requirement calculation, Section 3 introduces three early-stage offshore renewable case studies, Section 4 displays the case study results, Section 5 discusses the results, uncertainties, sensitivities and limitations of the methodology and Section 6 concludes with final recommendations.
2. Methodology
In this work, a methodology known as ‘reversed LCOE’ [16] has been used to identify the cost requirements on different subsystems to meet a system level LCOE target. This methodology was then extended by using experience curves to translate commercial cost targets, as calculated through the reversed LCOE method, to cost thresholds which are more applicable to the current development status of wave, tidal stream, and floating offshore wind technologies. That is, the equivalent available budget for each component today is calculated under the assumption that all components experience sustained cost reductions from today and until the target LCOE value is achieved.
The methodology comprises three steps, illustrated in Figure 1, which involve:
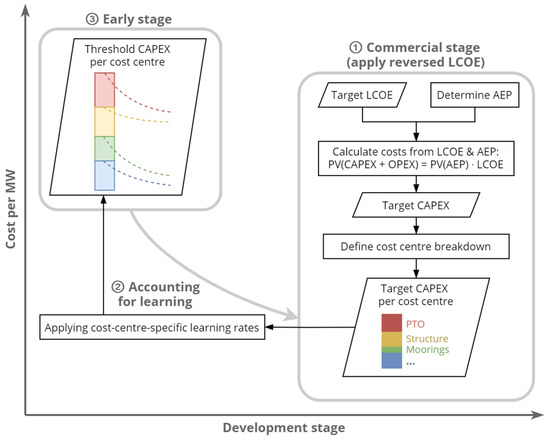
Figure 1.
Overview of the methodology.
- Defining the commercial stage target values with the reverse LCOE method by identifying a target LCOE value and deriving the target cost breakdown.
- Accounting for learning by defining and allocating learning rates specific to the cost centres identified in (1).
- Producing a target pre-commercial cost centre breakdown by applying cost-centre-specific learning rates (2) to the target cost centre breakdown (1). This involves some assumptions with regards to the deployment requirements to meet the target LCOE.
These three steps are introduced in more detail in the following sections, with the required inputs and assumptions outlined within the case studies in Section 3.
2.1. Commercial Stage with Reversed LCOE
In the reversed LCOE calculation process, a target LCOE value to be achieved by the evaluated technology is defined, so that target cost values for each cost centre (e.g., mooring lines, cables, etc.) can be defined. The process followed to obtain these cost-centre-specific target values is represented within step 1 of Figure 1. This method was first developed for wave energy applications [16] but is applicable to other developing energy generating technologies.
It is based on calculation of the levelised cost of energy represented in Equation (1)
where the LCOE comprises all project costs, both capital and operational expenditures (CAPEX and OPEX respectively), divided by the annual energy production (AEP) for every year, , over the project lifetime, , all discounted to their present values (PV) through a discount rate, .
For a given LCOE target and known AEP at a certain location, the available budget can be calculated in terms of CAPEX and OPEX by re-arranging Equation (1) as (2).
Assuming CAPEX investment occurs in year 0 and undiscounted annual OPEX can be represented as a fixed ratio of CAPEX, it is then possible to calculate the total CAPEX required for the commercial LCOE target to be achieved.
This total CAPEX value represents the sum of the contributions of different cost centres, . If the percentage contribution () of different cost centres to the CAPEX is approximately known, the available budget for each cost centre CAPEXi can be calculated. This is shown in Equation (3).
To make these future cost targets applicable to current early-stage technologies, this method is then extended. An available budget for the present day is derived by taking into account the effects of learning, as introduced in the following subsections.
2.2. Accounting for Learning
The experience curve has been observed across many forms of electricity generation, where the LCOE or the cost per kW of a unit can be plotted as a curve against cumulative experience in terms of units deployed [17]. This study proposes using the experience curve to translate commercial cost targets to targets applicable to earlier stages of development.
The formula for the experience curve can be written as Equation (4)
where:
- is the cumulative number of units or capacity at time ,
- is the cost of a unit at time ,
- is the cumulative number of units or capacity at time t,
- is the cost of a unit at time ,
- is the learning rate parameter.
If represents the commercial cost target, a cost threshold for an early-stage technology today, , can be found by re-arranging Equation (4) to become (5).
The shape of the experience curve is governed by the learning rate (LR) which is calculated according to Equation (6). This represents the percentage unit cost reduction as a result of each doubling of cumulative experience.
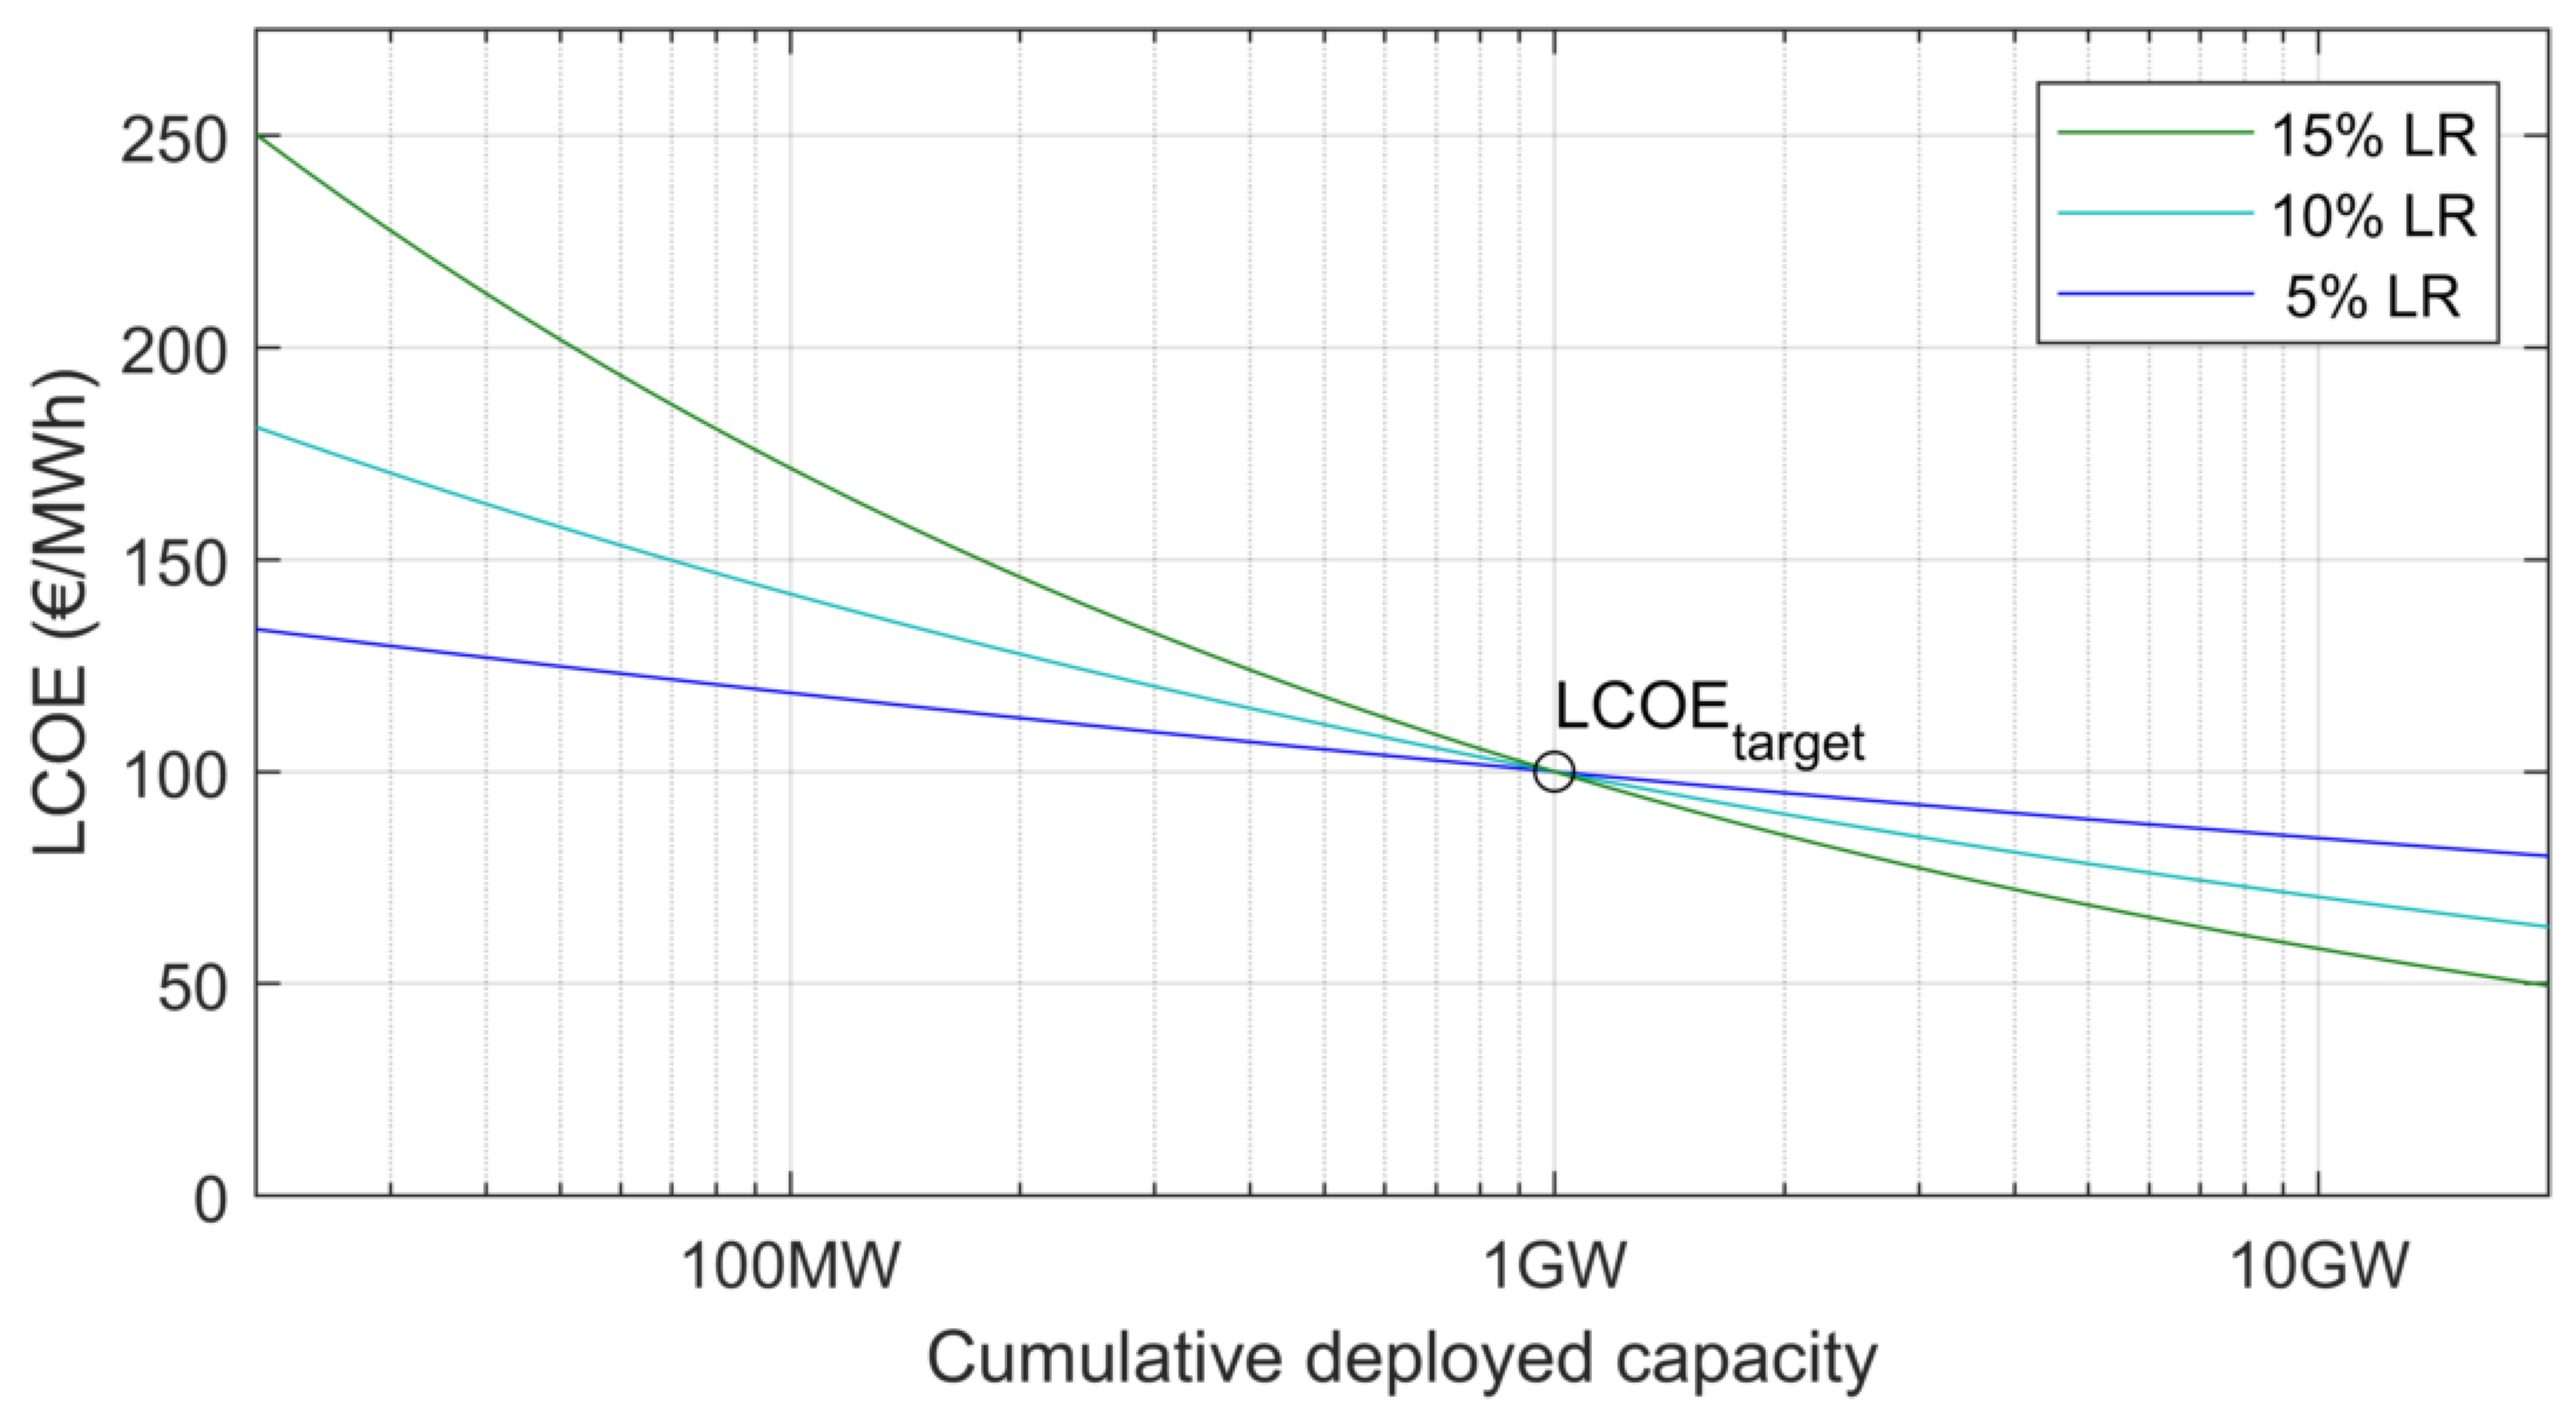
Applying this concept to an LCOE target of 100 €/MWh achieved after a cumulative capacity deployment of 1 GW, the LCOE value required today depending on the assumed learning rate can be obtained as shown in Figure 2. This assumes that sustained cost reductions take place from today and until the target is reached.
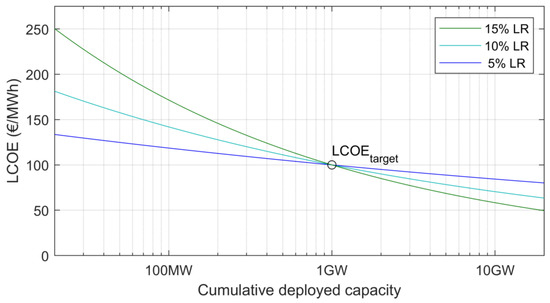
Figure 2.
Example single-factor experience curves for three different learning rates. The curves show the LCOE value when consistent learning starts depending on the learning rate, if the LCOE target value of 100 €/MWh is achieved after 1 GW.
2.2.1. Choice of Learning Rates
The appropriate learning rate to apply to different components and activities is assumed to be dependent on the maturity of the technology that is being evaluated, with maturity level being representative of the cost reduction potential, as observed in [8]. Although the maturity level classifications, as set out in [8], are based on analysis of different forms of electricity generation, in this study they have been adapted to a subsystem level. This is because each subsystem will have different opportunities for innovation, different levels of previous experience, and different potential for knowledge transfer from other sectors.
Three maturity levels are defined in this analysis for technology classification:
- Low: A technology or activity that is new and has a large scope for improvement or cost reductions.
- Medium: A technology or activity which has scope for improvement or future cost reductions, but is not completely new, or is already used elsewhere.
- High: An established technology or activity in which there is limited scope for improvement or future cost reductions.
Different learning rates are assigned to each maturity level, based on the range of expected learning potential. The learning rates reported in [2] for tidal and wave energy technologies were grouped into high, medium and low values, with resulting average learning rate values of 14%, 11% and 6%, respectively. Following a similar approach with the learning rate values estimated by Jamasb in [8] for a number of energy-generating technologies at different maturity levels, these could be grouped in average values of 4%, 8% and 31%, respectively. In line with these, the assigned learning rates per maturity level for the present study are summarised in Table 1. These learning rate assumptions have been selected for the purpose of demonstrating the calculation methodology.

Table 1.
Learning rate assumptions applied depending on component and process maturity.
Although a specific learning rate was prescribed for each category to represent the baseline case (‘central LR’), the cost thresholds are very sensitive to the choice of the learning rate, as can be seen from the example provided in Figure 2. For this reason, a sensitivity on the learning rate was performed to represent lower (‘−5% LR’) and higher (‘+5% LR’) learning potential cases relative to the baseline case. A low learning rate results in lower cost threshold values as slower cost reduction is expected. A high learning rate results in higher cost threshold values and therefore should only be used when a faster cost reduction appears feasible.
2.3. Early-Stage CAPEX Thresholds
By considering the learning potential associated with each cost centre, the cost thresholds for the cost centres today, as well as the overall CAPEX value required today (CAPEXtoday), are obtained. This is done by combining Equations (2), (3) and (5), so that:
where represents a learning constant as then further defined in the Equation (7).
3. Case Studies
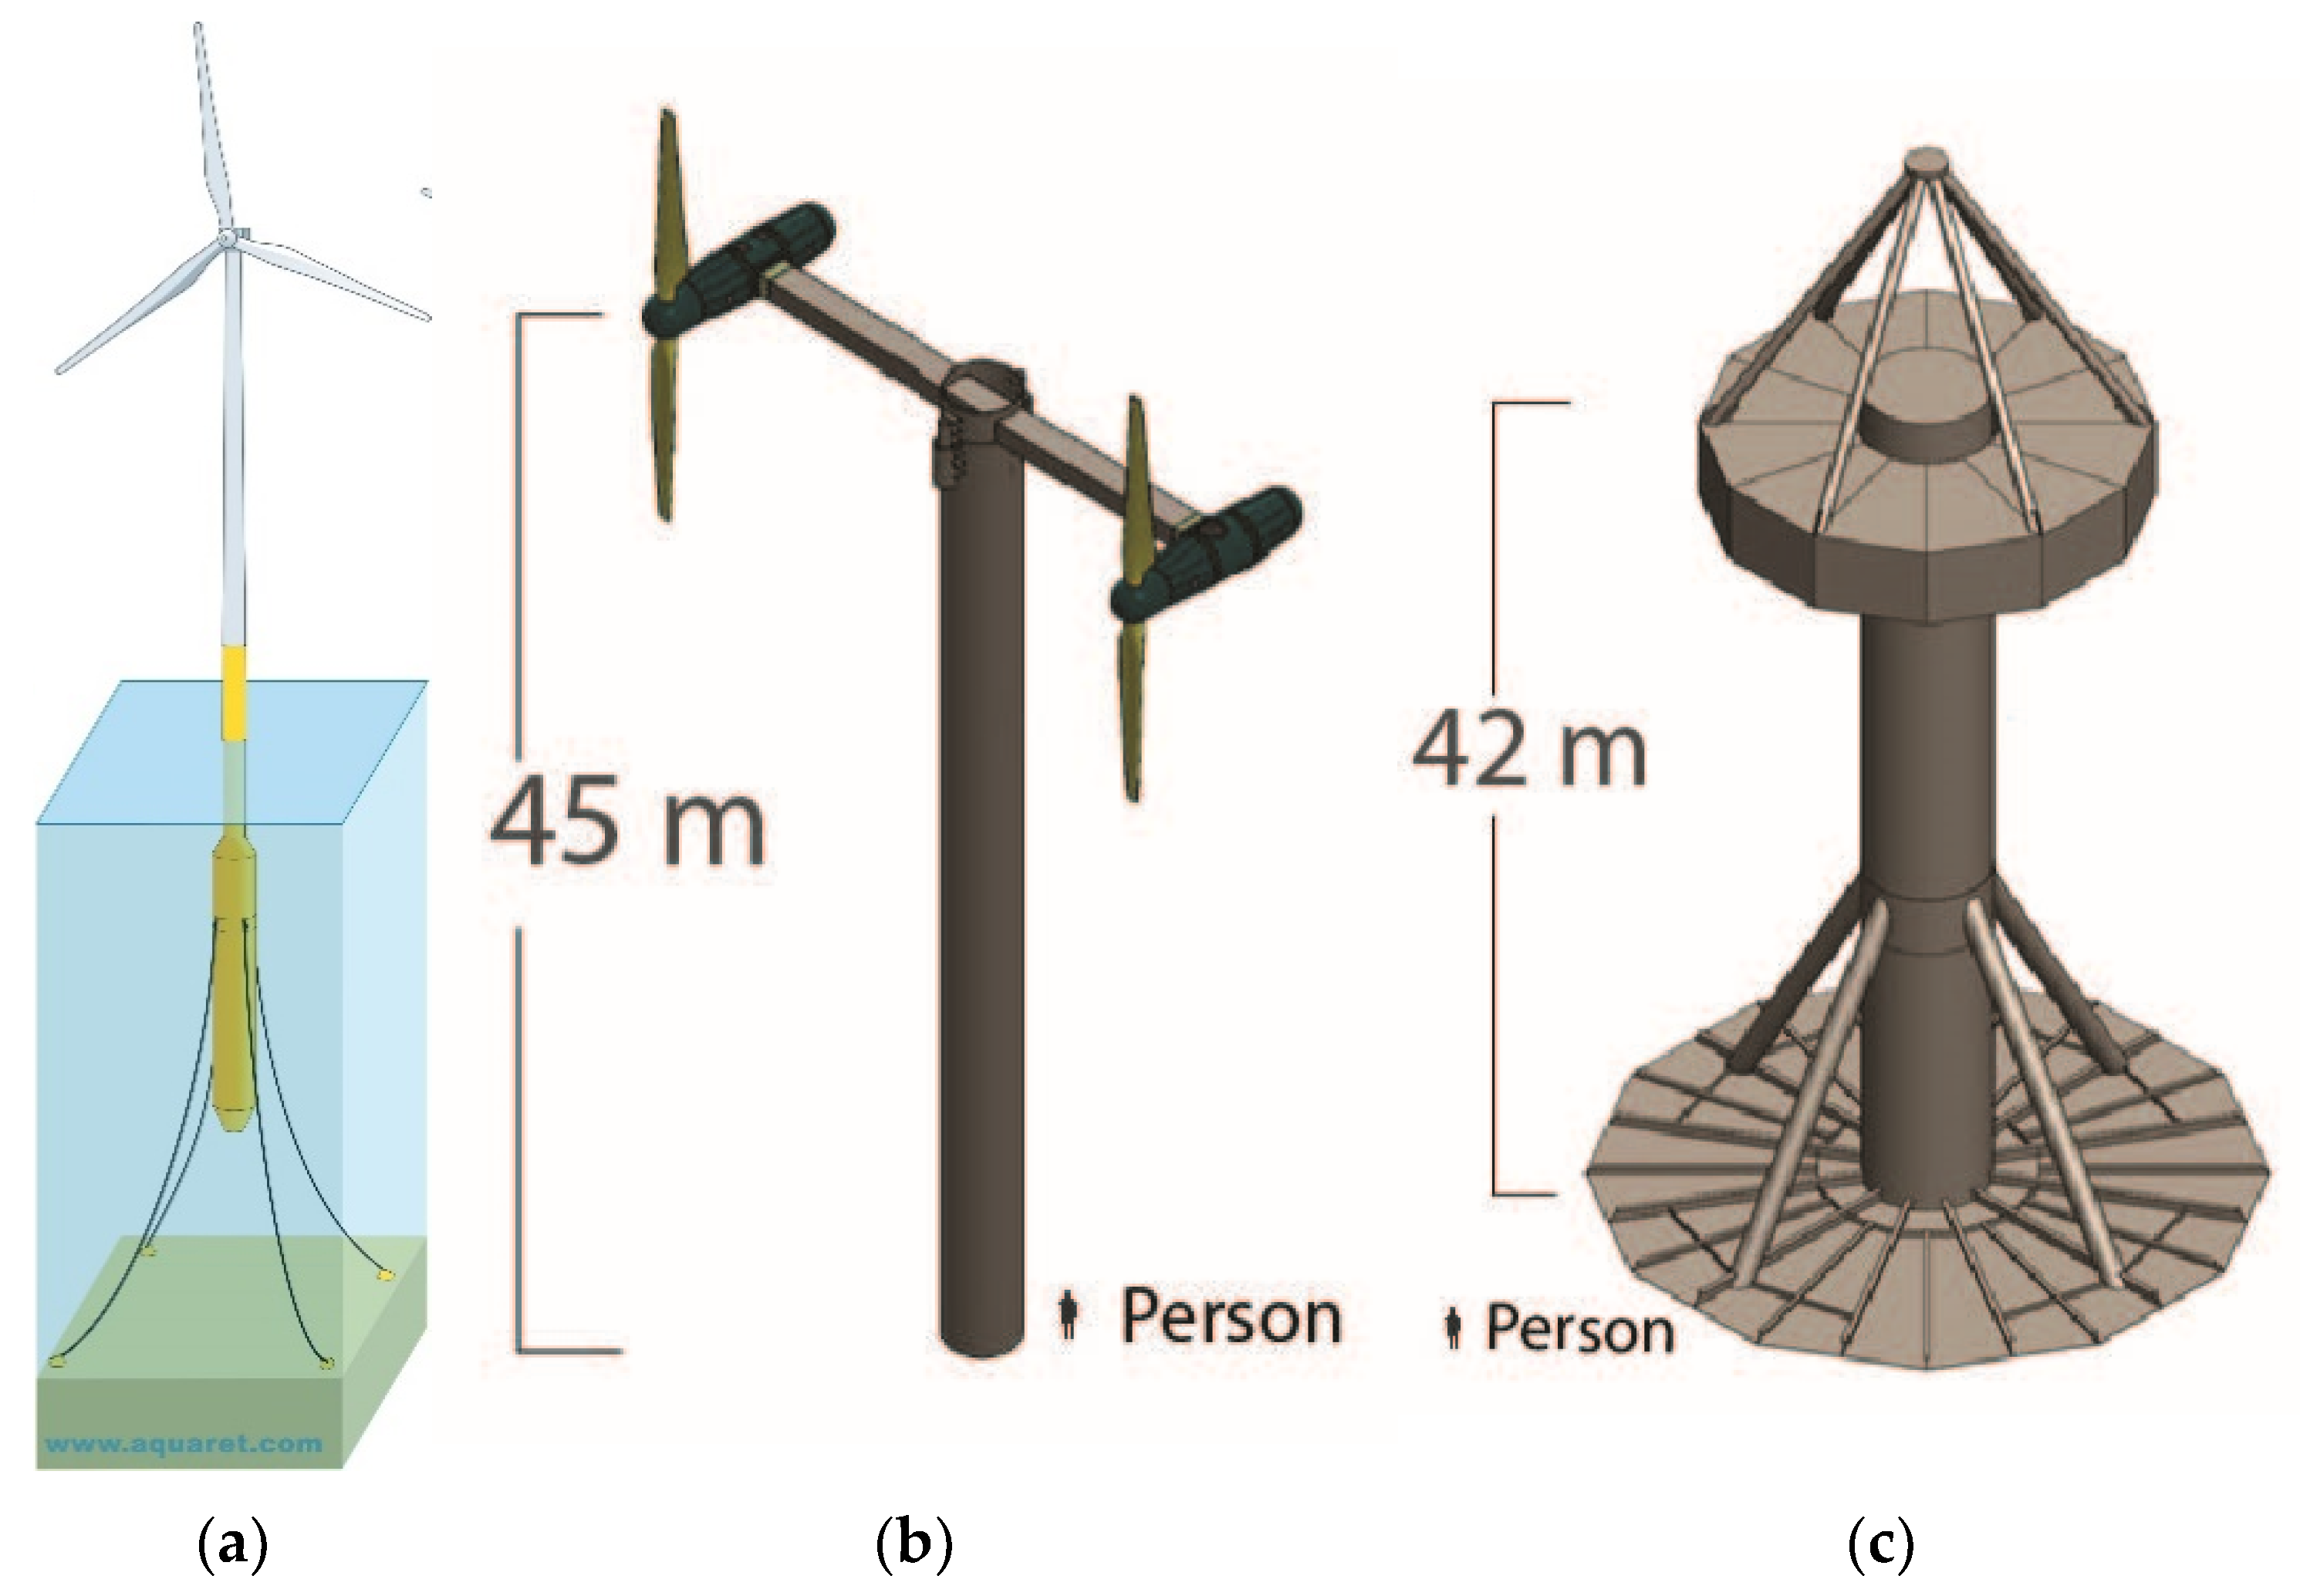
The methodology detailed in Section 2 has been applied to study the innovation requirements of three ORE technologies: (a) floating offshore wind, (b) tidal stream and (c) wave energy, as illustrated in Figure 3. These technologies could make significant contributions to the attainment of the net-zero targets, if cost reductions are achieved in line with the 2030 SET-Plan targets. Therefore, the studied case demonstrates the application of the methodology developed in investigating the innovation requirements to achieve the SET-Plan targets.

Figure 3.
Illustrative representations of the three case studies; (a) spar-type floating offshore wind system, adapted from [18] and reproduced with permission from aquaret.com ©Aqua-RET Project (EU Lifelong Learning Programme Agreement No LLP/LdV/TOI/2009/IRL–515), (b) RM1 tidal current reference model and (c) wave point absorber reference model RM3, reproduced with permission from Sandia National Laboratory [19,20].
The key inputs for the reversed LCOE calculation are the commercial stage cost target and the corresponding commercial stage cost-centre breakdown. For the former, the SET-Plan target LCOEs for 2030 are used, namely, 90 €/MWh for floating offshore wind, 100 €/MWh for tidal stream and 150 €/MWh for wave. It is notably more challenging to find commercial stage cost-breakdowns for technologies that have not yet been deployed at a commercial scale. Furthermore, it is not possible to publish cost-breakdowns for state-of-the-art technologies due to confidentiality and intellectual property concerns. Publicly-available cost-breakdowns have thus been chosen from the available literature that represent 100-device arrays of recent devices from 2014–2015. Maturity levels for each of the cost centres were then assigned through expert assessment, where discussions with sector stakeholders were undertaken. The criteria outlined in Section 2.2.1 were used to allocate these maturity levels. The following sections detail the cost breakdowns assumed for each of the three technologies in turn, and the stage of development for each cost centre.
Other relevant parameters, such as the discount rate and the project lifetime, are assumed to be the same for the three considered cases. An overview of these universal assumptions is provided in Table 2.
Table 2.
Universal assumptions used for extended reverse LCOE calculation for all technologies.
3.1. Floating Offshore Wind Case Study
For floating offshore wind, the 100-device array costs produced by Myhr et al. in [23] were used as a basis for the assumed proportional CAPEX breakdown. These are based on available design data from the first 5 MW Hywind demonstrator project with the help of expert elicitation and engineering assessment [24]. The Hywind technology consists of a direct drive wind turbine with a spar-type foundation, shown in Figure 3a.
The calculation assumptions specific to the floating offshore wind case study are shown in Table 3, with the cost centre breakdown and maturity level assumptions shown in detail in Table 4. The wind turbine and tower are combined as a single cost centre, separate from the floater. The floater is the only cost centre with a ‘low’ maturity level, as the key innovative component of the technology which is not present in fixed offshore wind deployments.
Table 3.
Technology-specific assumptions used in floating offshore wind case study.
Table 4.
Cost centre breakdown and corresponding maturity levels assumed for floating offshore wind; cost data based on [23].
3.2. Tidal Stream
For tidal stream, a 100-device array cost breakdown is used from the Sandia National Laboratories Reference Model Project [19,20]. Specifically, the 1.1 MW tidal reference model 1 (RM1) was used, illustrated in Figure 3b. The RM1 concept design is a dual-rotor variable-speed variable-pitch axial-flow tidal turbine device, inspired by the SeaGen system. It comprises a monopile foundation with a cross arm assembly used to mount the two rotors.
The calculation assumptions specific to the tidal stream case study are shown in Table 5, with the cost centre breakdown and maturity level assumptions shown in detail in Table 6. The pile is included within the device structural components, rather than within the foundation system, as it comprises the main device structure, as well as the anchor. Device installation and operations and maintenance (O&M) have been identified as the cost centres with ‘low’ maturity levels, as services must develop new procedures to install and operate tidal devices, which are not directly transferrable from existing offshore technologies.
Table 5.
Technology specific assumptions used in tidal stream case study.
Table 6.
Cost centre breakdown and corresponding component maturity levels assumed for tidal stream (bottom fixed), cost data based on [20].
3.3. Wave Energy
For wave energy, again a 100-device array cost breakdown is used from the Sandia National Laboratories Reference Model Project [19,20]. Specifically, the 286 kW wave reference model 3 (RM3) was used, illustrated in Figure 3c. The RM3 concept is a two-body floating point absorber, comprising of a vertical column spar buoy and a subsurface reaction plate, inspired by the Ocean Power Technology PowerBuoy.
The calculation assumptions specific to the wave energy case study are shown in Table 7, with the cost centre breakdown and maturity level assumptions shown in detail in Table 8. The cost centre breakdown is more detailed for the wave case study than for floating offshore wind and tidal stream, due to the number of components included within the device structure and PTO. Device control systems, commissioning, installation and O&M have been identified as the cost centres with ‘low’ maturity levels, which require innovative concepts and have the highest scope for cost reduction.
Table 7.
Technology specific assumptions used in wave case study.
Table 8.
Cost centre breakdown and corresponding component maturity levels assumed for wave (point absorber), cost data based on [25].
3.4. Case Studies Summary
The data has been summarised between the three technologies within nine cost categories: development and insurance; electrical infrastructure; mooring/foundation; device structural components; power take-off; subsystem integration; installation; contingency; and operations and maintenance. It can be seen from Table 4, Table 6 and Table 8 that the commercial scale cost breakdown data differs considerably between technologies, both in terms of the detail provided in the cost breakdown and the proportional share of costs. Figure 4 further illustrates this, showing the commercial scale cost centre breakdown with respect to the eight cost centres associated to CAPEX.
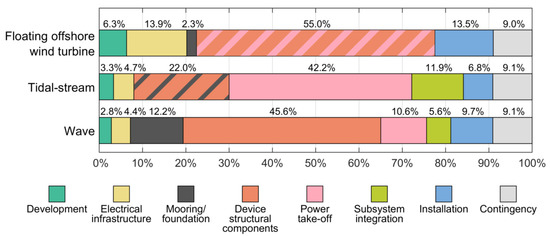
Figure 4.
Commercial scale CAPEX breakdowns by subsystem used as inputs to case studies. Note that some subsystems are combined in the source data, shown by hatched bars.
It should be noted that the breakdown between technologies is not completely consistent between the case studies in the source data, as separate data sources have been used for each technology. For example, the costs associated with the offshore wind turbine within the floating offshore wind case combine the floater, the tower and turbine to represent the ‘device structural components’, with no separation of the power take-off components. Additional granularity within the cost breakdown was not required in this case as the offshore wind turbine as a whole (including both tower and turbine) was assumed to be a relatively mature technology in its own right. Similarly for the tidal stream case, the monopile is included within the device structural components, as a single monopile is used as both the device anchor and for the device structure. These combined cost-centre allocations are illustrated by hatched bars in Figure 4.
4. Results
The following subsections summarise the results from each of the case studies outlined in Section 3, where the methodology detailed in Section 2 has been applied in order to calculate current cost thresholds from the SET-Plan future LCOE targets for 2030. The final subsection summarises and compares the results between the three technologies. The data presented in the results figures is tabulated in the supplementary materials provided.
4.1. Floating Offshore Wind
The early-stage technology cost breakdowns calculated for floating offshore wind are shown in Figure 5, alongside the commercial cost requirements to meet the SET-Plan target of 90 €/MWh. Costs are shown per MW of capacity. Starting from the commercial-stage CAPEX requirement of 2 €M/MW, the early-stage CAPEX ranges from 2.5 €M/MW to 5.2 €M/MW depending on the assumed learning rates. Similarly, from a commercial-stage discounted lifetime OPEX requirement of 0.6 €M/MW the early-stage OPEX ranges from 0.8 €M/MW to 1.8 €M/MW. The cost centres with the highest expected cost reductions between the early-stage and the commercial-stage cost breakdowns are the mooring/foundation (costs reduce by 66%), device structural components and power take-off (64%), and O&M (66%). This is due to the lower maturity levels (and thus higher learning rates) associated with mooring/foundation systems, floatation structures and O&M.
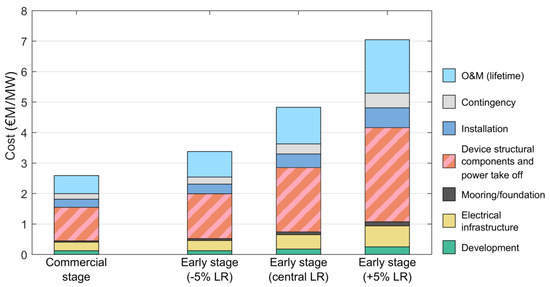
Figure 5.
Results per cost centre for floating offshore wind commercial-stage and early-stage CAPEX. Note that some subsystems are combined, shown by hatched bars.
4.2. Tidal Stream
The early-stage cost breakdowns calculated for the tidal stream case study are shown in Figure 6 alongside the commercial-stage cost requirements to meet the SET-Plan target of 100 €/MWh. Costs are shown per MW of capacity. The early-stage CAPEX ranges from 2.6 €M/MW to 6.9 €M/MW, derived from a commercial-stage CAPEX requirement of 1.9 €M/MW. The discounted early-stage lifetime OPEX ranges from 1.5 €M/MW to 4.3 €M/MW, from a commercial-stage lifetime OPEX requirement of 0.6 €M/MW. The cost centres with the highest expected cost reduction between the early-stage and the commercial-stage cost breakdowns were O&M (costs reduce by 87%), installation (81%) and subsystem integration (77%). This is due to lower maturity levels, and thus higher learning rates, in marine operations and subsystem integration.
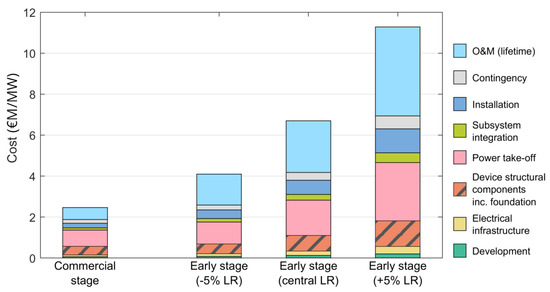
Figure 6.
Results per cost centre for tidal stream commercial-stage and early-stage CAPEX. Note that some subsystems are combined, shown by hatched bars.
4.3. Wave
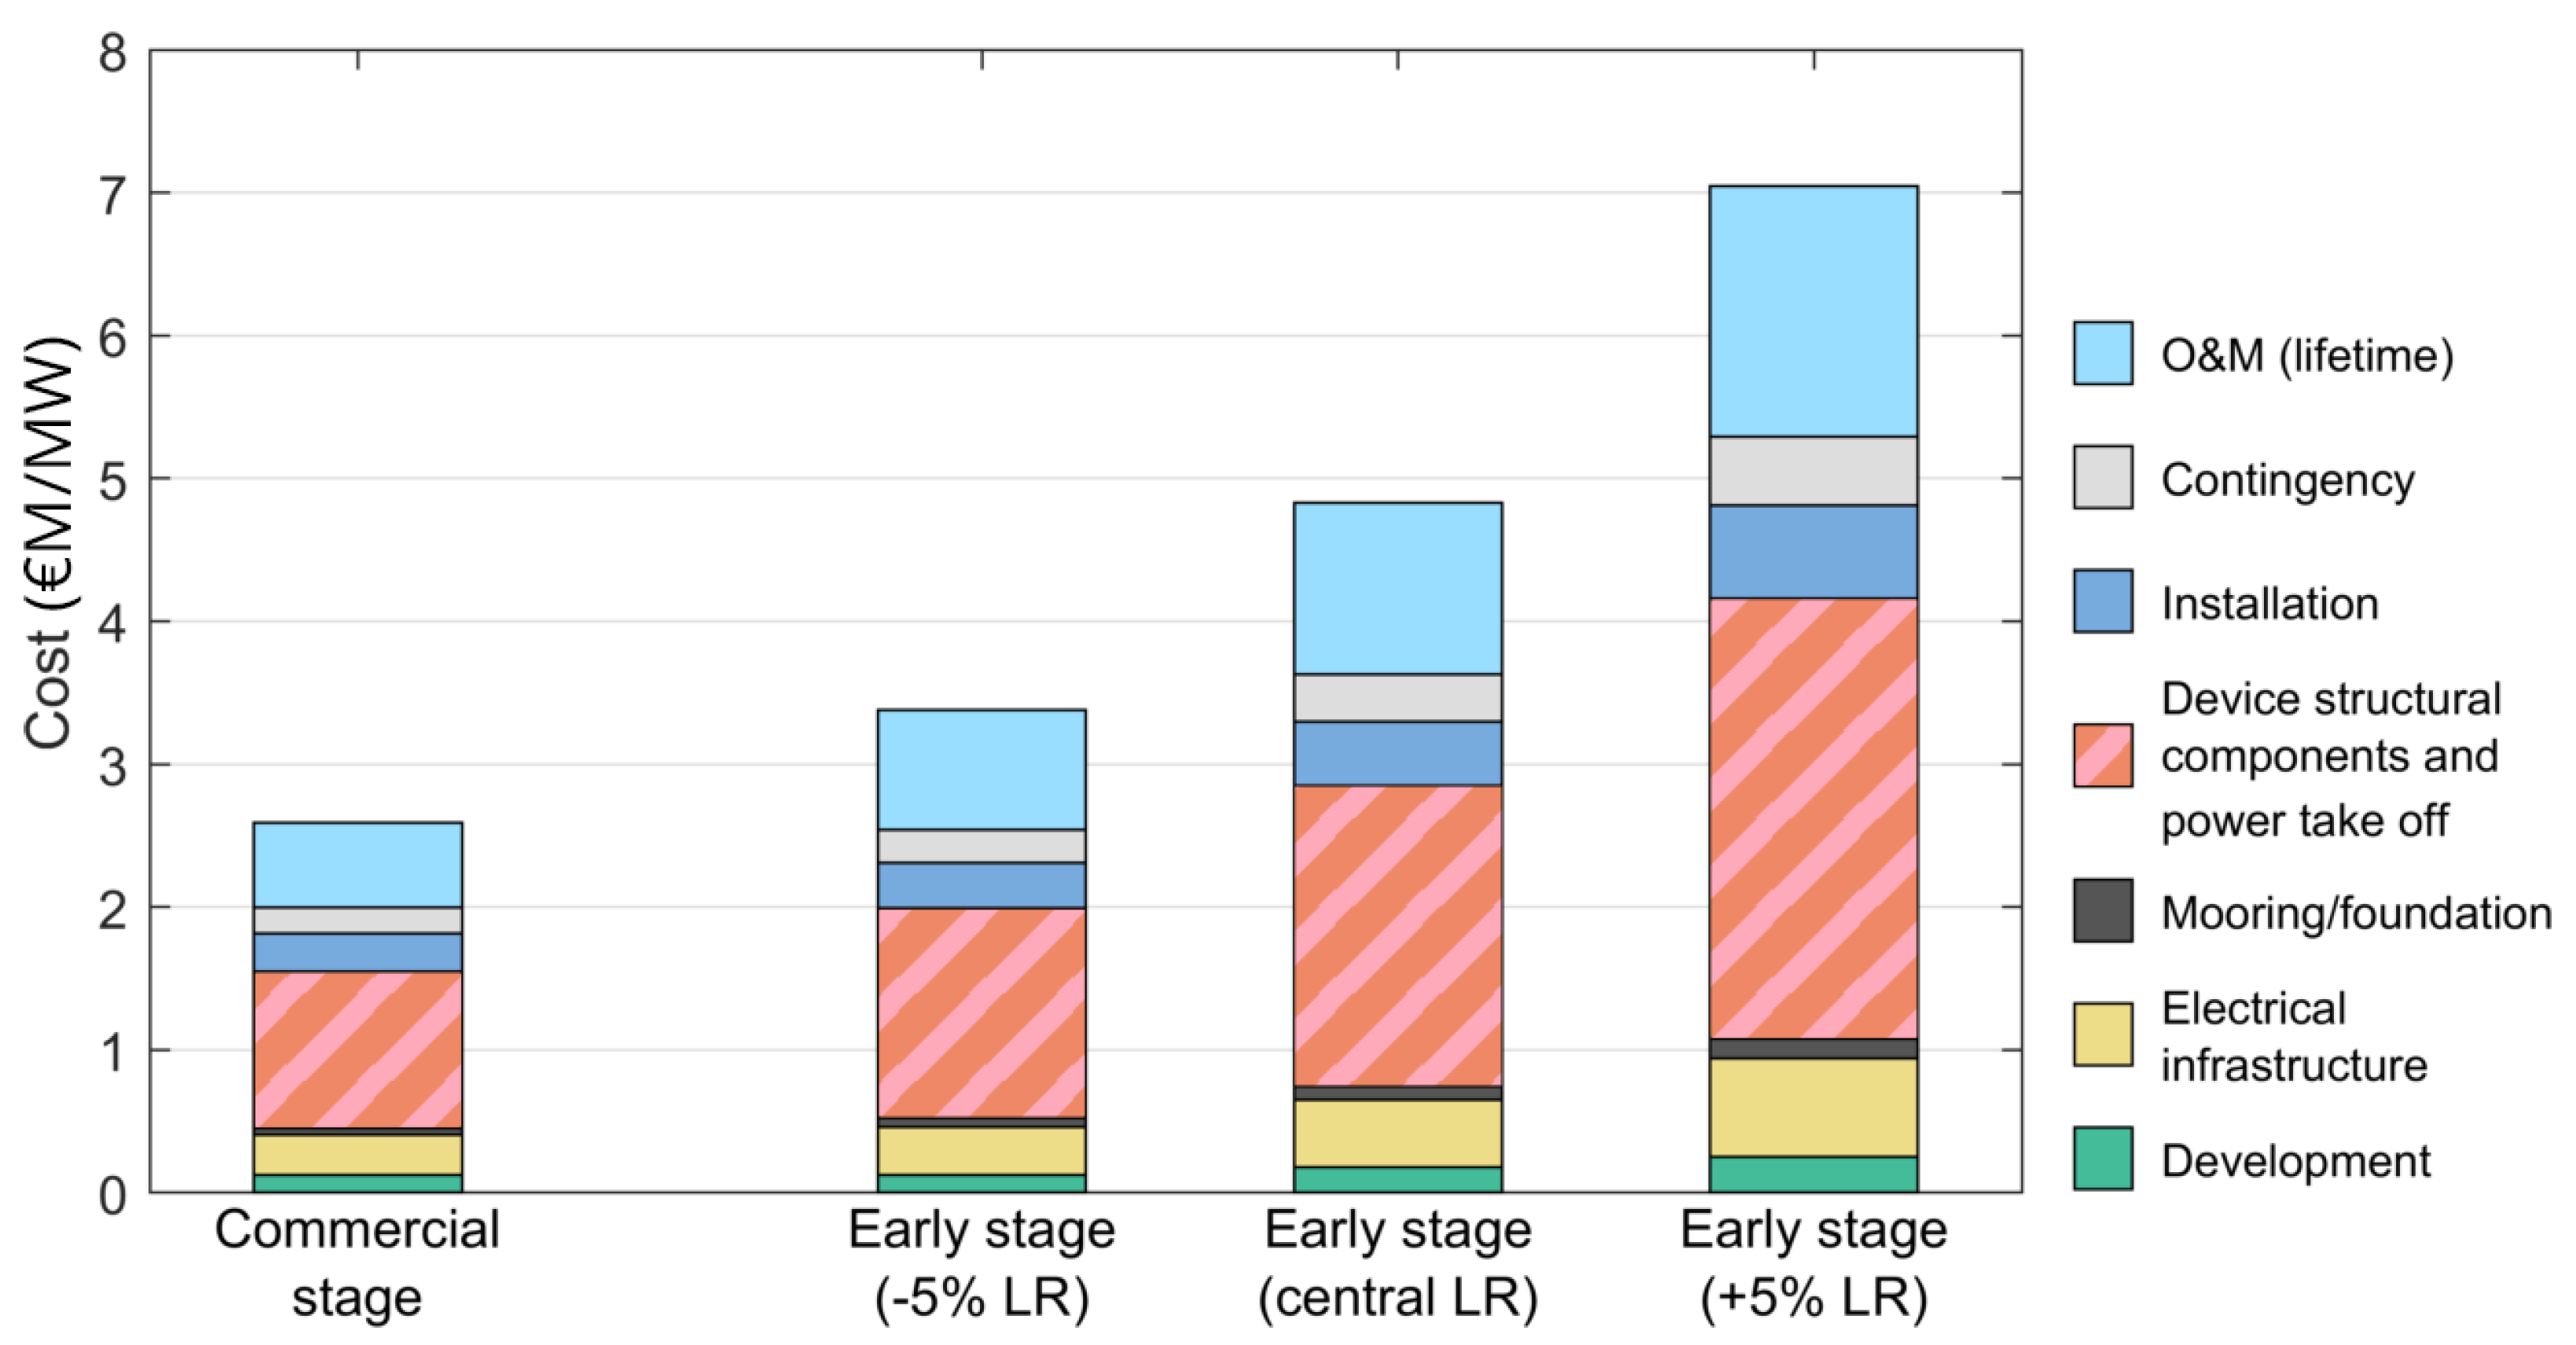
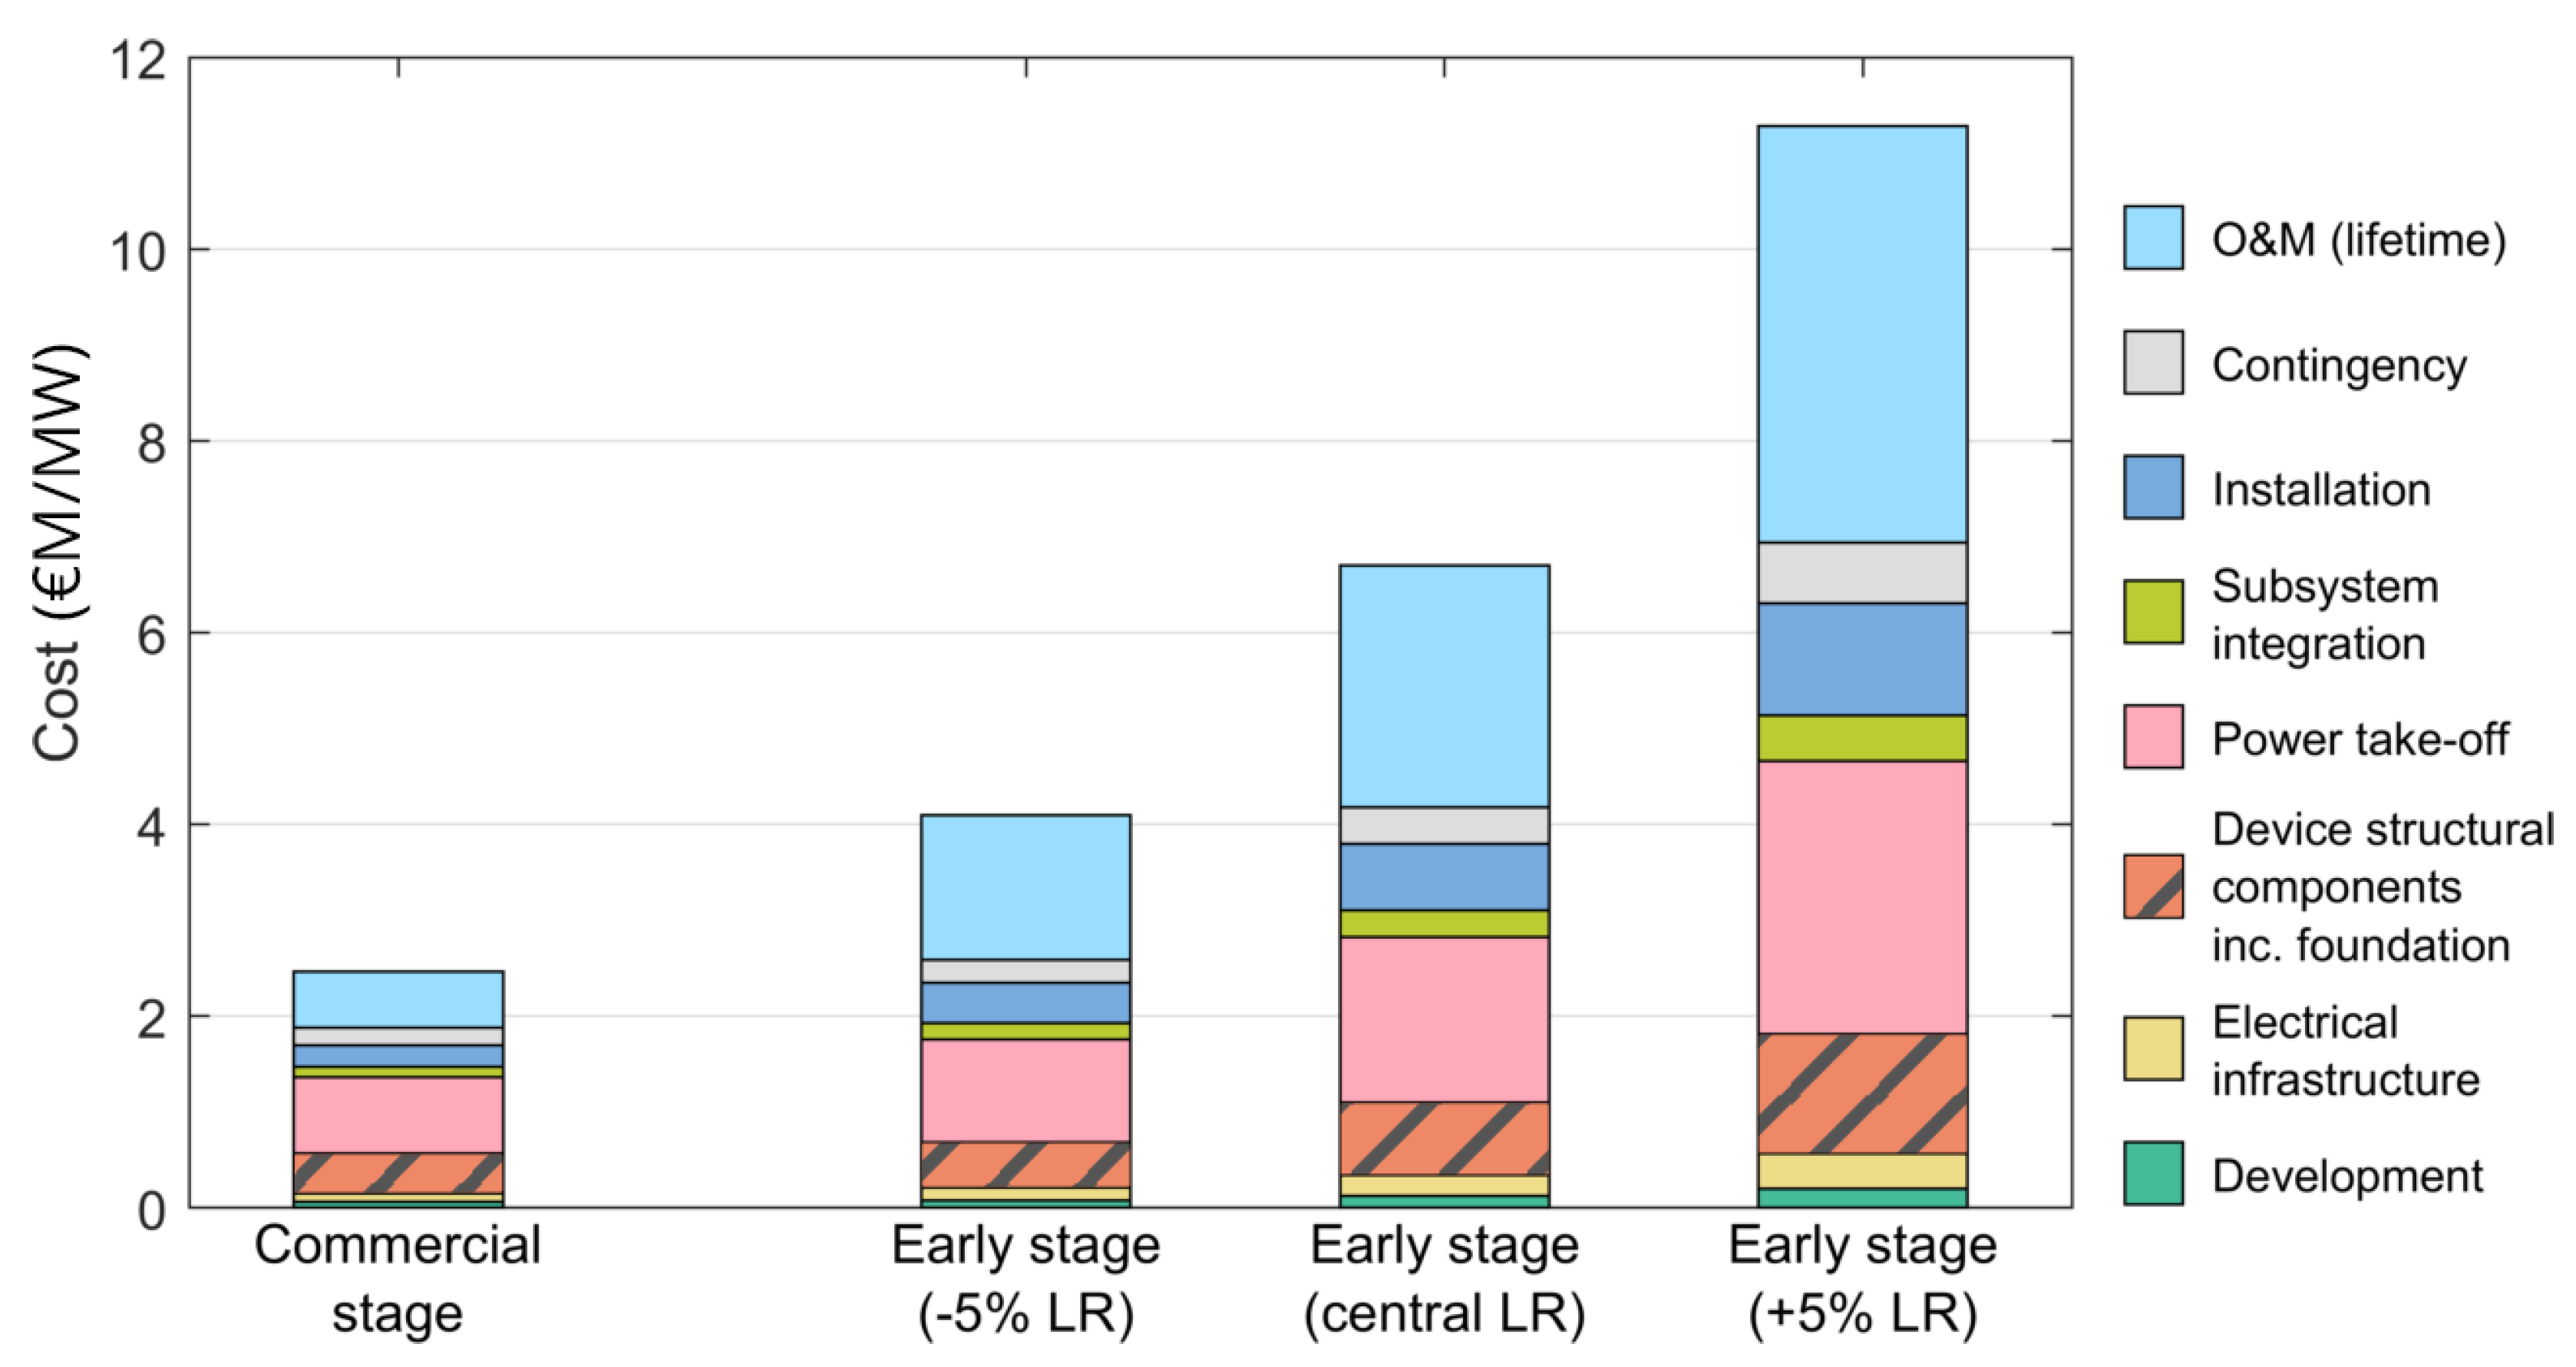
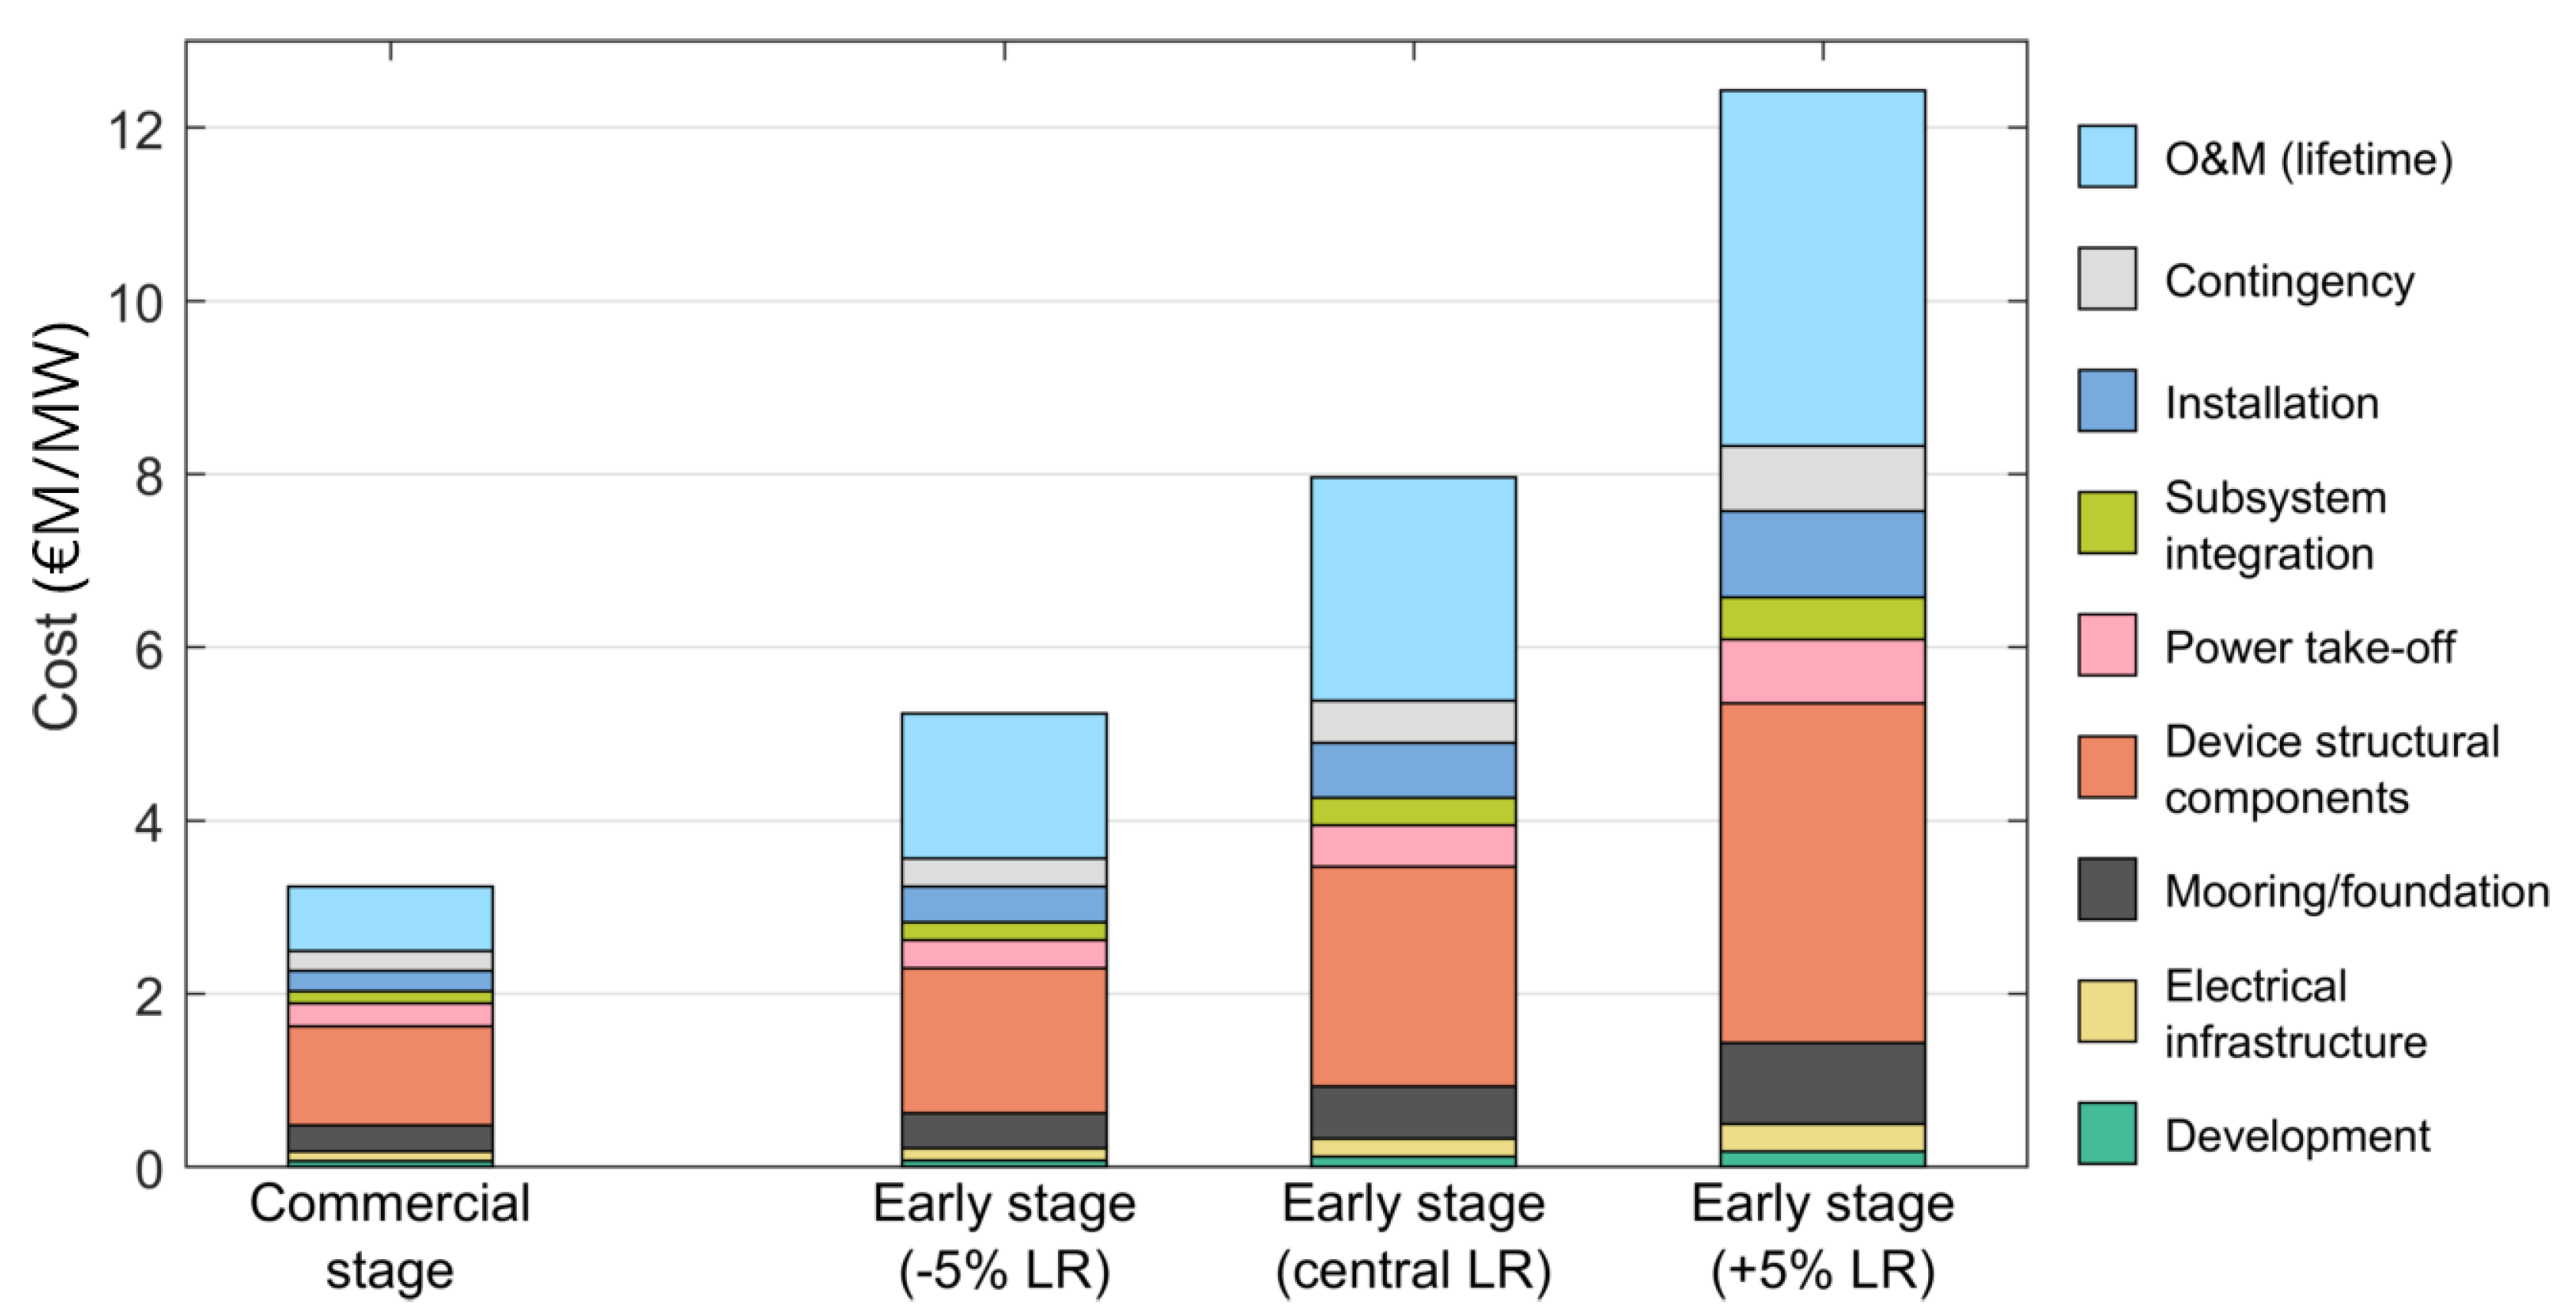
The early-stage cost breakdowns calculated for the wave energy case study are shown in Figure 7 alongside the commercial-stage cost requirements to meet the SET-Plan target of 150 €/MWh. Costs are shown per MW of capacity. The early-stage CAPEX ranges from 3.6 €M/MW to 8.3 €M/MW, from a commercial-stage CAPEX requirement of 2.5 €M/MW. The discounted early-stage lifetime OPEX ranges from 1.7 €M/MW to 4.1 €M/MW, from a commercial-stage lifetime OPEX requirement of 0.7 €M/MW. The cost centres with the highest expected cost reductions between the early-stage and the commercial-stage cost breakdowns are O&M (cost reduce by 82%), installation (76%), device structural components (71%) and subsystem integration (71%). This is due to lower maturity levels, and thus higher learning rates, in marine operations, novel wave energy device concepts and subsystem integration.
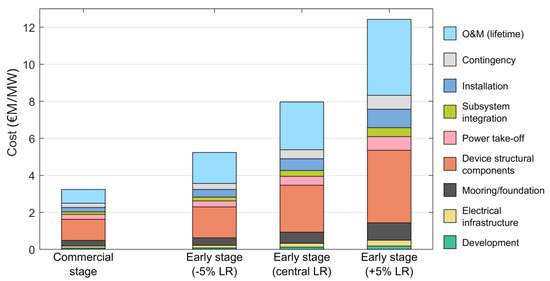
Figure 7.
Results per cost centre for wave energy commercial-stage and early-stage CAPEX.
4.4. Technology Comparison
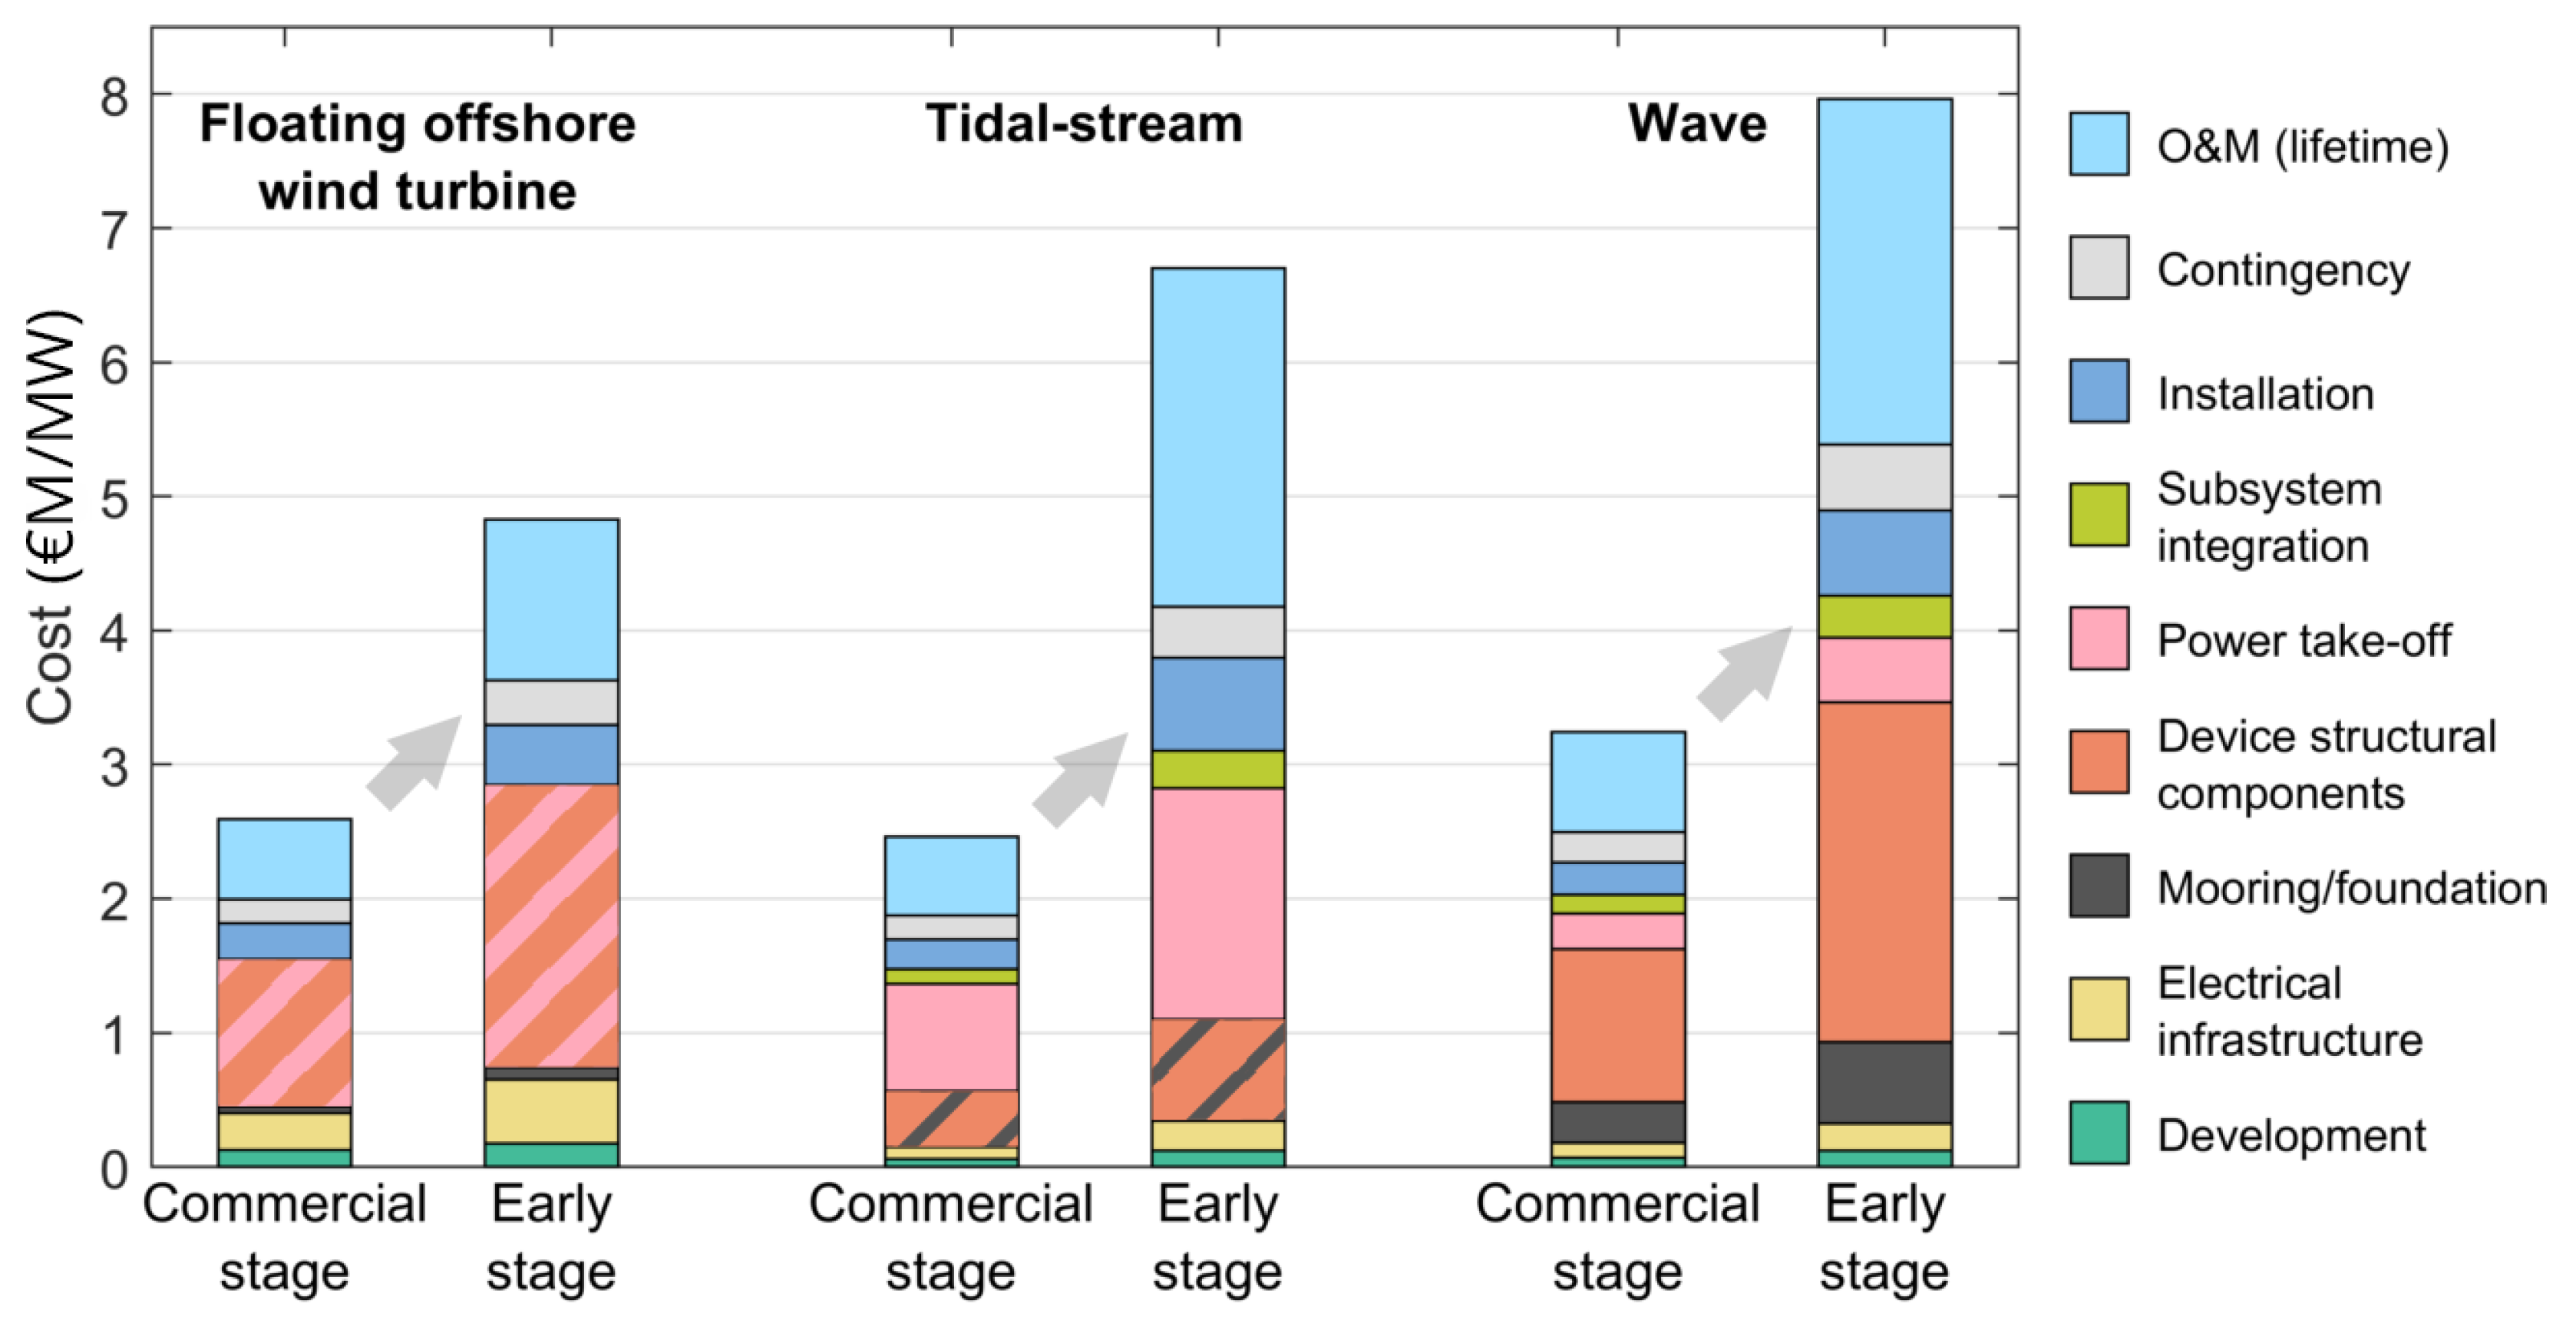
The calculation of early-stage target costs for three different ORE technologies allows for a comparison of the results between technologies. Figure 8 shows the commercial-stage and early-stage cost requirements for the central LR scenario for each of these technologies. The total costs and cost breakdown differ considerably for the different technologies, which reflects the difference in components and services required as well as the difference in maturity level of each of the three technologies. For example, the total cost permissible for early-stage wave is 1.6 times the total cost for early-stage floating wind in the central LR scenario.
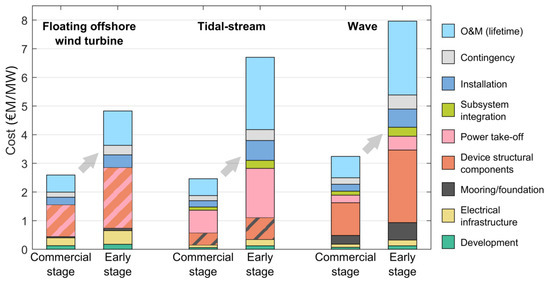
Figure 8.
Commercial- and early-stage costs for the central LR scenario for each of the three offshore renewable technologies. Note that some subsystems are combined, shown by hatched bars.
Interesting insights are gained when comparing the commercial-stage target costs for the three technologies, shown in Table 9. The total CAPEX and lifetime OPEX for the floating offshore wind array are slightly higher than the equivalent costs for the tidal stream array, even though the cost target of 90 €/MWh for floating offshore wind is less than the cost target of 100 €/MWh for tidal stream. This is because of the difference in capacity factors assumed for these technologies, which are 44% for floating offshore wind and 39% for tidal stream. However, the early-stage cost threshold values calculated for floating offshore wind are lower than those for tidal stream, as shown in Table 10. This is due to the cost centre maturity assumptions resulting in higher maturity levels, and thus, lower learning rates being applied to floating offshore wind cost centres. In other words, since a lower cost reduction potential is identified for floating offshore wind than for tidal energy technologies, the early-stage cost of floating offshore wind is expected to be closer to the target cost.
Table 9.
Commercial stage target costs per MW for floating offshore wind, tidal stream, and wave energy.
Table 10.
Early-stage target costs per MW for floating offshore wind, tidal stream and wave energy for the central LR scenario.
The cost-weighted average learning rates applied to CAPEX in this analysis are shown in Table 11. Here, the average overall learning rate applied for each of the low, mid and high learning scenarios has been calculated, weighted by the cost component breakdowns shown in Table 4, Table 6 and Table 8. It can be seen that, within each of the learning rate scenarios, floating offshore wind has the lowest average learning rate and wave energy has the highest average learning rate, reflecting the comparative maturity of the generation technologies.
Table 11.
Cost-weighted average learning rates applied to CAPEX in the analysis.
5. Discussion
This section discusses the case study early-stage target cost results presented in Section 4. First, the calculated target costs are benchmarked against typical costs for current ORE arrays. Secondly, the limitations and uncertainties associated with the calculation methodology and case study results are discussed.
5.1. Comparison with Existing Devices
To demonstrate how the methodology could be used to judge how on-track the selected ORE technologies are to meeting long-term cost targets, we can compare the early-stage cost target results from Section 4 with current cost breakdowns for floating offshore wind, tidal stream and wave energy devices. To do this, ‘typical costs’ for small scale floating offshore wind, tidal stream and wave energy projects in 2020 have been taken from an Ocean Power Innovation Network value chain study by BVG associates [26] and compared with the central LR scenario early-stage results for each technology in Table 12. The central LR scenario has been selected purely to demonstrate how this methodology can be used to benchmark calculated target costs against published current cost figures. It can be seen in Table 12 that the BVGA figures are higher than the estimated thresholds for all wave energy cost centres, and many of the tidal stream and floating offshore wind cost centres, resulting in a negative percentage change. This indicates that if the costs estimated by BVGA are representative of early-stage projects of these technologies, then further innovation is still required for each of these technologies beyond the innovation assumed to be implicit within the cost-centre-specific learning rates to achieve the SET-Plan targets in 2030.
Table 12.
Percentage change between early-stage cost results (central LR) and BVG associates ‘typical costs’ for small-scale projects in 2020. Negative figures indicate where BVGA 2020 figures are higher than the early-stage thresholds calculated.
Interestingly, the +5% LR cost target results, tabulated in the supplementary materials, are greater than the BVGA figures across all cost centres for the floating offshore wind and tidal stream technologies. The +5% LR wave cost target results remain lower than the BVGA figures, however. These results indicate that for the case studies undertaken, wave energy devices could still require significant innovations across almost all components and services, while tidal stream and floating offshore wind technologies require to undertake innovative activities to ensure slightly higher learning rates than those assumed in the central LR scenario. In these latter cases, initial pointers of potential focus areas for innovation activities can also be derived from these figures, for example within the device structural components and the mooring and foundations. The percentage difference in terms of Total CAPEX is also shown in Table 12, to allow for a comparison of the technology as a whole alongside the individual cost centres.
It should be noted that the early-stage cost results derived in Section 4 are based on three specific technology case studies, selected to demonstrate the methodology outlined in Section 2 using publicly available cost data. The specific technology cost assumptions allocated to each cost centre may not be completely consistent between these case studies and the BVGA cost estimates for current projects. This should be considered when using this methodology to identify specific hotspots in terms of innovation requirements. Ideally, when benchmarking current cost target results to produce recommendations for innovation requirements, these would be based on future and current deployments of the same technology.
5.2. Limitations and Uncertainties
As with any study, there are limitations and uncertainties associated with the presented methodology and its application within this study. The case study assumptions have been detailed in Section 3, and the analysis from Section 4 can be extended to explore the sensitivity of the output early-stage cost thresholds to some of these assumptions.
A key assumption is the array CAPEX cost centre breakdown, shown in Table 4, Table 6 and Table 8. These cost breakdowns are specific to certain devices: the Sandia National Laboratory RM1 and RM3 models and the Hywind demonstration technology. The input data have been scaled up to represent large-scale array costs in terms of infrastructure and marine operations, but they will not represent the cost breakdowns of all future offshore renewable energy arrays. ORE technology development could take a range of different forms by 2030. For example, the Hywind technology design involves a spar buoy floatation system, but there are many competing floatation systems currently under research and development. Similarly, the RM1 and RM3 models represent specific tidal stream and wave energy devices, a twin nacelle bottom-fixed tidal stream design and a steel point-absorber WEC design. There have been many device and array demonstration deployments of wave and tidal technologies in recent years using radically different device designs, which could have very different cost-centre breakdowns. As such, the results presented within this study are not intended to indicate the innovation requirements of the sector as a whole, but to present a methodology which can be applied by technology developers and technology funders to indicate technology-specific innovation requirements.
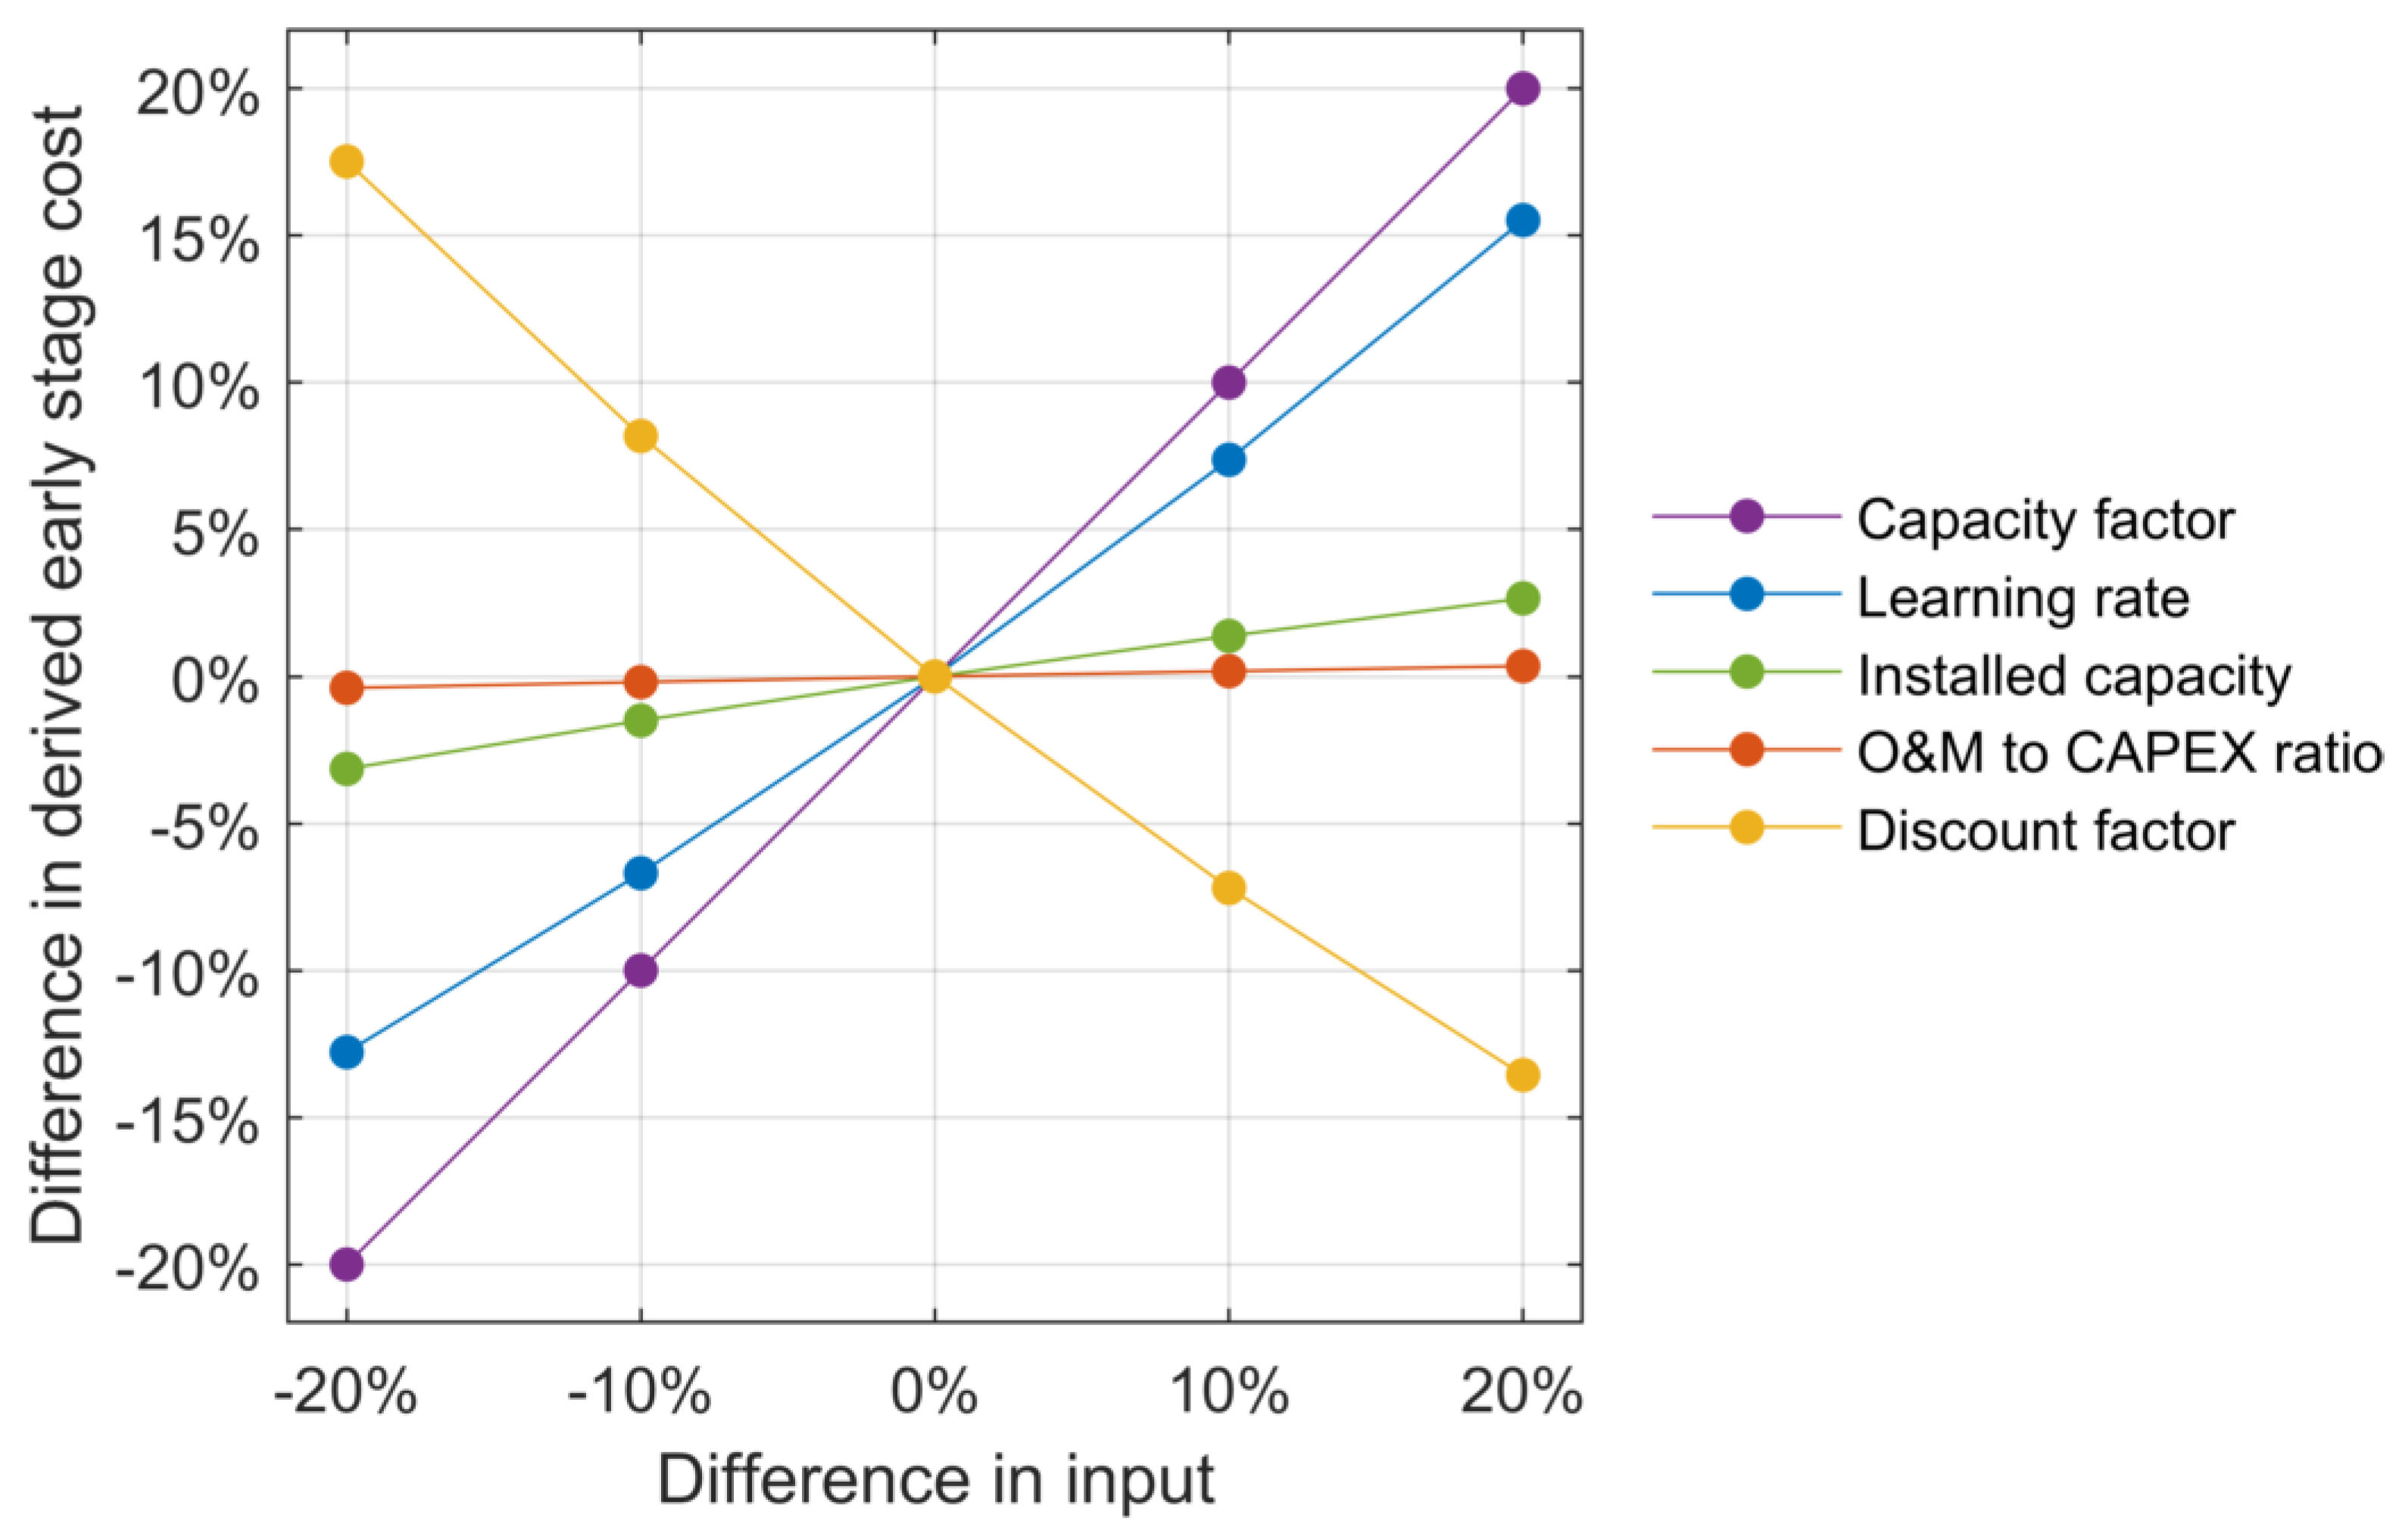
Figure 9 shows the sensitivity of the early-stage floating offshore wind cost results for the central LR scenario to five calculation inputs: learning rates, capacity factor, OPEX-to-CAPEX ratio, installed capacity to reach the SET-Plan target and discount factor. It can be seen that the results are most sensitive to capacity factor assumptions followed by the assumptions on discount factors and learning rates. The results are considerably less sensitive to the OPEX-to-CAPEX ratio and installed capacity assumptions. Similar sensitivity analysis has been applied to the tidal stream and wave energy case studies, and the results have been found to be consistent with the floating offshore wind sensitivity presented here.
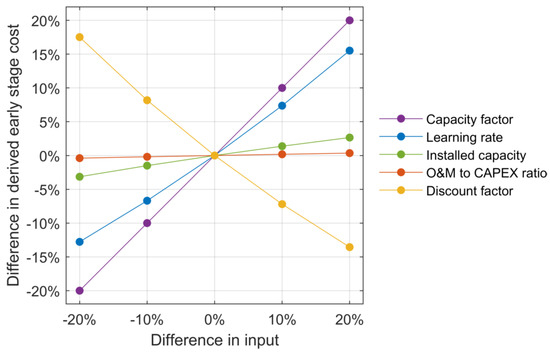
Figure 9.
Sensitivity analysis on floating offshore wind results, based on central LR scenario.
It is also important to consider where the highest uncertainties exist within the input cost data. There are particularly high uncertainties associated with operational expenditures for all offshore renewable technologies included in this study. Due to the relatively nascent stage of development, there is very little real-sea operational data spanning multiple years of operation. As such, many studies tend to quantify OPEX as a percentage of CAPEX rather than calculate the costs associated with marine operations in detail [27,28]. Some computational models and tools have been developed to conduct more detailed modelling of operational costs, accounting for component reliability and waiting times based on vessel operational limits [29,30,31]. Without the long-term data required to validate such models, however, such costs cannot be verified.
6. Conclusions
This work has presented a methodology to investigate the current early-stage cost requirements to reach the Strategic Energy Technology (SET) Plan LCOE targets for 2030 for floating offshore wind, tidal stream and wave energy devices. The innovation and development requirements to reach these SET-Plan LCOE targets have been found to differ considerably between these three technologies, due to their different physical compositions, cost centre breakdowns, and technology maturity levels.
The case studies presented within this work use commercial-scale cost inputs from the Sandia Laboratories Reference Models Project for wave and tidal and the Hywind demonstration project for floating offshore wind. The methodology presented applies component-based learning rates to produce the cost thresholds for current deployments, if the SET-Plan targets are to be met. The comparison with ‘typical costs’ of current projects in 2020 highlights where innovation and cost reduction still need to take place. The findings from these case studies indicate that the floating offshore wind and tidal stream technologies represented are largely on track to meet future cost targets if the technologies achieve slightly more ambitious learning rates and deployment levels than the central assumptions included in our analysis. Innovative step-changes are still implicit within these ambitious learning rates and as such, the case study results indicate that these technologies still require funding for research, development and demonstration activities. In addition to R&D funding, market-pull mechanisms will be required to allow these technologies to meet the deployment necessary to achieve this long-term cost reduction.
Wave energy technology, however, requires significant further innovation to meet long-term target costs due to its lower maturity level and lack of convergence on device design. The wave energy case study presented here indicates that an innovative step change is required across all cost centres, resulting in cost reduction exceeding the more ambitious learning rate assumptions within this study, if the long-term cost targets are to be met. This finding highlights the importance of further focused innovation funding for wave energy, for example through the Wave Energy Scotland [32] and EuropeWave [33] programmes. This focused innovation funding can be supported by innovation studies and roadmaps, so long as the recommendations are evidence-based and taken up consistently by funding providers.
This work is intended to illustrate a methodology which can be used to identify innovation requirements for early-stage renewable energy technologies. It can be utilised by researchers, technology developers and funding providers looking to benchmark current technologies against early-stage technology requirements and justify further innovative research with the purpose of reducing technology costs. It could be of particular use to indicate the merit of specific emerging technologies to funding bodies and to facilitate decision making for future funding calls based on the technologies which are most on track to meet long term cost reduction targets. Future work could include applying this methodology to current offshore renewable energy demonstration projects, to analyse the innovation requirements of existing devices in meeting long term cost reduction targets.
Supplementary Materials
The following supporting information can be downloaded at: https://www.mdpi.com/article/10.3390/en15051732/s1, Table S1: Results per cost centre for floating offshore wind, commercial- and early-stage costs and percentage change, Table S2: Results per cost centre for tidal stream, commercial- and early-stage costs and percentage change, Table S3: Results per cost centre for wave energy, commercial- and early-stage costs and percentage change.
Author Contributions
Conceptualization, S.P., C.C. and H.J.; methodology, S.P., A.G.-T., A.d.A., O.R. and H.J.; data curation, S.P. and A.G.-T.; writing—original draft preparation, S.P., A.G.-T. and O.R.; writing—review and editing, S.P., A.G.-T., D.R.N., O.R., A.d.A., C.C. and H.J.; visualization, S.P., A.G.-T. and D.R.N.; funding acquisition, H.J. All authors have read and agreed to the published version of the manuscript.
Funding
This work has been funded by the Engineering and Physical Sciences Research Council (EPSRC) SuperGen Offshore Renewable Energy Hub, EP/S000747/1.
Institutional Review Board Statement
Not applicable.
Informed Consent Statement
Not applicable.
Data Availability Statement
The data used to illustrate the methodology are contained within the paper and the Supplementary Materials.
Acknowledgments
The authors would like to thank several past researchers at the University of Edinburgh’s Policy and Innovation Group for their valuable input to this methodology, namely: David Crooks, Encarni Medina-Lopez, Gerard Avellaneda-Domene, Simon Robertson, Leonore van Velzen, and Maria Vanegas-Cantarero.
Conflicts of Interest
The authors declare no conflict of interest.
References
- UK Government. Offshore Wind Sector Deal. 2019. Available online: https://www.gov.uk/government/publications/offshore-wind-sector-deal (accessed on 15 November 2021).
- Carbon Trust. Accelerating Marine Energy the Potential for cost Reduction-Insights from the Carbon Trust Marine Energy Accelerator; Carbon Trust: London, UK, 2011. [Google Scholar]
- Garcia-Teruel, A.; Jeffrey, H. The Economics of Floating Offshore Wind—A Comparison of Different Methods (Figures). 2020. Available online: https://figshare.com/articles/figure/The_economics_of_floating_offshore_wind_A_comparison_of_different_methods/12656300 (accessed on 6 January 2022).
- Garcia-Teruel, A.; Jeffrey, H. The economics of floating offshore wind—A comparison of different methods. In Proceedings of the 4th International Conference on Renewable Energies Offshore (RENEW 2020), Lisbon, Portugal, 12–15 October 2020. [Google Scholar]
- Noble, D.R. Levelised Cost of Energy Estimates of Ocean Energy. January 2022. Available online: https://figshare.com/articles/figure/Levelised_Cost_of_Energy_estimates_of_ocean_energy/17186117 (accessed on 6 January 2022).
- European Commission. SET-Plan Offshore Wind Implementation Plan; European Commission: Brussels, Belgium, 2018; pp. 1–70. [Google Scholar]
- Temporary Working Group Ocean Energy. SET-Plan Ocean Energy—Implementation Plan; European Commission: Brussels, Belgium, 2018; pp. 1–50. [Google Scholar]
- Jamasb, T. Technical change theory and learning curves: Patterns of progress in electricity generation technologies. Energy J. 2007, 28, 51–71. [Google Scholar] [CrossRef] [Green Version]
- Offshore Renewable Energy Catapult. Floating Offshore Wind: Cost Reduction Pathways to Subsidy Free. 2021. Available online: https://ore.catapult.org.uk/?orecatapultreports=floating-offshore-windcost-reduction-pathways-subsidy-free (accessed on 25 November 2021).
- Smart, G.; Noonan, M. Tidal Stream and Wave Energy Cost Reduction and Industrial Benefit. Summary Analysis. 2018. p. 21. Available online: https://ore.catapult.org.uk/?orecatapultreports=tidal-stream-and-wave-energy-cost-reduction-and-industrial-benefit (accessed on 11 November 2021).
- Astariz, S.; Iglesias, G. Wave energy vs. other energy sources: A reassessment of the economics. Int. J. Green Energy 2015, 13, 747–755. [Google Scholar] [CrossRef]
- Yeh, S.; Rubin, E.S. A review of uncertainties in technology experience curves. Energy Econ. 2012, 34, 762–771. [Google Scholar] [CrossRef]
- Junginger, M.; Faaij, A.; Turkenburg, W.C. Cost Reduction Prospects for Offshore Wind Farms. Wind Eng. 2004, 28, 97–118. [Google Scholar] [CrossRef]
- Pennock, S.; Crooks, D.; Van Velzen, L.; Garcia-Teruel, A. WaveBoost Deliverable D7.2: Techno-Economic Analyses. 2019. Available online: https://cordis.europa.eu/project/id/727598/results (accessed on 11 November 2021).
- Bloise Thomaz, T.; David, C. OPERA Deliverable D7.3: Tracking Metrics for Wave Energy Technology Performance. 2019. Available online: https://cordis.europa.eu/project/id/654444/results (accessed on 11 November 2021).
- de Andres, A.; Medina-Lopez, E.; Crooks, D.; Roberts, O.; Jeffrey, H. On the reversed LCOE calculation: Design constraints for wave energy commercialization. Int. J. Mar. Energy 2017, 18, 88–108. [Google Scholar] [CrossRef]
- Junginger, M.; Louwen, A. (Eds.) Technological Learning in the Transition to a Low-Carbon Energy System; Elsevier: Amsterdam, The Netherlands, 2020. [Google Scholar]
- Aqua-RET. Available online: https://www.aquaret.com/ (accessed on 6 December 2021).
- Neary, V.S.; Previsic, M.; Jepsen, R.A.; Lawson, M.; Yu, Y.; Copping, A.E.; Fontaine, A.A.; Hallett, K.C.; Murray, D.K. Methodology for Design and Economic Analysis of Marine Energy Conversion (MEC) Technologies; SAND2014-9040; Sandia National Laboratories: Albuquerque, NM, USA, 2014. [Google Scholar]
- Jenne, D.S.; Yu, Y.-H.; Neary, V. Levelized Cost of Energy Analysis of Marine and Hydrokinetic Reference Models; National Renewable Energy: Golden, CO, USA, 2015. [Google Scholar]
- Villate, J.L.; Lopez-Mendia, J. Cost of Ocean Energy: Analysis and Forecasts of the Cost of Energy of Ocean Energy Converters; International Energy Agency Ocean Energy Systems: Paris, France, 2019. [Google Scholar]
- Nijs, W.; Ruiz Castello, P.; Tarvydas, D.; Tsiropoulos, I.; Zucker, A. Deployment Scenarios for Low Carbon Energy Technologies; Publications Office of the European Union: Luxembourg, 2018. [Google Scholar]
- Myhr, A.; Bjerkseter, C.; Ågotnes, A.; Nygaard, T.A. Levelised cost of energy for offshore floating wind turbines in a lifecycle perspective. Renew. Energy 2014, 66, 714–728. [Google Scholar] [CrossRef] [Green Version]
- Equinor. Hywind Scotland. 2020. Available online: https://www.equinor.com/en/what-we-do/floating-wind/hywind-scotland.html (accessed on 25 November 2021).
- ORE Catapult. Macroeconomic Benefits of Floating Offshore Wind in the UK. 2018. p. 88. Available online: https://ore.catapult.org.uk/?industryreports=macroeconomic-benefits-of-floating-offshore-wind-in-the-uk (accessed on 11 November 2021).
- BVG Associates. Ocean Power Innovation Network Value Chain Study; Summary Report; BVG Associates: Swindon, UK, 2019. [Google Scholar]
- Guanche, R.; De Andrés, A.D.; Simal, P.D.; Vidal, C.; Losada, I.J. Uncertainty analysis of wave energy farms financial indicators. Renew. Energy 2014, 68, 570–580. [Google Scholar] [CrossRef]
- Connor, M.O.; Lewis, T.; Dalton, G. Operational expenditure costs for wave energy projects and impacts on financial returns. Renew. Energy 2013, 50, 1119–1131. [Google Scholar] [CrossRef] [Green Version]
- Gray, A.; Dickens, B.; Bruce, T.; Ashton, I.; Johanning, L. Reliability and O&M sensitivity analysis as a consequence of site specific characteristics for wave energy converters. Ocean Eng. 2017, 141, 493–511. [Google Scholar] [CrossRef]
- Thomaz, T.B.; Crooks, D.; Medina-Lopez, E.; Van Velzen, L.; Jeffrey, H.; Mendia, J.L.; Arias, R.R.; Minguela, P.R. O&M Models for Ocean Energy Converters: Calibrating through Real Sea Data. Energies 2019, 12, 2475. [Google Scholar] [CrossRef] [Green Version]
- Rinaldi, G.; Garcia-Teruel, A.; Jeffrey, H.; Thies, P.R.; Johanning, L. Incorporating stochastic operation and maintenance models into the techno-economic analysis of floating offshore wind farms. Appl. Energy 2021, 301, 117420. [Google Scholar] [CrossRef]
- Wave Energy Scotland. Wave Energy Scotland—Supporting Wave Technology Developments. 2021. Available online: https://www.waveenergyscotland.co.uk/ (accessed on 8 December 2021).
- EuropeWave. Welcome to EuropeWave—An Innovative R&D Programme for Wave Energy Technology. Available online: https://www.europewave.eu/ (accessed on 8 December 2021).


Publisher’s Note: MDPI stays neutral with regard to jurisdictional claims in published maps and institutional affiliations. |
© 2022 by the authors. Licensee MDPI, Basel, Switzerland. This article is an open access article distributed under the terms and conditions of the Creative Commons Attribution (CC BY) license (https://creativecommons.org/licenses/by/4.0/).