Article

Spatiotemporal Evolution and Influencing Factors of Electricity Consumption in the Yangtze River Delta Region

1
School of Economics and Management, China University of Mining and Technology, Xuzhou 221116, China
2
Rizhao Tiantai Construction and Installation Engineering Co., Ltd., Rizhao 276800, China
*
Author to whom correspondence should be addressed.
Energies 2022, 15(5), 1753; https://doi.org/10.3390/en15051753
Submission received: 29 December 2021 / Revised: 7 February 2022 / Accepted: 23 February 2022 / Published: 26 February 2022

Abstract

:
Electricity consumption accounts for a considerable part of the final energy consumption, and it is important for economic development and human life. This study explores the spatiotemporal evolution characteristics and influencing factors of electricity consumption in the Yangtze River Delta region in China from 2006 to 2019, using the gravity model and Logarithmic Mean Divisia Index method, respectively. The results show that: (1) The centers of gravity for the total final, industrial and residential electricity consumptions have a trend of migration towards the west. (2) The distance of migration of the center of gravity for residential electricity consumption is the highest, and the trend of migration of the center of gravity for industrial and total final electricity consumptions are synchronous. (3) Economic development is the main reason for the growth in regional electricity consumption, and the decrease in the investment electricity consumption intensity inhibits the growth of electricity consumption. This study provides references to restrain the excessive increase in electricity consumption and improve the layout of power facilities at the regional level.

1. Introduction

Electric power is the most widely used secondary energy, which is the foundation of the economy and people’s lives, and has received increasing attention [1]. Although China formulated the “West–East electricity transmission project” to solve the unbalanced distribution of energy resources and electricity consumption, performances in terms of electricity consumption are inconsistent among the different districts in China [2,3]. For instance, although the Yangtze River Delta (YRD) region, which includes provinces, such as Anhui, Zhejiang, Jiangsu, and Shanghai, lacks adequate energy resources, it consumed 1483.98 billion kWh in 2019, accounting for about 21% of China’s total final electricity consumption [4]. Therefore, this region faces severe challenges in terms of energy security. With the proposal of China’s carbon neutrality policy, power rationing has occurred in the YRD region. An understanding of the characteristics of regional electricity consumption is important for stable economic development [5]. Hence, it is necessary to study the driving factors of electricity consumption. In addition, the spatiotemporal changes in electricity consumption in the YRD region must be understood.
The concept of center of gravity comes from physical geometry and represents the point at which the Earth exerts its gravitational pull on all parts of an object. In 1872, the American scholar Hilgard first applied this method to the study of population [6]. Since his early success, this approach has been widely used to study geographic distributions in various fields. For instance, this theory has been utilized to discuss the spatiotemporal differences of the population [7,8,9], economic development [10,11], and carbon dioxide emission [12,13,14].
To date, several studies have examined spatial variations in energy consumption [15,16]. Zhang et al. [17] used this theory to measure China’s energy supply and demand centers during 1997–2009. Wang et al. [18] also adopted this method to probe global energy and to determine how they have changed. These studies revealed geographic evolution, but only a few studies quantified the distances of centers of gravity between energy consumptions or how those distances change over time.
Decomposition analysis, including index decomposition analysis (IDA) and structural decomposition analysis, is an important approach for studying the driving factors of energy consumption. The LMDI method is an essential branch of IDA and it overcomes the defects of residual decomposition and zero-value problems in traditional methods [19,20]. Since its proposal [21,22], the LMDI method has been considered an indispensable approach in energy research. Chong et al. [23] utilized this method to decompose energy consumption in the Guangdong Province, showing that economic development and population growth were dominant factors in boosting consumption growth. In environmental pollution studies, relevant research has been focused on the decomposition analysis of carbon dioxide emissions [24,25,26]. Jiang et al. [27] improved this method and used a two-layer LMDI decomposition approach to analyze the factors related to the increase in carbon emissions in China. Using the LMDI method, Alajmi [28] revealed that the effect of energy was the major driving factor in increasing GHC emissions in Saudi Arabia.
Electric power is an essential energy source in modern society. Therefore, researchers have begun to identify the influencing factors that can promote an increase in electricity consumption. Lin et al. [29] used the LMDI method to decompose electricity consumption in Pakistan for the period 1989–2018. Fang et al. [30] adopted a multi-period spatiotemporal (ST)-LMDI model and found that technological progress can restrain the increase in electricity consumption in China. Roula and James [31] also estimated the LMDI method to decompose electricity consumption by 14 sectors in South Africa during 1993–2006 to determine the main factors contributing to its rise.
Although most of the studies are on the movement of the center of gravity of electricity consumption of a country as the research object, only a few have considered the region as the research object. In terms of the factors influencing electricity consumption, many studies have been conducted on the decomposition of economic and population scales and industrial structure, but there are only few studies that have considered the influence of investment on reducing electricity consumption. On the one hand, large-scale fixed asset investment promotes growth of electricity consumption, and China’s newly added fixed asset investment consumes approximately 67% of the newly added power generation. On the other hand, improving investment efficiency will improve the economic benefits provided by electricity and thus reduce its consumption. We used the gravity model to calculate the movement of the center of gravity of electricity consumption in the YRD region and applied the LMDI method to discuss its driving factors and dynamic changes at a0 regional level. This study is helpful to optimize the layout of power infrastructure in the YRD region to ensure the efficient utilization of power resources, explore the factors behind the increase in power demand, and provide references for adjusting regional power demand.
The main contributions of this study are as follows. (1) This study considers the whole and inner parts of the YRD region, and three types of electricity consumption centers and migration distances are calculated using the gravity model, which can provide a reference for the layout of regional power facilities in the future. (2) Fixed asset investment is added to the LMDI model, and the driving factors and variation of electricity consumption by six sectors and four districts are analyzed, revealing the reasons for the growth in regional electricity consumption.
The remainder of this paper is organized as follows: Section 2 describes the established model and related data; Section 3 presents the results and discussion; Section 4 summarizes the conclusions and policy implications of the study.

2. Methods and Data

2.1. Methods

2.1.1. Gravity Model

The electricity consumption center of gravity follows the concept of the physical center of gravity, which refers to the point that can maintain the balance in electricity consumption in all directions of the consumption area. Owing to the different development levels and rates of electricity consumption in different regions, the center of gravity of electricity consumption changes dynamically. Its trajectory of movement represents the process of spatial transfer of electricity consumption and reflects the different industrial structures, populations, and economic development in the YRD region. The position of the center of gravity was calculated as follows:
{ X ¯ t = i = 1 n m i t x i / i = 1 n m i t Y ¯ t = i = 1 n m i t y i / i = 1 n m i t
where ( x i , y i ) represents the coordinates of the ith city, x i represents the longitude of the ith city, y i represents the latitude of the ith city, m i t represents electricity consumption by city i in year t, and ( X ¯ t , Y ¯ t ) represents the electricity consumption center of the region in year t. While maintaining the same attribute latitude, the center of gravity for total final, industrial, and residential electricity consumptions were calculated. Electricity is the foundation of regional economic development, which can reflect regional economic development. Therefore, calculating the migration distance of the center of gravity of electricity consumption can determine the migration situation of regional economic development and can reflect the rate of movement of the center of gravity of electricity consumption. The distance of movement of the center of gravity of electricity consumption was calculated as follows:
D s k = C × ( X s X k ) 2 + ( Y s Y k ) 2
where D s k represents the moving distance from city s to city k, and C is a constant. This generally refers to the coefficient of transformation of the geographical coordinate value into the plane distance, which is approximately 111.111.

2.1.2. Index Decomposition Model

Electricity consumption is influenced by many factors. Through a study of the previous literature, we found that economic development and population growth are the main factors that promote electricity consumption [32,33]. Improvement in industrial structures has a strong influence on the growth of electricity consumption [34]. However, the influence of investment on electricity consumption is seldom considered; therefore, this study introduces the role of investment electricity consumption intensity and investment intensity to analyze the influencing factors of electricity consumption [5].
Accordingly, this study analyzed the above five driving factors of electricity consumption in six economic sectors across four districts (Jiangsu, Zhejiang, Shanghai, Anhui) in the YRD region. The total final electricity consumption in sector in year t can be expressed as:
i E i t = i E i t I N V i t × I N V i t G D P i t × G D P i t G D P t × G D P t P O P t × P O P t = i I E i t × I O i t × G i t × P G t × P t
The specific meanings of the relevant indicators in the formula above are listed in Table 1.
In order to decompose the electricity consumption change, we applied additive decomposition analysis to decompose Equation (3). The increase in electricity consumption from base year 0 to target year t is represented by Δ E t . It can be resolved into five influencing drivers: (1) change in the effect of investment electricity consumption intensity ( Δ E I E ), explaining the effect of fixed-asset investment on affecting electricity consumption; (2) change in the effect of investment intensity ( Δ E I O ), denoting the effect of the efficiency of fixed-asset investment on electricity consumption; (3) change in the effect of economic structure ( Δ E G ), reflecting the impact of sector adjustment on electricity consumption; (4) change in the effect of economic development ( Δ E P G ), representing the impact of economic development on electricity consumption; and (5) change in the effect of population ( Δ E P ), revealing the impact of population growth on electricity consumption. If the above decomposition result is positive, it indicates that this factor promotes the growth of electricity consumption; otherwise, it inhibits it. In addition, if the absolute value of the decomposition result is higher, it indicates that the influence is more important. Therefore, the Δ E t can be calculated using the following formula:
Δ E t = E t E 0 = Δ E I E + Δ E I O + Δ E G + Δ E P G + Δ E P
The driving factors in Equation (4) can be described as follows:
Δ E I E = i ω × ln I E i t I E i 0
Δ E I O = i ω × ln I O i t I O i 0
Δ E G = i ω × ln G i t G i 0
Δ E P G = i ω × ln P G i t P G i 0
Δ E P = i ω × ln P i t P i 0
ω = i E i t E i 0 ln ( E i t E i 0 )

2.2. Data Description

Electricity consumption data for the study period of 2006–2019 were obtained from China City Statistical Yearbook [35], China Statistical Yearbook [36] and China Energy Statistical Yearbook [4]. The national economy was classified into six sectors for the analysis of the driving factors of electricity consumption, such as agriculture (animal husbandry, fishery, forestry, and agriculture), industry, construction, transportation (storage and post-transport activities), trade and catering (catering services, hotels, and wholesale and retail trades), and others. The unit of GDP is billion yuan (BY) at a constant 2005 price.

3. Results and Discussion

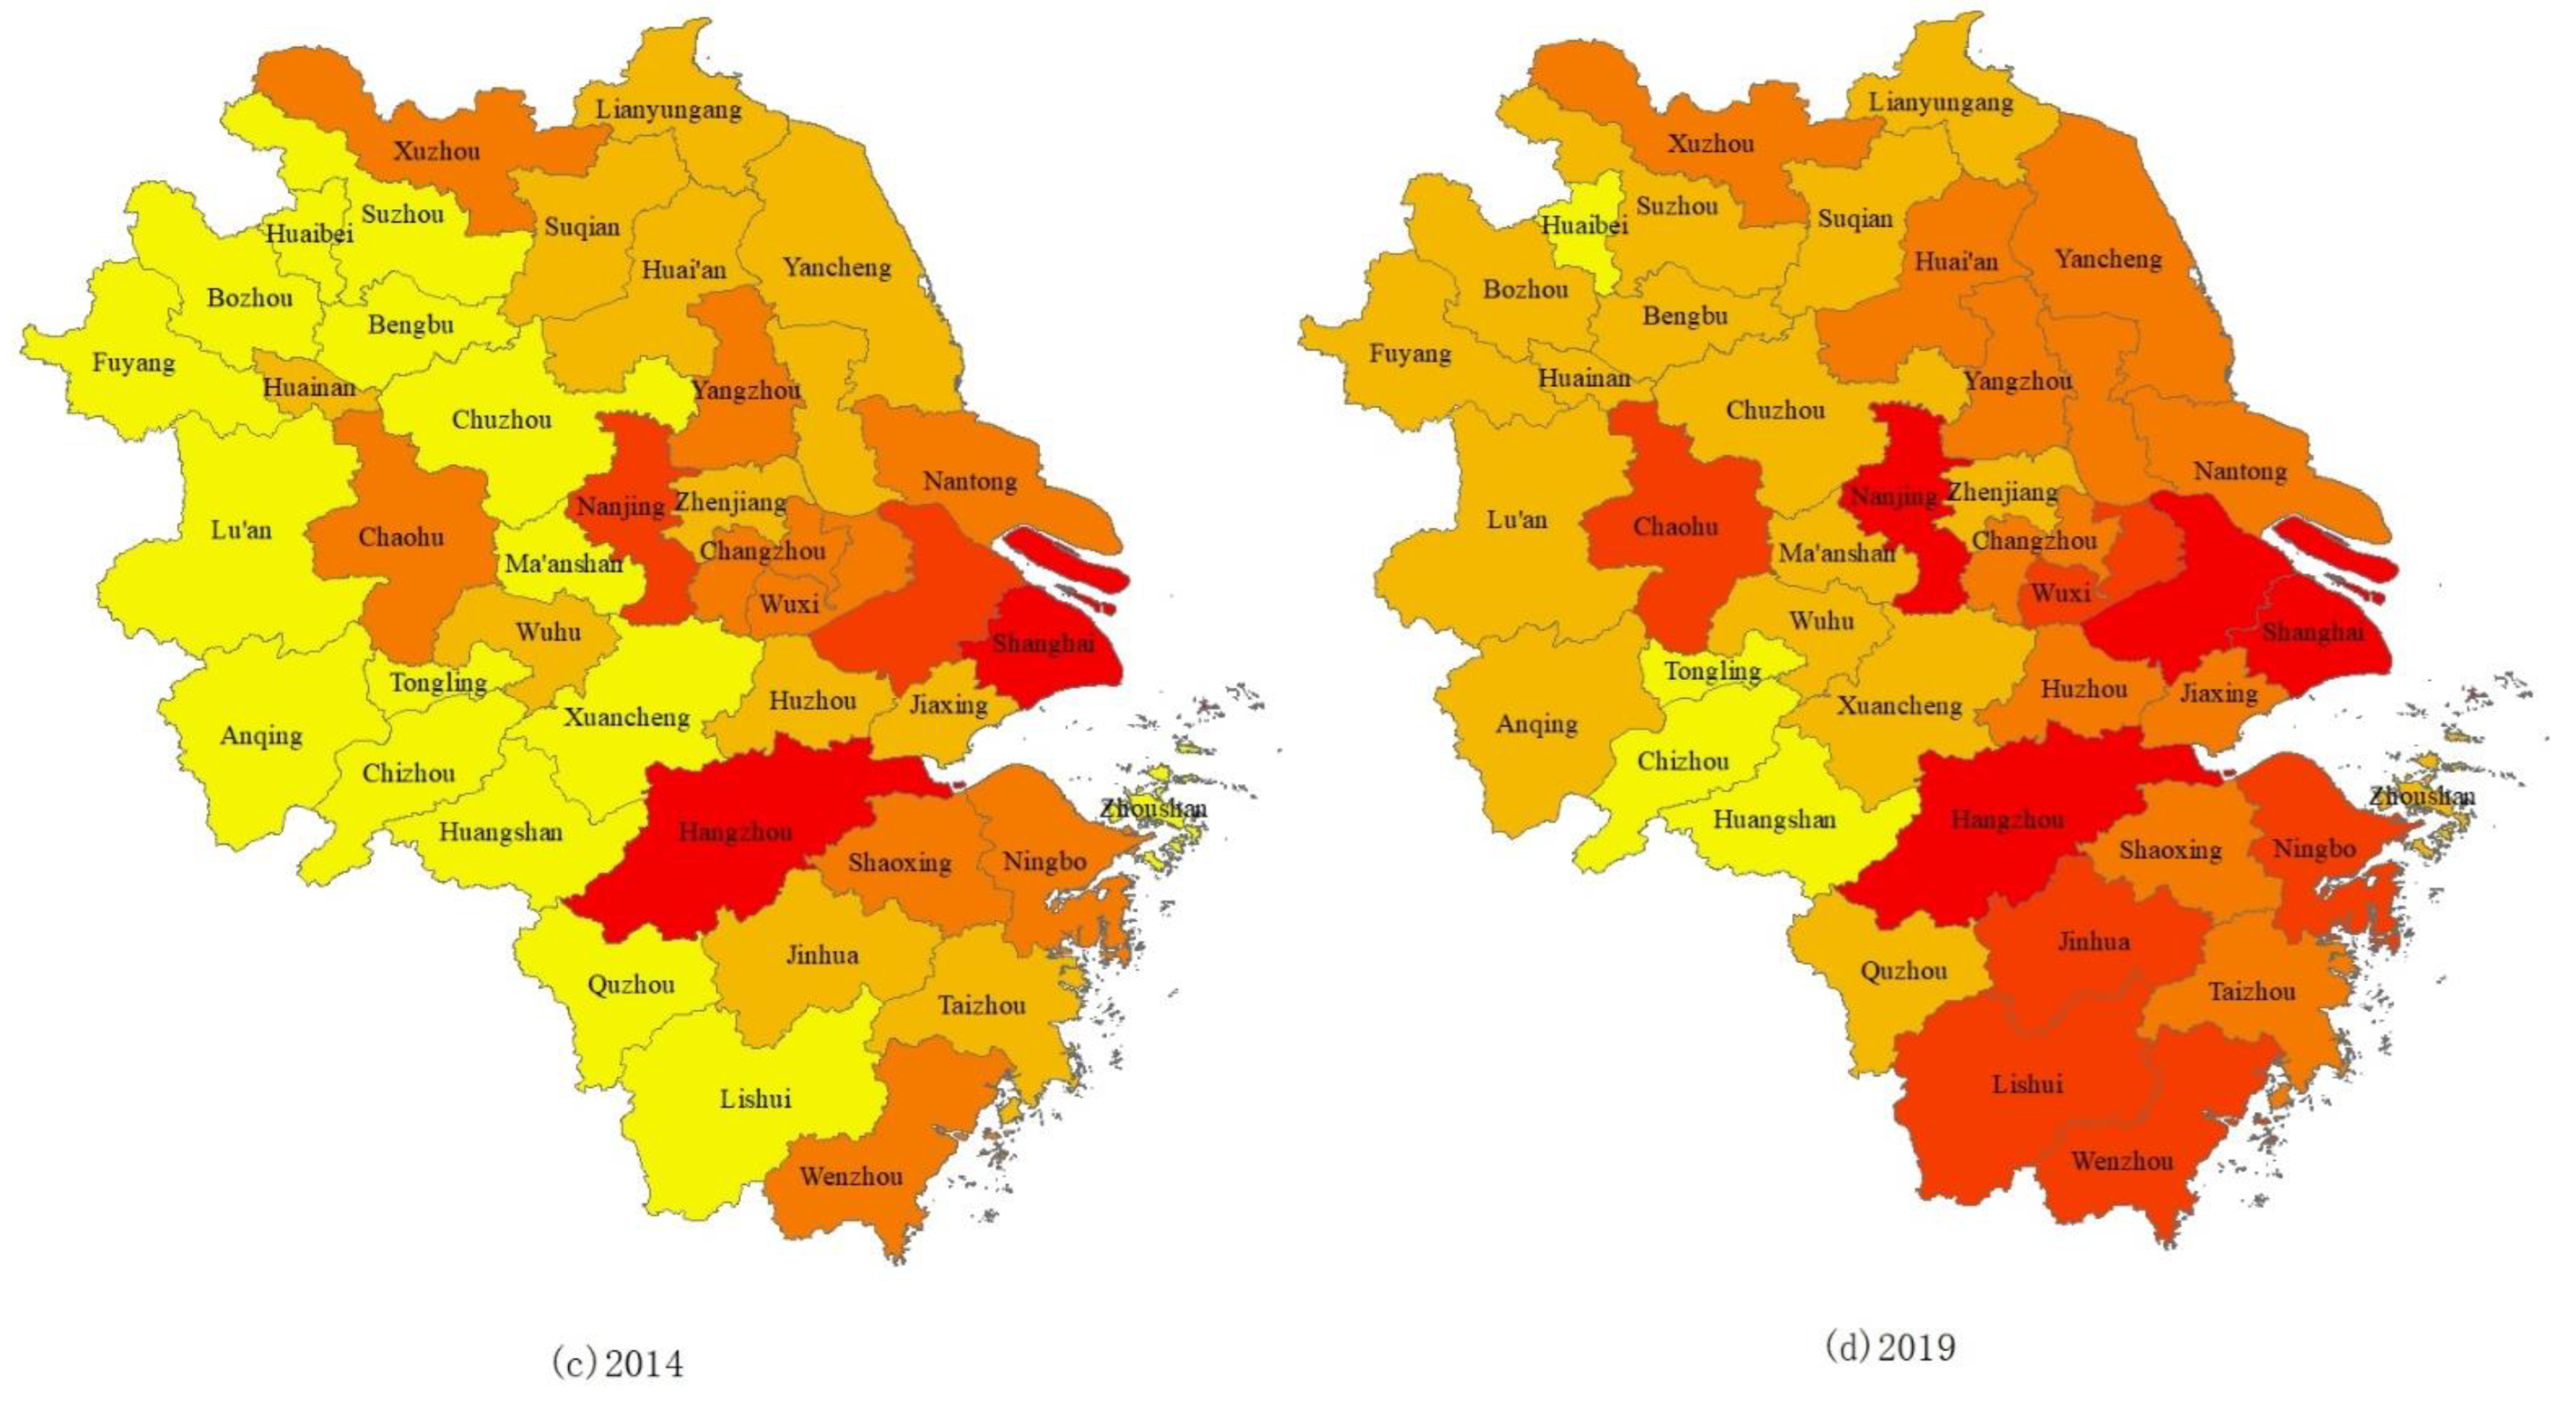
3.1. Analysis of the Spatiotemporal Evolution Characteristics of Electricity Consumption

To express the spatial distribution characteristics and changes in electricity consumption in the YRD region, we used ArcGIS to plot the spatial distribution of electricity consumption in 41 cities in the YRD region for the years 2006, 2010, 2014, and 2019. As shown in Figure 1, the total final electricity consumption was classified into five levels.
As shown in Figure 1, the total final electricity consumptions of the cities of Suzhou, Hangzhou, Nanjing, and Shanghai were the highest of the 41 cities. Moreover, the electricity consumptions of Hefei, Wuxi, Changzhou, Wenzhou, and Ningbo were in the second echelon of the 41 cities in the YRD region, which indicated that there is a correlation between the city’s economic scale and electricity consumption. However, judging from the increasing rate of total final electricity consumption during 2006–2019, the cities where electricity consumption increased more than ten times in the past 13 years were Yancheng, Suqian, Shaoxing, Jinhua, Lishui, Fuyang, Bozhou, and Xuancheng. The electricity consumption of the aforementioned cities grew faster, but at a very low level in the initial period, and their electricity consumption in the final period was also in the lower reaches of the 41 cities. On the contrary, the growth rate of cities with higher electricity consumption levels tended to slow down.
The total final electricity consumption of the 41 cities in the YRD region was classified as residential and industrial. In the gravity model described in Section 2.1.1, each city’s geographic coordinates of center of gravity and electricity consumption reflect the center of gravity coordinates for the three types of electricity consumption from 2006 to 2019. The movement of the center of gravity is shown in Figure 2; the location and distance of the center of gravity is shown in Table 2.
In the entire YRD region, the centers of gravity for the three types of electricity consumption were between 119.81 E and 120.09 E and between 31.02 N and 31.29 N. The center of gravity for the total final electricity consumption moved by 40.55 km, and the center of gravity for industrial electricity consumption moved by 45.51 km. The centers of gravity for the total final electricity consumption and industrial electricity consumption shifted from Suzhou to Wuxi. The center of gravity for residential electricity consumption moved 83.02 km, and it also experienced movement from Suzhou to Wuxi during 2006–2016, but it moved to Huzhou during 2017–2019. During 2006–2019, the centers of gravity for the three types of electricity consumptions were adjacent to or overlapped with provincial capitals and economically developed cities. Thus, it was easy to conclude that electricity consumption is closely related to the local economy.
The movement of the center of gravity for the total final and industrial electricity consumptions were similar during this period, because the consumption of industrial electricity accounted for a large proportion of that of the total final electricity in the YRD region. However, residential electricity consumption was relatively low. Its consumption was mainly affected by the total population of the region and the use of household electric appliances, which led to a different shift in the center of gravity with respect to industrial and total final electricity consumptions.

3.2. Decomposition Analysis of Electricity Consumption

The total effect of the LMDI result on electricity consumption in the YRD region was positive, and the total final electricity consumption increased by 870.83 billion kWh during the study period. In 2010 and 2011, the total final electricity consumption increased by 206.82 billion kWh, because the Chinese government introduced a series of measures to expand domestic demand and ensure stable economic development to eliminate the impact of the 2008 financial crisis. At the same time, in the first year of the 12th Five-Year Plan, the 18th National Congress of the Communist Party of China proposed the requirement to accelerate development, which, to some extent, boosted the growth of electricity consumption [37]. Using Equations (3)–(10), the influencing factors were decomposed, and the results are shown in Table 3. Economic development effect can increase electricity consumption each year, and electricity consumption in the YRD region increased by 1097.77 billion kWh during the study period because of the economic development, and its cumulative effect accounted for 126.06% of the total contribution, an important reason for this phenomenon is that China’s economic development was driven mainly by investment [38]. Furthermore, the effect of population can steadily promote an increase in the electricity consumption. The total population of the YRD region was 180 million in 2019. However, the average annual population growth rate was only 0.65% and the effect of population contributed only 9.15% to the total increase in electricity consumption. This result was consistent with that reported by Lin [39]. The investment intensity effect promoted the growth of electricity consumption during 2007–2015, indicating that large-scale investment in fixed assets in the YRD region consumed more electricity. During 2016–2019, the effect of investment intensity restrained the growth of electricity consumption, indicating that investment intensity was mostly on equipment updates and technological updates, making equipment more energy-efficient and effective. It had controlled the increase in electricity consumption. In addition, during the study period, the total effect of investment intensity increased electricity consumption by 402.20 billion kWh, which was the second-largest increase in terms of electricity consumption in the YRD region [40].
Regarding the negative restraint factors, the effect of investment electricity consumption intensity was dominant and its cumulative effect on the change of electricity consumption was −490.88 billion kWh. The cumulative contribution rate of restraining electricity consumption was −56.34%, which was the main reason for restricting the increase in electricity consumption. This was also the main factor that restrained electricity consumption in the Beijing–Tianjin–Hebei and the Pearl River Delta regions [5]. The improvement in the effect of investment electricity consumption intensity brought about the renewal of electric equipment and the improvement of the investment structure to provide energy saving. In addition, investment in traditional industries with high energy consumption and pollution was abandoned and the rapid growth in electricity consumption was effectively restrained. The year-on-year effect of economic structure had a negative effect on the growth of electricity consumption at −25.03%. Moreover, the inhibitory effect increased, reflecting that the economic structure was continuously optimized, which indicated that, under the general background of supply side reforms, the government’s emphasis was on adjusting the industrial structure, eliminating backward production capacity, and improving production and energy efficiencies.
To decompose the driving factors of electricity consumption in different sectors, we classified electricity consumption in the YRD region into six sectors. Table 4 presents the results of the sectoral decomposition of electricity consumption. The industrial sector’s electricity consumption was the most crucial factor in driving the growth of regional electricity consumption. During the study period, industrial electricity consumption increased by 512.77 billion kWh, accounting for 58.89% of the total growth in electricity consumption. Although the YRD region was constantly adjusting and optimizing its industrial structure, economic development dominated by secondary industries did not undergo a fundamental change. Others sectors contributed to 30.47% of the growth in electricity consumption. The electricity consumption of agriculture only increased by 6.06 billion kWh during this period, which was the lowest among all sectors, accounting for only 0.70% of the total increase in electricity consumption.
The results of the effects of various factors on each sector are significantly different (Table 4). Based on the results, it can be concluded that the effect of investment electricity consumption intensity can effectively curb electricity consumption in industry, agriculture, and others sectors. A strong negative effect is especially observed in the electricity consumption in the industrial sector, reaching −512.14 billion kWh. Many policies, such as “Energy Saving and Emission Reduction” and “Made in China 2025”, have been proposed to reduce the growth of electricity consumption in the high-energy consumption sectors. Moreover, investment toward the reduction in electricity consumption in the industrial sector in the YRD region was constantly improving, which would have effectively restrained the further growth of electricity consumption. Nevertheless, the effect of the intensity of investment electricity consumption played a positive role in increasing the electricity consumption in the construction, transportation, trade and catering other sectors. The effects of both economic development and population increased the electricity consumption in the six sectors. The effect of economic development was also the dominant factor in the growth of electricity consumption in industry, transportation, trade and catering, and others sectors. Therefore, controlling electricity consumption without affecting the development of industrial sectors is a problem that needs to be solved in the YRD region. The effect of investment intensity can reduce electricity consumption in construction, trade and catering, and others sectors, reflecting the gradual suppression of overheated investment in these sectors and alleviating the problem of overcapacity to a certain extent.
As shown in Table 5, to explore internal electricity consumption in the YRD region, this study decomposed the above five effects into four districts. Economic development played a sustainable role in promoting electricity consumption in each district [31]. Jiangsu ranked first among the four districts on an economic scale, resulting in the most substantial pulling effect of its economic development on electricity consumption with a value of 490.14 billion kWh. The effect of investment intensity had an obvious inhibitory effect on Shanghai’s electricity consumption; however, it promoted electricity consumption in the other three districts, and it was the second-largest factor that promoted the rise in the YRD region’s electricity consumption. It also had the most substantial stimulating effect on Zhejiang’s electricity consumption, which increased to 230.84 billion kWh. The effect of population was the third-largest factor driving growth in electricity consumption of the YRD region; although, the positive pulling effect was not obvious, it was directly related to the low population growth rate of these regions.
From the perspective of negative effects, the investment electricity consumption intensity was the main reason for the inhibition of growth of electricity consumption in Anhui, Zhejiang, and Jiangsu; however, the inhibition effect was different in these three districts. The inhibition effect was the most obvious in Zhejiang, with a restraining contribution rate of −59.82%, and it had a positive pulling effect on Shanghai’s electricity consumption, indicating large differences in the effect of the intensity of investment electricity consumption between the districts. In addition, the investment intensity had a visible inhibitory effect on Shanghai’s electricity consumption, indicating that Shanghai’s investment efficiency was greater because of equipment updates and technological upgrades, which effectively reduced the increase in electricity consumption. In addition, the economic structure not only had a restraining effect on the electricity consumption of the entire YRD region but also had a relatively obvious negative effect on inner four districts, which showed the adjustment and optimization of the economic structure related to electricity consumption. These results are similar to those reported by Shi et al. [41].
Table 6 shows that six sectors contributed differently to electricity consumption in different districts. Industry sector drove the highest increase in electricity consumption in the three districts except for in Shanghai. One of the main reasons for this phenomenon was that the industry sector contained some traditional high-energy-consuming industries, which consumed more electricity in their production processes. This was particularly prominent in Jiangsu and Zhejiang with relatively large industry sectors, and their contributions accounted for 65.78% and 60.13%, respectively, of their increase in electricity consumptions. In Shanghai, the district with the best economic development in the YRD region; the others sectors accounted for most of the growth in electricity consumption, with an increase of 36.78 billion kWh, which was far more than that of the other districts. This clearly indicated that Shanghai had the most developed industrial structure, wherein electricity and energy-consumption-intensive industries were eliminated and replaced by the service industry.

4. Conclusions and Policy Implications

This paper discusses the spatiotemporal evolution trend of electricity consumption and the factors that influence its increase in the YRD region. The main conclusions are as follows:
(1)
Electricity consumption in the YRD region increased during the study period, but there was an imbalance among cities. For example, cities with high electricity consumption had a relatively slow growth rate, while others with low total electricity consumption had a relatively fast growth rate.
(2)
In the YRD region, the center of gravity for total final, residential, and industrial electricity consumptions moved toward the west. The movement trajectory of the total final electricity consumption mainly depended on the change in the industrial electricity consumption. The moving distance of the center of gravity for residential electricity consumption was the highest, and it moved toward the southwest.
(3)
The decomposition of the factors of electricity consumption in the YRD region showed a positive driving effect on the growth of electricity consumption. The main reason for the growth of electricity consumption was the effect of economic development, while the effect of economic structure restrained electricity consumption. The industry sector was still the main thrust of regional growth in electricity consumption, but the role of investment electricity consumption intensity can restrain the growth of electricity consumption in the industry sector.
(4)
The results of the decomposition of electricity consumption in the four districts showed that the industrial sector was the primary driving sector of electricity consumption in Jiangsu, Zhejiang, and Anhui, and each influencing factor had a different mechanism of action on electricity consumption in these four districts.
Based on the results, the following policy implications are put forward:
(1)
To restrain the excessive growth of electricity consumption, we should pay attention to Shanghai, Suzhou, Nanjing, Hangzhou, and other high electricity consumption cities and optimize the industrial structure of these cities, thereby improving the efficiency of electricity consumption. At the same time, attention should also be paid to small- and medium-sized cities, and the orderly development of industry and investment in fixed assets should be carried out to prevent excessive growth in electricity consumption.
(2)
Government departments can optimize the layout of the power facilities according to the moving direction of the center of gravity of electricity consumption. Based on the above results, more power facilities should be built in the west of the YRD region.
(3)
Optimizing the economic structure is still the core of controlling the excessive growth of electricity consumption. In arranging fixed asset investments, the YRD region should pay attention to the intensity of electricity consumption and increase the contribution rate of unit electricity consumption to economic development.
(4)
The YRD region needs to establish a collaborative mechanism of economic growth, electricity consumption, and fixed asset investment, and the planning of investment projects must be undertaken to avoid large-scale over-investment, eliminate low-end investment, and guide technology-intensive investment.
Because of the availability of data, this study could not decompose the influencing factors at the city level. In addition, we only classified economic sectors into six, and hence could not achieve the analysis of electricity consumption in detailed sectors. In the future, it is necessary to study the driving factors of electricity consumption more comprehensively at the city and detailed sector levels.

Author Contributions

T.L.: Supervision and Writing—original draft. D.P.: Writing—original draft, Software, and Methodology. X.D.: Data curation and Methodology. X.H.: Writing—review and editing, and Formal analysis. J.X. and L.W.: Writing—review and editing. All authors have read and agreed to the published version of the manuscript.

Funding

This study was supported by the project of Carbon Neutrality Energy Strategy Think Tank (grant number CUMT_2021WHCC01).

Institutional Review Board Statement

Not applicable.

Informed Consent Statement

Not applicable.

Data Availability Statement

All data used in this paper is from China City Statistical Yearbook (2008–2020), China Energy Statistics Yearbook (2008–2020) and China Statistical Yearbook (2008–2020), which can be found here: [https://data.cnki.net/Yearbook/Navi?type=type&code=A, accessed on 28 December 2021].

Conflicts of Interest

The authors declare no conflict of interest.

References

  1. Kim, Y.S. Electricity consumption and economic development: Are countries converging to a common trend? Energy Econ. 2015, 49, 192–202. [Google Scholar] [CrossRef]
  2. Lin, B.; Liu, C. Why is electricity consumption inconsistent with economic growth in China? Energy Policy 2016, 88, 310–316. [Google Scholar] [CrossRef]
  3. Yuan, X.-C.; Sun, X.; Zhao, W.; Mi, Z.; Wang, B.; Wei, Y.-M. Forecasting China’s regional energy demand by 2030: A Bayesian approach. Resour. Conserv. Recycl. 2017, 127, 85–95. [Google Scholar] [CrossRef]
  4. National Bureau of Statistical. China Energy Statistics Yearbook; China Statistics Press: Beijing, China, 2008–2020.
  5. Fang, D.; Hao, P.; Yu, Q.; Wang, J. The impacts of electricity consumption in China’s key economic regions. Appl. Energy 2020, 267, 115078. [Google Scholar] [CrossRef]
  6. Hilgard, J.E. The advance of population in the United States. Scribner’s Mon. 1872, 4, 214–218. [Google Scholar]
  7. Zhang, C.; Liu, Y.; Qiao, H. An empirical study on the spatial distribution of the population, economy and water resources in Northeast China. Phys. Chem. Earth Parts A/B/C 2015, 79–82, 93–99. [Google Scholar] [CrossRef]
  8. Yang, Q.; He, L. Spatiotemporal changes in population distribution and socioeconomic development in China from 1950 to 2010. Arab. J. Geosci. 2017, 10, 498. [Google Scholar] [CrossRef]
  9. Zhang, G.; Zhang, N.; Liao, W. How do population and land urbanization affect CO2 emissions under gravity center change? A spatial econometric analysis. J. Clean. Prod. 2018, 202, 510–523. [Google Scholar] [CrossRef]
  10. Klein, L.R. Measurement of a shift in the world’s center of economic gravity. J. Policy Model. 2009, 31, 489–492. [Google Scholar] [CrossRef]
  11. Liang, L.; Chen, M.; Luo, X.; Xian, Y. Changes pattern in the population and economic gravity centers since the Reform and Opening up in China: The widening gaps between the South and North. J. Clean. Prod. 2021, 310, 127379. [Google Scholar] [CrossRef]
  12. Liu, Y.; Xiao, H.; Zhang, N. Industrial Carbon Emissions of China’s Regions: A Spatial Econometric Analysis. Sustainability 2016, 8, 210. [Google Scholar] [CrossRef] [Green Version]
  13. Song, Y.; Zhang, M. Study on the gravity movement and decoupling state of global energy-related CO2 emissions. J. Environ. Manag. 2019, 245, 302–310. [Google Scholar] [CrossRef]
  14. Wu, S.; Hu, S.; Frazier, A.E. Spatiotemporal variation and driving factors of carbon emissions in three industrial land spaces in China from 1997 to 2016. Technol. Forecast. Soc. Chang. 2021, 169, 120837. [Google Scholar] [CrossRef]
  15. Zhang, Y.; Wang, W.; Liang, L.W.; Wang, D.P.; Cui, X.H.; Wei, W.D. Spatial-temporal pattern evolution and driving factors of China’s energy efficiency under low-carbon economy. Sci. Total Environ. 2020, 739, 140197. [Google Scholar] [CrossRef]
  16. Jia, J.S.; Fan, Y.; Wu, X.H.; Sun, D.Q. Spatial differences and influencing factors of global energy consumption. Resour. Sci. 2011, 33, 796–805. [Google Scholar]
  17. Zhang, Y.; Zhang, J.; Yang, Z.; Li, J. Analysis of the distribution and evolution of energy supply and demand centers of gravity in China. Energy Policy 2012, 49, 695–706. [Google Scholar] [CrossRef]
  18. Wang, W.; Zhang, M.; Li, P. Exploring temporal and spatial evolution of global energy production and consumption. Renew. Sustain. Energy Rev. 2014, 30, 943–949. [Google Scholar] [CrossRef]
  19. Ang, B.; Zhang, F.; Choi, K.-H. Factorizing changes in energy and environmental indicators through decomposition. Energy 1998, 23, 489–495. [Google Scholar] [CrossRef]
  20. Ang, B.W. Decomposition analysis for policymaking in energy: Which is the preferred method? Energy Policy 2004, 32, 1131–1139. [Google Scholar] [CrossRef]
  21. Li, Y.; Wang, S.; Chen, B. Driving force analysis of the consumption of water and energy in China based on LMDI method. Energy Procedia 2019, 158, 4318–4322. [Google Scholar] [CrossRef]
  22. Zhang, W.; Wang, N. Decomposition of energy intensity in Chinese industries using an extended LMDI method of production element endowment. Energy 2021, 221, 119846. [Google Scholar] [CrossRef]
  23. Chong, C.H.; Liu, P.; Ma, L.; Li, Z.; Ni, W.; Li, X.; Song, S. LMDI decomposition of energy consumption in Guangdong Province, China, based on an energy allocation diagram. Energy 2017, 133, 525–544. [Google Scholar] [CrossRef]
  24. Xie, P.; Gao, S.; Sun, F. An analysis of the decoupling relationship between CO2 emission in power industry and GDP in China based on LMDI method. J. Clean. Prod. 2019, 211, 598–606. [Google Scholar] [CrossRef]
  25. Wang, W.; Zhang, M.; Zhou, M. Using LMDI method to analyze transport sector CO2 emissions in China. Energy 2011, 36, 5909–5915. [Google Scholar] [CrossRef]
  26. Yang, J.; Cai, W.; Ma, M.; Li, L.; Liu, C.; Ma, X.; Li, L.; Chen, X. Driving forces of China’s CO2 emissions from energy consumption based on Kaya-LMDI methods. Sci. Total Environ. 2020, 711, 134569. [Google Scholar] [CrossRef]
  27. Jiang, J.; Ye, B.; Xie, D.; Tang, J. Provincial-level carbon emission drivers and emission reduction strategies in China: Combining multi-layer LMDI decomposition with hierarchical clustering. J. Clean. Prod. 2017, 169, 178–190. [Google Scholar] [CrossRef]
  28. Alajmi, R.G. Factors that impact greenhouse gas emissions in Saudi Arabia: Decomposition analysis using LMDI. Energy Policy 2021, 156, 112454. [Google Scholar] [CrossRef]
  29. Lin, B.; Raza, M.Y. Analysis of electricity consumption in Pakistan using index decomposition and decoupling approach. Energy 2021, 214, 118888. [Google Scholar] [CrossRef]
  30. Fang, D.B.; Hao, P.; Hao, J. Study of the influence mechanism of China’s electricity consumption based on multi-period ST-LMDI model. Energy 2019, 170, 730–743. [Google Scholar] [CrossRef]
  31. Inglesi-Lotz, R.; Blignaut, J.N. South Africa’s electricity consumption: A sectoral decomposition analysis. Appl. Energy 2011, 88, 4779–4784. [Google Scholar] [CrossRef] [Green Version]
  32. Apergis, N.; Payne, J.E. A dynamic panel study of economic development and the electricity consumption-growth nexus. Energy Econ. 2011, 33, 770–781. [Google Scholar] [CrossRef]
  33. Yoo, S.-H.; Kwak, S.-Y. Electricity consumption and economic growth in seven South American countries. Energy Policy 2010, 38, 181–188. [Google Scholar] [CrossRef]
  34. Wang, W.; Mu, H.; Kang, X.; Song, R.; Ning, Y. Changes in industrial electricity consumption in china from 1998 to 2007. Energy Policy 2010, 38, 3684–3690. [Google Scholar] [CrossRef]
  35. National Bureau of Statistical. China City Statistical Yearbook; China Statistics Press: Beijing, China, 2008–2020.
  36. National Bureau of Statistical. China Statistical Yearbook; China Statistics Press: Beijing, China, 2008–2020.
  37. Zhao, X.L. Research on the strategic transformation of China’s economic development in the past 40 Years of reform and opening-up. Res. Econ. Manag. 2018, 39, 3–9. (In Chinese) [Google Scholar]
  38. Fu, F.; Liu, H.; Polenske, K.R.; Li, Z. Measuring the energy consumption of China’s domestic investment from 1992 to 2007. Appl. Energy 2013, 102, 1267–1274. [Google Scholar] [CrossRef]
  39. Lin, B.Q. Structural changes, efficiency improvement and electricity demand forecasting. Econ. Res. 2003, 5, 57–65. (In Chinese) [Google Scholar]
  40. Liu, Z.M.; Cui, Z.W.; Zhu, P.H.; Chen, C.C. Dynamic spatiotemporal feature and driving factors of China’s electricity consumption. China Popul. Resour. Environ. 2019, 29, 20–29. (In Chinese) [Google Scholar]
  41. Shi, C.; Zhao, Y.; Zhang, C.; Pang, Q.; Chen, Q.; Li, A. Research on the driving effect of production electricity consumption changes in the Yangtze River Economic Zone-Based on regional and industrial perspectives. Energy 2022, 238, 121635. [Google Scholar] [CrossRef]
Figure 1. Spatiotemporal characteristics of electricity consumption in YRD region in 2006, 2010, 2014, 2019.
Energies 15 01753 g001aEnergies 15 01753 g001b
Figure 2. The movement of center of gravity for electricity consumption in the YRD region.
Energies 15 01753 g002
Table 1. Relevant indicators used in the Logarithmic Mean Divisia Index (LMDI) model.
VariableDescription
E t Total final electricity consumption in year t
E i t Total final electricity consumption of sector i in year t
I N V i t Fixed-asset investment of sector i in year t
G D P i t GDP of sector i in year t
G D P t GDP in year t
P O P t Population in year t
I E t i Investment electricity consumption intensity of sector i in year t
I O t i Investment intensity of sector i in year t
G t i Economic structure of sector i in year t
P G t Per capita GDP output in year t
P t Total active population in year t
Table 2. Location and moving distance of the center of gravity for electricity consumption (km).
YearTotal Final ConsumptionIndustrial ConsumptionResidential Consumption
LongitudeLatitudeDistanceLongitudeLatitudeDistanceLongitudeLatitudeDistance
2006120.0931.19-120.0531.20-120.0431.19-
2007120.0831.190.87120.0431.200.98120.0331.182.12
2008120.0531.203.36120.0131.214.28120.0331.180.27
2009120.0231.234.73119.9731.224.03119.9731.216.50
2010119.9831.195.72119.9531.265.15119.9331.257.04
2011119.9431.194.33119.9331.273.51119.9431.232.57
2012119.9031.225.58119.9331.302.60119.9031.265.58
2013119.8831.242.98119.9331.263.96119.9431.295.54
2014119.8731.252.33119.9031.273.36119.8831.277.07
2015119.8631.261.81119.9031.292.81119.8731.271.38
2016119.8631.251.96119.9231.273.02119.8731.292.33
2017119.8631.241.23119.8931.226.16119.9131.1714.61
2018119.8431.222.38119.8831.202.77119.8931.0216.59
2019119.8131.233.25119.8631.202.87119.8331.1111.42
Table 3. Driving factors of electricity consumption change in the YRD region (108 kWh).
Year Δ E I E Δ E I O Δ E G Δ E P G Δ E P
2006–2007474.61−180.02758.8887.33−289.90
2007–2008429.52−169.09709.0171.28−584.87
2008–2009774.46−103.28700.0371.25−989.62
2009–201062.23−124.28906.9784.34238.70
2010–20112937.69−168.25871.2368.19−2808.60
2011–2012891.04−106.40838.6345.75−1122.36
2012–2013580.99−94.85868.0053.86−565.65
2013–2014667.02−142.92840.3836.27−1275.96
2014–2015660.91−265.98888.9117.23−1060.27
2015–2016−440.22−193.57829.8377.59625.56
2016–2017−409.20−37.82848.7362.84371.10
2017–2018−844.29−316.51826.9257.461190.47
2018–2019−1762.93−276.621090.1763.761362.65
Table 4. Decomposition results of sectoral electricity consumption (108 kWh).
Sector Δ E t Δ E I E Δ E I O Δ E G Δ E P G Δ E P
Agriculture60.62−120.38138.86−52.2588.006.39
Industry5127.69−5121.424922.30−3008.777767.76567.64
Construction166.89694.20−691.229.90143.8610.15
Transportation230.3551.8250.73−35.57152.7310.65
Trade and catering469.61201.28−199.0328.25409.8829.23
Others2653.15−614.43−199.84878.872415.47173.08
Total8708.31−4908.754021.81−2179.5710977.69797.14
Table 5. Accumulative contribution of influencing factors by four districts (108 kWh).
District Δ E I E Δ E I O Δ E G Δ E P G Δ E P
Shanghai347.70−917.06−199.571096.84250.52
Jiangsu−1454.46679.45−741.994901.36211.06
Zhejiang−1673.052308.45−1236.043113.73283.90
Anhui−805.51666.43−130.161809.7297.81
Table 6. Sectoral electricity consumption changes in regions (108 kWh).
DistrictsAgricultureIndustryConstructionTransportationTrade and
Catering
OthersTotal
Shanghai0.60110.7630.6439.7828.85367.80578.43
Jiangsu23.492364.6739.7380.7380.731006.083595.43
Zhejiang15.171681.8764.8368.49160.28806.352796.99
Anhui21.36970.3931.6941.35100.57472.921638.28
Publisher’s Note: MDPI stays neutral with regard to jurisdictional claims in published maps and institutional affiliations.

