Article

Development and Characterization of Composite Desiccant Impregnated with LiCl for Thermoelectric Dehumidifier (TED)

by
Chanchira Channoy
1,
Somchai Maneewan
1,*,
Surapong Chirarattananon
2 and
Chantana Punlek
1
1
Department of Physics, Faculty of Science, Naresuan University, Phitsanulok 65000, Thailand
2
The Joint Graduate School of Energy and Environment, King Mongkut’s University of Technology Thonburi, Bangkok 10140, Thailand
*
Author to whom correspondence should be addressed.
Energies 2022, 15(5), 1778; https://doi.org/10.3390/en15051778
Submission received: 31 January 2022 / Revised: 22 February 2022 / Accepted: 25 February 2022 / Published: 28 February 2022

Abstract

:
Aqueous salt solutions (LiCl) were impregnated into a porous host matrix to create composite desiccant materials (silica gel). The authors of this paper fabricated and analyzed composite desiccant-coated aluminum sheets (DCAS) with varying LiCl mass concentrations. Nitrogen sorption results revealed that the Brunauer–Emmett–Teller (BET) surface area and pore volume of the composite desiccant-coated aluminum sheets decreased. Furthermore, composite DCAS had lower nitrogen sorption than silica-gel-coated aluminum sheets (SGCAS). According to the results, the composite DCAS had the highest thermal conductivity, measuring 6.1 Wm−1 K−1, doubling that of the SGCAS. For evaluating sorption kinetics, the linear driving force model (LDF) was used, and composite DCAS showed greater dynamic sorption quantities and sorption rate coefficients than SGCAS. Furthermore, three different moisture sorption isotherm models were used to fit the experimental results: the Brunauer–Emmett–Teller (BET) model, the Guggenheim–Anderson–Boer (GAB) model, and the double log polynomial (DLP) model. The DLP model was shown to be the best model for predicting the moisture sorption isotherms of DCAS. Additionally, the composite desiccant-coated heat sink (DCHS) of the thermoelectric dehumidifier (TED) was evaluated and compared to silica gel in terms of dehumidification capacity. According to the findings, the outlet air humidity ratio of the composite DCHS reached a minimum of 10.23 g kg−1, and the dehumidification capacity was 0.117 kg h−1 when the input electrical voltage was kept at 9 V.

1. Introduction

Recognizing the gravity of the problems caused by CO2 emissions and global warming in recent years, there has been an increase in research efforts aimed at developing solid dehumidification systems powered by low-temperature energy derived from various sources. As a promising energy-saving technology, these systems use massive amounts of industrial waste heat and low-grade solar energy. Instead of CFCs, HCFCs, or HFCs, the systems employ solid desiccant cooling in the form of silica gel. Furthermore, they do not contribute to ozone layer depletion and effectively reduce global warming potential. To improve the overall performance of the systems, the desiccant should typically be capable of high-water adsorption at a specified adsorption temperature while also being readily regenerable at a low regeneration temperature. Silica gels are widely used in solid dehumidification systems due to their high porosity and stable sorption properties. They can be regenerated at low temperatures and are readily available [1]. However, their adsorption capacity is only about 40% of their weight, and water exchange is low during a typical dehumidification cycle because water sorption occurs almost entirely at extremely high pressures, as opposed to lower pressures [2]. To address this issue, researchers have focused on developing a new desiccant with high adsorption capacity that can be regenerated at low temperatures.
In a previous study, a new family of composite desiccants known as novel composites salt inside porous matrix (CSPMs) was introduced for dehumidification systems, which are two-phase systems composed of a porous host matrix (silica gels, activated alumina, porous carbons, zeolite, and expanded vermiculite, etc.) and aqueous salt solutions (LiCl [3], CaCl2 [4], LiBr [5], MgCl2 [6], MgSO4, Ca (NO3)2 [7], Na2S, SrBr2, and LiNO3 [8], etc.). The materials’ physical structure places them in a middle ground between solid desiccants and hygroscopic salts, and they were arranged to exhibit the best properties of both materials. Using a composite desiccant (silica gel–haloids) developed by Ge et al. [9], a rotary wheel dehumidification system with an inter-cooling rotary wheel was utilized to remove part of the adsorption heat. The study discovered that the system could be operated at low regeneration temperatures (60 to 90 °C) while maintaining a COP coefficient greater than 1.0. Additionally, using previously validated simulation models, Jeong et al. [10] investigated the performance of four dehumidification systems. In the experiments, a batch-type dehumidification system with an internal heat exchanger was found to operate effectively at heated air temperatures as low as approximately 33 °C. Hu et al. [11] evaluated the performance of fin-tube heat exchangers coated with silica gel and silica gel–lithium chloride (LiCl) composite desiccant. When tested under the same experimental conditions as silica gel, the composite desiccant had an excellent dehumidification capability. Chua [12] investigated the effectiveness of three different types of composite desiccants: silica gel–calcium chloride (CaCl), silica gel–lithium chloride (LiCl), and silica gel–polyvinyl alcohol (PVOH). Composite materials contain a higher percentage of silica gel and halides or polymers, which have strong moisture removal properties when compared to traditional desiccant materials. The high regeneration capacity results showed that composite desiccants outperformed pure silica gel by at least 11% in terms of moisture removal capacity, regeneration rates, and pressure decreases.
Despite this, only a few studies on composite, desiccant-coated aluminum sheets (DCAS) have been published in the literature. Hu et al. [13] developed a composite desiccant-coated aluminum foil using silica gel in various particle sizes and impregnated them with saturated solutions of lithium chloride (LiCl) and calcium chloride (CaCl2). The composite desiccant increased moisture uptake by more than 30 to 45%, and the LiCl composite desiccant had higher moisture uptake than the calcium chloride composite desiccant. In comparison, the composite desiccant outperformed silica gel by 70 to 120% in terms of cycle adsorption. Zheng et al. [14] investigated how different silica gel–lithium chloride (LiCl) composite DCAS influence the behavior of desiccants. The silica gel–LiCl composite DCAS had twice the maximum thermal conductivity of the silica-gel-coated aluminum sheets (SGCAS), as well as significantly higher dynamic sorption quantities and a higher sorption rate in sorption kinetics. A silica gel–LiCl composite desiccant-coated heat exchanger (DCHE) was compared to a silica-gel-coated heat exchanger in terms of dehumidification capacity. The results demonstrated that, by incorporating a silica gel–LiCl composite desiccant into the DCHE system, it is possible to achieve increased dehumidification capacity.
In this study, composite DCAS with varying LiCl mass concentrations were created and analyzed. This can certainly provide an in-depth understanding of the reaction mechanism during the adsorption/desorption operations on LiCl concentration, thus, leading to valuable information for the advancement of composite desiccant materials. This composite desiccant material was used to coat heat sinks of TED as a method of decreasing the heat load on conventional, vapor-compression refrigeration systems. The texture properties, as well as the microstructure properties, were studied. To determine and analyze sorption kinetics, the linear driving force (LDF) model was used. Moreover, the thermal conductivity was measured and discussed. To fit the experimental data, three moisture sorption isotherm models were used: the Brunauer–Emmett–Teller (BET) model, the Guggenheim–Anderson–Boer (GAB) model, and the double log polynomial (DLP) model. Finally, the thermoelectric dehumidifier (TED) was used to assess the dehumidification capacity of silica gel and composite DCHS. The advantages of a TED with a desiccant-coated heat sink (DCHS) include the ability to exchange both sensible heat (fin heat sinks) and latent heat (desiccant material) [15,16]. Furthermore, the TED can regenerate the desiccant using the thermoelectric module (hot-side) and reduce the air temperature before entering the room using the thermoelectric module (cold-side).

2. Materials and Methods

2.1. Preparation of Composite DCAS

Table 1 presents the specifications of the materials that were utilized in this study. It was based on the coating technique developed by Zheng et al. [14]. The commercial silica gel was dried at 100 °C for 4 h prior to preparing the composite DCAS. An aluminum sheet was weighed and brushed with liquid glue, followed by the scattering of silica gels onto the glue-adhered sheet. After dipping the aluminum sheet in silica sol for approximately 30 min to thoroughly combine the silica gel, it was dried at 100 °C for 4 h. The aluminum sheets were dipped in silica sol and dried 5 more times. The aluminum sheets were then immersed in an aqueous lithium chloride (LiCl) solution containing various mass concentrations (30, 35, 40, and 45 wt.%) for 12 h before being dried in an oven at 100 °C for at least 6 h until the weight remained constant. The salt content of the composite DCAS was measured by weighing the aluminum sheets before and after salt impregnation.
Table 2 shows the results of this research, which included the fabrication of four composite DCAS. The composite DCAS were labeled SG-L30, SG-L35, SG-40, and SG-L45, where the digital numbers represent the mass concentrations of the impregnating LiCl in the composite DCAS, respectively. The salt content of composite DCAS increased as the impregnating concentration of LiCl solution increased. SGCAS (SG-L0) was also produced as a contrast sample.

2.2. Thermal Conductivity

The hot disk thermal constant analyzer (TCA), Hot Disk AB: TPS2500S, was used to measure the thermal conductivity of the DCAS. Thermal conductivity was measured using the standardized transient plane source (TPS) technique, which has an accuracy greater than 5%. The samples were 50 mm × 50 mm × 10 mm in size. Before the test, all of the DCAS samples were oven-dried for 4 h at 100 °C.

2.3. Characterization Techniques

The BET surface area, pore volume, and pore size were measured and analyzed using a surface area and porosity analyzer (Micromeritics-TriStar II 3020, Micromeritics instrument corporation, Norcross, GA, USA). To obtain nitrogen sorption isotherms at 77 K, the system employed the physical adsorption and capillary condensation principles. Temperature and pressure were the main causes of experimental errors. The temperature accuracy of the manifold was ±0.25 °C, and the pressured ones had a testing error of around 0.5%. To determine the morphology of DCAS, scanning electron microscopy (SEM) analysis was performed using a LEO1455VP scanning electron microscope.

2.4. Sorption Kinetics

The kinetics of the DCAS sorption were studied in a constant temperature and humidity chamber. The humidity control range was 10 to 98%, while the temperature range was −70 to 180 °C. The defined working conditions were set at 20 °C and 70% RH. During the test, the temperature fluctuated in the chamber by 0.1 to 0.2 °C while the relative humidity fluctuated by ±2.5%. Before the test, the DCAS samples were dried at 100 °C for 4 h in an oven and weighed. The DCAS were then placed in a chamber with pre-set conditions. The weights of the DCAS were recorded at prescribed times on an electronic scale with an accuracy of 0.001 g, which was used in this study.

2.5. Moisture Sorption Isotherms

The DCAS moisture sorption isotherms were generated using a vapor sorption analyzer (VSA) at 25 °C. The VSA generated dynamic isotherms by employing the dynamic dewpoint isotherm (DDI) method, water activity, and a gravimetric analysis method that does not control water content or activity but dries or wets the sample to measure water activity and water content during the wetting or drying process. A high-precision magnetic force balance was used to weigh the samples to determine water content. Table 3 shows the specifications of the VSA.

2.6. Moisture Sorption Isotherms Models

Moisture sorption isotherms depict the relationship between water activity and moisture content at a constant temperature. It depends on the chemical composition, physical structure, and physical-chemical condition of the material. Due to variations in capillary, surface, and colligative processes, the isotherm shape is unique to each material type. Over the decades, several renowned adsorption models were developed based on monolayer and multilayer adsorption theories, with the BET [17] and GAB [18] being the most widely used. The BET model is often used to estimate moisture sorption data ranging from 0 to 0.5 A w [19]. In comparison, the GAB model enhances the BET model’s applicability over a broader range (0.05 to 0.95 A w ) [18]. The DLP model [20] is a new empirical model that is even more effective than the GAB model in characterizing complicated isotherms. The ability of the three moisture sorption isotherm models to fit the experimental data for the DCAS was evaluated in this study (BET, GAB, and DLP). The following are the equations for the models:
BET    m = c m 0 A W ( 1 A W ) ( 1 + ( c 1 ) A W )     (1)   
GAB    m = c 1 K m 0 A W ( 1 K A W ) ( 1 K A W + c 1 K A W )     (2)   
DLP    m = b 3 x 3 + b 2 x 2 + b 1 x + b 0     (3)   
where m is moisture content (%) and, for Equations (1) and (2), c is a constant related to water binding energy to the primary binding sites, m 0 is the monolayer moisture content (%), A w is the water activity, c 1 is a dimensionless measure of the strength of water binding to the primary binding sites, and K is a constant related to the adsorption energies of multilayer adsorption sites. In the GAB model, which differs from the BET theory, the difference in adsorption energies between monolayer and multilayer adsorption sites is represented by an additional adsorption parameter ( K ). The GAB model may be reduced to the BET equation when parameter K = 1. Moreover, in Equation (3), x = ln ( ln ( A W ) ) ; b 0 , b 1 , b 2 , and b 3 are empirical constants. The BET, GAB, and DLP models were fitted using non-linear regression. The Origin 9.0 software was used to perform regression calculations. In addition to the coefficient of determination (R2) of the non-linear regression, the goodness of the model fit was tested using the root mean square error (RMSE).

3. Results

3.1. Thermal Conductivity

The thermal conductivity for the DCAS is presented in Figure 1. In the result, the thermal conductivity of the DCAS varied from 3.0 to 6.1 Wm−1 K−1, with all DCAS exhibiting good thermal conductivity due to the advantage of the aluminum sheet. Furthermore, the salt content of composite DCAS influenced thermal conductivity significantly. Compared to SGCAS (SG-L0), thermal conductivity increased by impregnating aluminum sheets with salt particles. Due to the immersed salt particles filling some pore space inside the silica, the highest thermal conductivity of composite DCAS (SG-L45) was approximately twice that of SGCAS (SG-L0) [14,21].

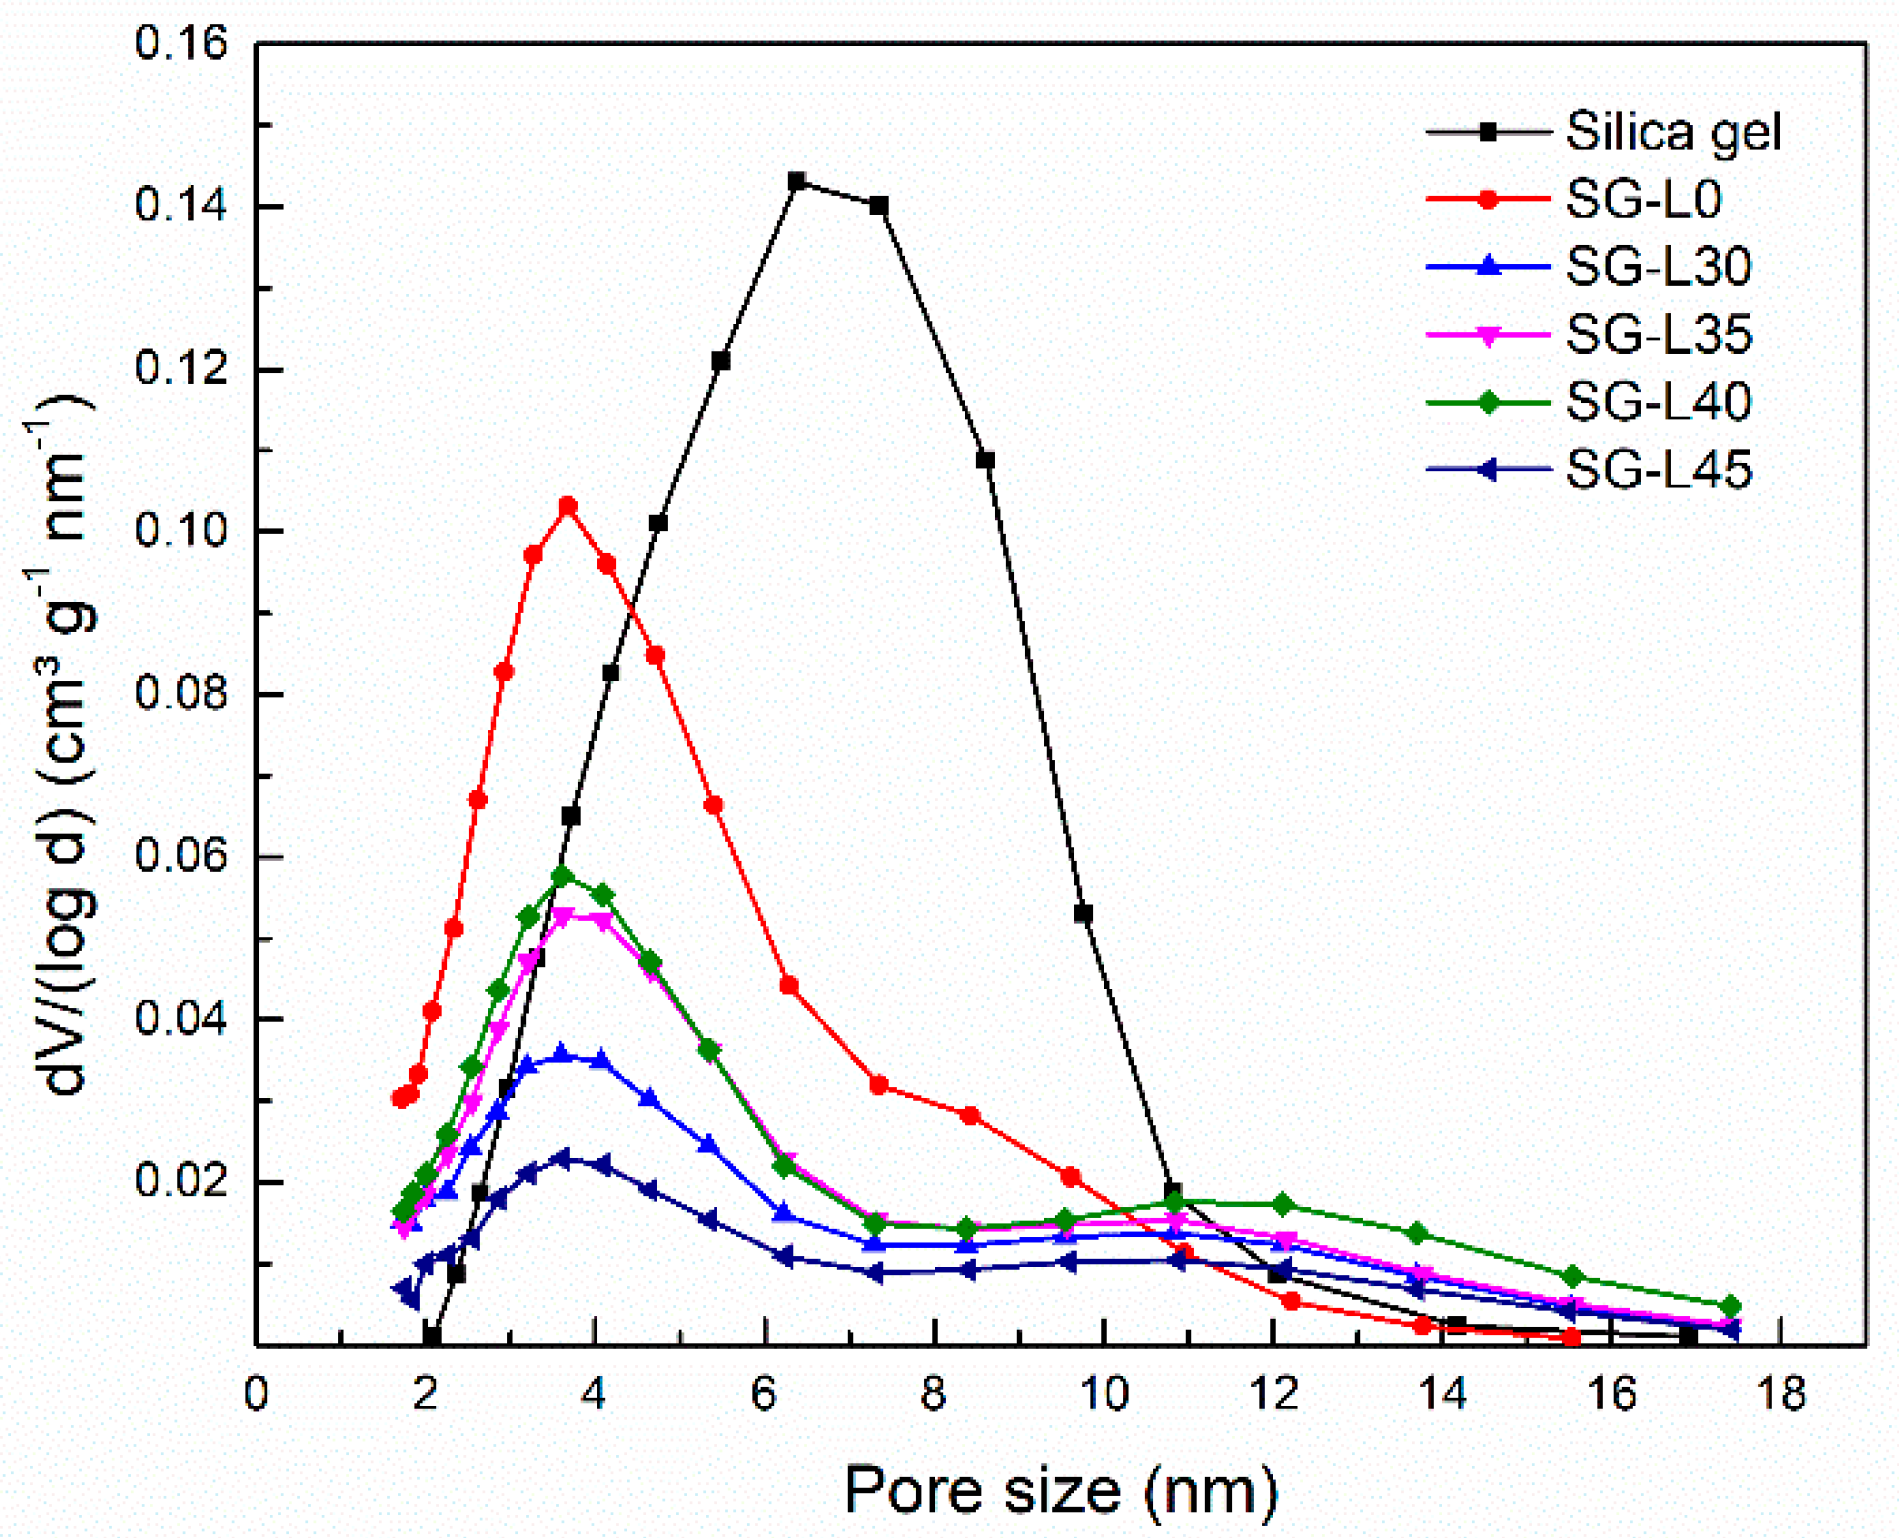
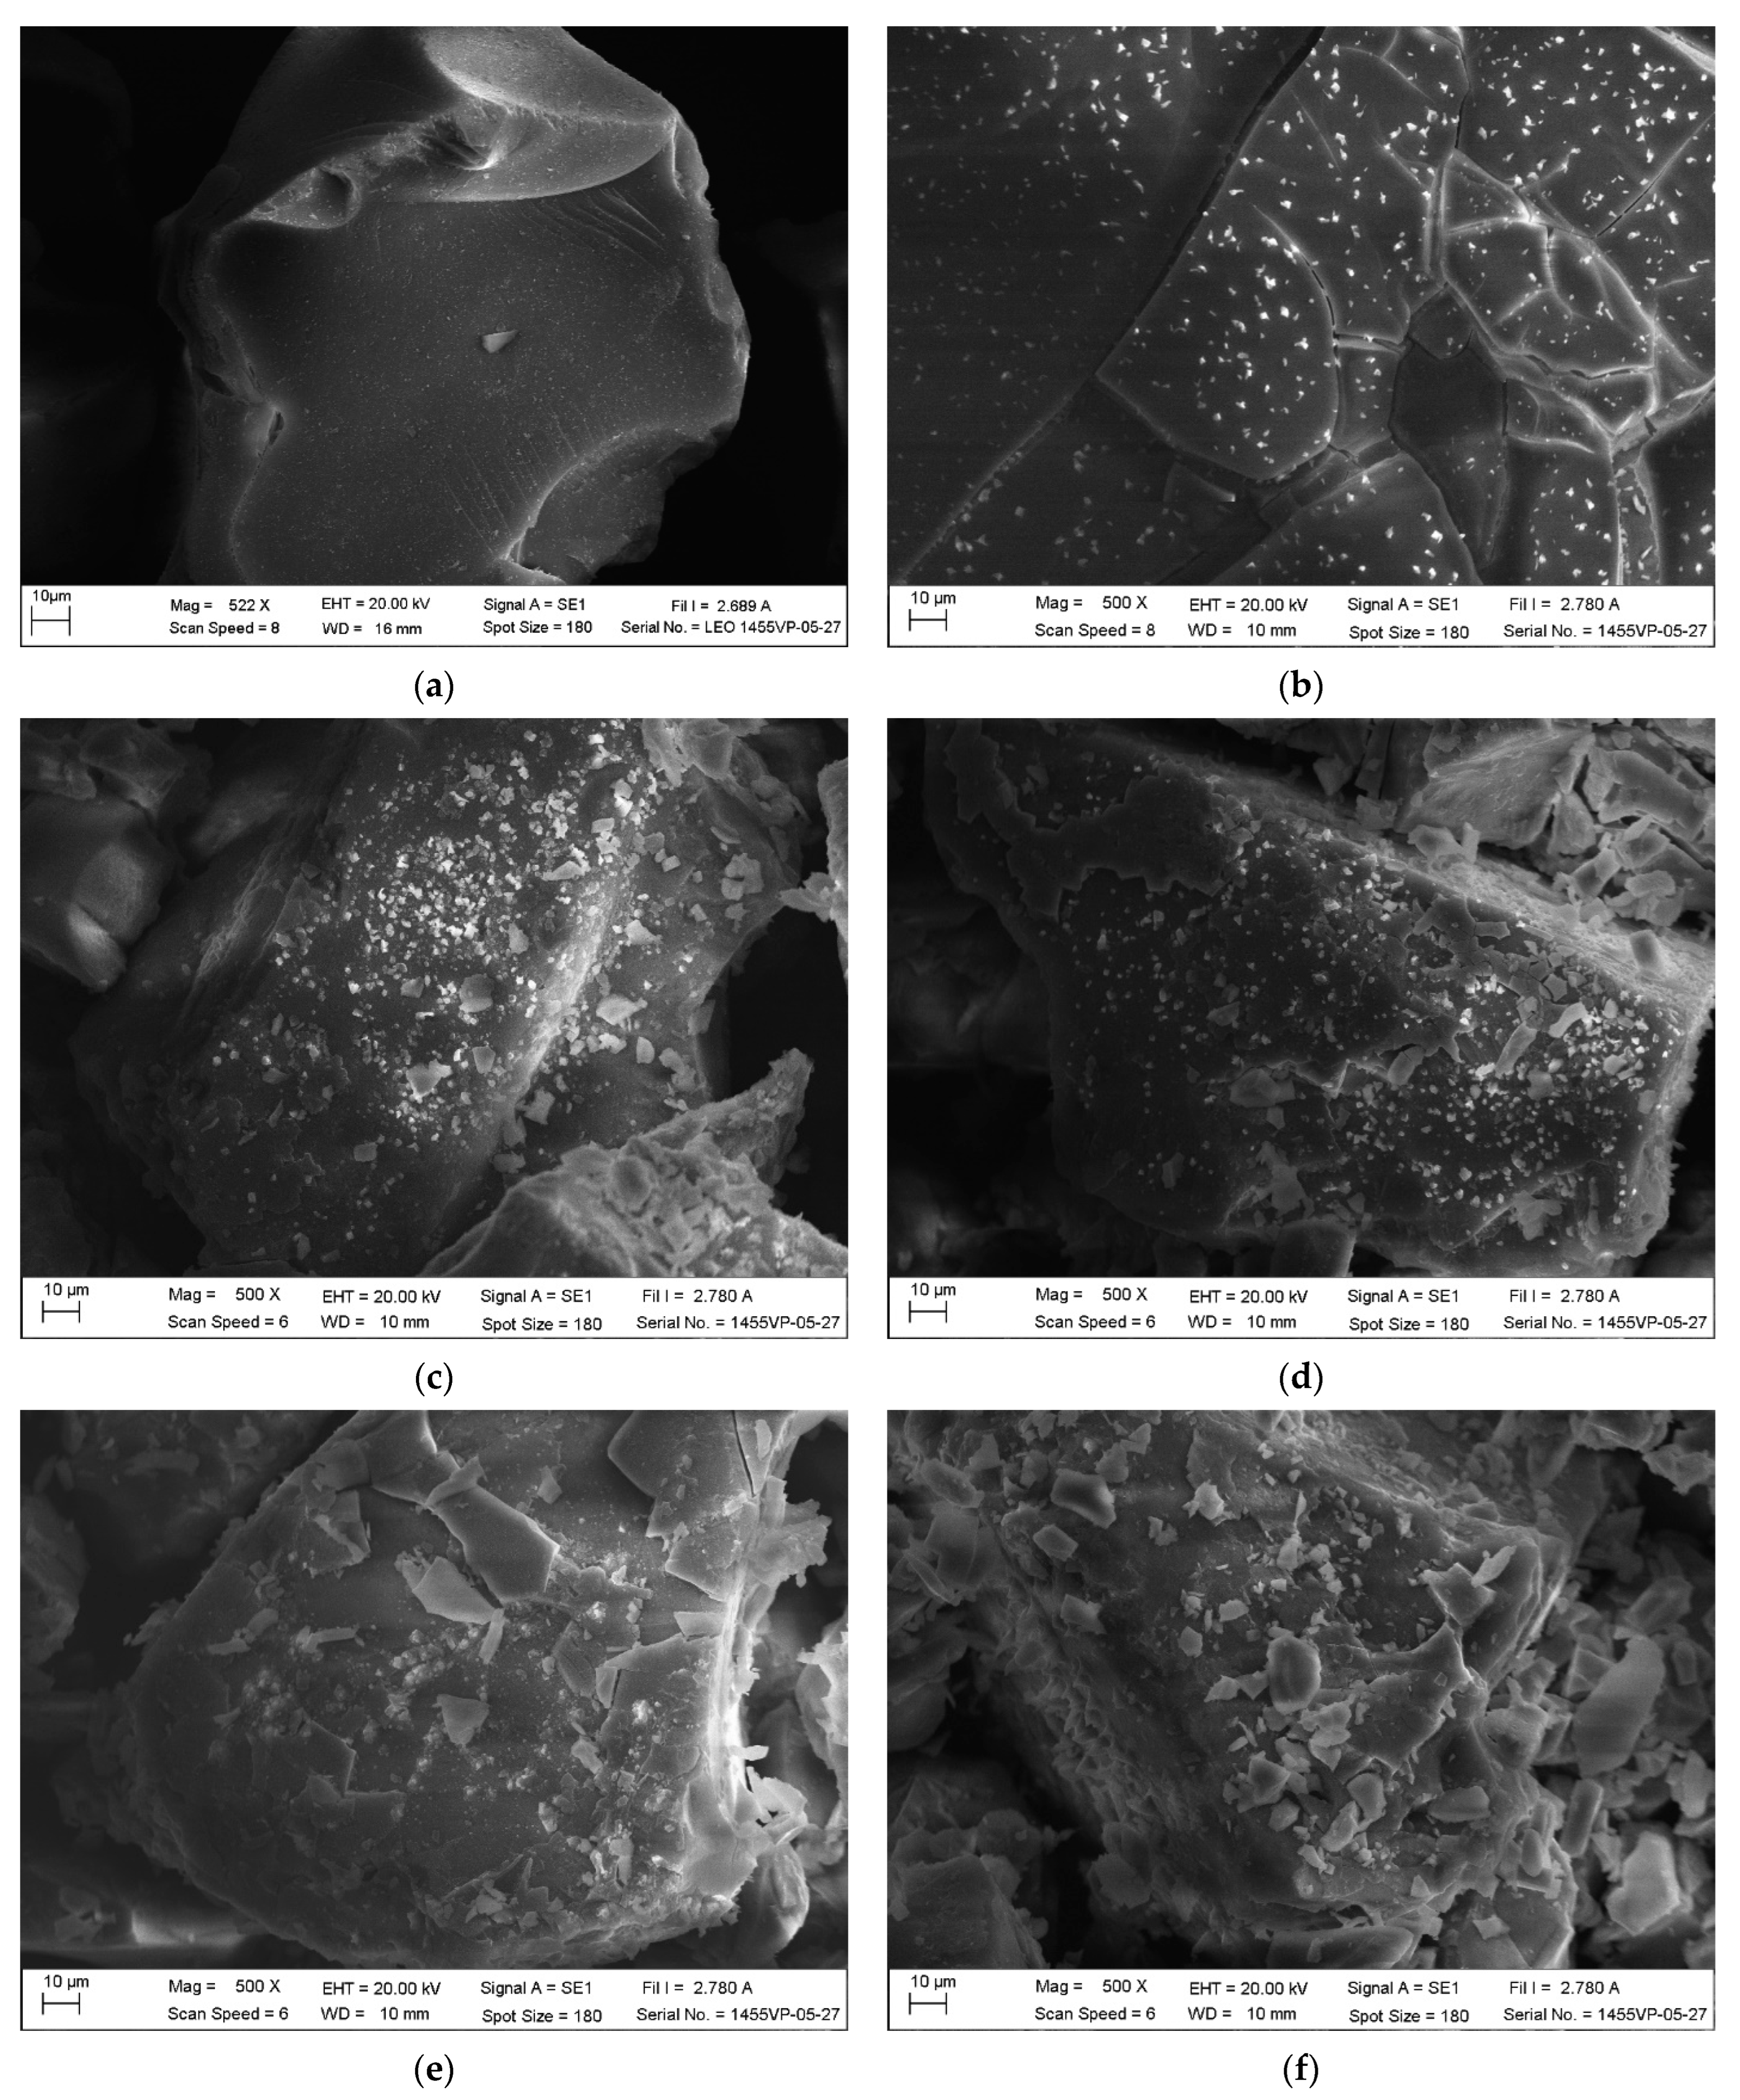
3.2. Textural and Morphological Characterization

Table 4 shows the textural characteristics, including BET surface area (SBET), pore volume (Vt), and average pore size (dav) of DCAS. The calculated parameters were based on the unit mass. SBET and Vt decreased as the mass concentration of LiCl solution in the impregnating solution increased. However, SBET* and Vt* were slightly reduced when salt content was considered. Salt surface complexes were formed as a result of various interactions between silica gel and LiCl during impregnation [22]. A similar phenomenon was observed by a number of other researchers [7,23,24,25,26]. Furthermore, the dav of composite DCAS decreased slightly due to the complex nature of the LiCl that formed on the silica surface during deposition. The formation of the LiCl layer completely or partially filled the small holes [7,22]. Consequently, dav increased, decreased, or remained relatively constant. Figure 2 depicts the nitrogen sorption isotherms of the DCAS (SG-L0 to SG-L40), with silica gel as a comparison sample. The DCAS exhibited typical type IV isotherms at relative pressures ranging from 0.45 to 0.8, with a hysteresis loop at high relative pressure, according to the IUPAC classification [27]. Type IV isotherms are commonly seen in mesoporous materials (with pores ranging in size from 2 to 50 nm) and indicate multilayer adsorption followed by capillary condensation [28]. Furthermore, the shape of the pores in the studied material was determined by the type of hysteresis. The hysteresis loops for DCAS were of type H1, indicating agglomerates or spherical particles arranged fairly uniformly, as well as relatively high pore size uniformity and facile pore connectivity [29,30]. Furthermore, the capillary condensation process caused a rapid rise in nitrogen sorption at the beginning of the hysteresis loop. Moreover, at a relative pressure of about 1.0, the composite DCAS had a lower nitrogen sorption quantity than SGCAS (SG-L0), because the immersed salt particles blocked some of the silica gel’s narrow pores [31]. To further understand the pore structure in DCAS, pore size distributions were also analyzed, as shown in Figure 3. The DCAS showed a sharp peak in the mesoporous region at approximately 4 nm. However, because the immersed salt particles caused pore blockage, the amount of nitrogen sorption by the composite DCAS was significantly reduced.
Figure 4 shows scanning electron microscopy (SEM) images of the DCAS. When viewing the images from Figure 4b–f, it is clear that, as the mass fraction of LiCl increased, the LiCl gradually occupied the microporosity of the silica pellet. It was demonstrated, however, that all composite DCAS had a salt layer that partially covers their matrix surface. LiCl was not entirely contained within the pores and was partially deposited on the outside surface of the grain. Furthermore, the SEM images show potential explanations for the thermal conductivity trend in Figure 1 and the nitrogen sorption isotherm trend in Figure 2. Thermal conductivity initially increased with increasing LiCl concentrations for composite DCAS with the same silica gel ratio because composite DCAS had a more organized structure. Similarly, a higher LiCl concentration during the gas transfer decreased nitrogen adsorption because the silica gel may have been overly squeezed, leaving fewer empty spaces for gas passage.

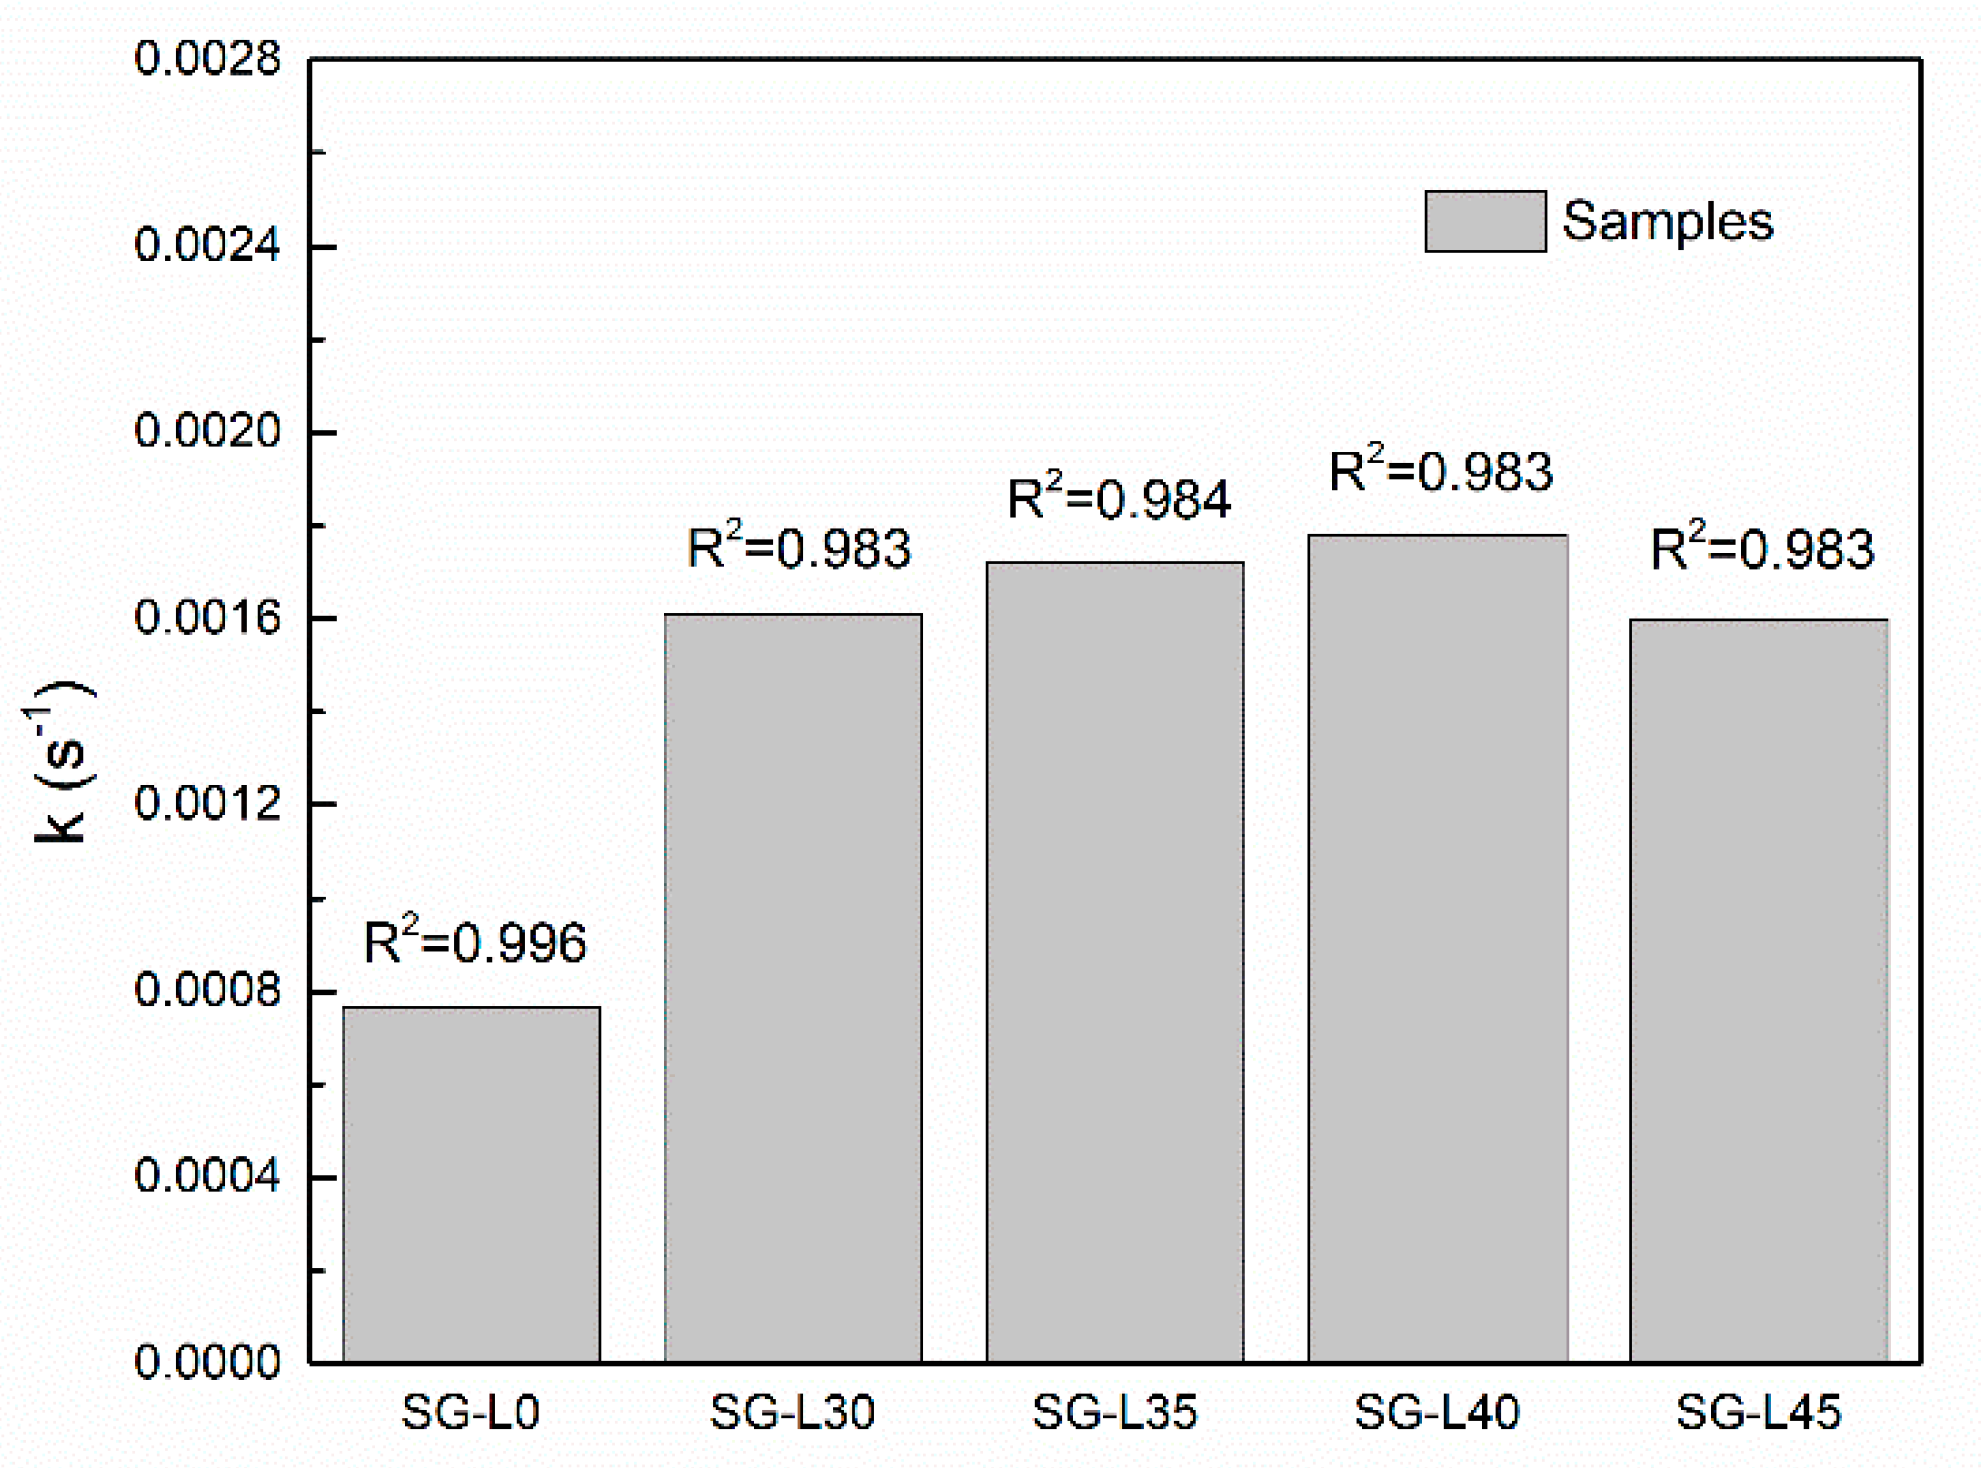
3.3. Sorption Kinetics

The water sorption kinetics of solid desiccant systems are essential since they can influence the cycle time. Experimental results are illustrated in Figure 5. During the initial stages of sorption, dynamic water sorption increased significantly for all DCAS. After that, as the amount of absorbed water approached saturation, it gradually increased. In comparison to SGCAS (SG-L0), composite DCAS demonstrated greater water sorption quantities and rates, indicating a collaborative contribution of the porous host matrix (silica gel) and impregnated salt particles (LiCl). The water sorption quantities of composite DCAS (SG-L40), after testing at 10, 30, and 60 min, were 0.22, 0.30, and 0.34 g g−1, whereas the water sorption quantities of SGCAS (SG-L0) were 0.04, 0.09, and 0.12 g g−1, respectively. This is due to the fact that water sorption through silica gel is a physical process, as opposed to through composite desiccants, which includes both chemical (salt hydration) and physical sorption [14]. Furthermore, because the composite DCAS had higher thermal conductivity than the SGCAS, the influence of the released sorption heat decreased, resulting in a shorter time required to reach sorption equilibrium. When the sorption time exceeded 20 min, the water sorption quantities increased significantly as the LiCl concentrations of the composite DCAS increased.
Furthermore, sorption rate coefficients were investigated to better understand the dynamic properties of DCAS. As seen in Figure 5, the dynamic sorption curves were approaching exponential. It was possible to use the LDF model to determine the adsorption rate [32]. The sorption rate can, therefore, be represented by:
d x d t = k ( x x t )
where d x / d t is the sorption rate, k is the sorption rate coefficient, (s−1), x is the equilibrium water sorption quantity (g g−1), and x t is the dynamic water sorption quantity (g g−1).
After the integration of Equation (4), the dynamic water sorption quantity of DCAS can be calculated:
x t = x ( 1 exp ( k t ) )  
Rearranging Equation (5) and using the Napierian logarithm results in the following:
ln ( 1 x t x ) = k t
The sorption rate coefficients ( k ) and coefficient of determination (R2) of SGCAS (SG-L0) and composite DCAS (SG-L30 to SG-L45) were calculated, as shown in Figure 6. The sorption rate coefficients ( k ) of the DCAS ranged from 0.77 × 10⁻³ to 1.78 × 10⁻³ s−1, which is approximately 1 time greater than SGCAS, indicating the positive effect of LiCl. The LDF model corresponded with well-measured data, with the coefficient of determination (R2) ranging between 0.983 and 0.996 for all DCAS. When compared to SGCAS (SG-L0), the dynamic water sorption quantity and sorption rate coefficient significantly increased.

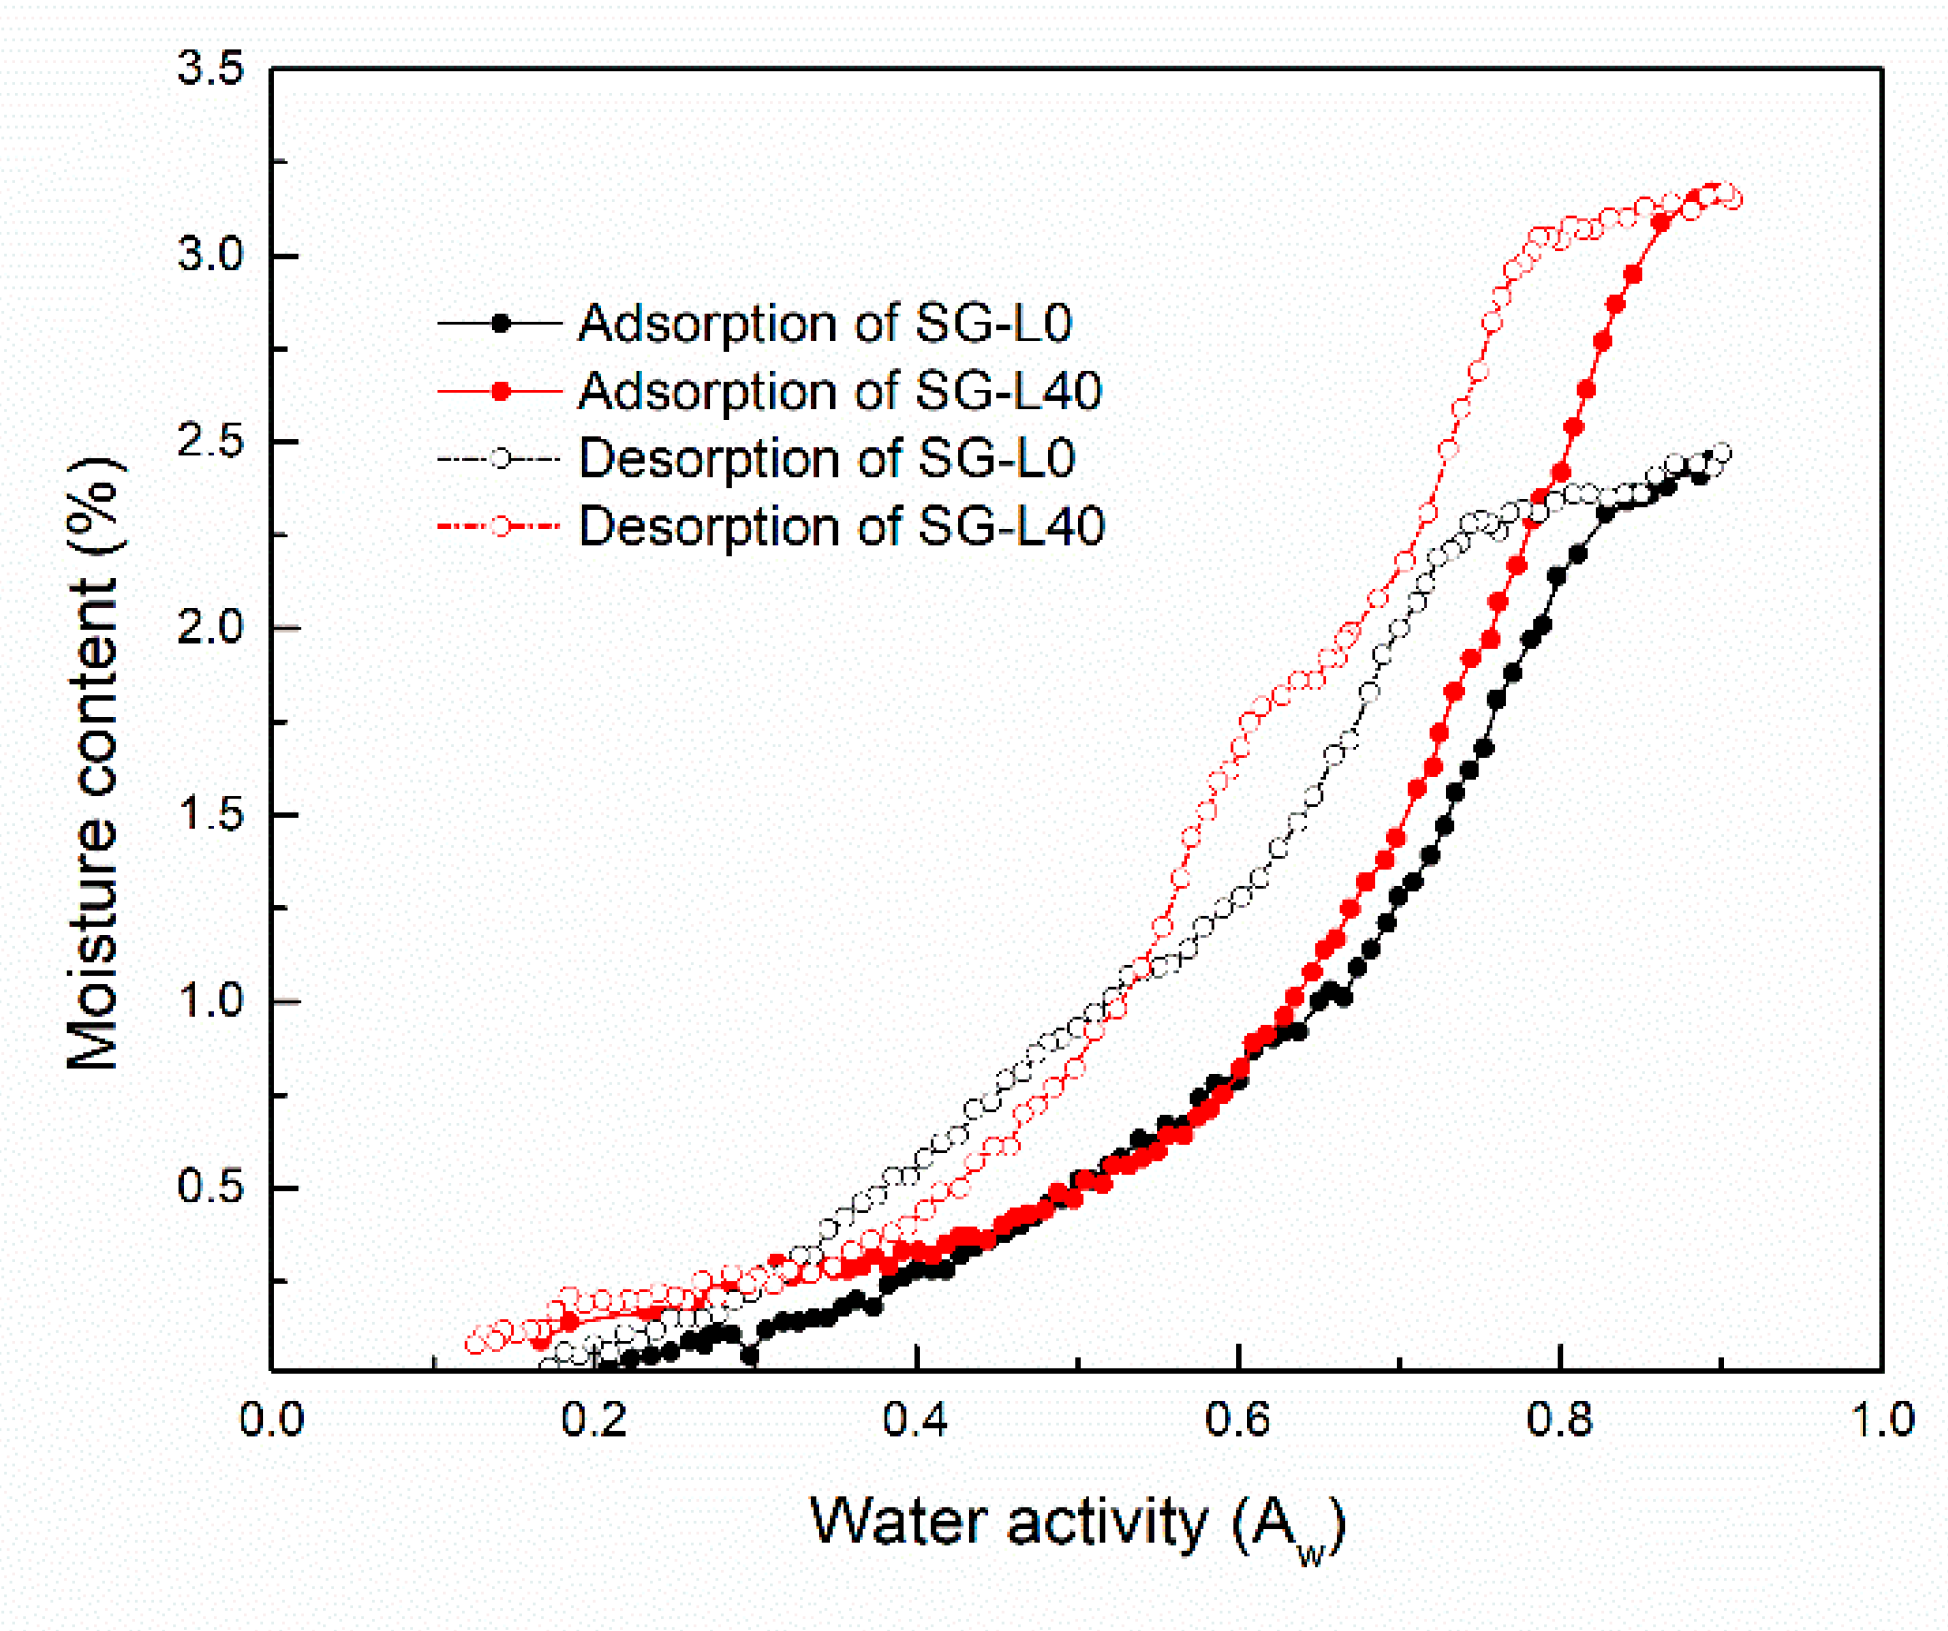
3.4. Moisture Sorption Isotherms

As shown in Figure 7, the VSA was used to study delicate moisture sorption isotherms on DCAS to better understand the mechanism of moisture sorption behavior of DCAS. The moisture content (%) of composite DCAS (SG-L40) was significantly higher than that of SGCAS (SG-L0) because of the highly hygroscopic salt LiCl contribution. However, moisture sorption isotherms indicated that composite DCAS (SG-L40) had a higher adsorption capacity, with a 20 to 30% greater water uptake than SGCAS (SG-L0). For DCAS, moisture content (%) increased as water activity ( A w ) increased.

3.5. Moisture Sorption Isotherms Models

Table 5 shows that, regardless of sorption direction, the DLP model is the best fit for estimating the moisture sorption isotherms of DCAS (R2 and RMSE), followed by the GAB and BET models. As expected, the BET model fitted sorption data quite well, but only in the water activity ( A w ) range of 0 to 0.5. Only the GAB and BET models provided values for monolayer moisture content ( m 0 ), which represent the adsorption potential and amount of water adsorbed to DCAS pore surface monolayer sites for each sorption direction. The higher m 0 values for composite DCAS (SG-L40) showed that this LiCl had a significant effect on sorption behavior, indicating that monolayer moisture content increased with increasing LiCl mass concentrations. Similarly, in the GAB model, the K value increased as the strength of the interactions between the water molecules and the adsorbent increased, compensating for differences in the characteristics of the multilayer molecules compared to the bulk liquid [21].
On the other hand, when the mass concentration of LiCl was increased, the interactions between surface groups and water molecules decreased, resulting in reduced c and c 1 value. Several layers of water molecules were arranged around each hydrophilic site during the formation of hydration monolayers. The sorption energy decreased as the distance between water molecules and the sorption site increased during the second hydration phase due to the progressive saturation of hydrophilic sites [33]. The direction of sorption is explained by the DLP-fitting equation as given in Table 6, and it was possible to determine the moisture content (%) of DCAS with known initial water activity more quickly.

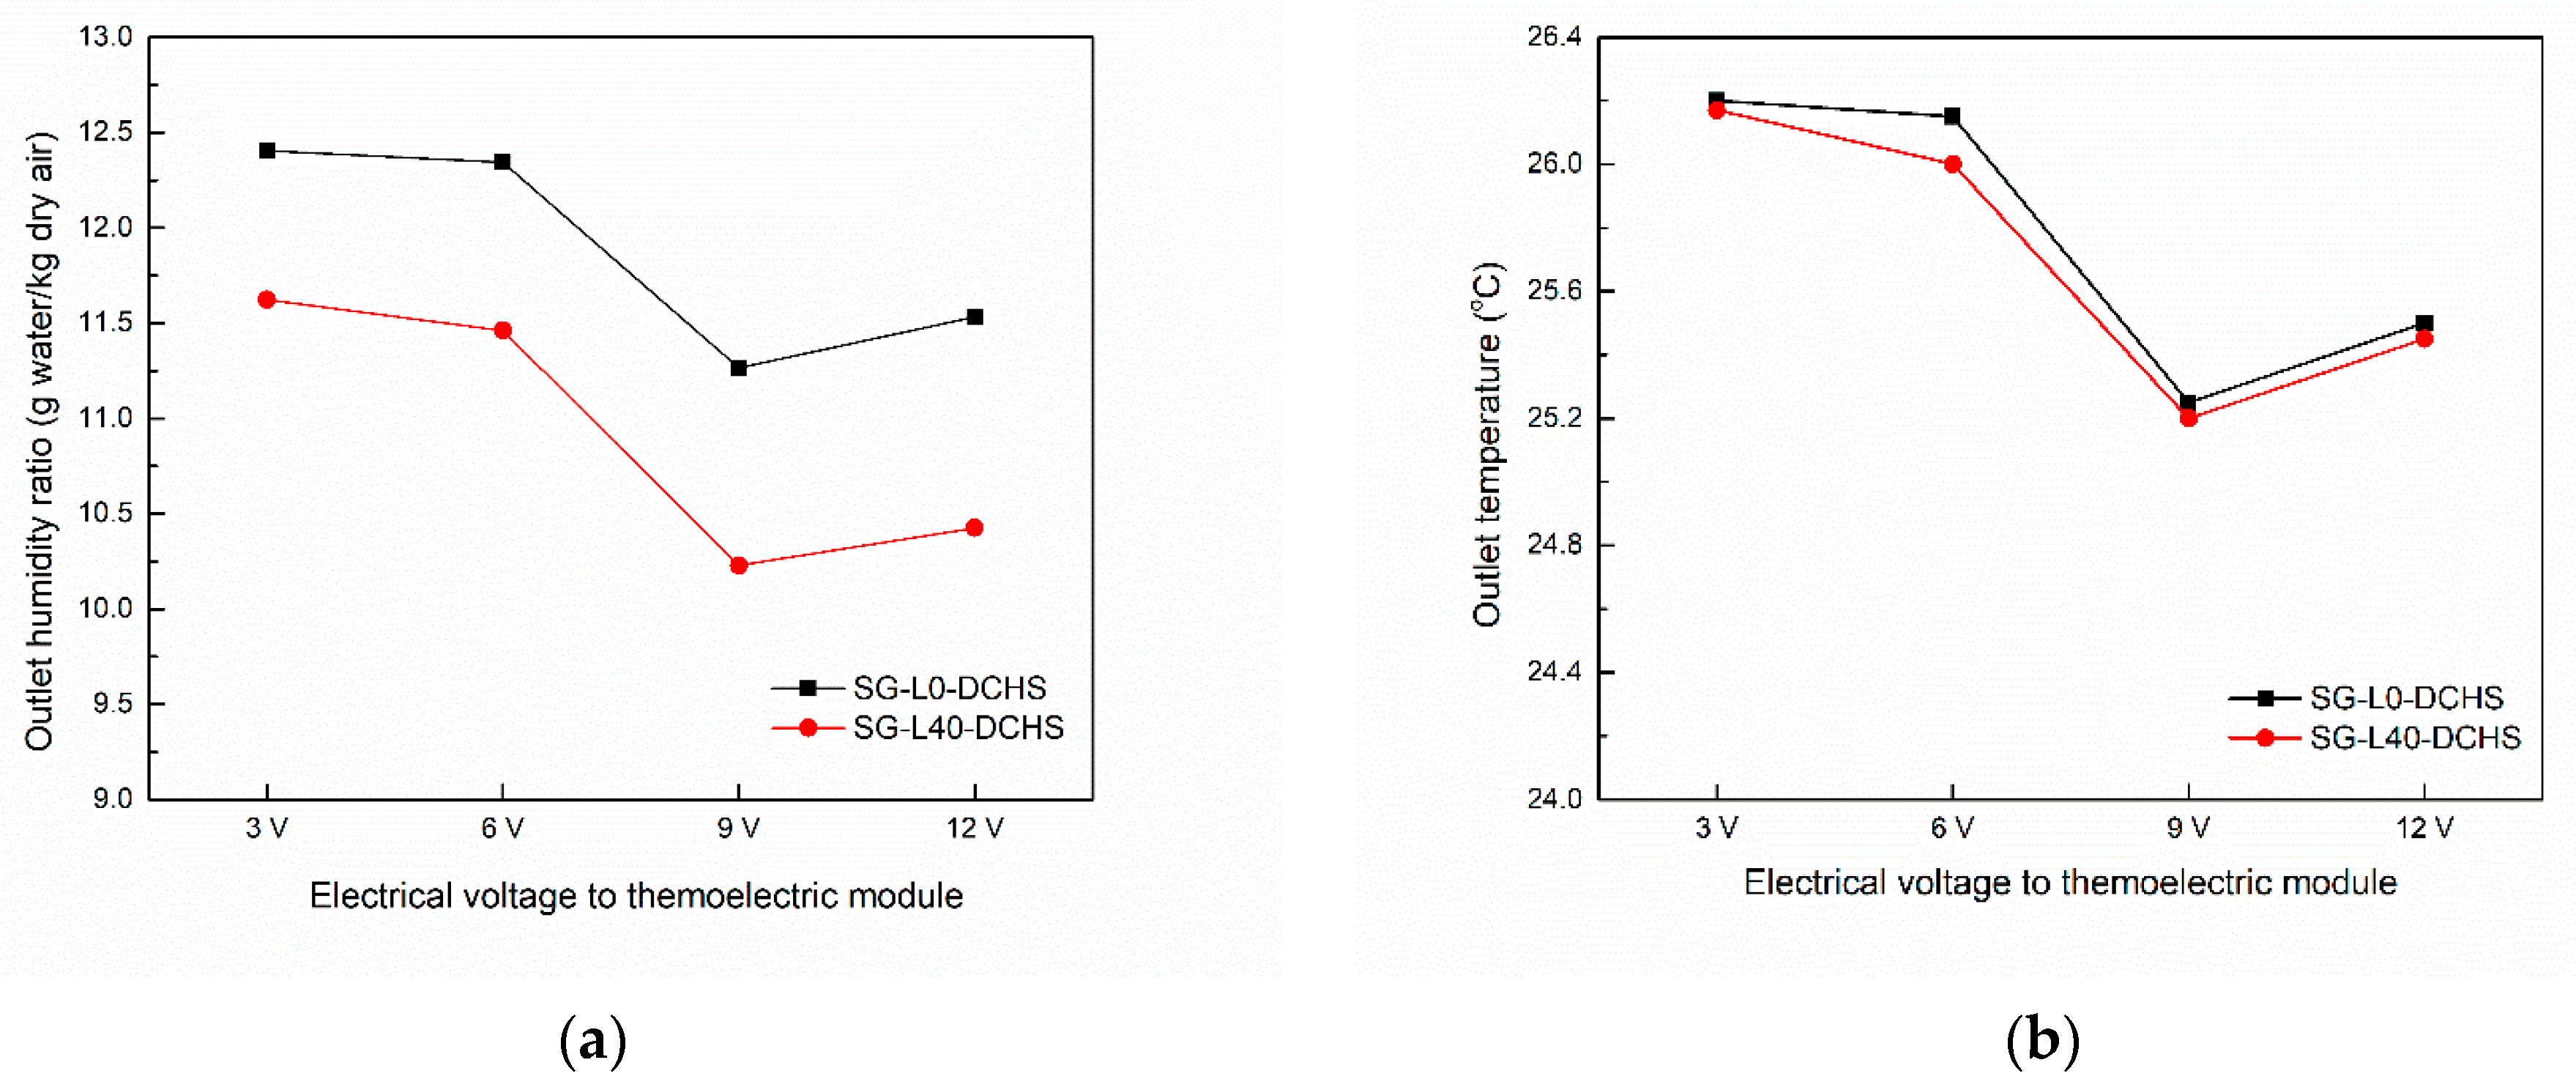
3.6. Dehumidification Performance

To investigate the application of composite desiccants further, a TED with a composite (SG-L40-DCHS) and silica gel (SG-L0-DCHS)-coated heat sink was built with a desiccant thickness of 1.5 mm. A schematic of the structure of the TED is illustrated in Figure 8a. The TED comprised twelve thermoelectric (TE) cooling modules (TEC1-12708) sandwiched between four aluminum, rectangular heat sinks (two for hot and two for cold air), as shown in Figure 8b. The TE modules were connected in series and arranged in two rows, each containing six TE modules. A total of four direct-current (DC) blowers were employed: two for the hot side, which were primarily used to assist in transferring excess heat to the environment, and two for the cold side, which were used to improve the convection of the air moving through the fin heat sink on the cool side. During the experiment, an electrical voltage was supplied to the TE modules at different voltages of 3, 6, 9, and 12 V, respectively. The cycle time was set at 60 min. The humidity ratio and velocity of the input air were 13.19 g kg−1 and 1.2 m s−1, respectively.
The dehumidification system comprised two dehumidifier units. One of the dehumidifier units worked on the dehumidification process, so it was supplied with the cold side of the TE modules to adsorb moisture in ambient air, whereas the other worked on the regeneration process, so it was supplied with the hot side of the TE modules to remove water from the saturated desiccant. These two dehumidifiers worked simultaneously; while one dehumidified the working air, the other was regenerated. The two switched their operations periodically to achieve dehumidification of the work in process.
Figure 9 shows the effect of increasing the electrical voltage on the cold and hot sides of the thermoelectric module. For the tests, four different voltages were used: 3, 6, 9, and 12 V. The cold-side temperature decreased from 45 to 19 °C as the electrical voltage increased. Meanwhile, when the electrical voltage increased, the temperature on the hot side increased. The maximum temperature on the hot side was 45 °C at 12 V. The minimum temperature on the cold side was 19 °C at 9 V. The higher the electrical voltage, the lower the temperature on the cold side and the higher the temperature on the hot side. Figure 10 compares the dehumidifying processes under different input electrical voltages of the thermoelectric module. It can be seen that the outlet air humidity ratio depended strongly on the input electrical voltage of the thermoelectric module. In this experiment, when the input electrical voltage was 3, 6, and 9 V, the outlet air humidity ratio (Figure 10a) reached 12.40, 12.34, and 12.26 g kg−1 for SG-L0-DCHS and 11.62, 11.46, and 10.23 g kg−1 for SG-L40-DCHS. In contrast, for the input electrical voltage of 12 V, the outlet air humidity ratio showed an increasing tendency. The outlet air humidity ratio was 11.53 g kg−1 for SG-L0-DCHS and 10.43 g kg−1 for SG-L40-DCHS, respectively. As a result, the outlet air temperature tended to be the same as the humidity ratio (Figure 10b).
This result is explicable by the material properties of thermoelectric modules. The heat absorbed from the ambient by a thermoelectric module came from two sources: one due to the Peltier effect, which is proportional to the module’s current, another the Joule effect, which is proportional to the square of the current passing through the module. When the input voltage was too low, the Peltier effect was ineffective, resulting in a slow rate of dehumidification. On the other hand, when the input voltage was excessive, the Joule effect took over, imposing a large heat load on the heat–cold heat sinks. Once the generated heat could not be dissipated into the ambient, it was transferred to the cold side via heat conduction, thereby weakening the condensing heat transfer on the fin heat sink.
Dehumidification capacity ( Q d e ) was one of the most critical performance indicators in the DCHS system and was calculated using the following equation [14]:
Q d e = m a ( 0 t d e ( w a i w a o ) d t ) / t d e  
where Q d e is dehumidification capacity (kg h−1), m a is the mass flow rate of process air (kg s−1), w a i and w a o are humidity ratios of process air at the inlet and outlet (g kg−1), and t d e is dehumidification time (s). Figure 11 shows the Q d e of the DCHS using the TED. With increasing electrical voltage to the thermoelectric module, the Q d e increased from 0.031 kg h−1 at 3 V to 0.034 kg h−1 at 6 V and then reached the maximum value of 0.076 kg h−1 at 9 V. A further increase of electrical voltage to 12 V resulted in a slight decrease in the Q d e from 0.076 to 0.066 kg h−1 for SG-L0-DCHS. Similarly, the Q d e of SG-L40-DCHS, after testing at 3, 6, 9, and 12 V, was 0.062, 0.069, 0.117, and 0.110 kg h−1, respectively. Additionally, SG-L40-DCHS removed more moisture from the process air, which was approximately 1 time greater than SG-L0-DCHS. This was due to the combined effect of silica gel with impregnated LiCl.

4. Conclusions

The maximum thermal conductivity of composite DCAS was 6.1 Wm−1 K−1, which was more than double that of the SGCAS. Thermal conductivity analysis showed that all of the DCAS examined had good thermal conductivity. The average pore size of composite DCAS decreased slightly due to the complex nature of the LiCl that formed during the deposit on the silica surface. The dynamic sorption quantities and sorption rate coefficients of composite DCAS were greater than those of SGCAS. Composite DCAS had sorption rate coefficients that were approximately 1 time greater than SGCAS. This is because immersed LiCl particles blocked some of the silica’s narrow pores. The SEM image shows that, as the mass fraction of LiCl increased, the LiCl salt gradually occupied the microporosity of the silica pellet and was partially deposited on the grain’s external surface. Moisture sorption isotherms showed that composite DCAS had a higher adsorption capacity than SGCAS, with a 20 to 30% higher water uptake. The outlet air humidity ratio of the DCHS reached a minimum of 10.23 g kg−1, and the dehumidification capacity was 0.117 kg h−1 when the input electrical voltage was kept at 9 V. Furthermore, SG-L40-DCHS removed more moisture from the process air, which was approximately 1 time greater than SG-L0-DCHS. Additionally, the desiccant coating prevented liquid drops from condensing on the cold-side fins. Eliminating condensed liquid drops effectively is a significant future work.

Author Contributions

Methodology, C.C.; validation and analysis, C.C. and S.M.; writing—original draft preparation, C.C.; writing—review and editing, C.C., S.M., S.C. and C.P. All authors have read and agreed to the published version of the manuscript.

Funding

This research was funded by the International Research Network Program (IRN), grant numbers IRN5703PHDW01, The Thailand Research Fund (TRF).

Institutional Review Board Statement

Not applicable.

Informed Consent Statement

Not applicable.

Data Availability Statement

The data presented in this study are available on request from the corresponding author.

Conflicts of Interest

The authors declare no conflict of interest.

Nomenclature

AwWater activity
b 0 Empirical constant
b 1 Empirical constant
b 2 Empirical constant
b 3 Empirical constant
c A constant related to water binding energy to the primary binding sites
c 1 A dimensionless measure of the strength of water binding to the primary binding sites
d a v Average pore size (nm)
d x / d t Sorption rate
K A constant related to the adsorption energies of multilayer adsorption sites
k Rate coefficient (s−1)
m Moisture content (%)
m 0 The monolayer moisture content (%)
m a The mass flow rate of process air (kg s−1)
Q d e Dehumidification capacity (kg h−1)
R M S E Root mean square error
R 2 The coefficient of determination
S B E T BET surface area (m2 g−1)
S B E T * BET surface area related to the mass of porous host matrix (silica gel) (m2 g−1)
t d e Dehumidification time (s)
V t Total pore volume (cm3 g−1)
V t * Total pore volume related to the mass of porous host matrix (silica gel) (cm3 g−1)
w a i Inlet humidity ratios of the process air (g g−1)
w a o Outlet humidity ratios of the process air (g g−1)
w t . % Mass concentration of impregnating salts (LiCl) (%)
x The equilibrium water sorption quantity (g g−1)
x t Dynamic water sorption quantity (g g−1)

Abbreviation

DCAS Desiccant-coated aluminum sheets
DCHS Desiccant-coated heat sink
SGCAS Silica-gel-coated aluminum sheets
SG-L0 Silica gel
SG-L30 Silica gel–LiCl composite prepared in 30 wt.% of LiCl aqueous solution
SG-L35 Silica gel–LiCl composite prepared in 35 wt.% of LiCl aqueous solution
SG-L40 Silica gel–LiCl composite prepared in 40 wt.% of LiCl aqueous solution
SG-L45 Silica gel–LiCl composite prepared in 45 wt.% of LiCl aqueous solution

References

  1. Tashiro, Y.; Kubo, M.; Katsumi, Y.; Meguro, T.; Komeya, K. Assessment of adsorption desorption characteristics of adsorbents for adsorptive desiccant cooling system. J. Mater. Sci. 2004, 39, 1315–1319. [Google Scholar] [CrossRef]
  2. Yu, N.; Wang, R.Z.; Lu, Z.S.; Wang, L.W. Sorption thermal storage for solar energy. Prog. Energy Combust. Sci. 2013, 39, 489–514. [Google Scholar] [CrossRef]
  3. Jia, C.X.; Dai, Y.J.; Wu, J.Y.; Wang, R.Z. Use of compound desiccant to develop high performance desiccant cooling system. Int. J. Refrig. 2007, 30, 345–353. [Google Scholar] [CrossRef]
  4. Aristov, Y.I.; Restuccia, G.; Cacciola, G.; Parmon, V. A family of new working materials for solid sorption air conditioning systems. Appl. Therm. Eng. 2002, 22, 191–204. [Google Scholar] [CrossRef]
  5. Cortés, F.B.; Chejne, F.; Carrasco-Marín, F.; Pérez-Cadenas, A.F.; Moreno-Castilla, C. Water sorption on silica-and zeolite-supported hygroscopic salts for cooling system applications. Energy Convers. Manag. 2012, 53, 219–223. [Google Scholar] [CrossRef]
  6. Li, X.; Li, H.; Huo, S.; Li, Z. Dynamics and isotherms of water vapor sorption on Mesoporous silica gels modified by different salts. Kinet. Catal. 2010, 51, 754–761. [Google Scholar] [CrossRef]
  7. Simonova, I.A.; Freni, A.; Restuccia, G.; Aristov, Y.I. Water sorption on composite “silica modified by calcium nitrate”. Microporous Mesoporous Mater. 2009, 122, 223–228. [Google Scholar] [CrossRef]
  8. Aristov, Y.I.; Sapienza, A.; Ovoshchnikov, D.; Freni, A.; Restuccia, G. Reallocation of adsorption and desorption times for optimization of cooling cycles. Int. J. Refrig. 2012, 35, 525–531. [Google Scholar] [CrossRef]
  9. Ge, T.S.; Li, Y.; Wang, R.Z.; Dai, Y.J. Experimental study on a two-stage rotary desiccant cooling system. Int. J. Refrig. 2009, 32, 498–508. [Google Scholar] [CrossRef]
  10. Jeong, J.; Yamaguchi, S.; Saito, K.; Kawai, S. Performance analysis of desiccant dehumidification systems driven by low-grade heat source. Int. J. Refrig. 2011, 34, 928–945. [Google Scholar] [CrossRef]
  11. Hu, L.M.; Ge, T.S.; Jiang, Y.; Wang, R.Z. Performance study on composite desiccant material coated fin-tube heat exchangers. Int. J. Heat Mass Transfer. 2015, 90, 109–120. [Google Scholar] [CrossRef]
  12. Chua, K.J. Heat and mass transfer of composite desiccants for energy efficient air dehumidification: Modelling and experiment. Appl. Therm. Eng. 2015, 89, 703–716. [Google Scholar] [CrossRef]
  13. Hu, L.M.; Ge, T.S.; Jiang, Y.; Wang, Z. Hygroscopic Property of Metal Matrix Composite Desiccant (in Chinese). J. Refrigeration. 2014, 35, 69–75. [Google Scholar]
  14. Zheng, X.; Ge, T.S.; Jiang, Y.; Wang, R.Z. Experimental study on silica gel-LiCl composite desiccants for desiccant coated heat exchanger. Int. J. Refrig. 2015, 51, 24–32. [Google Scholar] [CrossRef]
  15. Mandegari, M.A.; Pahlavanzadeh, H. Introduction of a new definition for effectiveness of desiccant wheels. Energy 2009, 34, 797–803. [Google Scholar] [CrossRef]
  16. Stabat, P.; Marchio, D. Heat-and-mass transfers modelled for rotary desiccant dehumidifiers. Appl. Energy 2008, 85, 128–142. [Google Scholar] [CrossRef]
  17. Brunauer, S.; Emmett, P.H.; Teller, E. Adsorption of Gases in Multimolecular Layers. J. Am. Chem. Soc. 1938, 60, 309–319. [Google Scholar] [CrossRef]
  18. Timmermann, E.O. Multilayer sorption parameters: BET or GAB values? Colloids Surf. A 2003, 220, 235–260. [Google Scholar] [CrossRef] [Green Version]
  19. Carter, B.P.; Galloway, M.T.; Campbell, G.S.; Carter, A.H. The critical water activity from dynamic dewpoint isotherms as an indicator of crispness in low moisture cookies. J. Food. Meas. Charact. 2015, 9, 463–470. [Google Scholar] [CrossRef]
  20. Arthur, E.; Tuller, M.; Moldrup, P.; de Jonge, L.W. Evaluation of theoretical and empirical water vapor sorption isotherm models for soils. Water Resour. Res. 2016, 52, 190–205. [Google Scholar] [CrossRef]
  21. Zhang, Y.N.; Wang, R.Z.; Li, T.X. Thermochemical characterizations of high-stable activated alumina/LiCl composites with multistage sorption process for thermal storage. Energy 2018, 156, 240–249. [Google Scholar] [CrossRef]
  22. Gordeeva, L.G.; Glaznev, I.S.; Savchenko, E.V.; Malakhov, V.V.; Aristov, Y.I. Impact of phase composition on water adsorption on inorganic hybrids “salt/silica”. J. Colloid Interface Sci. 2006, 301, 685–691. [Google Scholar] [CrossRef]
  23. Gong, L.X.; Wang, R.Z.; Xia, Z.Z.; Chen, C.J. Adsorption equilibrium of water on a composite adsorbent employing lithium chloride in silica gel. J. Chem. Eng. Data 2010, 55, 2920–2923. [Google Scholar] [CrossRef]
  24. Zheng, X.; Ge, T.S.; Wang, R.Z.; Hu, L.M. Performance study of composite silica gels with different pore sizes and different impregnating hygroscopic salts. Chem. Eng. Sci. 2014, 120, 1–9. [Google Scholar] [CrossRef]
  25. Yu, N.; Wang, R.Z.; Lu, Z.S.; Wang, L.W. Development and characterization of silica gel-LiCl composite sorbents for thermal energy storage. Chem. Eng. Sci. 2014, 111, 73–84. [Google Scholar] [CrossRef]
  26. Frazzica, A.; Brancato, V.; Caprì, A.; Cannilla, C.; Gordeeva, L.G.; Aristov, Y.I. Development of “salt in porous matrix” composites based on LiCl for sorption thermal energy storage. Energy 2020, 208, 118338. [Google Scholar] [CrossRef]
  27. Rouquerol, J.; Avnir, D.; Fairbridge, C.; Everett, D.; Haynes, J.; Pernicone, N.; Ramsay, J.D.F.; Sing, K.S.W.; Unger, K.K. Recommendations for the characterization of porous solids (Technical report). Pure Appl. Chem. 1994, 66, 1739–1758. [Google Scholar] [CrossRef]
  28. Kruk, M.; Jaroniec, M. Gas adsorption characterization of ordered organic-inorganic nanocomposite materials. Chem. Mater. 2001, 13, 3169–3183. [Google Scholar] [CrossRef]
  29. Huo, Q.; Margolese, D.I.; Stucky, G.D. Surfactant Control of Phases in the Synthesis of Mesoporous Silica-Based Materials. Chem. Mater. 1996, 8, 1147–1160. [Google Scholar] [CrossRef]
  30. Kruk, M.; Jaroniec, M.; Sayari, A. Application of large pore MCM-41 molecular sieves to improve pore size analysis using nitrogen adsorption measurements. Langmuir 1997, 13, 6267–6273. [Google Scholar] [CrossRef]
  31. Zheng, X.; Wang, R.Z. Microstructure and sorption performance of consolidated composites impregnated with LiCl. Int. J. Refrig. 2019, 98, 452–458. [Google Scholar] [CrossRef]
  32. Glueckauf, E. Theory of chromatography. Part 10.-Formulæ for diffusion into spheres and their application to chromatography. Trans. Faraday Soc. 1955, 51, 1540–1551. [Google Scholar] [CrossRef]
  33. Oulkadi, D.; Desobry, S.; Mustin, C.; Desobry-Banon, S. Water sorption in hybrid silica gels containing colloidal nontronite. J Solgel. Sci. Technol. 2012, 64, 653–660. [Google Scholar] [CrossRef]
Figure 1. Thermal conductivity of the DCAS.
Energies 15 01778 g001
Figure 2. Nitrogen sorption isotherms of silica gel and DCAS.
Energies 15 01778 g002
Figure 3. Pore size distributions of silica gel and DCAS.
Energies 15 01778 g003
Figure 4. The scanning electron microscopy (SEM) image of (a) silica gel, (b) SG-L0, (c) SG-L30, (d) SG-L35, (e) SG-L40, and (f) SG-L45.
Energies 15 01778 g004
Figure 5. Water adsorption kinetics curves of DCAS.
Energies 15 01778 g005
Figure 6. Sorption rate coefficients of DCAS.
Energies 15 01778 g006
Figure 7. Moisture sorption isotherms of DCAS.
Energies 15 01778 g007
Figure 8. Schematic of (a) thermoelectric dehumidifiers (TED) and (b) the air-to-air TED system.
Energies 15 01778 g008
Figure 9. Hot- and cold-side temperatures of thermoelectric module versus electrical voltage (hot-side air flow rate: 0.034 m3 s−1, cold-side air flow rate: 0.017 m3 s−1).
Energies 15 01778 g009
Figure 10. The outlet air (a) humidity ratio and (b) temperature under different electrical voltages to thermoelectric module (hot-side air flow rate: 0.034 m3 s−1, cold-side air flow rate: 0.017 m3 s−1).
Energies 15 01778 g010
Figure 11. Dehumidification capacities of DCAS under different electrical voltages to thermoelectric module.
Energies 15 01778 g011
Table 1. Material specifications for preparing the DCAS.
NameDescriptionManufacturer
Aluminum sheet60 mm × 40 mm × 1 mm
k = 230 Wm−1 K−1
AIC Aluminum Profile Service Center (Bangkok, Thailand)
Silica gelMesoporous, the grain size of 70 to 230 mesh
SBET = 500 m2 g−1; Vt = 0.75 cm3 g−1;
dav = 6 nm
k = 0.1 Wm−1 K−1
Merck PTE Ltd. (Singapore)
Silica sol30 wt.% suspension in H2O,
pH = 9.1 SBET = 230 m2 g−1;
Vt = 0.21 cm3g−1; dav = 4.3 nm
Merck PTE Ltd. (Singapore)
Liquid gluePolyurethane base (BT550)
k = 0.26 Wm−1 K−1
Bond Chemicals Co., Ltd.
Anhydrous LiClACS reagent, assay ≥99%Merck PTE Ltd. (Singapore) (Bangkok, Thailand)
Table 2. Experimental parameters of the DCAS.
CompositionImpregnating Concentration of LiCl (wt.%)Mass of Desiccants (g)Total Mass (g)Salt Content (wt.%)Coating Amount (kg m−2)
SG-L001.057.450.000.44
SG-L30301.187.5812.380.49
SG-L35351.207.6014.290.50
SG-L40401.237.6317.140.51
SG-L45451.277.6720.950.53
Table 3. Vapor sorption analyzer (VSA) specifications.
Physical ParameterRange or Deviation
Water   activity ,   A w 0.03 0.95   A w
Water   activity ,   A w accuracy ± 0.005   A w   ( for   volatiles   setting   ± 0.02   A w )
Sample temperature control range (°C)15–60 at STP
Operating environment (°C)4–50
Sample weight (mg)500–5000
Mass resolution (mg)±0.5
Vapor sorption analyzer (operator’s manual).
Table 4. Texture characteristics of the composite DCAS.
CompositionImpregnating Concentration of LiCl
(wt.%)
Salt Content (wt.%)SBET
(m² g−1)
SBET *
(m² g−1)
vt
(cm³ g−1)
vt *
(cm³ g−1)
dav
(nm)
SG-L000.00208.10-0.31-3.71
SG-L303012.38128.55154.310.210.253.74
SG-L353514.29117.33147.070.180.223.86
SG-L404017.1489.59125.260.140.193.69
SG-L454520.9559.49103.090.100.163.68
* Salt content in DCAS was considered.
Table 5. Estimated parameters of models for the moisture sorption isotherms of DCAS.
ModelPara.SG-L0SG-L40
AdsorptionDesorptionAdsorptionDesorption
BETc3.3318716.14232.622828.41901
m00.354260.403580.434880.49152
R20.914650.700740.926480.75911
RMSE0.25700.470980.264710.56232
GABc11.609351.139431.460690.9858
K0.944320.708140.961120.7583
m00.508331.610230.567781.78218
R20.95160.933440.952630.93973
RMSE0.193540.222130.212480.28126
DLPb00.366290.788210.401071.15945
b1−2.49502−7.17614−1.05856−10.01023
b25.2414021.08981−0.4908626.20371
b3−2.49502−12.180926.04448−13.72783
R20.991980.989900.992550.98878
RMSE0.078780.086510.084280.12138
Table 6. Best fit equations for DCAS experimental moisture sorption data.
CompositionSorption DirectionDLP Fitting Equations
SG-L0Adsorption m = 0.44693 x 3 + 5.2414 x 2 2.49502 x + 0.36629
Desorption m = 12.18092 x 3 + 21.08981 x 2 7.17614 x + 0.78821
SG-L40Adsorption m = 6.04448 x 3 0.49086 x 2 1.05856 x + 0.40107
Desorption m = 13.72783 x 3 + 26.20371 x 2 10.01023 x + 1.15945
m is the moisture content (%), and x is the water activity ( A W ).
Publisher’s Note: MDPI stays neutral with regard to jurisdictional claims in published maps and institutional affiliations.

