Article

Catalytic Removal of NOx on Ceramic Foam-Supported ZnO and TiO2 Nanorods Ornamented with W and V Oxides

1
Faculty of Science and Technology, Institute of Chemistry, University of Silesia, Szkolna 9, 40-006 Katowice, Poland
2
Faculty of Science and Technology, Institute of Materials Engineering, University of Silesia, 75 Pułku Piechoty 1A, 41-500 Chorzów, Poland
3
Department of Physics, University of Hradec Králové, Rokitanského 62, 500-03 Hradec Králové, Czech Republic
4
Faculty of Science and Technology, August Chełkowski Institute of Physics, University of Silesia, 75 Pułku Piechoty 1A, 41-500 Chorzów, Poland
5
Institute of Physics, Polish Academy of Sciences, Al. Lotników 32/46, 02668 Warsaw, Poland
*
Author to whom correspondence should be addressed.
Energies 2022, 15(5), 1798; https://doi.org/10.3390/en15051798
Submission received: 11 February 2022 / Revised: 25 February 2022 / Accepted: 26 February 2022 / Published: 28 February 2022
(This article belongs to the Special Issue Towards Greenhouse Gas Mitigation: Novelty in Heterogeneous Catalysis)

Abstract

:
Energy consumption steadily increases and energy production is associated with many environmental risks, e.g., generating the largest share of greenhouse gas emissions. The primary gas pollution concern is CO2, CH4, and nitrogen oxides (NOx). Environmental catalysis plays a pivotal role in NOx mitigation (DeNOx). This study investigated, for the first time, a collection of ceramic foams as potential catalyst support for selective catalytic NOx reduction (SCR). Ceramic foams could be an attractive support option for NOx removal. However, we should functionalize the surface of raw foams for such applications. A library of ceramic SiC, Al2O3, and ZrO2 foams ornamented with nanorod ZnO and TiO2 as W and V oxide support was obtained for the first time. We characterized the surface layer coating structure using the XPS, XRF and SEM, and TEM microscopy to optimize the W to V molar ratio and examine NO2 mitigation as the SCR model, which was tested only very rarely. Comparing TiO2 and ZnO systems reveals that the SCR conversion on ZnO appeared superior vs. the conversion on TiO2, while the SiC-supported catalysts were less efficient than Al2O3 and ZrO2-supported catalysts. The energy bands in optical spectra correlate with the observed activity rank.

1. Introduction

Energy demand growth is a fundamental problem of civilization in the Anthropocene. The production of energy is, however, associated with many environmental risks. Mainly, NOx formation is a consequence of energy production. One of the targets of environmental catalysis is the mitigation of NOx from the air. The design and development of porous functional materials is an essential environmental catalysis domain [1]. In particular, porous ceramics are essential catalyst supports in this area [2]. Ceramic foams are monolithic three-dimensional structures with an 80–90% void spaces fraction. However, these materials were developed initially to filter out molten metal impurities [3], which means that their surface area is generally too low for catalytic applications. Therefore, ceramic foams are modified to increase their surface area [4]. A variety of novel catalytic applications of ceramic foams involve, for example, the catalytic pyrolysis of waste oils to renewable fuels [5], the water gas shift reaction [6], and the solar photocatalytic ozonation in water treatment using supported TiO2 [7] methane steam reforming [8]. The advantages of the innovatively structured foam catalysts involve fluid dynamics and heat transfer phenomena, which can positively influence catalyst performance.
This study investigated a collection of ceramic foams as potential catalysts for selective catalytic NOx reduction (SCR) reactions. Despite potential advantages, the literature rarely describes the application of ceramic foams in SCR catalysis [9,10,11]. The availability of the commercial honeycomb or plate SCR catalysts may be one reason for this fact. NOx generation, pollution, and reduction are complex problems. First, combustion in air yields two forms of NOx, namely NO and NO2, in the ratio NO/NOx of 0.90 to 0.95 [12]. However, the dominating NOx form in the atmosphere is NO2 resulting from NO oxidation. Accordingly, the main issue in the environmental catalysis of NOx refers to NO, while the main topics of NOx ecotoxicology refer to NO2. The current technology routinely uses Selective Catalytic Reduction (SCR) for NOx removal from flue gases [12,13]. SCR is the reaction between the NOx in exhaust gases and the reducing agent (NH3 as ammonia water or urea solution) at the so-called deNOx catalyst at temperatures below 400 °C to produce N2 and water vapor. The reaction formulas for NO and NOx are as follows [12,14]:
4NO + 4NH3 + O2 → 4N2 + 6H2O
4NH3 + 6NO → 5N2 + 6H2O
2NO2 + 4NH3 + O2 → 3N2 + 6H2O
8NH3 + 6NO2 → 7N2 + 6H2O
Accordingly, SCR needs twice as much NH3 for NO than for NO2 reduction.
The design of the supporting material of the SCR catalysts (TiO2, ZrO2, Al2O3, and ZnO) and the synthesis method of the system affect a final catalyst structure not only in the direct titania phase character, e.g., surface area and porosity structure, but also indirectly by deciding the structure of the W and V surface deposits, which form the acid catalytic centers controlling the mechanisms of the SCR reaction with NH3 [14]. Specifically, NOx needs to be removed from the flue gases, particularly in electric power stations where generally TiO2-SCR catalysts are used. Regenerating the spent TiO2-SCR catalysts is a significant problem that needs further improvement despite many available options [15,16]. Currently, industrial TiO2-based SCR systems suffer from surface deposits. Moreover, the exploitation deteriorates surface texture. As SCR catalysts are expensive, they need to be regenerated. The management of deactivated SCR catalysts should minimize the adverse environmental effects of these materials. On the other hand, it could also be a valuable resource of rare chemical elements such as vanadium and tungsten [17].
In particular, we focused this study on nitrogen dioxide (NO2) mitigation. NO2 is the most toxic NOx form in the atmosphere. Both indoor and outdoor NO2 pollution exposure to humans was extensively studied [18]. At the same time, there are only several publications reporting the catalytic decomposition of NO2, even though a complex NO/NO2 SCR should support a standard NO SCR [19,20]. Recently, catalytic decomposition of NO2 over a copper-decorated metal-organic framework by non-thermal plasma was studied [21].
The industrial SCR installations are TiO2 layers with surface-engineered coatings by metal oxides. Zinc oxide is a low-cost TiO2 potential alternative for catalytic SCR applications in environmental catalysis. However, the reported applications in this area, particularly NOx removal, are rare. The low ZnO stability is a reason why titania is much more popular. For example, the surface of polar ZnO nanoparticles undergoes significant change during storage at room temperature in the presence of moisture, oxygen, or light. During two-month storage, the specific surface area of the ZnO decreases from 115 to 35 m2 g by room temperature sintering of polar ZnO nanosheets [22]. Recent efforts involve the potential enhancement of ZnO stability by structural modifications, such as doping [23] and core-shell nanoparticle formation [24], e.g., using hybrid ZnO-TiO2 systems [25]. Surface deposits, e.g., Cu2O/MoS2/ZnO composites on Cu mesh, can upgrade the ZnO system, reducing N2 to NH3 (with water as the proton source) in the liquid membrane reactor under simulated visible light [26]. The room temperature sintering of polar ZnO nanosheets was prevented by forming the surface layer of silica (2 atom %) [27]. The engineering of ZnO-structured surfaces is an issue of general interest. In particular, nanostructures (nanowires, nanotubes, nanobelts, nanorings, flower-like morphologies, multipods, tetrapods, and sponge-like structures) were broadly investigated [28]. Chemical and Physical Vapor Deposition (CVD and PVD) sputtering, as well as evaporation approaches and epitaxial growth, are the methods for forming the continuous functional thin layers on ZnO. Wet chemical and template-assisted methods are alternatives [28].
For the first time, here, we investigated the influence of the ornamentation of Al2O3, SiC, and ZrO2 ceramic foams by nanorod ZnO and TiO2 coatings as W and V support on DeNOx catalysis, in particular on the NO2 SCR process (gas flow rate of 3 dm3/h and temperature of 400 °C at atmospheric pressure). In particular, we compared the broad library of the VOx or WOx supported on the SiC, Al2O3, ZnO, CeO2, MgO, SiO2, TiO2, and ZrO2 in the DeNOx within the temperature range of 200–400 °C. Physical and chemical analyses of the functionalized foam surface confronted with the catalyst performance indicate that these materials can be a new efficient SCR reaction platform.

2. Materials and Methods

2.1. Materials

Commercially available chemical reagents were used in the study: Tungsten powder <12 µm, 99.9% trace metal basis (Sigma-Aldrich, St. Louis, MO, USA); Vanadium powder 100 mesh, 99.9% trace metal basis (Sigma-Aldrich); and 30% hydrogen peroxide (Avantor Performance Materials., Gliwice, Poland). All chemicals were used without further purification.

2.2. Preparation of TiO2 or ZnO Nanofilaments at Ceramic Foams

ZnO nanorods were prepared according to the following procedure. First, we used the ALD method to deposit the zinc oxide nanoseeds on Al2O3, SiC, and ZrO2 substrates. We performed 12 ALD cycles using diethylzinc (DEZ; Sigma-Aldrich) as a zinc precursor and deionized water as an oxygen precursor at the temperature of 100 °C in the ALD Savannah 100 reactor from Cambridge NanoTech, Waltham, MA, USA (now called the Vecco Savanah® Series). The hydrothermal process of zinc oxide nanorods’ growth consists of two steps, as described previously [29]. First, the reaction mixture with a Zn concentration of 1 mM was prepared. Zinc acetate dihydrate (Roth, 99% pure) was dissolved in 60 mL of deionized water. Afterward, the pH of the solution was adjusted to 7.5 using a 1 M aqueous solution of sodium hydroxide (Sigma-Aldrich). The prepared mixture was heated using an induction heater at 95 °C with nucleated substrates inside and kept at this temperature for approximately 2 min. Then, the samples were removed from the reactor, rinsed with isopropanol, and dried in air.
Part of the received substrates with ZnO nanorods were used as a scaffold for the growth of the nanostructured TiO2 surface. These substrates covered by ZnO nanorods were placed in the ALD reactor at 100 °C. The 90 ALD cycles deposited approximately 50 nm thick layers of TiO2. We used tetrakis (dimethylamino) titanium (IV; TDMAT) from STREM Chemicals as a titanium precursor and deionized water as the oxygen precursor. After TiO2 deposition, nanorods were etched using 1% HCl acid for 1 min, rinsed in water, and dried.

2.3. General Preparation of W and V Nanoparticles at Ceramic Foams and Other Carriers

To a weight of tungsten and/or vanadium powders (Table S1), 2 mL of 30% hydrogen peroxide solution was added and mixed for 3 h until the metal wholly dissolved. Ceramic foams described in paragraph 2.2 were powdered in mortar and sieved, and 990 mg of the selected material (Al2O3, ZrO2, or SiC carrier with TiO2 or ZnO2 nanofilaments) was suspended in a solution containing tungsten and/or vanadium. The mixture was stirred until the solvent evaporated, yielding a powder catalyst. The catalysts containing tungsten and vanadium oxides deposited on powders ZnO, CeO2, MgO, SiO2, or TiO2 (Sigma-Aldrich) were prepared using the same method (Table S2).

2.4. Methods of Catalyst Characterization

XPS measurements were completed using the PHI 5700 photoelectron spectrometer (Physical Electronics Inc., Chanhassen, MN, USA). Photoelectrons were excited by a monochromatic X-ray beam (Al Kα of energy of 1486.6 eV) from the sample surface. The resulting photoelectron spectra obtained for each element constituting the sample were analyzed using PHI MultiPak (v.9.6.0.15, ULVAC-PHI, Chigasaki, Japan) software. The obtained high-resolution spectra were calibrated using the C1s peak (284.8 eV), the occurrence of which is related to the presence of adsorbed carbon on the sample surface. Analyzed core levels were fitted using a combination Gauss–Lorentz shape of the photoemission line and Shirley background.
We used an energy-dispersive X-ray fluorescence (EDXRF) spectrometer—Epsilon 3 (Panalytical, Almelo, The Netherlands) to perform chemical analysis. The spectrometer was equipped with a thermoelectrically cooled silicon drift detector (SDD) and Rh target X-ray tube. It was operated at a maximum voltage of 30 keV and maximum power of 9 W. We applied the Omnian software with the fundamental parameter method for quantitative analysis. Measurement conditions were as follows: counting time 5 kV, 300 s, and helium atmosphere for Si and Al determination; counting time 12 kV, 300 s, air atmosphere, and 50 μm Al primary beam filter for V; 20 kV, counting time 120 s, air atmosphere, and 200 μm Al primary beam filter for Fe; and 30 kV, counting time 120 s, air atmosphere, and 100 μm Ag primary beam filter for W, Zn, Zr, Y, and Hf. We fixed the current of the X-ray tube not to exceed the dead-time loss of ca. 50%.
We used Hitachi SU-70 equipment (15 kV of accelerating voltage using a secondary electron detector) for Scanning Electron Microscopy (SEM) and the transmission electron microscopy (TEM) was performed in the JEOL high-resolution (HRTEM) JEM 3010 microscope operating at a 300 kV accelerating voltage with a Gatan 2k × 2k OriusTM 833SC200D CCD camera and an EDS detector from IXRF Systems. The samples were suspended in isopropanol and deposited on a Cu grid with an amorphous carbon film standardized for TEM observations. Selected Area Electron Diffraction (SEAD) patterns were indexed using dedicated ElDyf software (Institute of Material Science, University of Silesia., Katowice, Poland).
The X-ray powder diffraction (XRD) measurements were carried out using a Malvern Panalytical Empyrean diffractometer. Cu anodes operated at a wavelength of 1.54056 Å, at an electric current of 30 mA and voltage of 40 kV, and equipped with a PIXcell3D solid-state hybrid pixel detector. The XRD was registered in the angular range of 2θ = 15–145° with 0.02° steps. The phase analysis involved reference standards from the International Centre for Diffraction Data (ICDD) PDF-4 database. Rietveld refinement was performed using FullProf computer software (available at www.ill.eu/sites/fullprof/ (accessed on 10 February 2022)).

2.5. NOx Decomposition in a Flow Reactor

We used a fixed-bed quartz flow reactor using a 200 mg sample of the catalysts at 200–400 °C under atmospheric pressure to test the SCR catalysis performance. We crushed the catalyst to a fine powder before SCR tests. The feed gas was composed as follows I: 0.2% NO2 + 5% O2 + 94.8% He and inlet II: 0.2% NH3 + 5% O2 + 94.8% He (volume ratio 3:4). The tests were performed at the flow rate of 3 dm3/h. We used the GC-FID method to monitor the gas composition. The NOx conversion amounted to:
NOx conversion = [(NOx inlet − NOx outlet)/NOx inlet] × 100%

3. Results and Discussion

3.1. The Catalysts Design, Preparation, and Structure

The exemplary EDXRF spectra of the selected catalysts collected using the Rh X-ray tube operating at 30 and 5 kV are given in Figure 1. Spectra of ZnO/Al2O3 show peaks at 6.40, 7.06, 8.64, 9.57, 15.77, 20.21, 22.72, 2.70, 1.49, and 1.74 keV, corresponding to Fe Kα, Fe Kβ, Zn Kα, Zn Kβ, Zr Kα, Rh Kα, Rh Kβ, Rh Lα (X-ray tube), Al Kα, and Si Kα, respectively. Spectra of ZnO/ZrO2 show peaks at 2.04, 8.64, 9.57, 14.96, 15.77, and 17.67 keV, corresponding to Zr Kα, Zn Kα, Zn Kβ, Y Kα, Zr Kα, and Zr Kβ, respectively. The spectra also reveal the presence of Hf as common impurities of zirconium compounds (Lα, Lβ, and Lγ lines at 7.90, 9.02, and 10.52 keV, respectively). The EDXRF spectra of the 1.0% W,V/ZnO/Al2O3 and 1.0% W,V/ZnO/ZrO2 systems reveal the presence of tungsten (Lα, Lβ, and Lγ lines at 8.40, 9.67, and 11.29 keV, respectively) and vanadium (Kα and Kβ lines at 4.95 and 5.43 keV, respectively). Table S3 presents the results of the quantitative EDXRF analysis of ZnO/Al2O3, 1.0% W/ZnO/Al2O3, 1.0% W,V/ZnO/Al2O3, ZnO/ZrO2, 1.0% W/ZnO/ZrO2, and 1.0% W,V/ZnO/ZrO2.
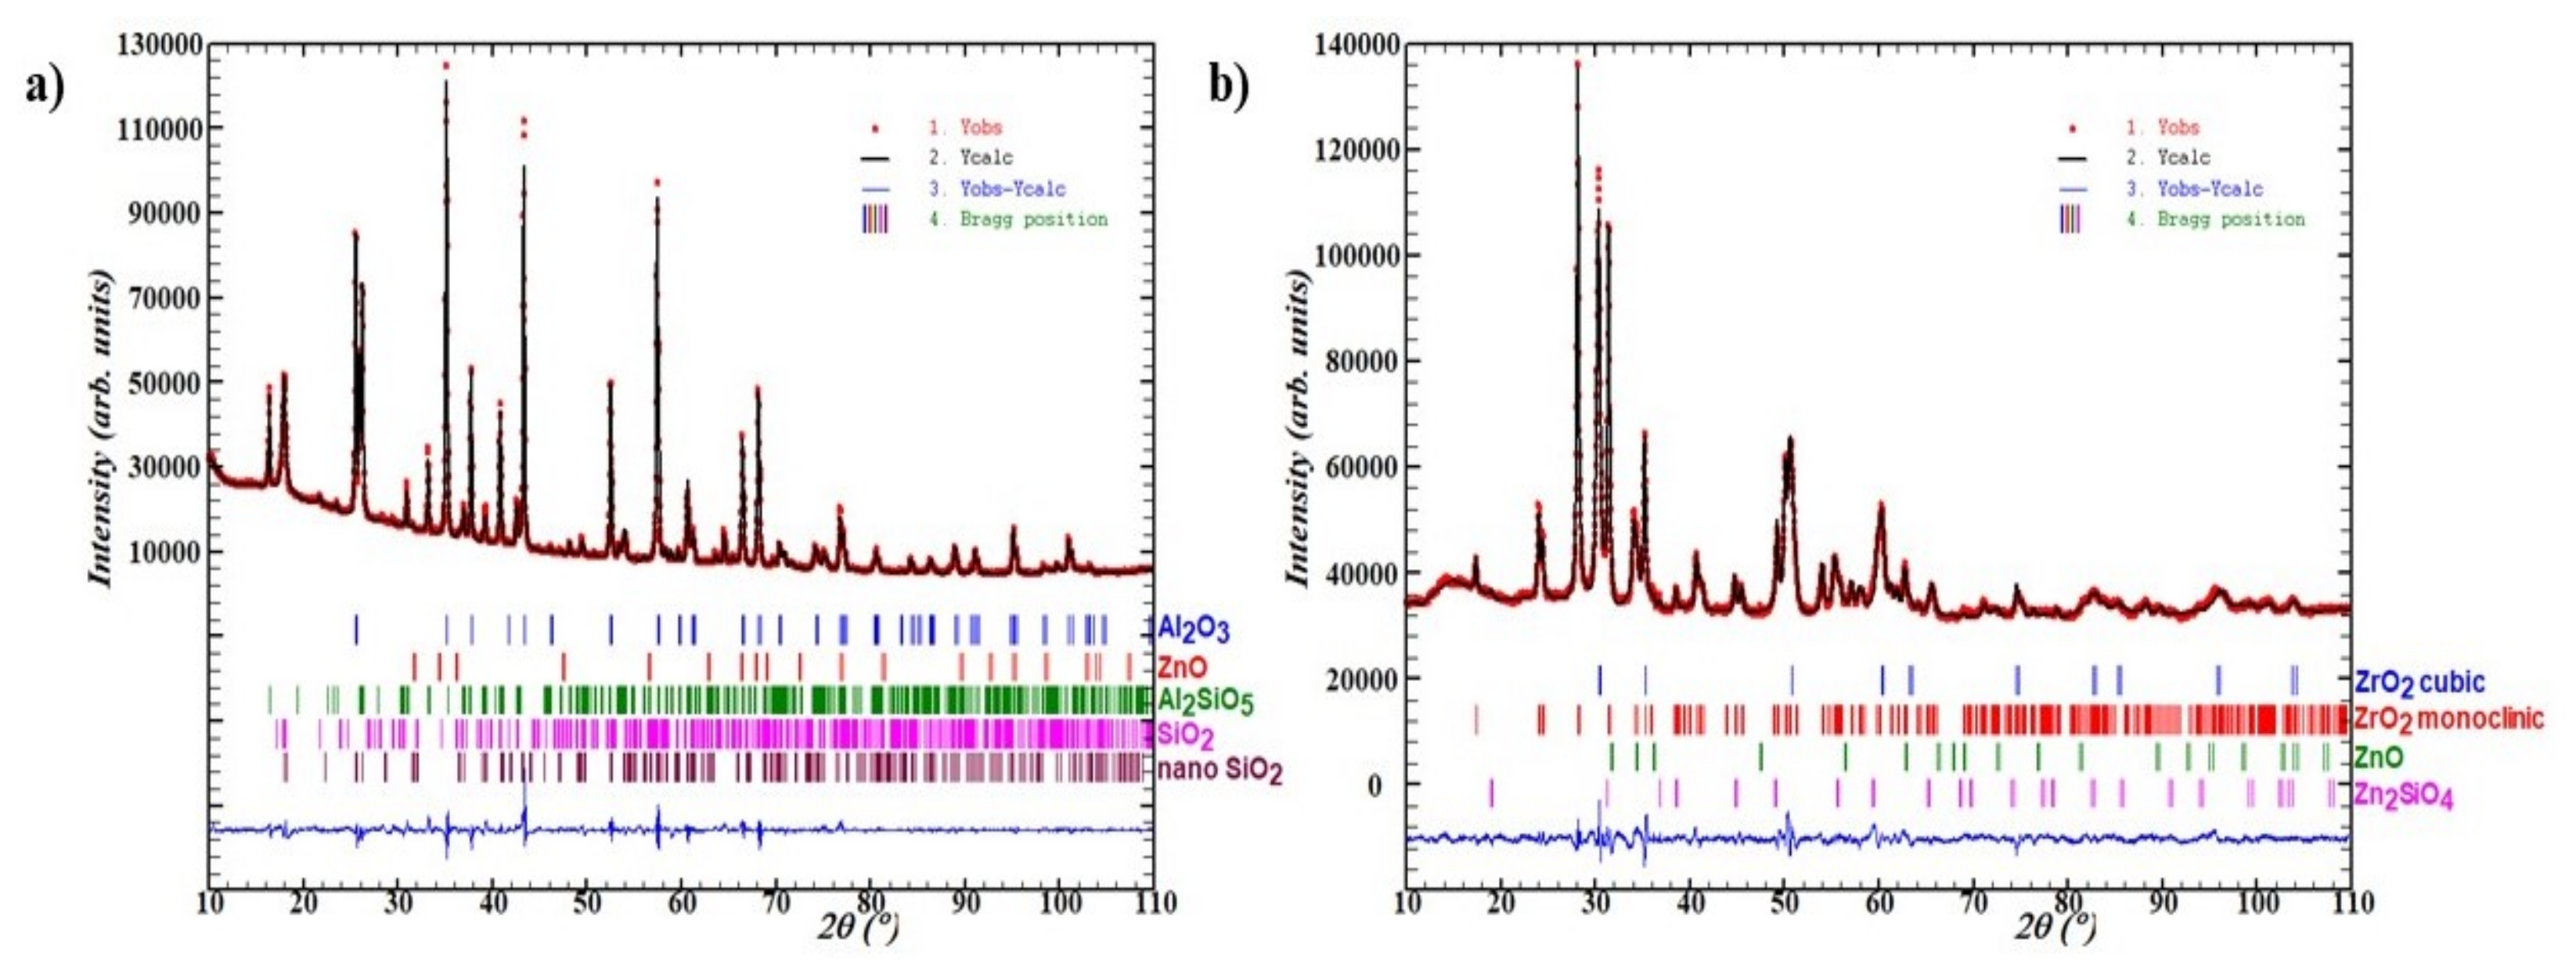
We performed X-ray powder diffraction measurements to examine the phase composition of the material samples. Compared with reference standards from the ICDD PDF4+ database of the Al2O3/ZnO sample, this analysis revealed four phases. The Al2O3 (PDF 04-006-9730) and Al2SiO5 (PDF 01-088-0892) phases were dominating, while we also observed the ZnO (PDF 01-078-4603) and SiO2 (PDF 04-013-9484) phases. The additional nano-size SiO2 phase (PDF 01-073-3436) was detected for the samples containing W or the combined W and V oxides. No additional phases nor impurities were observed. The performed full pattern Rietveld refinement allowed for the determination of the crystallographic parameters of the phases formed. Accordingly, the mean crystallite size based on the peak broadening was calculated. The obtained results of the Rietveld refinement are shown in Table S4. The X-ray powder diffraction measurements were also conducted for ZrO2/ZnO samples. The phase analysis revealed the presence of two ZrO2 phases. The dominant, monoclinic one (PDF 04-010-6452) was accompanied by the cubic phase (PDF 01-078-3193). Additionally, ZnO (PDF 01-078-4603) and Zn2SiO4 (PDF 01-076-8176) phases were also detected. Table S4 and Figure 2 show the results of the Rietveld refinement. We should remember that metallic oxides could not be observed with the X-ray powder diffraction method due to the X-ray diffraction detection limit. Accordingly, the XRF, XPS, and TEM techniques confirmed the presence of W and V oxides.
The TEM with an energy-dispersive X-ray detector confirmed the occurrence of metallic particles. The metallic nanoparticles occurred on the ceramic Al2O3 microparticles as indicated by the bright-field images (Figure 3). These structures were also proved with other spectroscopic measurements using XRF or XPS techniques that map the presence of metallic elements.
The XPS analysis determined the chemical states of the elements composing the samples. The main focus of the analysis was to determine the chemical states of vanadium and tungsten. We performed deconvolution of the V2p, W4f, and W4d photoemission lines. Additionally, lines O1s and C1s, and those associated with the Al2O3, ZrO2, and ZnO matrix were analyzed.
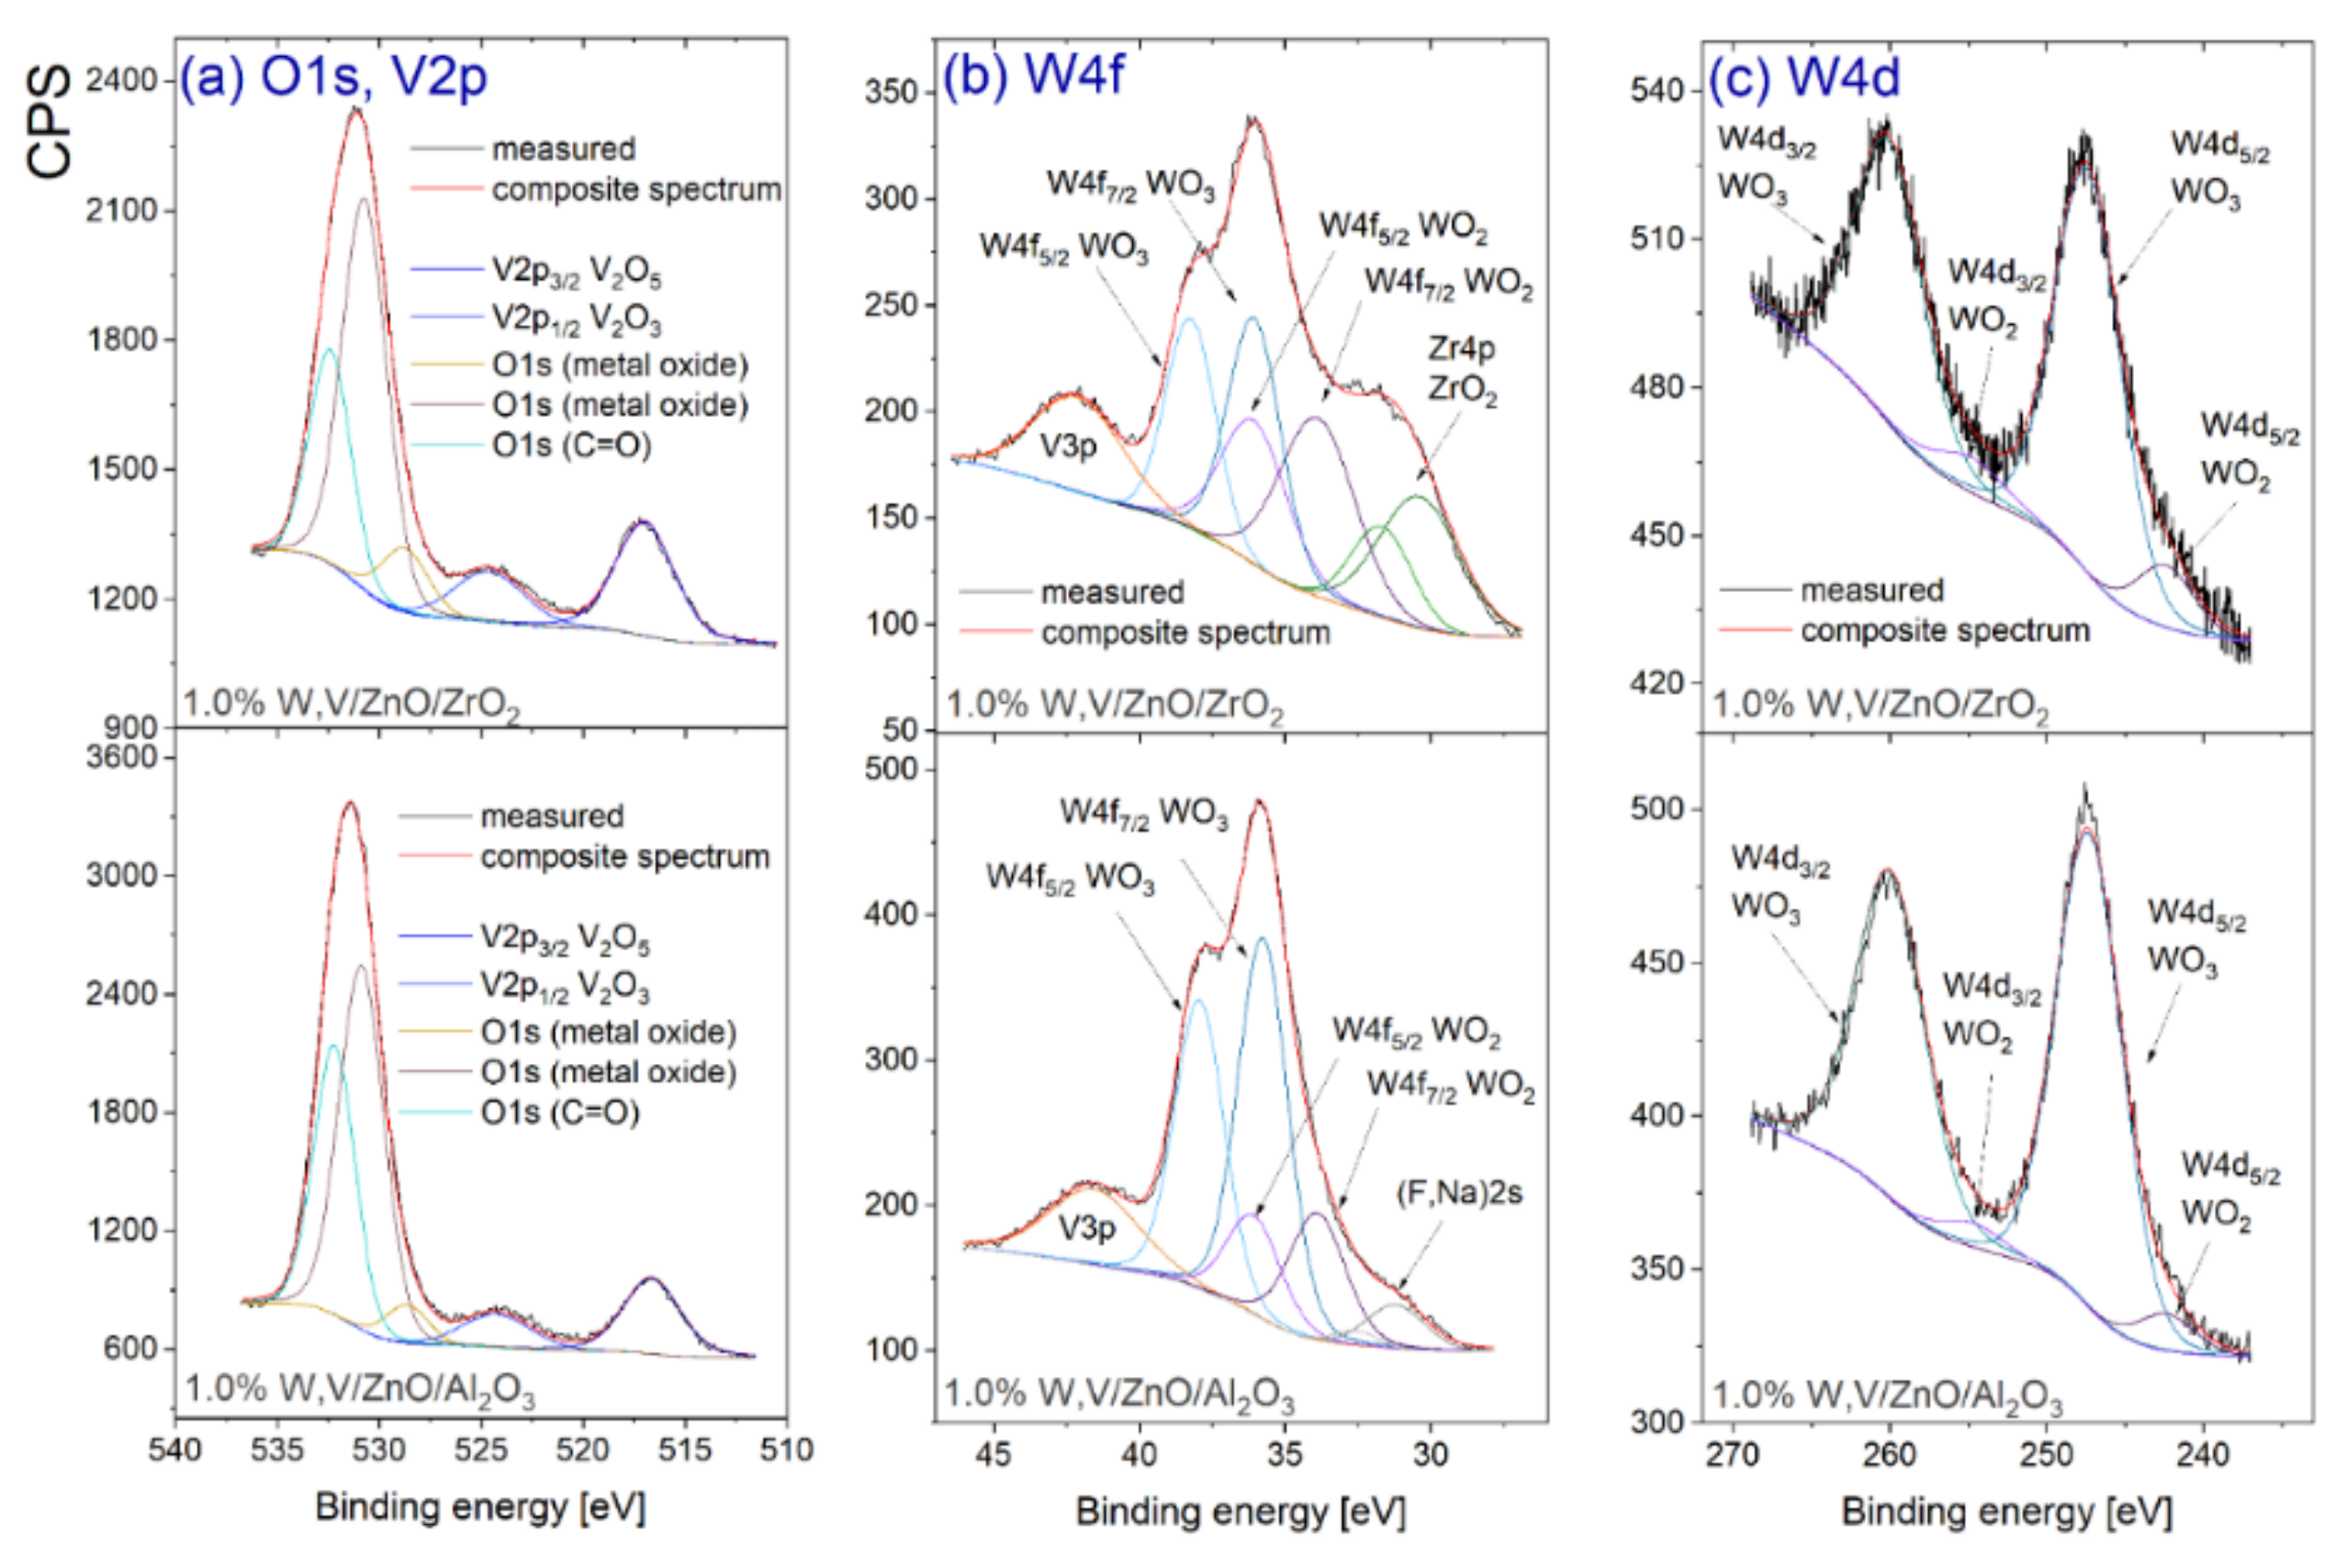
The surface XPS spectra of the V2p core level, as shown in Figure 4a, indicate vanadium oxide in the studied samples. A slight shift in the position of the V2p3/2 line was observed between examined systems; for the 1.0% W,V/ZnO/ZrO2 system, the binding energy of the V2p3/2 line is 516.96 eV, while for the 1.0% W,V/ZnO/Al2O3 system, it is 516.64 eV. The reference V2p3/2 binding energies of the V2O5, as given in the NIST database [30], range from 516.6 eV to 517.7 eV. However, literature data specify that the 516.94 eV peak can also be assigned to vanadium 4+ [31]. The vanadium line is presented in Figure 4a together with the oxygen line. The location of the deconvoluted oxygen lines was assigned to the metal oxides or C=O bond, as also seen with the carbon C1s lines (not shown here).
The chemical state analysis of tungsten was based on two lines, namely W4f and W4d (see Figure 4b,c). For the W4f line, a superposition of the core levels originating from other elements detected on the sample surface was observed. Therefore, the tungsten chemical states, as identified through the W4f line analysis, were further examined, inspecting the shape of the W4d line.
The deconvoluted peaks of the W4f XPS spectra showed two oxides for both examined systems; the binding energy of the W4f7/2 line at 33.79 eV can be assigned to WO2 [32], whereas the peak at 35.76 eV can be assigned to the WO3 [33]. Other peaks seen in the W4f line are associated with various elements detected on the sample’s surface (e.g., Na and F were visible in the overview spectra, while Zr and V are components of the studied systems), as marked in Figure 4b. The presence of WO2 and WO3 oxides was confirmed by analysis of line W4d, as illustrated in Figure 4c. Analysis of the W4d line allows us to more accurately see the differences in the ratio of each oxide’s contribution to a given system. XPS chemical analysis showed no significant differences in the spectra of the base compounds. The 1.0% W,V/ZnO/Al2O3 system and the corresponding reference sample showed the presence of the Al2O3 (Al2p line at 74.62 eV [34]). The binding energy of Zn2p3/2 can be ascribed to the Zn2+ state [35] and ZnO oxide [36]; those chemical states were observed at 1020 eV and 1022.3 eV, respectively. Similarly, for the 1.0% W,V/ZnO/ZrO2 system, the presence of zinc and zirconium oxides (ZnO assigned for Zn2p3/2 at 1022.3 eV [36], and clusters of ZrO2 for Zr3d5/2 at 182.44 eV [37]) were detected. Additionally, a relatively small amount of zirconium oxide nanocrystallites for the Zr3d5/3 at 181.2 eV [38]) was present on the sample surface. The positions of the photoemission lines were consistent with those observed for the reference sample. A detailed comparison of the XPS spectra for the 1.0% W,V/ZnO/ZrO2 vs. 1.0% W,V/ZnO/Al2O3 vs. 1.0% W,V/ZnO/SiC systems is shown in Figure 4 and Figure S1 Supplementary Materials.

3.2. Catalyst Performance in SCR Reaction

We designed a broad library of tested catalyst systems by combining SiC, Al2O3, and ZrO2 (foams) with ZnO, CeO2, MgO, and SiO2 or TiO2 (coatings) with W and V oxides’ loads. In these initial experiments, we decided to use the 1:1 W to V molar ratio due to the synergistic effect of W and V oxides in SCR catalysis [39,40]. A library of potential supports and coatings were pretested at five operating temperatures, assuming the maximum process temperature of 400 °C. Table S2 summarizes the results.
The NOx conversion was 22.5% vs. 19.7% vs. 18.1% at 250 °C for the most active systems Al2O3, MgO, and ZrO2 (Table S2, entries 2, 5, and 8). The increase in temperature to 300 °C resulted in a slight increase in the conversion to 45.3% vs. 36.4% vs. 31.8%. However, it was not but at the temperature of 350 °C where a significant increase in the NOx conversion was observed, especially for ZrO2 and Al2O3, where conversion takes a value of 85.2% and 80.6%, respectively (Table S2, entry 8 vs. 2). Increasing the temperature to 400 °C in the tested systems resulted in a slight decrease (ZnO, MgO, and ZrO2) or increase (SiC, Al2O3, CeO2, SiO2, and TiO2) of the NOx conversion rate (Table S2, entries 3, 5, and 8 vs. 1, 2, 4, 6, and 7). In turn, the W and V oxides supported by CeO2, SiO2, MgO, TiO2, and SiC allowed for a relatively low conversion of NOx (60–79%) at 400 °C. Interestingly, the literature often describes these systems as an attractive alternative for commercial SCR catalysts [40,41,42,43,44]. In the context of the potential supporting foams (Al2O3, ZrO2, and SiC), the Al2O3 and ZrO2 outperform the SiC one. The catalytic performance of both Al2O3 and ZrO2 is higher than 80% at 400 °C, which locates these supports just after the superior ZnO support (entries 2 vs. 8 vs. 3, Table S2).
As for Al2O3, considering the ZrO2 foam supports appeared comparable in the catalytic performance tests (Table S2), we selected the Al2O3 support coated with nanorod ZnO for extensive and thorough testing. TiO2 was selected as a comparison, providing illustrative insight into the current SCR systems. In particular, we tested the influence of the VOx to WOx ratio on the NOx conversion. This ratio was set at 1:0; 7:3; 1:1; 3:7; and 0:1, respectively. The nominal content of the supported metal oxides in all catalyst systems was 1%. We used the TiO2 or ZnO nanorods at the Al2O3 carrier as the comparison standards (entries 1 and 7, Table 1).
For TiO2-based systems with a higher VOx content vs. WO3 (1:0 and 7:3, respectively), NOx conversion is slightly higher by 1.8–2.4% than the analogous ZnO-based systems (Table 1, entries 2 and 3 vs. 8 and 9). The opposite tendency was observed for the systems with VOx to WO3 ratios of 1:1, 3:7, and 0:1 (Table 1, entries 4–6 vs. 10–12). The screen of the systems in Table 1 allowed us to optimize the molar ratio of the WOx to VOx. The best catalysts were selected based on the TON parameter. For ZnO/Al2O3 nanorods, the highest TON of 623 mmol/kg.h was observed for 1% V,W(3:7)/ZnO/Al2O3, while for TiO2/Al2O3 nanorods, the highest TON of 623 mmol/kg.h was observed for the 1% W/TiO2/Al2O3 (TON = 613 mmol/kg.h). Both for the TiO2/Al2O3 nanorods and ZnO/Al2O3, we observed a systematic increase in TON when the VOx content decreased in favor of the WOx content (Table 1: 543 vs. 619 mmol/kg.h or 527 vs. 613 mmol/kg.h). Accordingly, in the next step, we prepared the ceramic foams with nanorod TiO2 or ZnO coating with a VOx to WO3 load at the optimal molar ratio of 3:7 (Table 1).
Table 2 shows a detailed comparison of NOx conversions for ZnO nanofilaments with different surface coatings on ZrO2, Al2O3, and SiC foam supports measured in SCR reaction. ZnO nanofilaments in the presence of VOx and WOx on the Al2O3 carrier turned out to be the most active (NOx conversion of 94.8%), slightly outperforming other carriers (ZrO2 and SiC) with ZnO nanofilaments decorated with surface VOx and WOx (having a NOx conversion of 93.0% and 89.1%, respectively). Specifically, ZnO nanofilaments with VOx and/or WOx increase the deNOx activity of all crude foam supports. High activity of these systems may result from expanding the surface of the support by the nanorod coating.
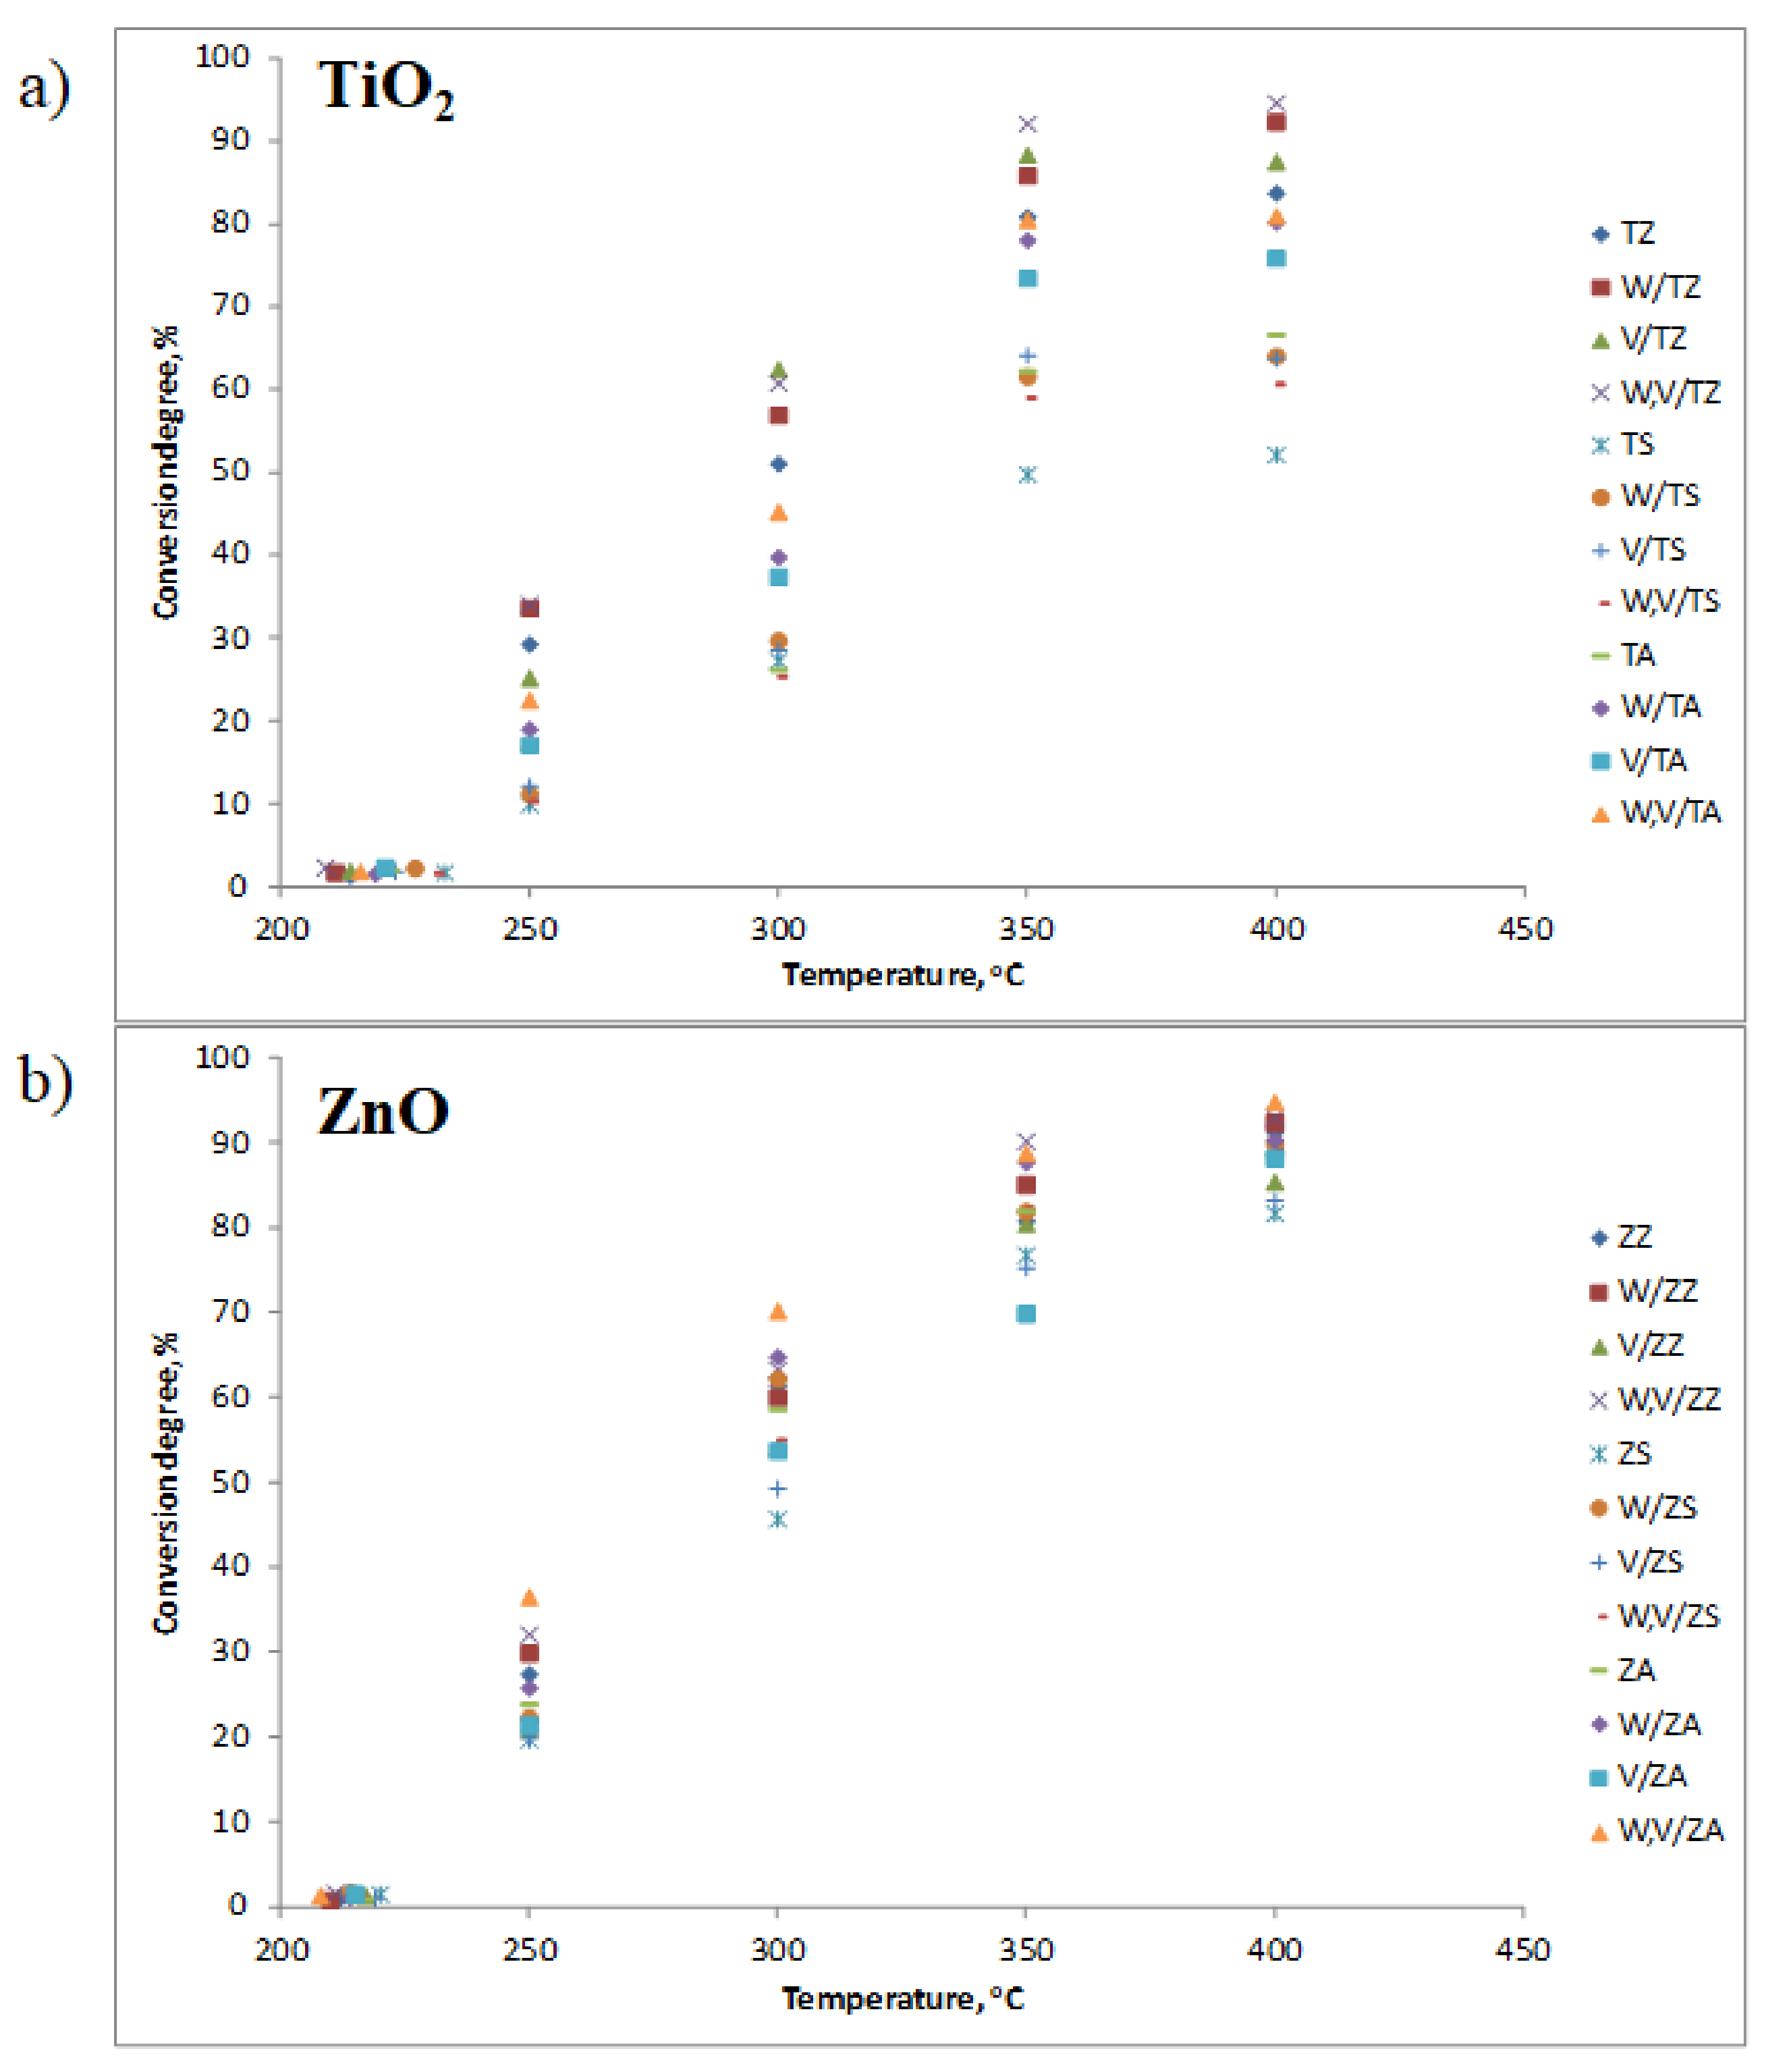
Figure 5 illustrates the catalytic performance of these systems in the temperature range of 200–400 °C. For the catalytic systems with TiO2 nanorods, the highest degree of NOx conversion at 400 °C (88–96%) was noted when the carrier was ZrO2 (Figure 5A), while the lowest was noted for SiC support (55–63%). ZnO nanorods deposited on Al2O3 made it possible to obtain the 90–95% degree of NOx conversion at 400 °C, while the worst carrier for ZnO nanorods was again SiC, with an 83–90% NOx conversion (Figure 5B). Generally, the comparison of TiO2 and ZnO nanorods in Figure 5A,B reveals that the SCR conversions on ZnO appeared better than on the TiO2 supports in the range of the tested temperatures.
A comparison of the foam supports indicates that for the oxide-supported (Al2O3 and ZrO2) catalysts, SCR reactivity slightly outperforms the SiC supported systems. Formally, all supports are semiconductors of the wide gap of ca. 3.2 ÷ 3.37 eV, but in nano ZnO or TiO2, the gap energy can be modulated by nanostructure organization and interactions with supported metals (W or V) present at the surface in the form of metal oxides. Optical spectra of the ZnO and TiO2 supported on Al2O3 and SiC (Figure S2, Supplementary Materials) indicate a correlation between deNOx behavior and the energy band gap. In particular, unlike the Al2O3, the SiC-supported ZnO and TiO2 systems indicate an additional low systems energy absorption band. It is, however, not clear if this can affect the thermal (dark) SCR reaction.
Interestingly, material structure and coatings can influence the band gap value. For example, the tungsten oxides’ band gap can be reduced to 2.47 through the interactions with other semiconductors, e.g., CdTe [45]. Similarly, the contacts of Ti and V2O5, even as large crystallites, modified the optical band gap (1.96 eV vs. 2.2 eV for undoped V2O5). This effect is attributed to lattice expansion by the Ti ion and oxygen vacancies formation [46]. The specific interactions of the individual nanorod coating and synergistic interaction of the V and W oxide coatings can also play a role. For example, the doping of the W oxide with V can result in synergic interactions downshifting the material band gap [47]. In turn, the band-gap energies of the SiC nanowires are higher than the corresponding SiC bulk values [48].

4. Conclusions

Energy production is associated with many environmental risks; e.g., generating greenhouse gas emissions and nitrogen oxides (NOx) are among the primary gas pollution concerns. Environmental catalysis plays a pivotal role in NOx mitigation (DeNOx). This study investigated a collection of ceramic foams as a potential catalyst support for selective catalytic NOx reduction (SCR). To be an attractive support, we should functionalize the surface of raw foams. A library of ceramic SiC, Al2O3, and ZrO2 foams ornamented with nanorod ZnO and TiO2 as W and V oxide coatings was obtained for the first time. We characterized the surface layer structure using XPS, XRF, and SEM and TEM microscopy to optimize the W to V molar ratio.
NOx generation, pollution, and reduction are complex problems. First, combustion in air yields two forms of NOx, namely NO and NO2, in the ratio NO/NOx of 0.90 to 0.95. However, the dominating NOx form in the atmosphere is NO2 resulting from NO oxidation. Accordingly, the main issue in the environmental catalysis of NOx refers to NO, while the main topics of NOx ecotoxicology refer to NO2. Low NO2 content in flue gases also decides NO2. SCR is tested only very rarely, even though a complex NO/NO2 SCR should support a standard NO SCR; therefore, here, we used the NO2 SCR model.
Comparing TiO2 and ZnO systems reveals that the SCR conversion on ZnO appeared superior vs. conversion on TiO2, while the SiC-supported catalysts were less efficient than Al2O3 and ZrO2-supported catalysts. The energy bands in optical spectra correlate with the observed activity rank. However, a more detailed study is needed to assess whether this effect is coincidental only.

Supplementary Materials

The following are available online at https://www.mdpi.com/article/10.3390/en15051798/s1, Table S1: The amount of metal needed to obtain vanadium, tungsten, or mixed catalysts calculated at 990 mg of the carrier; Table S2: NOx decomposition data for V and W oxides deposited on different carriers. Gas flow rate of 3 [dm3/h]; Table S3: EDXRF analyses of Ti, W, and V nanoparticles deposited on powder or foam Al2O3, SiC, and ZrO2; Table S4: The average crystallite size and lattice parameters of investigated materials determined by XRD method; Figure S1: High-resolution XPS spectra of (a) O1s and V2p, (b) C1s, (c) W4f, and (d) W4d. The red spectra represent 1.0% W,V/ZnO/ZrO2 system, the blue—the 1.0% W,V/ZnO/Al2O3 system, and the green—1.0% W,V/ZnO/SiC system; and Figure S2: UV-Vis spectra of TiO2/SiC or TiO2/Al2O3 and ZnO/SiC or ZnO/Al2O3 in powders.

Author Contributions

Conceptualization, M.K. and J.P.; formal analysis, J.P., M.K. and P.B.; writing—original draft preparation, M.K., J.P., T.S., P.B., R.S., M.Z., J.S., K.B., B.S.W., M.O., R.P. and M.G.; writing—review and editing, P.B. and M.K.; visualization, M.K.; supervision, J.P. and T.S.; project administration, J.P. and P.B.; funding acquisition, J.P. All authors have read and agreed to the published version of the manuscript.

Funding

This research study was funded by the National Centre for Research and Development in Poland, grant no. TANGO1/266384/NCBR/2015, and National Science Center, grant no. OPUS 2018/29/B/ST8/02303.

Institutional Review Board Statement

Not applicable.

Informed Consent Statement

Not applicable.

Data Availability Statement

The datasets generated during the current study are available from the corresponding authors upon reasonable request.

Acknowledgments

For the support, Jaroslaw Polanski would like to acknowledge Zielony Horyzont: New Energy project ZFIN 40001022.

Conflicts of Interest

The authors declare no conflict of interest.

References

  1. Polanski, J.; Lach, D.; Kapkowski, M.; Bartczak, P.; Siudyga, T.; Smolinski, A. Ru and Ni—Privileged Metal Combination for Environmental Nanocatalysis. Catalysts 2020, 10, 992. [Google Scholar] [CrossRef]
  2. Van Noyen, J.; Mullens, S.; Snijkers, F.; Luyten, J. Catalyst design with porous functional structures. Sustain. Chem. WIT Trans. Ecol. Environ. 2011, 154, 93–102. [Google Scholar] [CrossRef] [Green Version]
  3. Carty, W.M.; Lednor, P.W. Monolithic ceramics and heterogeneous catalysts: Honeycombs and foams. Curr. Opin. Solid State Mater. Sci. 1996, 1, 88–95. [Google Scholar] [CrossRef]
  4. Twigg, M.V.; Richardson, J.T. Theory and Applications of Ceramic Foam Catalysts. Chem. Eng. Res. Des. 2002, 90, 183–189. [Google Scholar] [CrossRef]
  5. Wang, Y.; Yang, Q.; Ke, L.; Peng, Y.; Liu, Y.; Wu, Q.; Tian, X.; Dai, L.; Ruan, R.; Jiang, L. Review on the catalytic pyrolysis of waste oil for the production of renewable hydrocarbon fuels. Fuel 2021, 283, 119170. [Google Scholar] [CrossRef]
  6. Palma, V.; Ruocco, C.; Cortese, M.; Martino, M. Recent Advances in Structured Catalysts Preparation and Use in Water-Gas Shift Reaction. Catalysts 2019, 9, 991. [Google Scholar] [CrossRef] [Green Version]
  7. Rodríguez, E.M.; Rey, A.; Mena, E.; Beltrán, F.J. Application of solar photocatalytic ozonation in water treatment using supported TiO2. Appl. Catal. B Environ. 2019, 254, 237–245. [Google Scholar] [CrossRef]
  8. Leonzio, G. ANOVA analysis of an integrated membrane reactor for hydrogen production by methane steam reforming. Int. J. Hydrog. Energy 2019, 44, 11535–11545. [Google Scholar] [CrossRef]
  9. Zuercher, S.; Pabst, K.; Schaub, G. Ceramic foams as structured catalyst inserts in gas–particle filters for gas reactions—Effect of backmixing. Appl. Catal. A Gen. 2009, 357, 85–92. [Google Scholar] [CrossRef]
  10. Huangfu, L.; Abubakar, A.; Li, C.; Li, Y.; Wang, C.; Gao, S.; Liu, Z.; Yu, J. Development of Red Mud Coated Catalytic Filter for NOx Removal in the High Temperature Range of 300–450 °C. Catal. Lett. 2020, 150, 702–712. [Google Scholar] [CrossRef]
  11. Seijger, G.B.F.; Oudshoorn, O.L.; Boekhorst, A.; van Bekkum, H.; van den Bleek, C.M.; Calis, H.P.A. Selective catalytic reduction of NO over zeolite-coated structured catalyst packings. Chem. Eng. Sci. 2001, 56, 849–857. [Google Scholar] [CrossRef]
  12. Seo, H.J.; Jeong, R.H.; Boo, J.-H.; Song, J.; Boo, J.-H. Study on Chemical Removal of Nitric Oxide (NO) as a Main Cause of Fine Dust (Air Pollution) and Acid Rain. Appl. Sci. Converg. Technol. 2017, 26, 218–222. [Google Scholar] [CrossRef]
  13. Irfan, M.F.; Goo, J.H.; Kim, S.D. Co3O4 based catalysts for NO oxidation and NOx reduction in fast SCR process. Appl. Catal. B Environ. 2008, 78, 267–274. [Google Scholar] [CrossRef]
  14. Lai, J.K.; Wachs, I.E. A Perspective on the Selective Catalytic Reduction (SCR) of NO with NH3 by Supported V2O5–WO3/TiO2 Catalysts. ACS Catal. 2018, 8, 6537–6551. [Google Scholar] [CrossRef]
  15. Kapkowski, M.; Siudyga, T.; Sitko, R.; Niemczyk-Wojdyla, A.; Zelenka, T.; Zelenkova, G.; Golba, S.; Smolinski, A.; Polanski, J. Toward a viable ecological method for regenerating a commercial SCR catalyst–Selectively leaching surface deposits and reconstructing a pore landscape. J. Clean. Prod. 2021, 316, 128291. [Google Scholar] [CrossRef]
  16. Zhang, Q.; Wu, Y.; Yuan, H. Recycling strategies of spent V2O5-WO3/TiO2 catalyst: A review. Resour. Conserv. Recycl. 2020, 161, 104983. [Google Scholar] [CrossRef]
  17. Huo, Y.; Chang, Z.; Li, W.; Liu, S.; Dong, B. Reuse and valorization of vanadium and tungsten from waste V2O5–WO3/TiO2 SCR catalyst. Waste Biomass Valorization 2015, 6, 159–165. [Google Scholar] [CrossRef]
  18. Salonen, H.; Salthammer, T.; Morawska, L. Human exposure to NO2 in school and office indoor environments. Environ. Int. 2019, 130, 104887. [Google Scholar] [CrossRef]
  19. Koebel, M.; Madia, G.; Raimondi, F.; Wokaun, A. How NO2 Affects the Reaction Mechanism of the SCR Reaction. Available online: https://www.osti.gov/etdeweb/servlets/purl/20398744 (accessed on 10 February 2022).
  20. Zhu, X.; Zhang, L.; Dong, Y.; Ma, C. NO2–NH3 SCR over Activated Carbon: A Combination of NH4NO3 Formation and Consumption. Energy Fuels 2021, 35, 6167–6178. [Google Scholar] [CrossRef]
  21. Xu, S.; Han, X.; Ma, Y.; Duong, T.D.; Lin, L.; Gibson, E.K.; Sheveleva, A.; Chansai, S.; Walton, A.; Ngo, D.-T.; et al. Catalytic decomposition of NO2 over a copper-decorated metal–organic framework by non-thermal plasma. Cell Rep. Phys. Sci. 2021, 2, 100349. [Google Scholar] [CrossRef]
  22. Fernández-Pérez, A.; Rodríguez-Casado, V.; Valdés-Solís, T.; Marbán, G. Room temperature sintering of polar ZnO nanosheets: I-evidence. Phys. Chem. Chem. Phys. 2017, 19, 16406–16412. [Google Scholar] [CrossRef] [Green Version]
  23. Colón, G.; Hidalgo, M.C.; Navío, J.A.; Melián, E.P.; Díaz, O.G.; Rodríguez, J.M.D. Highly photoactive ZnO by amine capping-assisted hydrothermal treatment. Appl. Catal. B Environ. 2008, 83, 30–38. [Google Scholar] [CrossRef]
  24. Yermolayeva, Y.V.; Savin, Y.N.; Tolmachev, A.V. Controlled Growth of ZnO Nanocrystals on the Surface of SiO2 Spheres. Solid State Phenom. 2009, 151, 264–268. [Google Scholar] [CrossRef]
  25. Siwinska-Stefanska, K.; Kubiak, A.; Piasecki, A.; Goscianska, J.; Nowaczyk, G.; Jurga, S.; Jesionowski, T. TiO2-ZnO Binary Oxide Systems: Comprehensive Characterization and Tests of Photocatalytic Activity. Materials 2018, 11, 841. [Google Scholar] [CrossRef] [PubMed] [Green Version]
  26. Su, Q.; Wang, W.; Zhang, Z.; Duan, J. Enhanced photocatalytic performance of Cu2O/MoS2/ZnO composites on Cu mesh substrate for nitrogen reduction. Nanotechnology 2021, 32, 285706. [Google Scholar] [CrossRef]
  27. Fernández-Pérez, A.; Marbán, G. Room temperature sintering of polar ZnO nanosheets: III-Prevention. Microporous Mesoporous Mater. 2020, 294, 109836. [Google Scholar] [CrossRef]
  28. Laurenti, M.; Stassi, S.; Canavese, G.; Cauda, V. Surface Engineering of Nanostructured ZnO Surfaces. Adv. Mater. Interfaces 2017, 4, 1600758. [Google Scholar] [CrossRef]
  29. Witkowski, B.S.; Wachnicki, L.; Gieraltowska, S.; Dluzewski, P.; Szczepanska, A.; Kaszewski, J.; Godlewski, M. Ultra-fast growth of the monocrystalline zinc oxide nanorods from the aqueous solution. Int. J. Nanotechnol. 2014, 11, 758–772. [Google Scholar] [CrossRef]
  30. NIST X-ray Photoelectron Spectroscopy Database, Version 4.1 (National Institute of Standards and Technology, Gaithersburg, 2012). Available online: http://srdata.nist.gov/xps/ (accessed on 10 February 2022).
  31. Kim, D.; Kim, M.; Yi, J.; Nam, S.H.; Boo, J.H.; Park, Y.S.; Lee, J. Growth and characterization of VO2 thin film by pulsed DC sputtering of optical switching applications. Sci. Adv. Mater. 2017, 9, 1415–1419. [Google Scholar] [CrossRef]
  32. Cheng, I.C.; Garcia-Sanchez, E.; Hodge, A.M. Note: A method for minimizing oxide formation during elevated temperature nanoindentation. Rev. Sci. Instrum. 2014, 85, 096106. [Google Scholar] [CrossRef]
  33. Korduban, A.M.; Shpak, A.P.; Medvedskij, M.M. Electronic structure exploration of active element surface for hydrogen sensor based on WO3-x nanoparticles. In Hydrogen Materials Science and Chemistry of Carbon Nanomaterials; Springer: Dordrecht, The Netherlands, 2007; pp. 59–64. [Google Scholar] [CrossRef]
  34. Mendialdua, J.; Casanova, R.; Rueda, F.; Rodríguez, A.; Quiñones, J.; Alarcón, L.; Escalante, E.; Hoffmann, P.; Taebi, I.; Jalowiecki, L. X-ray photoelectron spectroscopy studies of laterite standard reference material. J. Mol. Catal. A Chem. 2005, 228, 151–162. [Google Scholar] [CrossRef]
  35. Zhang, M.; Qin, J.; Yu, P.; Zhang, B.; Ma, M.; Zhang, X.; Liu, R. Facile synthesis of a ZnO–BiOI p–n nano-heterojunction with excellent visible-light photocatalytic activity. Beilstein J. Nanotechnol. 2018, 9, 789–800. [Google Scholar] [CrossRef] [PubMed] [Green Version]
  36. Archana, J.; Navaneethan, M.; Hayakawa, Y. Morphological transformation of ZnO nanoparticle to nanorods via solid-solid interaction at high temperature annealing and functional properties. Scr. Mater. 2016, 113, 163–166. [Google Scholar] [CrossRef]
  37. Li, H.; Rameshan, C.; Bukhtiyarov, A.V.; Prosvirin, I.P.; Bukhtiyarov, V.I.; Rupprechter, G. CO2 activation on ultrathin ZrO2 film by H2O co-adsorption: In situ NAP-XPS and IRAS studies. Surf. Sci. 2019, 679, 139–146. [Google Scholar] [CrossRef]
  38. Tsunekawa, S.; Asami, K.; Ito, S.; Yashima, M.; Sugimoto, T. XPS study of the phase transition in pure zirconium oxide nanocrystallites. Appl. Surf. Sci. 2005, 252, 1651–1656. [Google Scholar] [CrossRef]
  39. Burdeinaya, T.N.; Matyshak, V.A.; Tret’yakov, V.F.; Glebov, L.S.; Zakirova, A.G.; Garcia, M.C.; Villanueva, M.A. Design of catalysts for deNOx process using synergistic phenomenon. Appl. Catal. B Environ. 2007, 70, 128–137. [Google Scholar] [CrossRef]
  40. Misono, M. Chemistry and Catalysis of Mixed Oxides. In Studies in Surface Science and Catalysis; Elsevier: Amsterdam, The Netherlands, 2013; Volume 176, pp. 25–65. [Google Scholar] [CrossRef]
  41. Zhao, X.; Mao, L.; Dong, G. Mn-Ce-V-WOx/TiO2 SCR Catalysts: Catalytic Activity, Stability and Interaction among Catalytic Oxides. Catalysts 2018, 8, 76. [Google Scholar] [CrossRef] [Green Version]
  42. Chen, L.; Weng, D.; Si, Z.; Wu, X. Synergistic effect between ceria and tungsten oxide on WO3–CeO2–TiO2 catalysts for NH3-SCR reaction. Prog. Nat. Sci. 2012, 22, 265–272. [Google Scholar] [CrossRef] [Green Version]
  43. Selleri, T.; Gramigni, F.; Nova, I.; Tronconi, E. NO oxidation on Fe- and Cu-zeolites mixed with BaO/Al2O3: Free oxidation regime and relevance for the NH3-SCR chemistry at low temperature. Appl. Catal. B Environ. 2018, 225, 324–331. [Google Scholar] [CrossRef]
  44. Ganjkhanlou, Y.; Janssens, T.V.W.; Vennestrøm, P.N.R.; Mino, L.; Paganini, M.C.; Signorile, M.; Bordiga, S.; Berlier, G. Location and activity of VOx species on TiO2 particles for NH3-SCR catalysis. Appl. Catal. B Environ. 2020, 278, 119337. [Google Scholar] [CrossRef]
  45. Hendi, A.H.Y.; Al-Kuhaili, M.F.; Durrani, S.M.A.; Faiza, M.M.; Ul-Hamid, A.; Qurashi, A.; Khan, I. Modulation of the band gap of tungsten oxide thin films through mixing with cadmium telluride towards photovoltaic applications. Mater. Res. Bull. 2017, 87, 148–154. [Google Scholar] [CrossRef]
  46. Srilakshmi, P.; Maheswari, A.U.; Sajeev, V.; Sivakumar, M. Tuning the optical bandgap of V2O5 nanoparticles by doping transition metal ions. Mater. Today 2019, 18, 1375–1379. [Google Scholar] [CrossRef]
  47. Karuppasamy, K.M.; Subrahmanyam, A. Results on the electrochromic and photocatalytic properties of vanadium doped tungsten oxide thin films prepared by reactive dc magnetron sputtering technique. J. Phys. D Appl. Phys. 2008, 41, 035302. [Google Scholar] [CrossRef]
  48. Oliveira, J.B.; Morbec, J.M.; Miwa, R.H. Mechanical and electronic properties of SiC nanowires: An ab initio study. J. Appl. Phys. 2017, 121, 104302. [Google Scholar] [CrossRef] [Green Version]
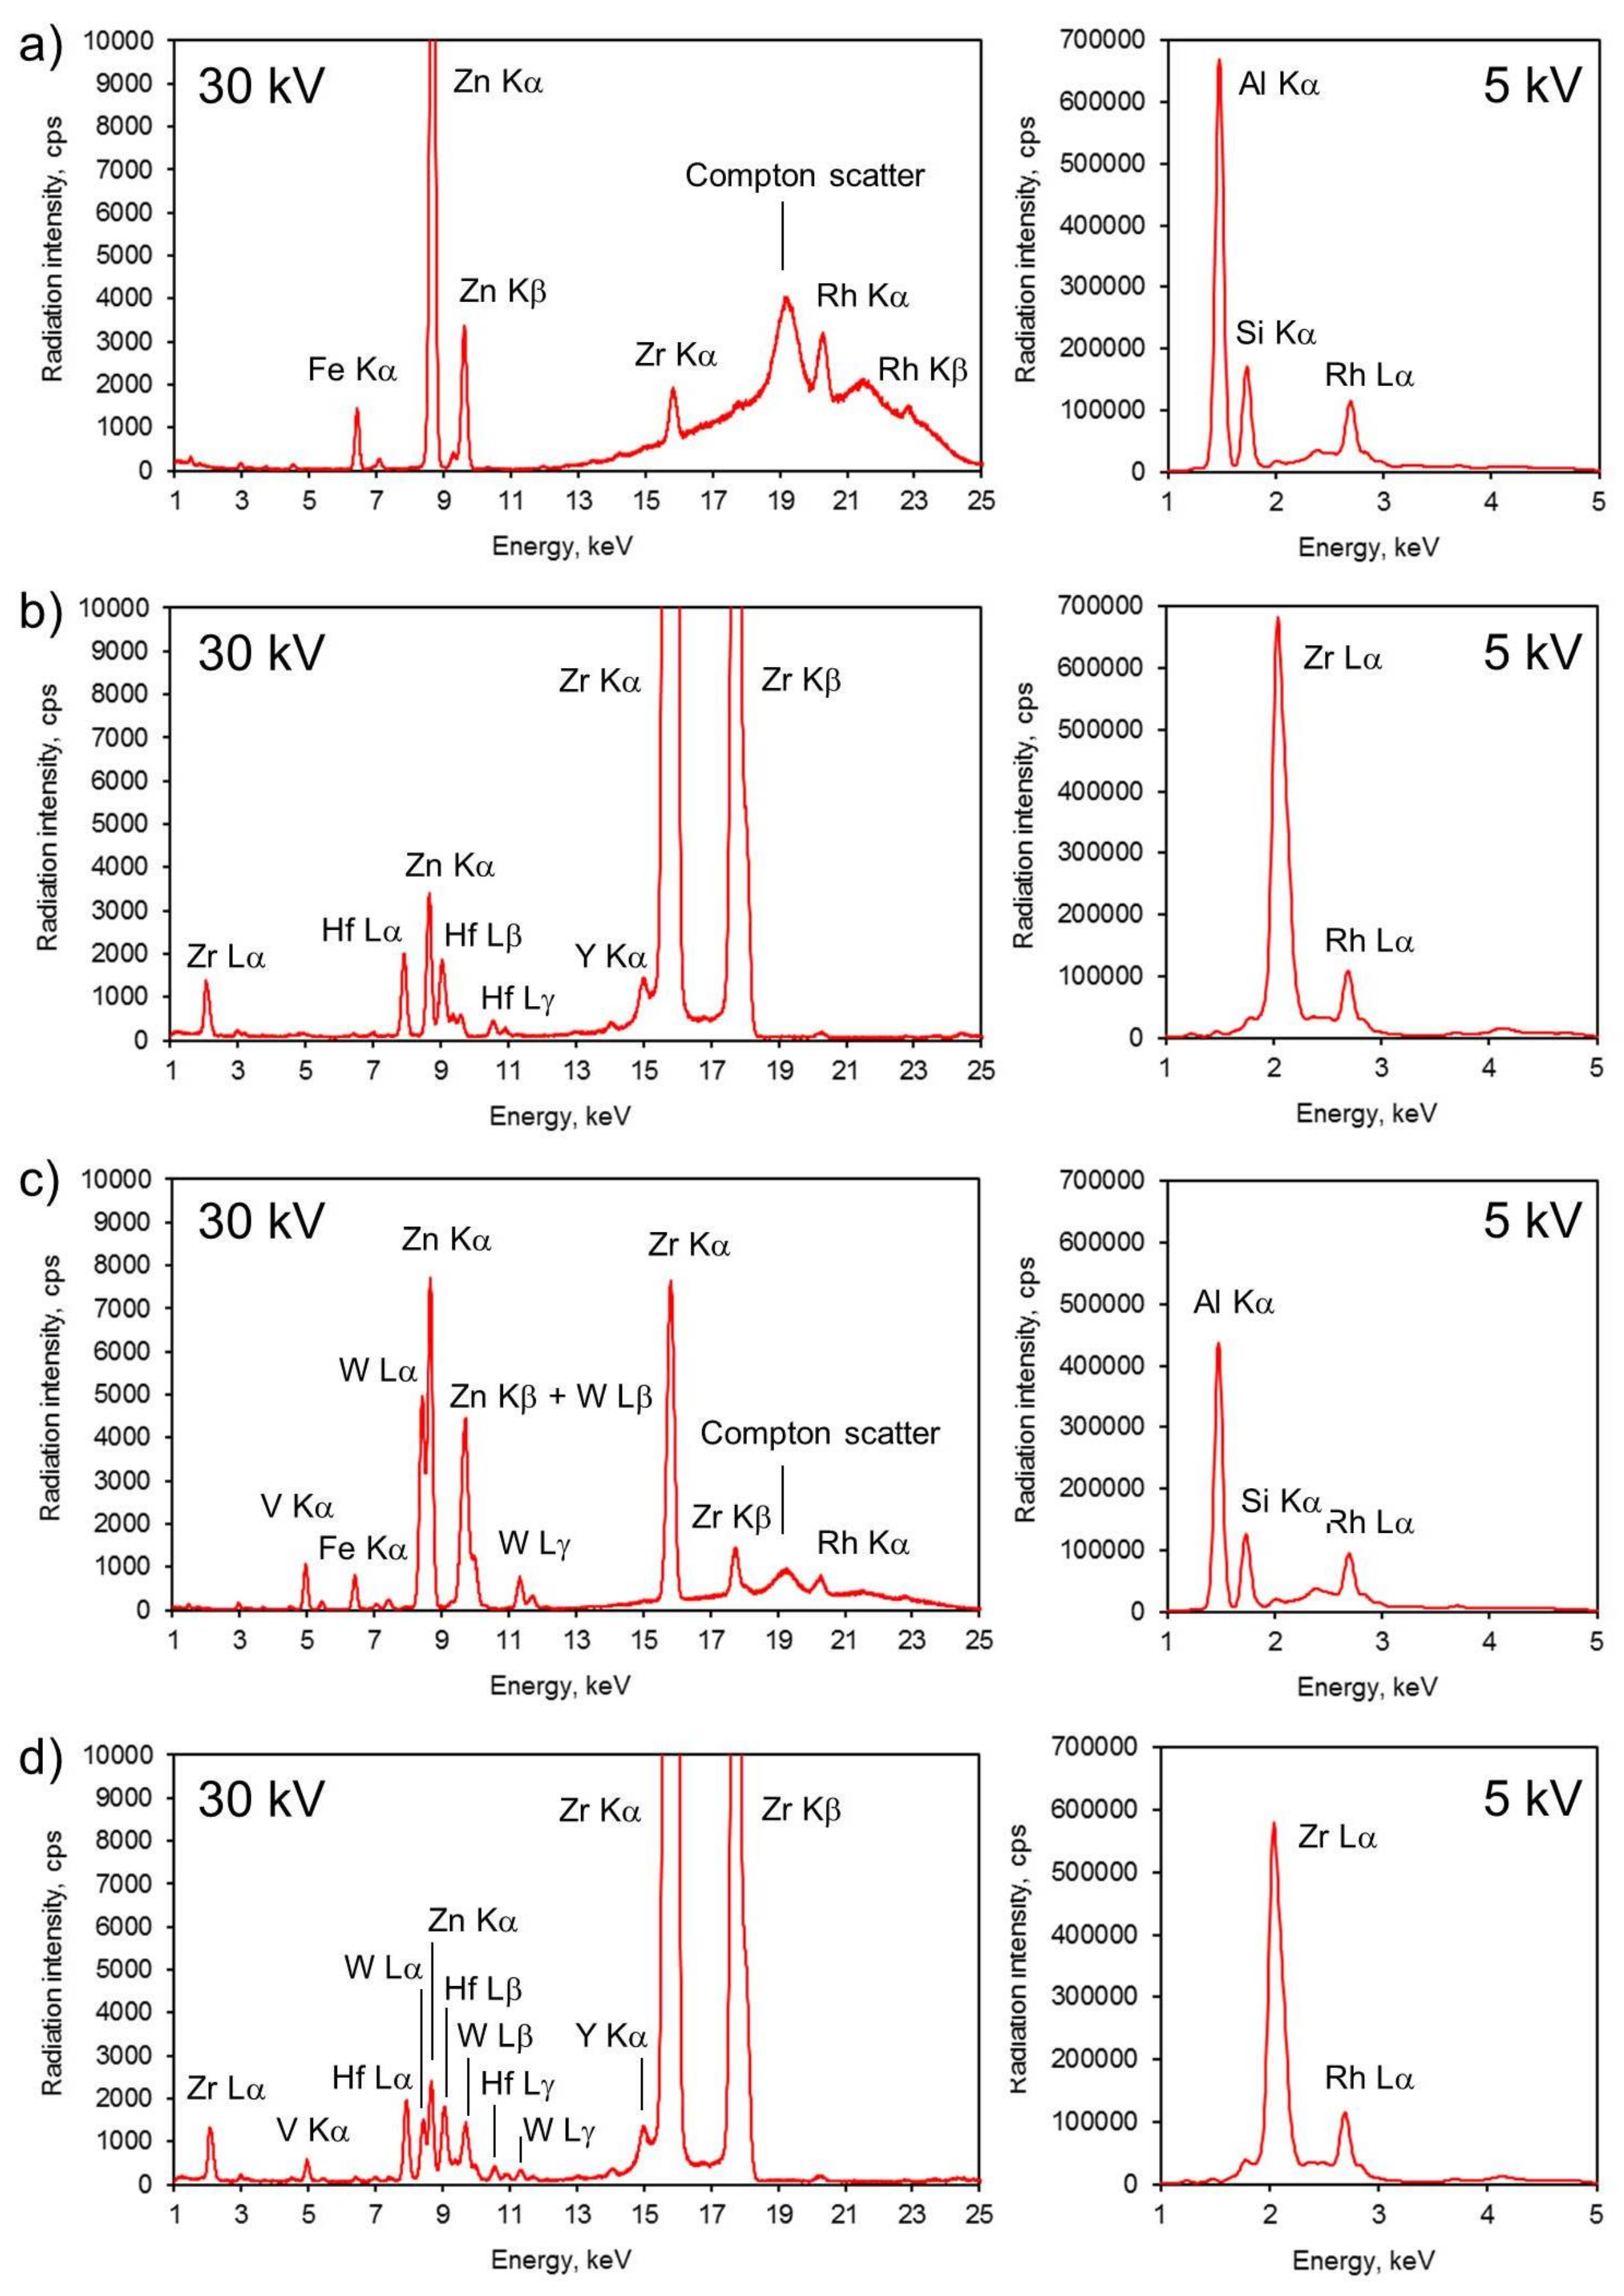
Figure 1. EDXRF spectrum of (a) reference sample—ZnO/Al2O3, (b) reference sample—ZnO/ZrO2, (c) 1.0% W,V/ZnO/Al2O3 system, and (d) 1.0% W,V/ZnO/ZrO2 system.
Energies 15 01798 g001
Figure 2. Rietveld refinement of the ZnO/Al2O3 (a) and ZnO/ZrO2 (b) samples with identified phases. Reference dots indicate measurements points (Imes); the black solid curve calculated the pattern (Icalc); and the solid blue line indicates the (Imes-Icalc) difference, whereas vertical bars indicate Bragg position for the identified phases.
Energies 15 01798 g002
Figure 3. SEM micrographs of ZnO nanowires deposited on (a) SiC; (b) ZrO2; and (c) Al2O3. TEM micrographs of V nanoparticles powdered 1.0% W,V/ZnO/Al2O3 catalyst (d,e) show recorded bright and dark field images, and (f) present recorded selected area electron diffraction patterns from regions shown in part (d).
Energies 15 01798 g003
Figure 4. High-resolution XPS spectra of (a) O1s and V2p, (b) W4f, and (c) W4d. The top spectra represent 1.0% W,V/ZnO/ZrO2 system and the spectra at the bottom represent the 1.0% W,V/ZnO/Al2O3 system.
Energies 15 01798 g004
Figure 5. Catalytic activity of the powdered catalyst foam with (a) TiO2 and (b) ZnO nanorods. Gas flow rate of 3 dm3/h, temperature 400 °C, and atmospheric pressure. Acronyms: TZ—TiO2/ZrO2, W/TZ—1% W/TiO2/ZrO2, V/TZ—1% V/TiO2/ZrO2, W,V/TZ—1% W,V/TiO2/ZrO2, TS—TiO2/SiC, W/TS—1% W/TiO2/SiC, V/TS—1% V/TiO2/SiC, W,V/TS—1% W,V/TiO2/SiC, TA—TiO2/Al2O3, W/TA—1% W/TiO2/Al2O3, V/TA—1% V/TiO2/Al2O3, W,V/TA—1% W,V/TiO2/Al2O3, ZZ—ZnO/ZrO2, W/ZZ—1% W/ZnO/ZrO2, V/ZZ—1% V/ZnO/ZrO2, W,V/ZZ—1% W,V/ZnO/ZrO2, ZS—ZnO/SiC, W/ZS—1% W/ZnO/SiC, V/ZS—1% V/ZnO/SiC, W,V/ZS—1% W,V/ZnO/SiC, ZA—ZnO/Al2O3, W/ZA—1% W/ZnO/Al2O3, V/ZA—1% V/ZnO/Al2O3, and W,V/ZA—1% W,V/ZnO/Al2O3.
Energies 15 01798 g005
Table 1. The V and W load optimization on TiO2 and ZnO nanorod-coated Al2O3 foam.
EntryCatalystNOx Conversion [%] aTON [ m m o l k g h ]
1TiO2/Al2O378.7527
21% V/TiO2/Al2O385.5573
31% V,W(7:3)/TiO2/Al2O389.4599
41% V,W(1:1)/TiO2/Al2O388.3591
51% V,W(3:7)/TiO2/Al2O390.2604
61% W/TiO2/Al2O391.5613
7ZnO/Al2O381.1543
81% V/ZnO/Al2O382.9555
91% V,W(7:3)/ZnO/Al2O387.6587
101% V,W(1:1)/ZnO/Al2O390.8608
111% V,W(3:7)/ZnO/Al2O393.0623
121% W/ZnO/Al2O392.4619
a Gas flow rate of 3 dm3/h, temperature 400 °C, and atmospheric pressure.
Table 2. Catalytic performance of the Al2O3, SiC, and ZrO2 foam coated with zinc oxide nanorods with surface loadings of V and W oxides.
EntryCatalystSample CodeNOx Conversion (%) a
1ZnO/Al2O3ZA88.6
21% W/ZnO/Al2O3W/ZA90.3
31% V/ZnO/Al2O3V/ZA88.2
41% W,V/ZnO/Al2O3W,V/ZA94.8
5ZnO/SiCZS81.7
61% W/ZnO/SiCW/ZS89.9
71% V/ZnO/SiCV/ZS83.2
81% W,V/ZnO/SiCW,V/ZS89.1
9ZnO/ZrO2ZZ91.3
101% W/ZnO/ZrO2W/ZZ92.4
111% V/ZnO/ZrO2V/ZZ85.4
121% W,V/ZnO/ZrO2W,V/ZZ93.0
a Gas flow rate of 3 dm3/h, temperature 400 °C, and atmospheric pressure.
Publisher’s Note: MDPI stays neutral with regard to jurisdictional claims in published maps and institutional affiliations.