Article

Research on the Flow-Induced Stress Characteristics of Head-Cover Bolts of a Pump-Turbine during Turbine Start-Up

1
Department of Energy and Power Engineering, Tsinghua University, Beijing 100084, China
2
Anhui Jinzhai Pumped Storage Power Co., Ltd., Lu’An 237333, China
3
InnoFuture GmbH, Binzstrasse 5, 8953 Zurich, Switzerland
*
Author to whom correspondence should be addressed.
Energies 2022, 15(5), 1832; https://doi.org/10.3390/en15051832
Submission received: 29 December 2021 / Revised: 19 February 2022 / Accepted: 1 March 2022 / Published: 2 March 2022
(This article belongs to the Section L: Energy Sources)

Abstract

:
Nowadays, pump-turbine units have to experience multiple start-stops every day to balance the power production and consumption on the grid. During the transient process of turbine start-up, the hydraulic forces applied to the head-cover would change dramatically and induce high-level stresses on the head-cover bolts. As key components of large hydraulic turbine units, the head-cover bolts are subjected to tens of thousands of tonnes of hydraulic excitation force during operation. Special attention should be paid to the design of the head-cover bolts of large hydraulic pump-turbine units because these units have high water heads and high hydraulic excitation forces. Therefore, the safe design of the head-cover bolts is extremely important to maintain the operational safety of the whole unit. This paper investigates the flow-induced stress characteristics of the head-cover bolts during turbine start-up in a large prototype pump-turbine unit. A complete 3D fluid model and a corresponding 3D structural model, including the head-cover bolts of the pump-turbine unit, were created. The fluid–structure coupling method was used to calculate the structural stresses caused by fluid flow during turbine start-up. The pressure files during turbine start-up calculated by the CFD tool were transferred and mapped to the finite element model of the structural components of the pump-turbine unit. Subsequently, the flow-induced stress characteristics of the head-cover bolts were numerically simulated. The simulation results showed that the hydraulic excitation force on the head-cover bolts increased significantly during turbine start-up, and the displacement and the stress distributions of different head-cover bolts were not uniform. The calculation methods and conclusions in this paper can also be applied to evaluate the flow-induced stress characteristics of head-cover bolts for similar hydraulic pump-turbine units.

1. Introduction

With the global trend of low-carbon economy development and the growing demand for clean and renewable energy, hydropower has been further developed vigorously, especially in developing countries. In order to store unstable wind and solar energy, ensure the balance of power production and consumption, and improve the electricity quality of the grid, large-scale hydraulic pumped-storage power stations (PSPSs) with power generation and storage functions have been widely built and fully integrated into power grids in recent years.
In order to obtain a large energy storage capacity, PSPS usually has a high water head, which could generate hydraulic excitation forces of tens of thousands of tonnes on the structures of pump-turbine (PT) units. Furthermore, the reversible PT units in PSPSs have to be started and stopped more frequently each day to meet the ever-changing demands of the grid for power generation and energy storage. During turbine start-up, the hydraulic excitation forces acting on the head-cover and other PT structures change drastically, and the amplitude of the excitation forces can also reach tens of thousands of tonnes.
Head-cover bolts are the key structural components connecting the head-cover to the stay ring. The large hydraulic excitation forces applied on the head-cover may lead to excessive stresses, insufficient preload, and alternating dynamic loads on the bolts. These may result in fatigue, cracking, and even fracture to the bolts during the service period. The faults such as loosening, fatigue, and fracture of the head-cover bolts can cause serious accidents such as component damage, power outages, and even casualties [1]. In 2009, the large hydraulic turbine units of the Sayano Sushenskaya power station in Russia experienced a fatal accident due to fatigue damage of the head-cover bolts. The head-cover and the rotor of the turbine unit were ejected, and water jets were sprayed from the turbine into the main building, flooding the entire generator floor [2]. In 2016, a similar accident occurred in a PSPS in China. A brittle fracture happened on the head-cover bolts of the PT unit (Figure 1), and the head-cover and the rotor were lifted by the high-pressure water, which eventually gushed into the power station building [3]. Therefore, to ensure the operation safety of the P-T units and avoid fatal accidents in the PSPSs, it is of paramount importance to study the stress characteristics and safe design of the head-cover bolts during the design phase.
A number of scholars from different countries have studied the stress characteristics of bolts in various machines from different perspectives, such as factors affecting bolt damage and bolt health assessment. The factors affecting the health of the bolts include stress concentration, temperature, bending moment, tensile force, location of the nuts, etc. Li et al. analysed the fracture characteristics and reasons of the bolts by means of different techniques and found that the bolt surface and stress concentration are the main causes of fatigue fracture of worm gear joint bolts [4]. Based on the theoretical calculations and failure analysis, Liu found that the wind turbine bolt failed at low temperatures due to accelerated fatigue from stress concentration [5]. Curtis examined the failure analysis of the bolts from a failed joint between the impeller blade and the rotating assembly unit and found the factors affecting the initiation of cracks in bolts [6]. Fernando et al. analysed the failure of the bolts used to connect the hydraulic turbine to the main shaft and revealed that the bending moment on the shaft was the main cause of bolt damage [7]. Grimsm et al. conducted different direct tension tests and numerical simulations on the bolt and nut assemblies. The result showed that the failure mode depended on the location of the nut [8].
In order to calculate the stresses of bolts and estimate the failure of bolts, some researchers have developed a series of methods. Deng et al. performed a comparative analysis on the stiffness and strength of the head-cover flange by means of the finite element method (FEM). They established a set of convenient and feasible fatigue analysis prediction methods by combining relevant standards [9]. Fernando and Carlos researched the fatigue failure of the bolt on a Francis turbine. They obtained the stress history of the bolts by acquiring the power generation history for one year and estimated the fatigue life of the bolts based on the accumulated damage [7]. Huang et al. used the Smith–Watson–Topper method to predict the fatigue life of a bolt [10]. By calculating the S-N curves under different preloads, Shahani and Shakeri researched the influence of preload on the stress distribution of bolts [11].
Regarding the analysis of the head-cover bolts, several investigations have been carried out. Luo et al. performed numerical simulation on stresses and relative stiffness of the head-cover bolts in a PT. The result shows that the relative stiffness of the bolts and flange for PTs should not be assumed to be a constant value at the design stage [12,13]. Chen et al. simulated the 3D flow of the PT to get the pressure on the head-cover and stay ring. Then, they calculated the stresses of the bolts under preload only and calculated the ones under preload and hydraulic pressure [14]. Brekke discussed the optimisation of the performance of different types of large turbines and gave a discussion on the safety and necessary maintenance of turbines, paying special attention to bolt connections [15]. Chen et al. carried out a finite element calculation on the joint screw pair structure of the head-cover of a Francis-type PT of a PSPS under different working conditions. The stress distribution law of the screw pair is studied, which provides an important theoretical basis and design reference for the practical engineering application of the head-cover ring connection of the PT [16]. However, the previous investigations mainly focus on the averaged force on the bolts, without considering the stress distribution on different head-cover bolts. Due to the asymmetric characteristics of the head-cover, the deformation and the stress of each head-cover bolt under the hydraulic pressure load vary greatly, and some bolts may have excessive stress concentration. The turbine start-up transient process is a very challenging operation condition for the units and is a major fatigue damage contributor for the turbine unit [17,18,19,20,21,22,23,24]. The hydraulic forces acting on the head-cover can cause high stresses and even damage on the head-cover bolts, and the alternating excessive stress during transient processes can reduce the remaining service life of the head-cover bolts and even lead to a serious accident. Therefore, a safe design and a careful stress assessment of the head-cover bolts during the design phase are extremely important to ensure the operational safety of the large hydraulic PT units.
This paper presents a detailed investigation of the flow-induced stress characteristics of the head-cover bolts in a large prototype reversible PT unit during turbine start-up. The methodology of flow-induced structural stress analysis is described first. Then, the internal flow simulation and the flow characteristics of pressure and velocity distributions during turbine start-up are presented. After that, the corresponding flow-induced stresses of the structures including head-cover bolts are analysed with numerical simulation, and the results are discussed in detail. Finally, the conclusions drawn from this investigation are presented.

2. Methodology of Flow-Induced Stress Analysis

Since the model tests and prototype tests of large hydraulic turbines are usually very expensive and time-consuming, scientific numerical simulation becomes an alternative method to investigate the fluid dynamics and the structural dynamics of the turbine units. Many researchers [25,26,27,28,29,30,31,32,33] have verified the reliability of numerical calculations of hydraulic turbines by comparing the calculated results with the measured ones. Several studies [34,35,36] have used the dynamic mesh technique to simulate the unsteady flow of PT units in transient processes, and the simulation results were in good agreement with the experimental ones. However, a transient process calculation took months even with many computational resources, which could not provide fast feedback to the PT designers of real engineering projects within a given time frame. For this reason, some scholars [26,27,37,38,39] have proposed a simplified method to calculate the fluid flow at each critical moment of transient processes and to study the flow-induced stresses of PT structures. This calculation method requires substantially less time and computational resources, and the simulation results agree well with corresponding measured ones. Some researchers [40,41,42,43] have calculated the stresses of the stationary parts of the hydraulic machinery and verified the accuracy of the one-way fluid–structure coupling (FSC) method. In this study, the flow-induced structural deformation was small, and the influence of the structural deformation son fluid flow was negligible. Therefore, the one-way FSC method was adopted to calculate the flow-induced structural stress of a PT unit during turbine start-up. Computational fluid dynamics (CFD) and flow-induced structural dynamics of the PT unit were analysed using the finite volume method (FVM) and the FEM, respectively. The fluid pressure data were transferred to the structural model at the fluid–structure coupling interface.
Three-dimensional unsteady turbulent flow in the PT follows the fundamental laws of conservation of mass and conservation of momentum:
ρ f t + ( ρ f V ) = 0
( ρ f   V ) t + ( ρ f V V τ f ) = f f
where t is time, ρf is the fluid density, V is the velocity vector of the fluid, ff is the volume force vector, and τf is the shear force tensor:
τ f = ( p + μ V ) I + 2 μ e
where p is the fluid pressure, μ is the dynamic viscosity, and e is the velocity stress tensor:
e = 1 2 ( V + V T )
The fluid pressure at the FSC interface can be calculated using the fluid dynamic analysis described above, and the force exerted by the fluid on the structure ffs(t) can be obtained by integrating the fluid pressure p ( t ) with the FSC interface surfaces S .
f f s ( t ) =   p ( t ) · d S
Considering the fluid forces acting on the structure at the FSC interface ffs(t), the structural dynamic equilibrium equation can be written as
    M s x ¨ + C s x ˙ + K s x = f s ( t ) + f f s ( t )
where Ms, Cs, and Ks are the mass, damping, and stiffness matrices of the structure, respectively; x, x ˙ , and x ¨ are the displacement, velocity, and acceleration vectors, respectively; and fs(t) represents the externally volume force vector acting on the structure.
The fluid pressure loads at different moments during turbine start-up were transferred and applied to the finite element model of the PT unit, and structural transient analysis was carried out to calculate the deformations and von Mises stresses (also known as equivalent stresses σ e q ).
σ e q = 1 2 [ ( σ 1 σ 2 ) 2 + ( σ 2 σ 3 ) 2 + ( σ 3 σ 1 ) 2   ]
where σ 1 ,   σ 2 ,   and   σ 3   are the maximum, intermediate, and minimum principal stresses, respectively.

3. Flow Field Simulation and Flow Characteristics

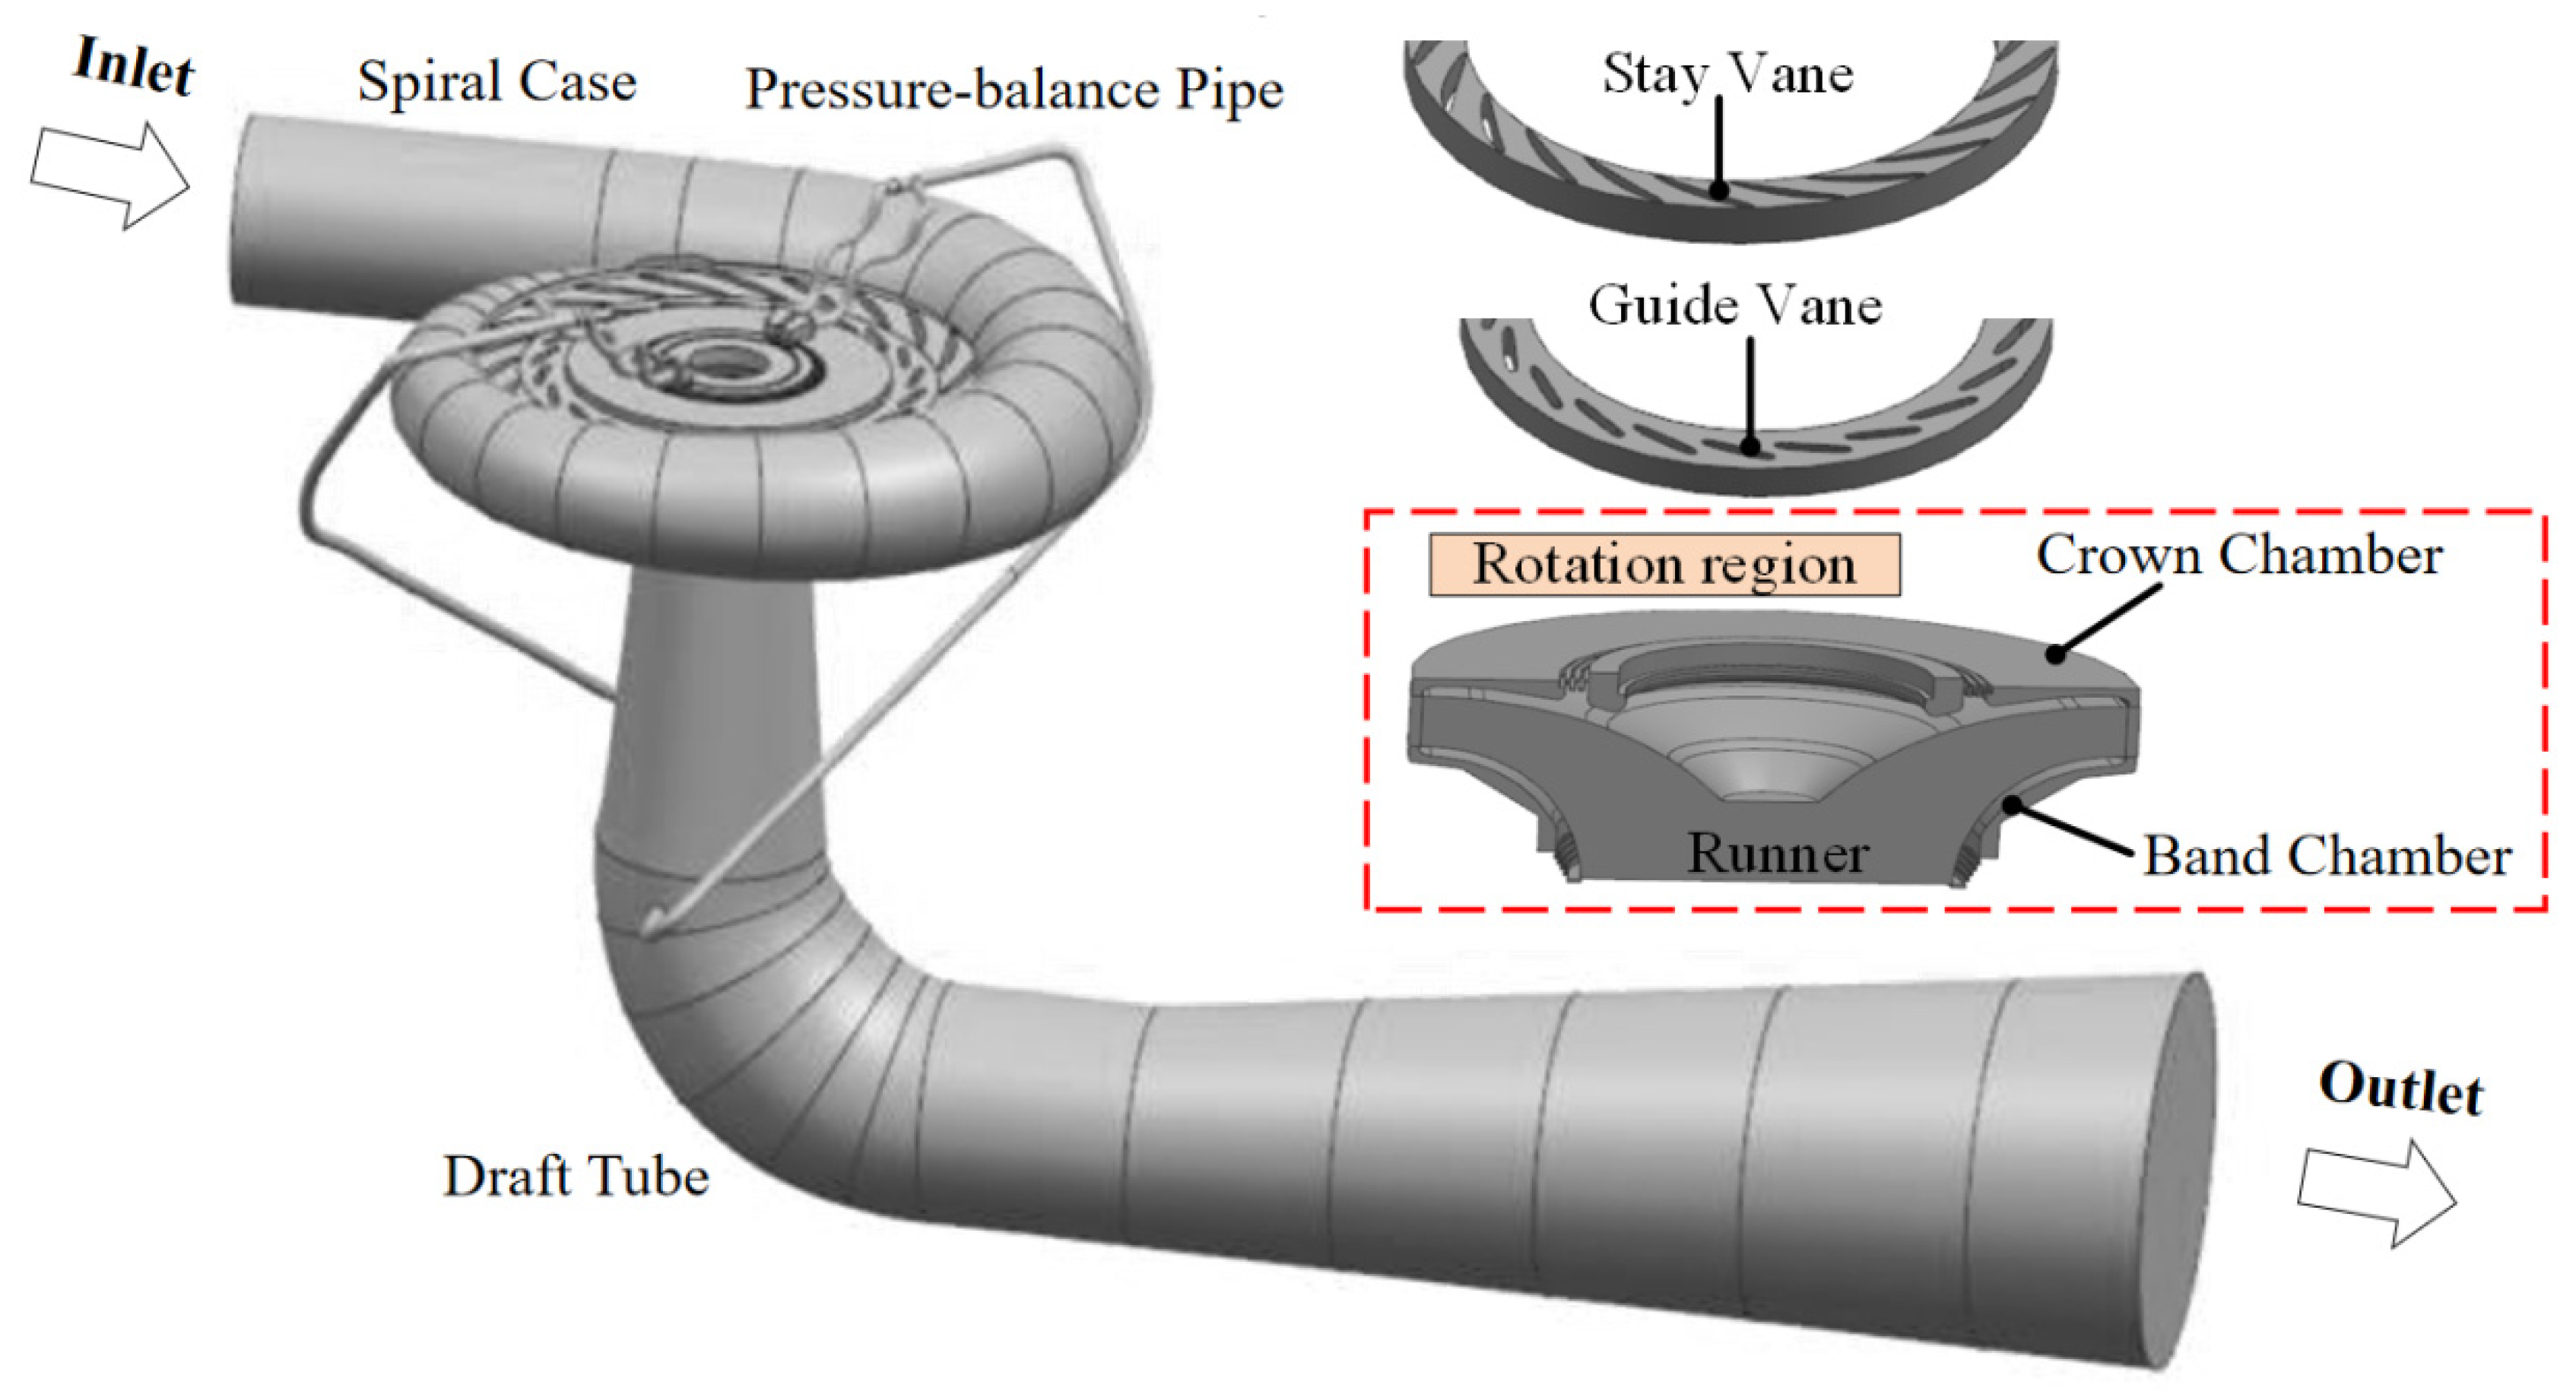
3.1. The Calculation Model and Boundary Conditions

The CAD models and the corresponding finite volume mesh shown in Figure 2 and Figure 3 were used to carry out the flow field simulation with ANSYS CFX. The rated power and rated head of the investigated PT unit are 300 MW and 340 m, respectively. The PT unit has 22 stay vanes, 22 guide vanes, and 13 runner blades, and the runner diameter is 4.6 m. The boundary conditions at the spiral case inlet and draft tube outlet were set as total pressure inlet and static pressure outlet, respectively. The other surfaces were set as no-slip walls [25,26].
The SST k-ω turbulence model, which effectively blends the k-ω and k-ε models, was used to perform the fluid dynamic calculations. The k-ω model is used to simulate the flow near the wall, while the k-ε model is used for the flow away from the wall. It gives highly accurate predictions of the onset and the amount of flow separation under adverse pressure gradients [26,27,44]. The spiral case, stay vane, guide vane, pressure-balance pipes, and draft tube were all set as stationary domains. The interface between adjacent stationary domains was set to “general connection”. The runner domain was set as the rotating domain, and the interface between the stationary domain and the rotating domain was set to “frozen-rotator”. The higher-order discretisation scheme was used to increase the accuracy of the solution. The convergence criterion for this study was that the root mean square values of the residuals of the momentum and continuity equations had to be less than 1 × 10⁻⁴.

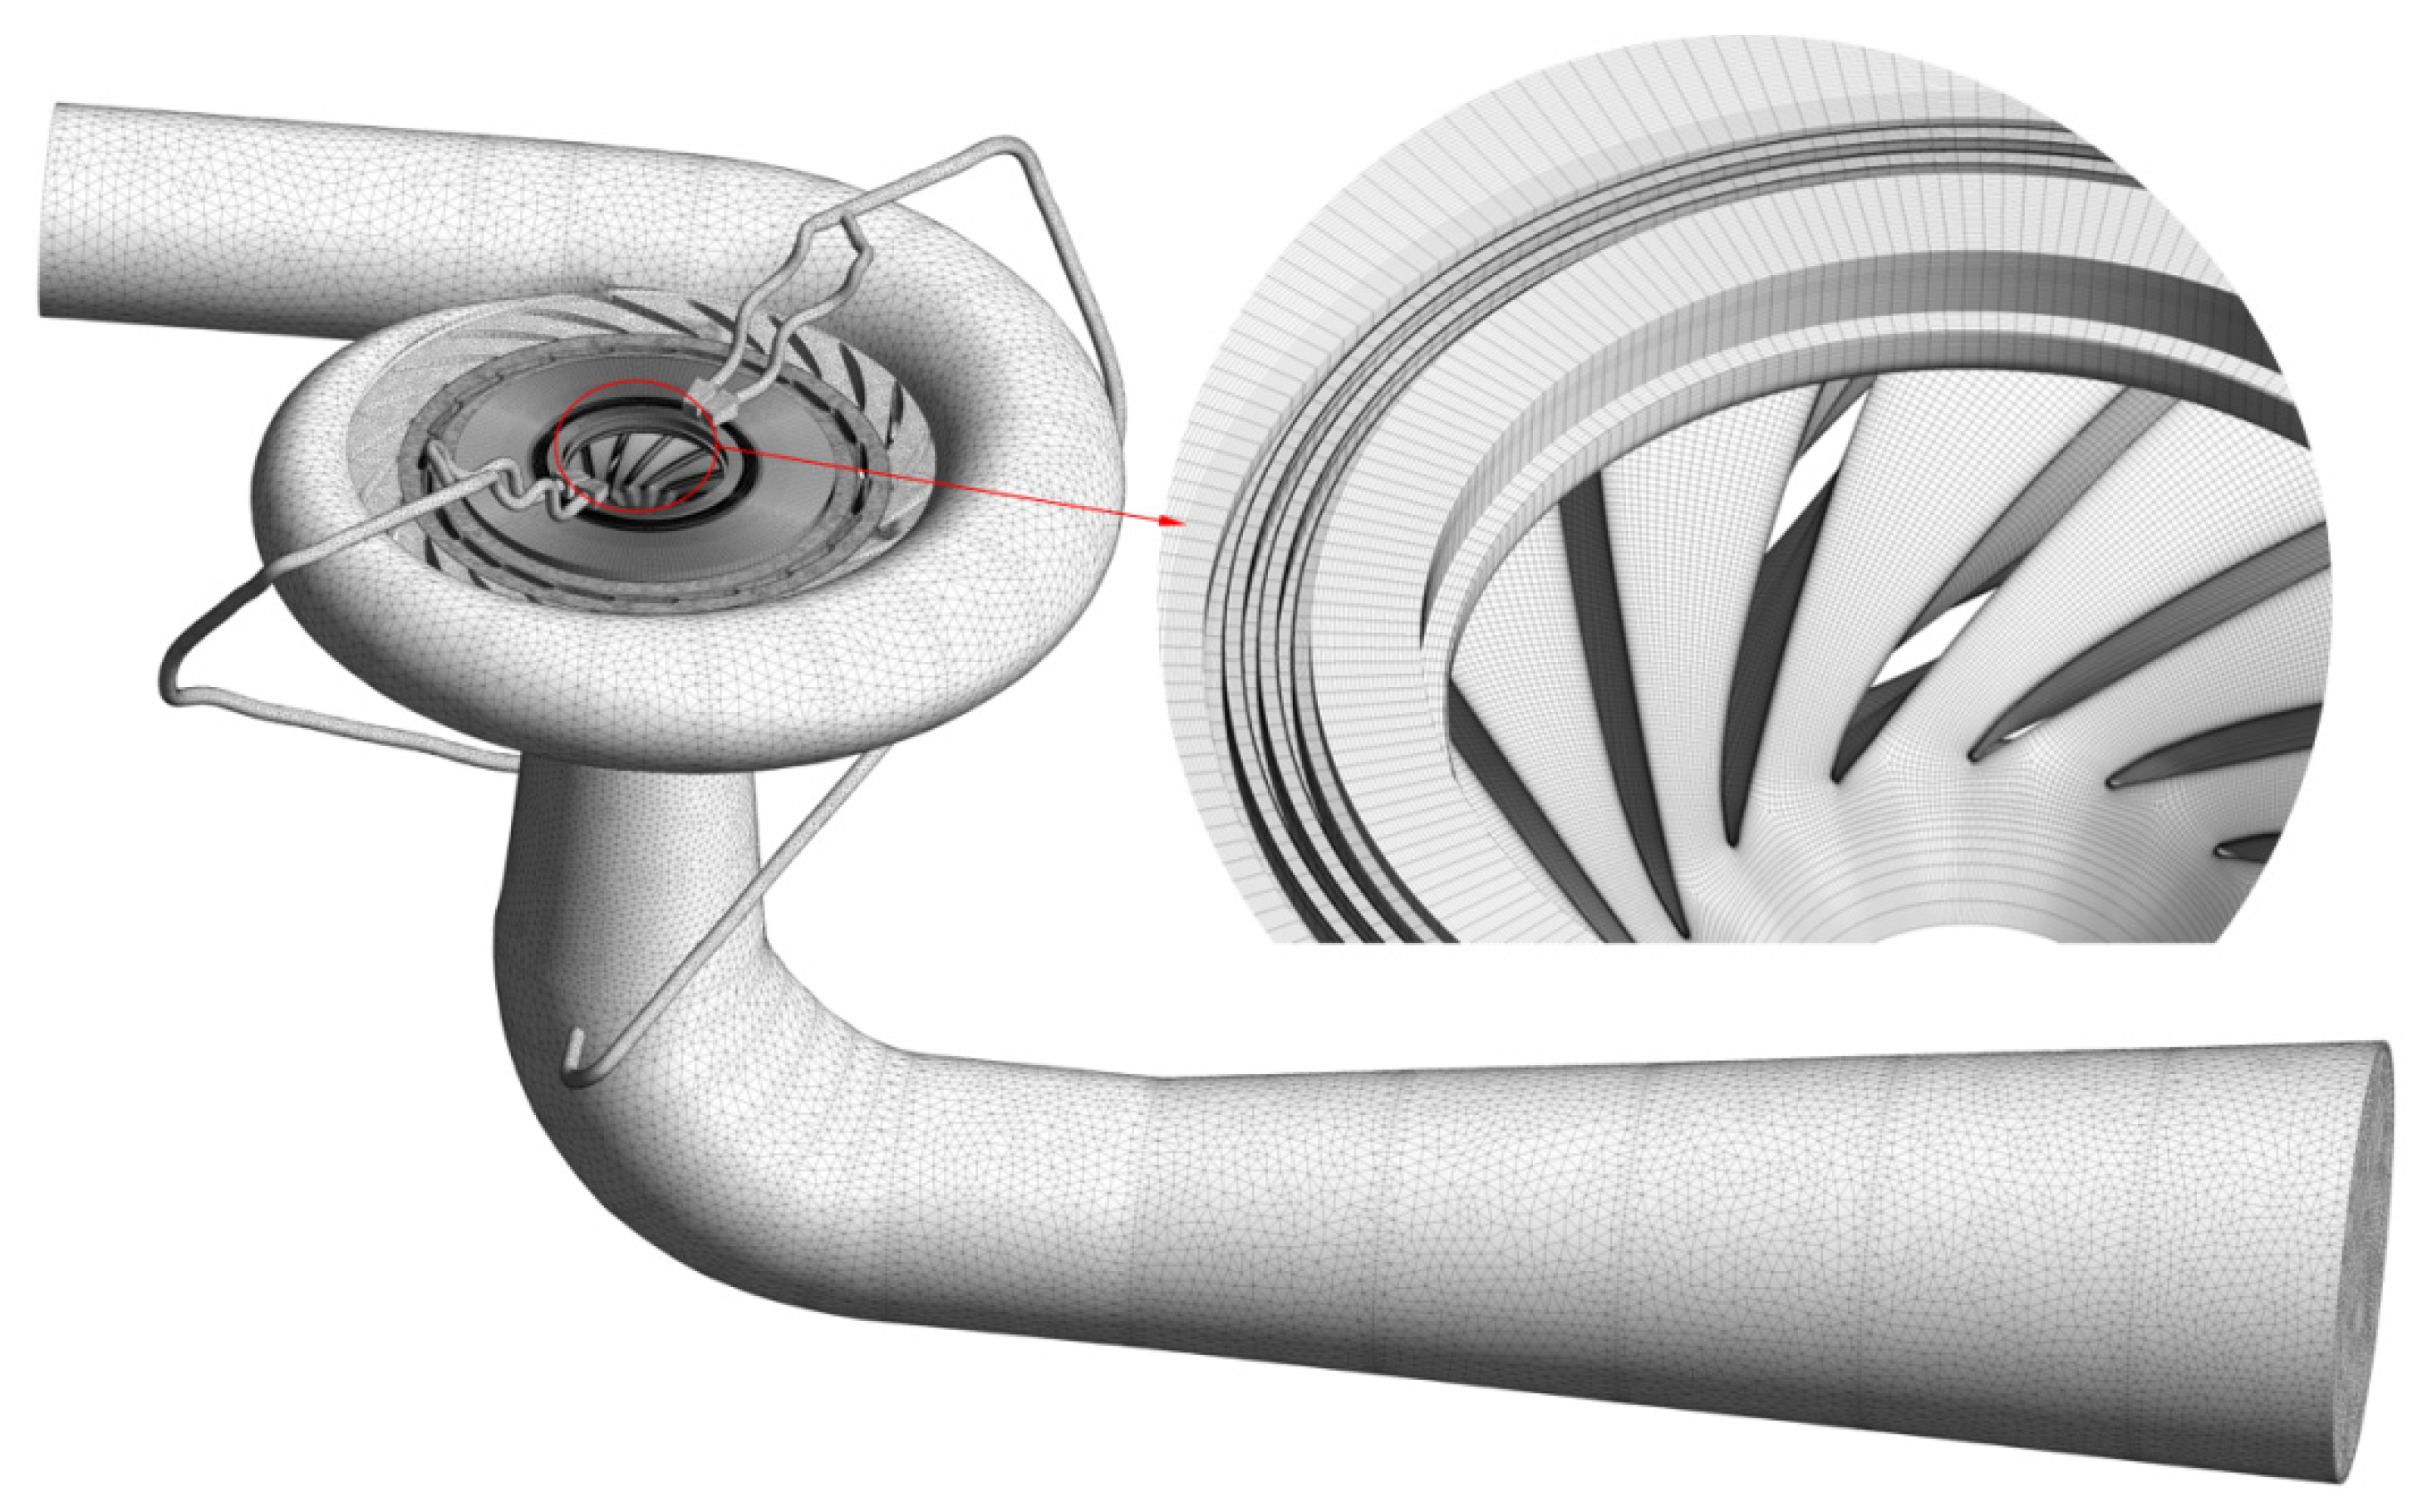
3.2. Calibration of the Finite Volume Mesh

In previous studies, we have calibrated the finite volume mesh with the test results [26]. As shown in Figure 3, a combination of tetrahedral and hexahedral mesh was established for the entire flow field of the PT unit. The meshes on the blade surfaces and the clearance labyrinth ring area have been refined. The average y+ value of the computed domain is less than 300. The calculated efficiencies with numerical simulation under different heads have been compared with the experimental results, and they basically are in agreement (Figure 4). The numerical simulation has considered the energy loss in the runner crown chamber and band chamber, so it was slightly smaller than the corresponding measured one. The element numbers of the calibrated finite volume mesh for each sub-domain are listed in Table 1. Hp is the rated head, and η max is the maximum efficiency.

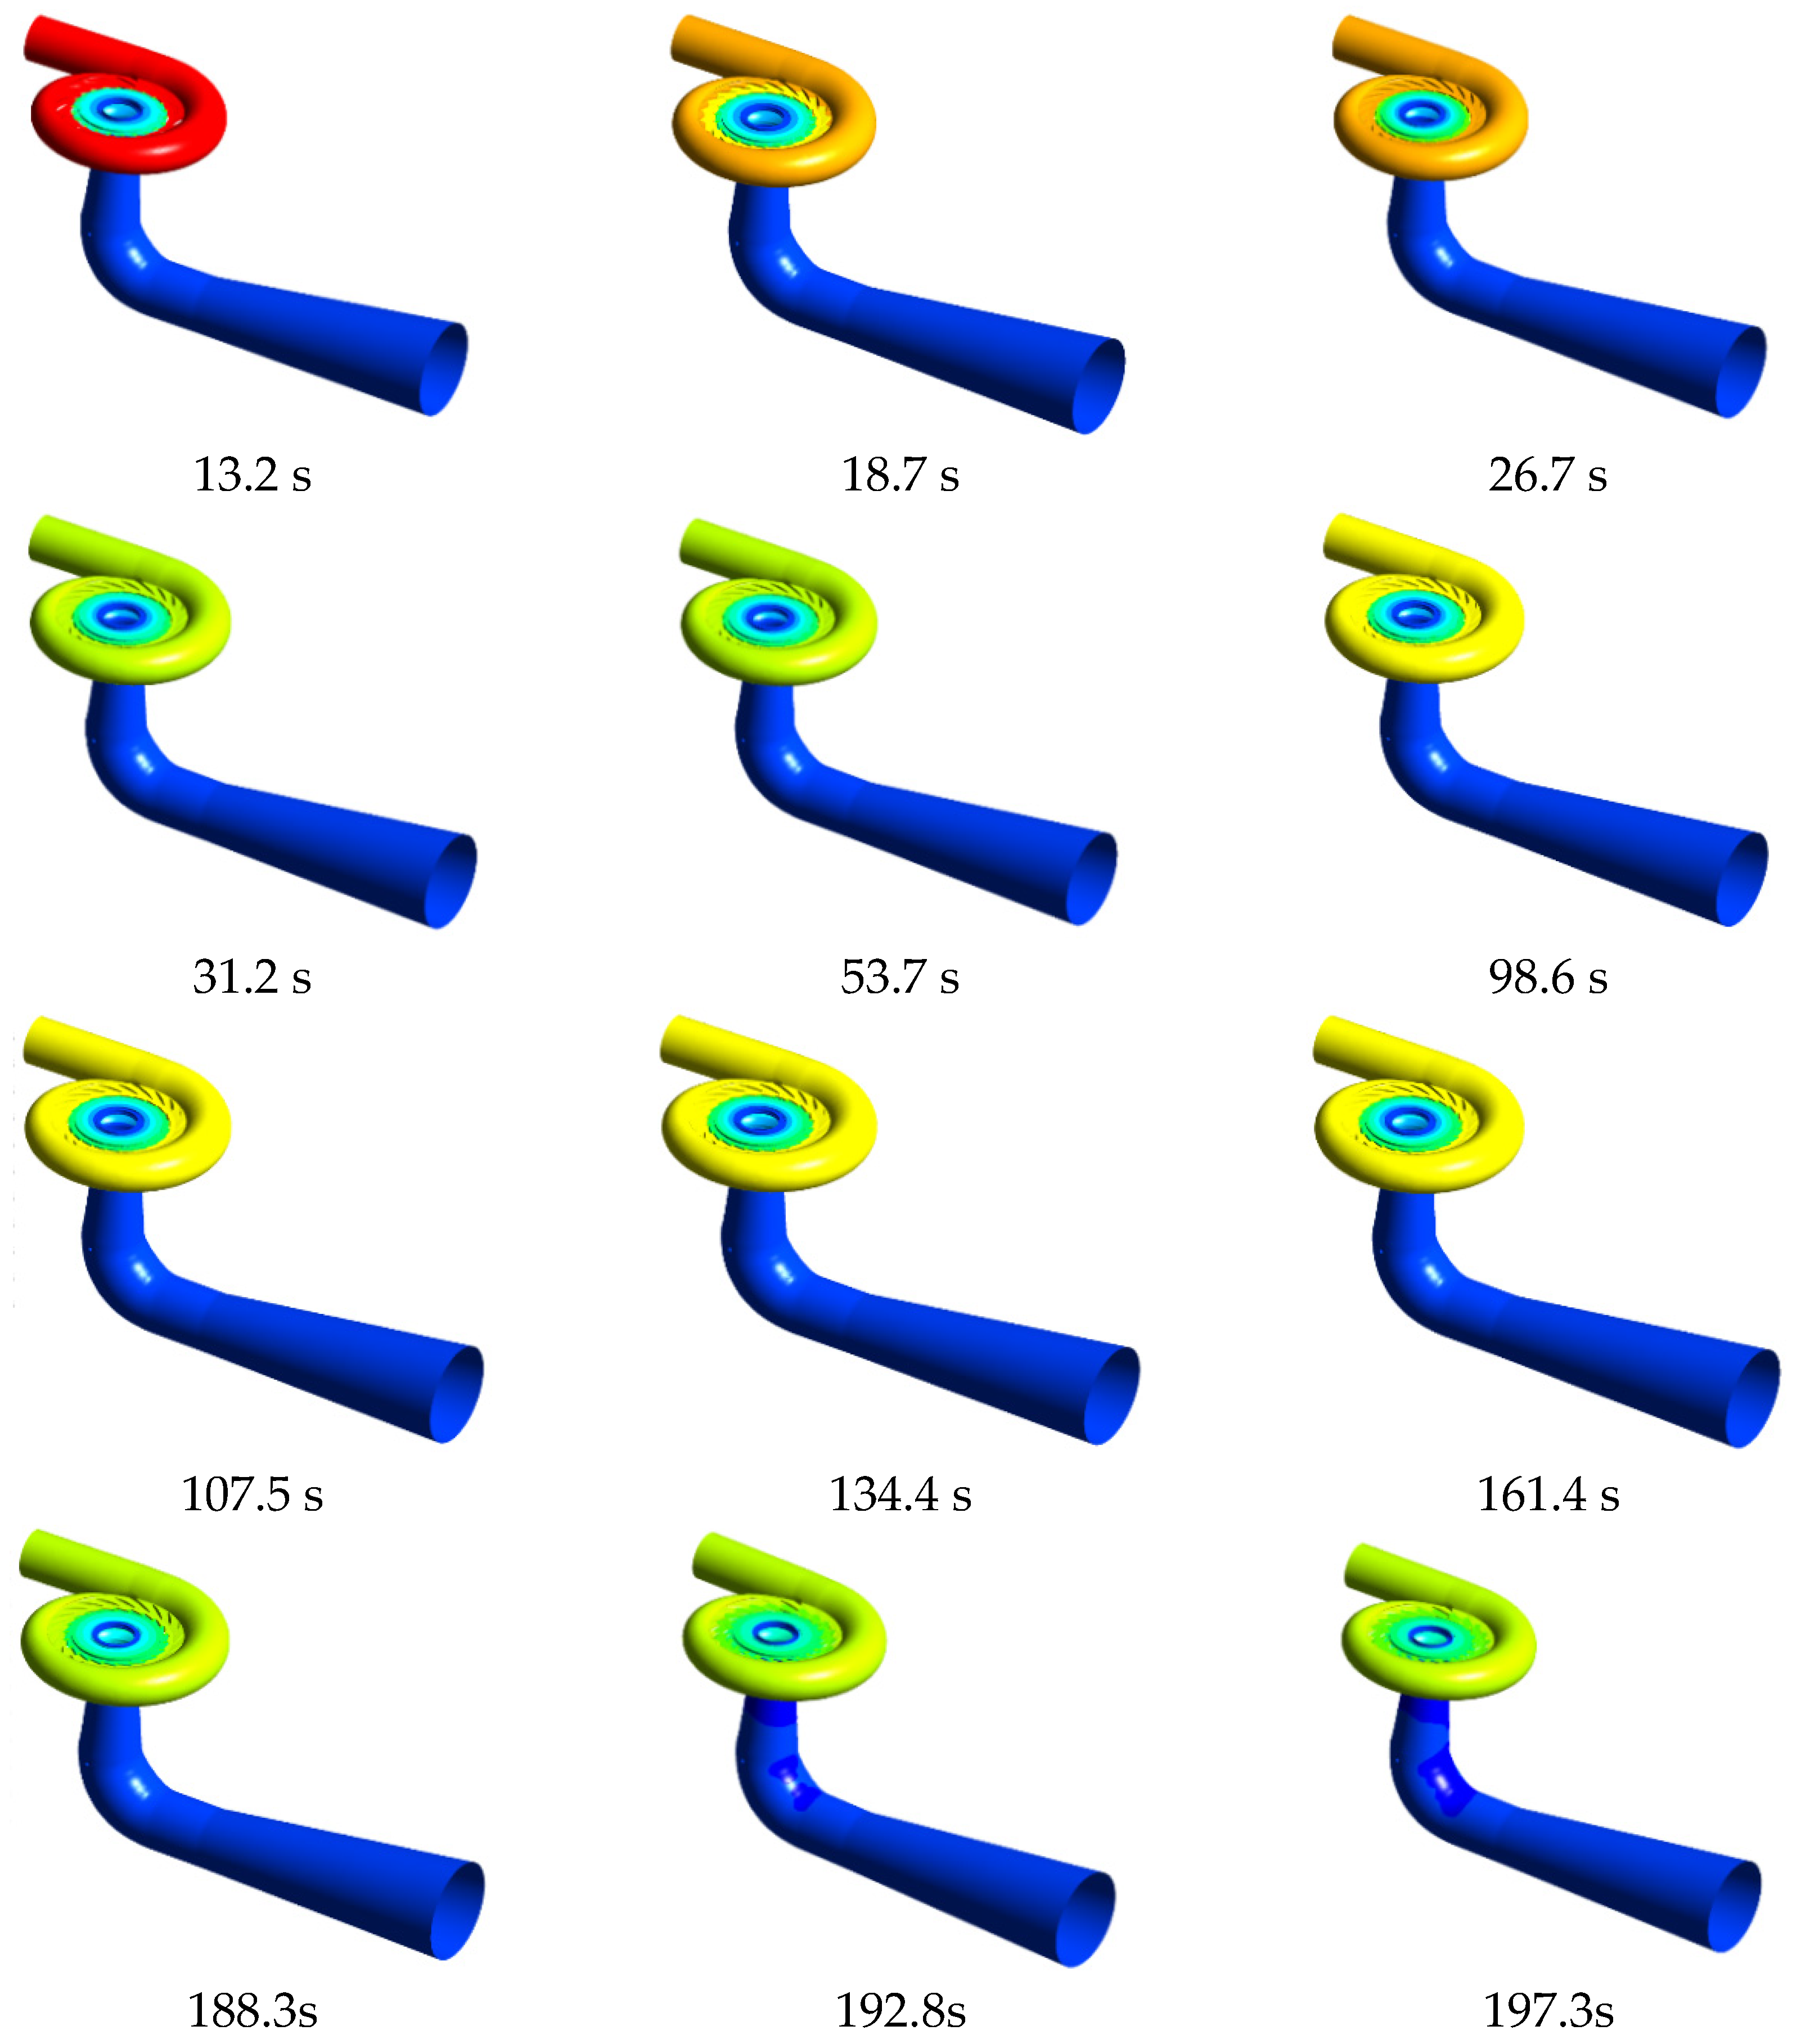
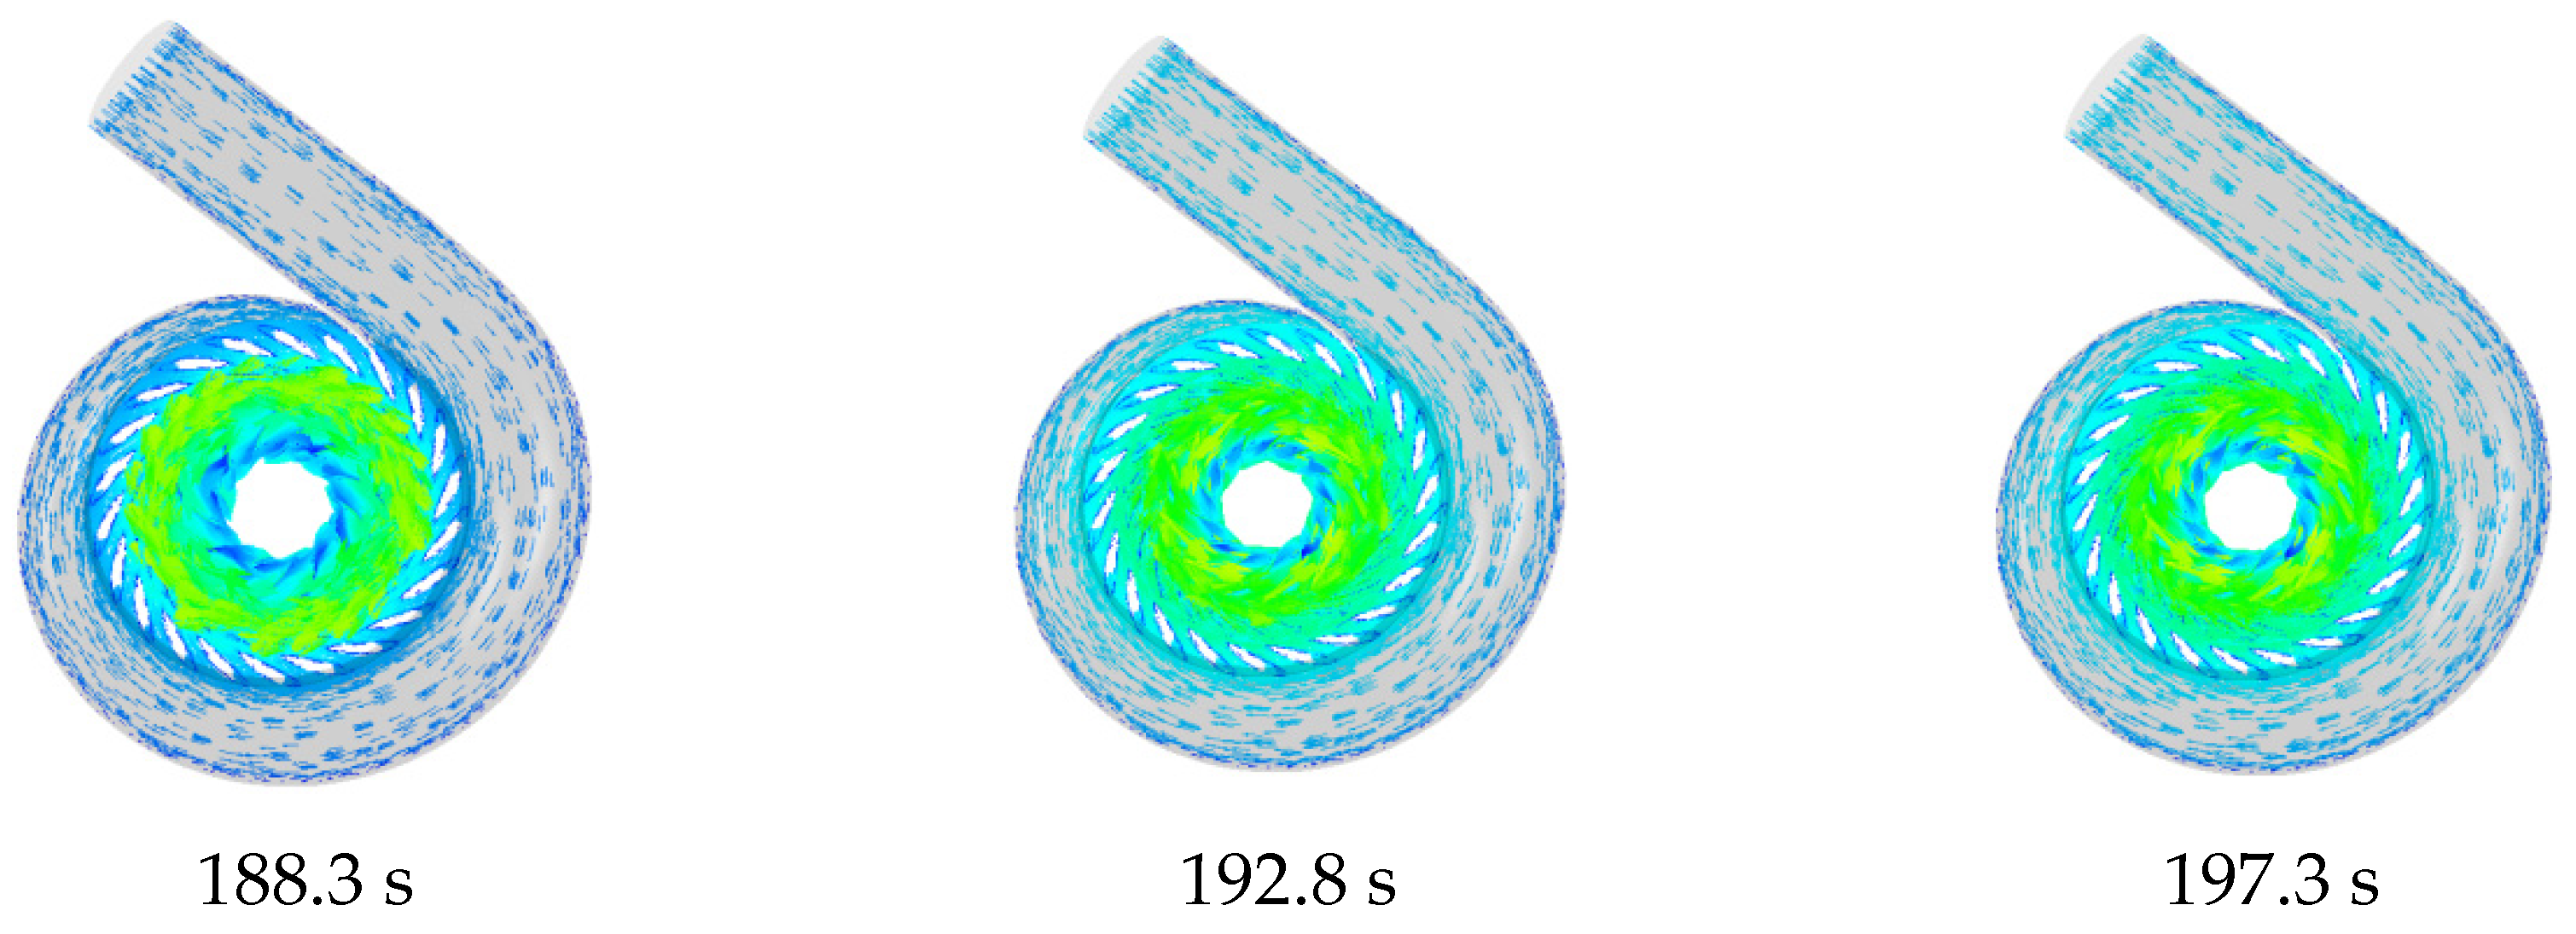
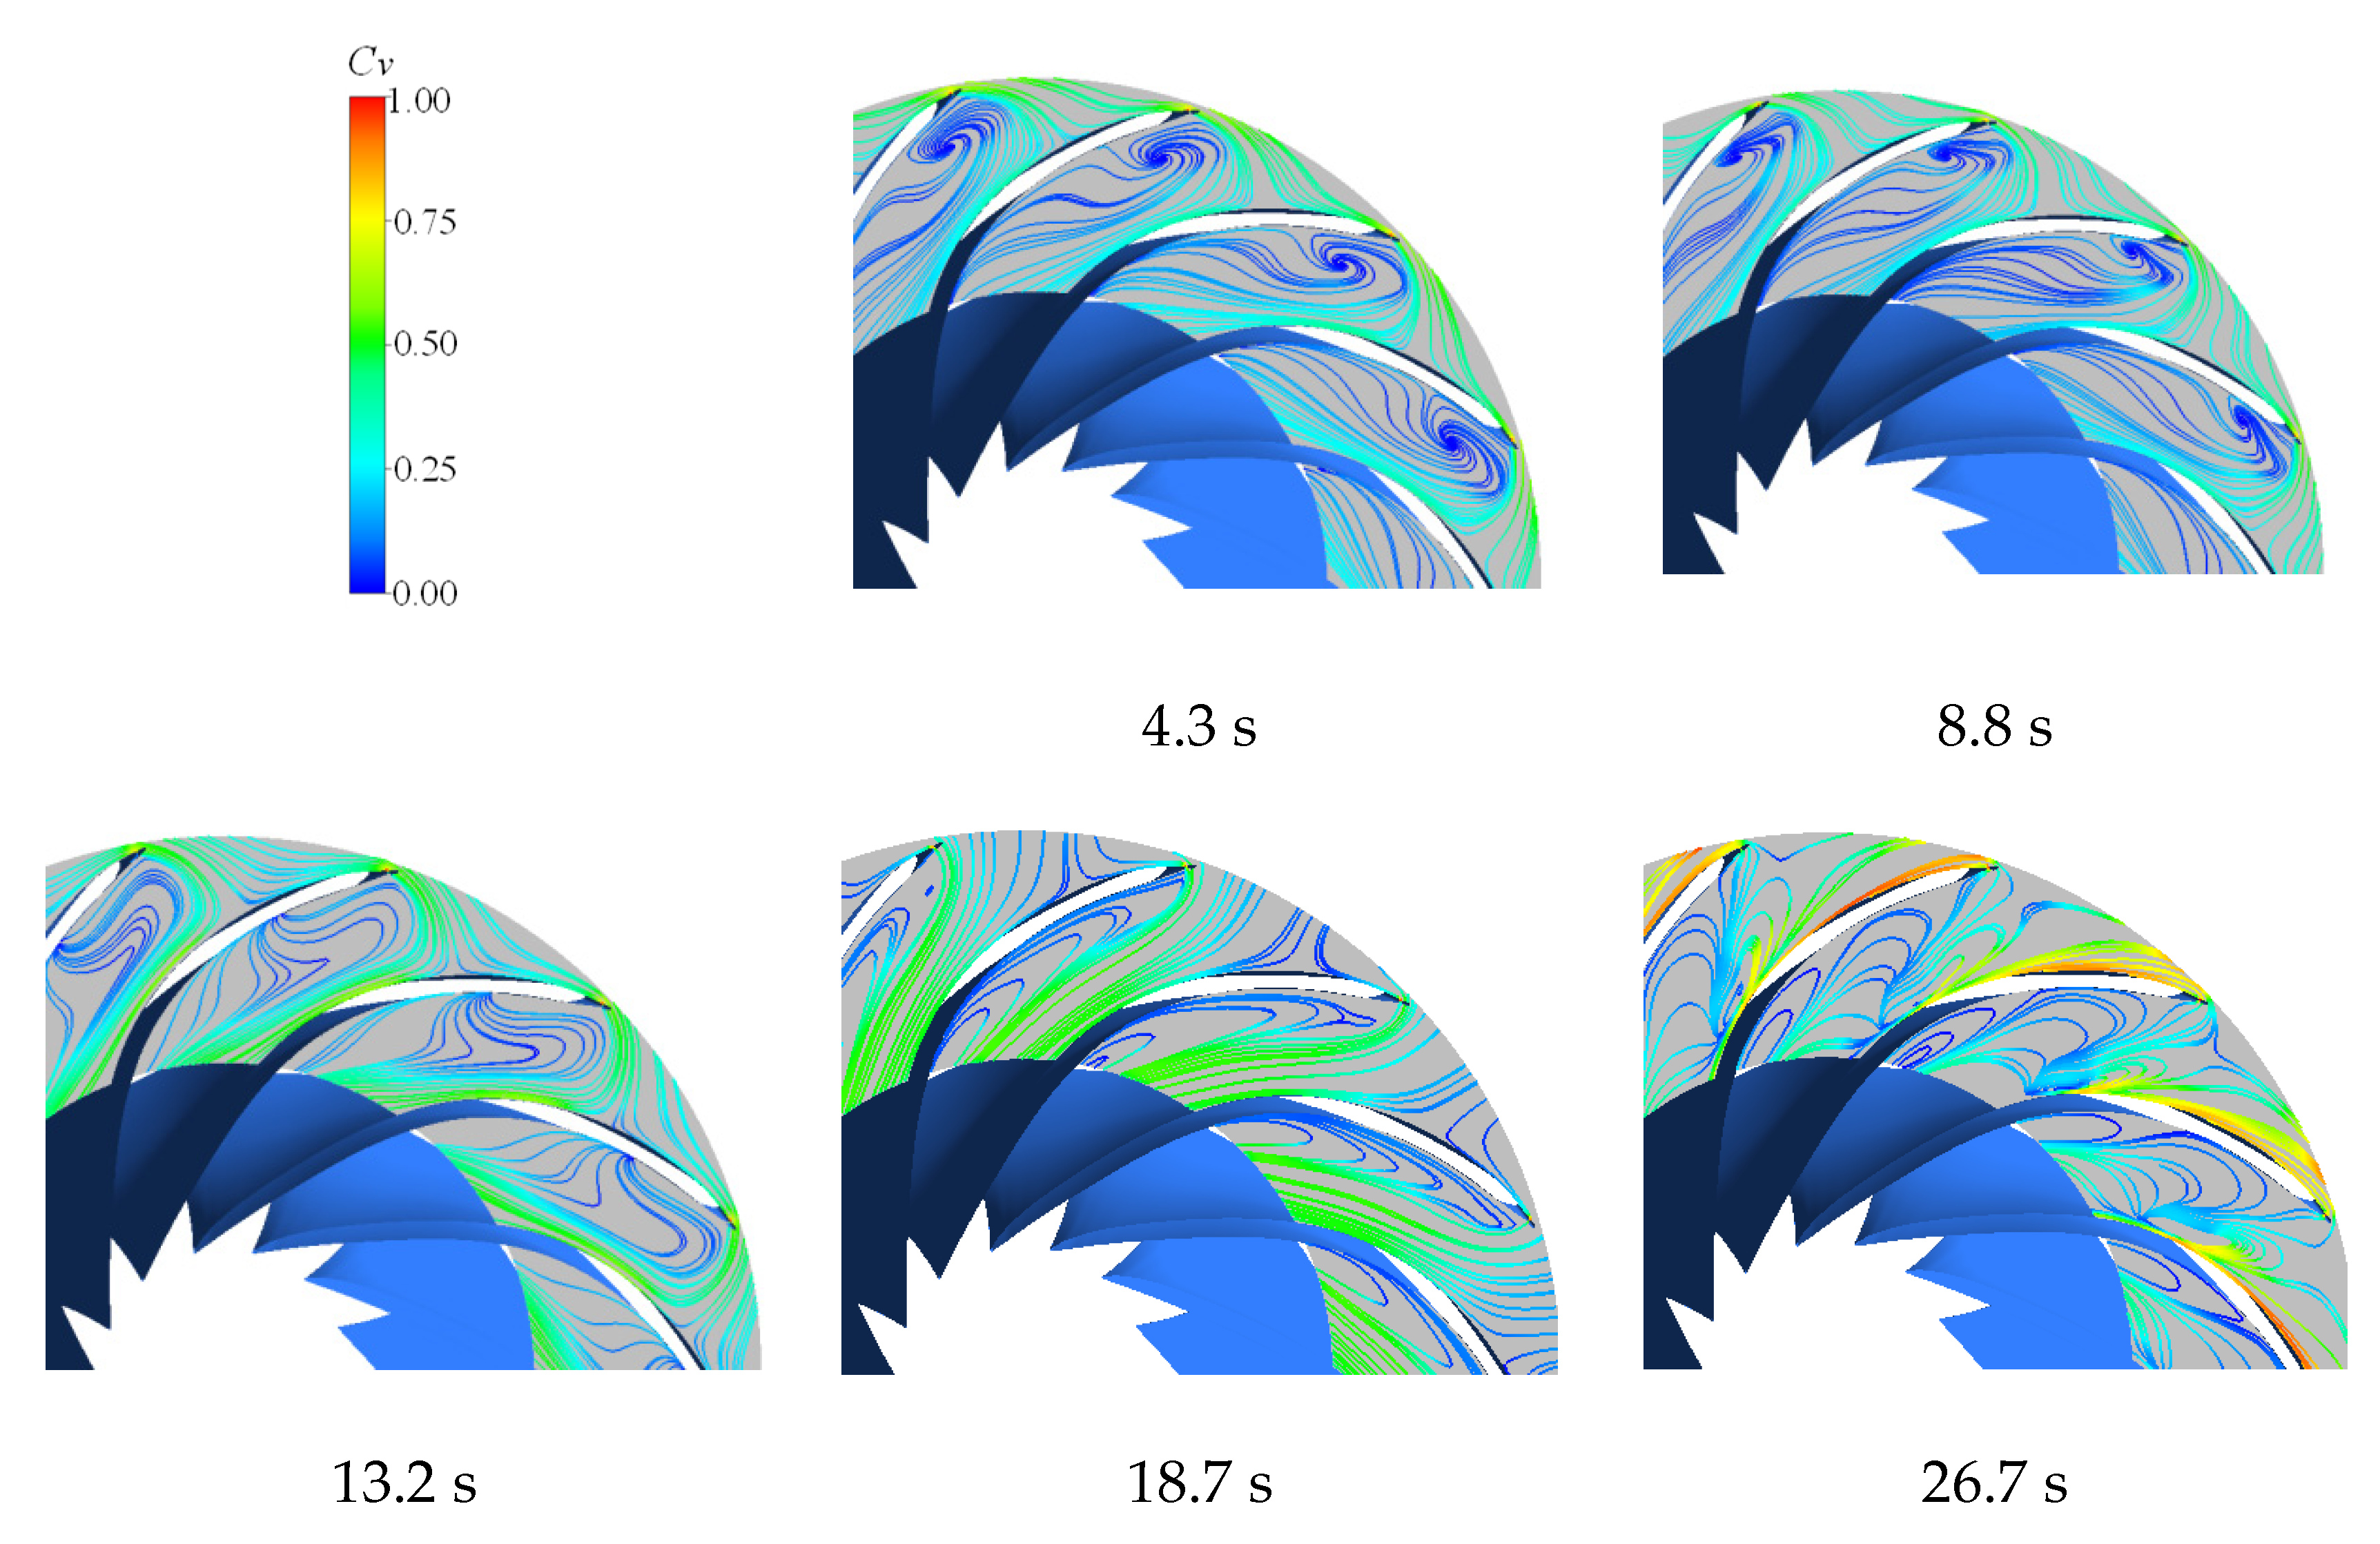
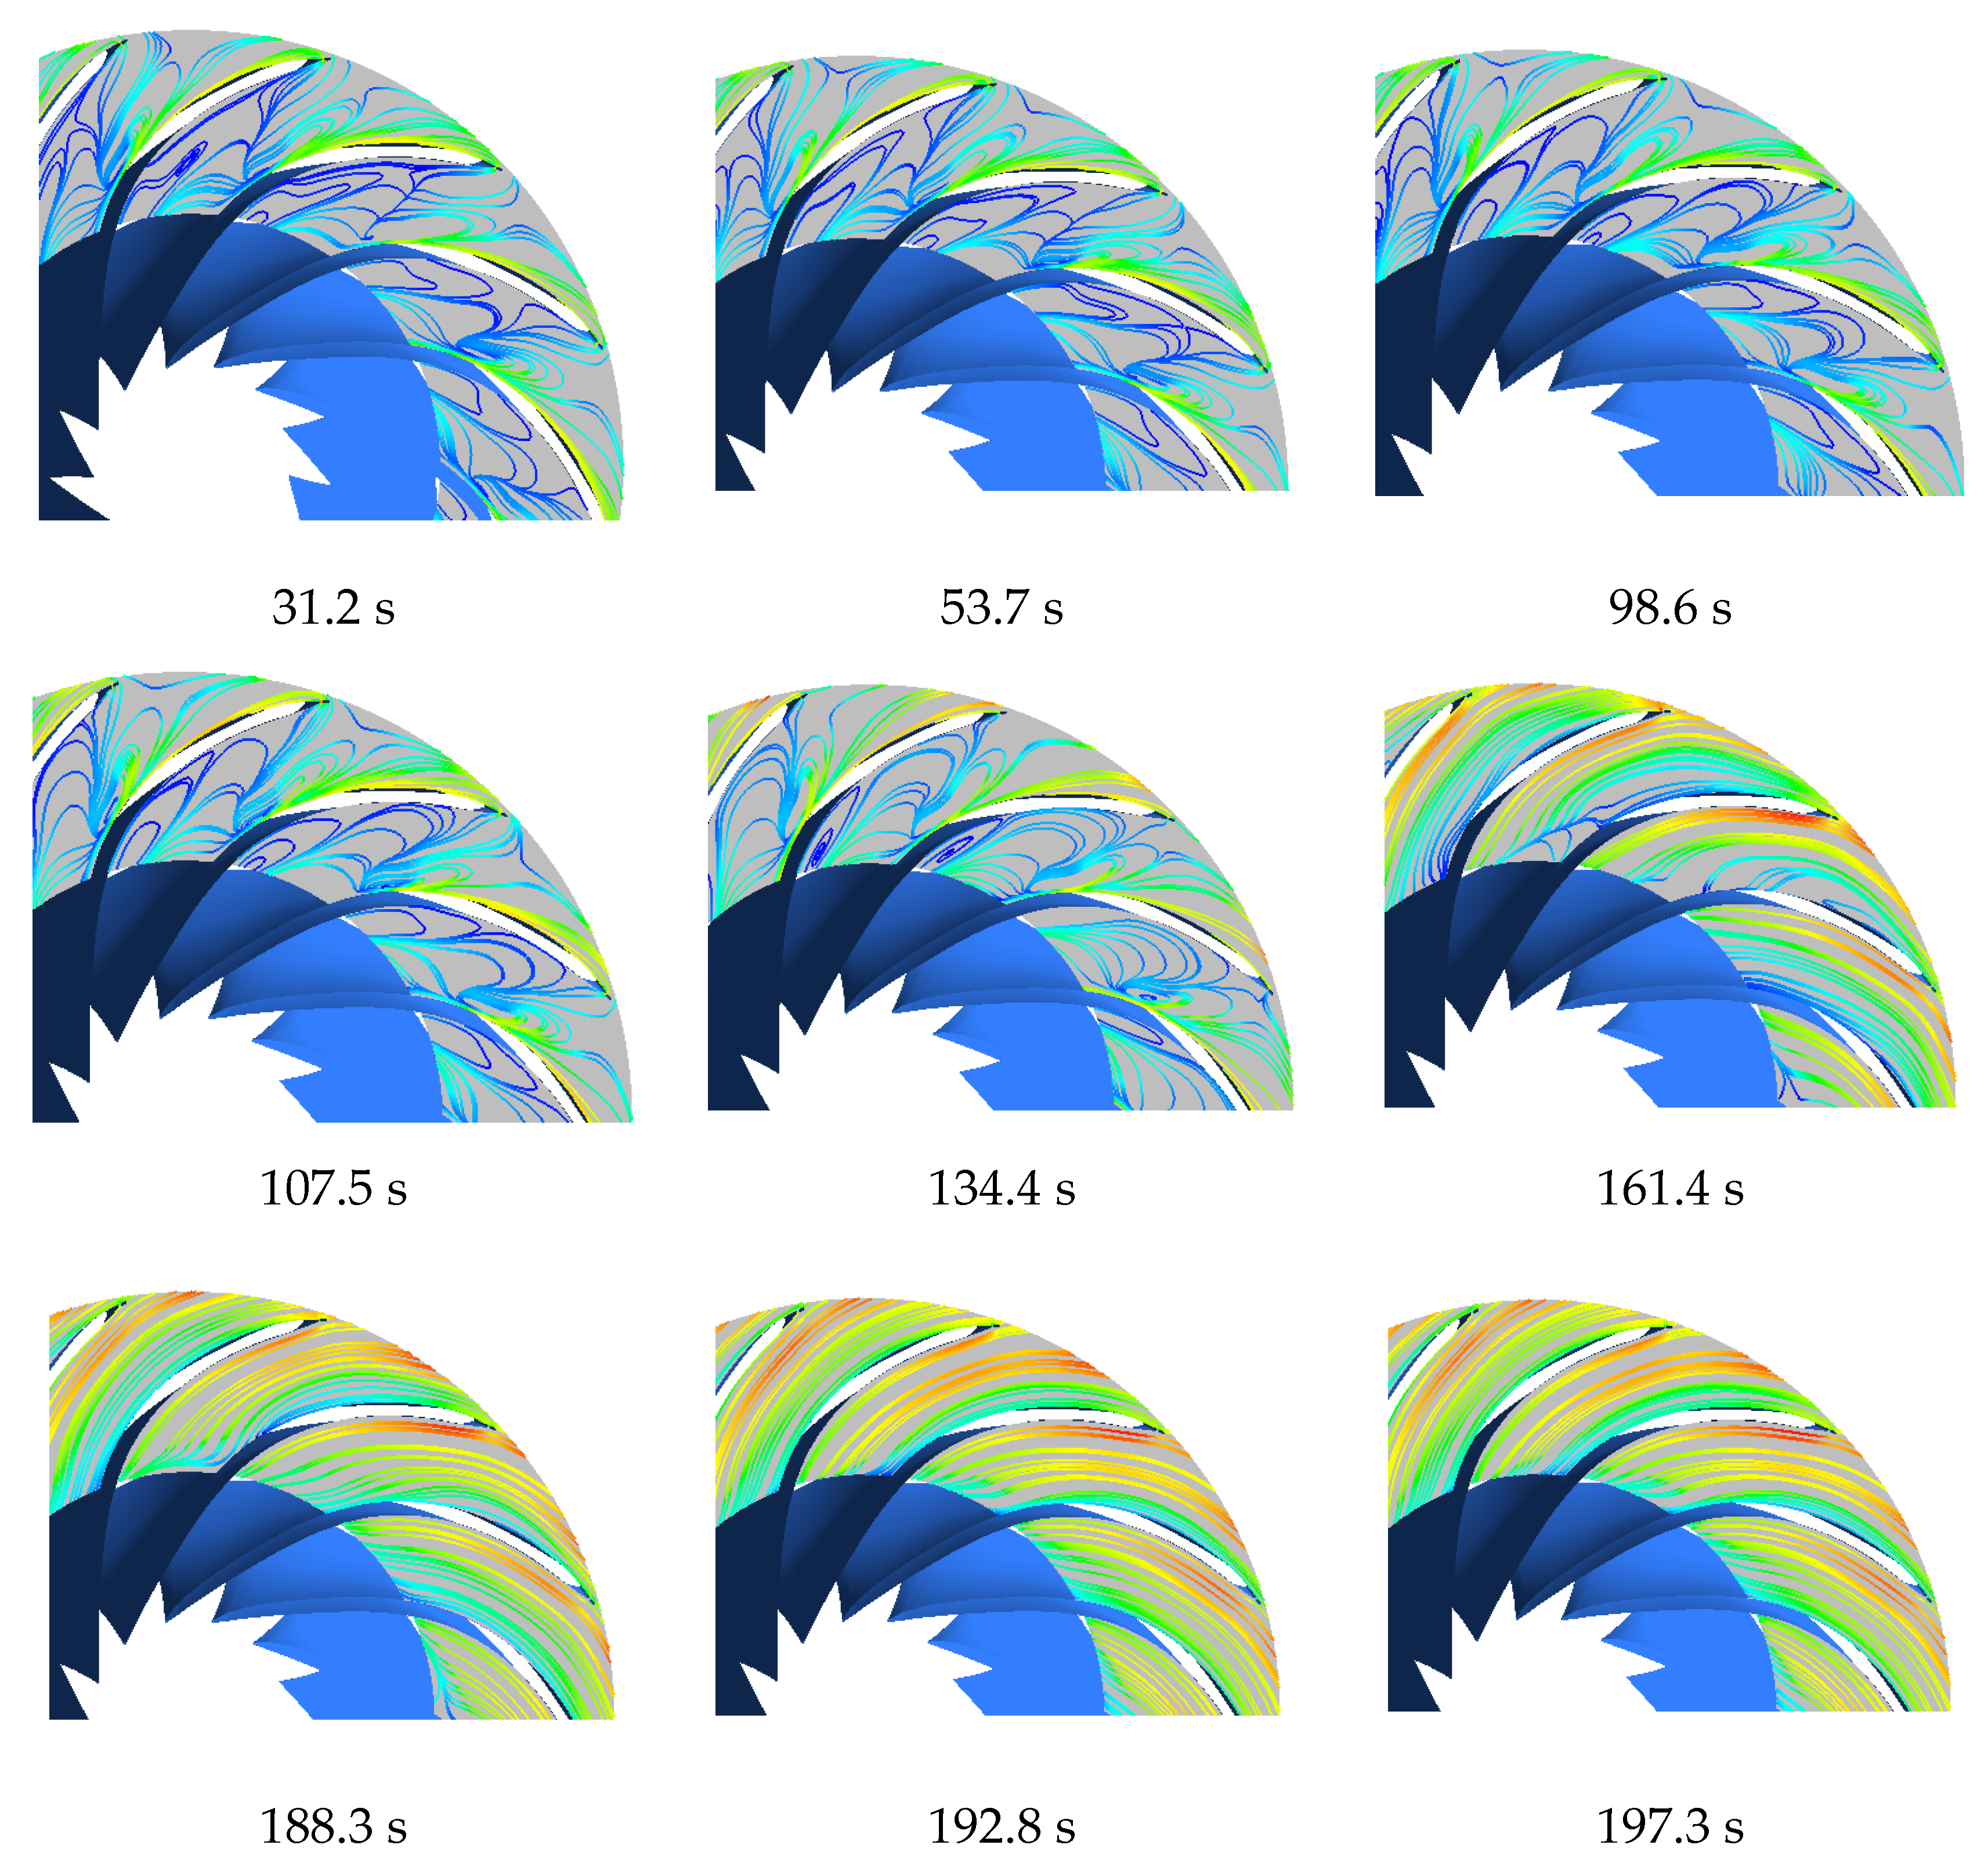
3.3. Results and Discussions

Figure 5 shows the normalised parameters, including rotational speed, guide vane opening, and flow rate of the PT unit during turbine start-up. The turbine start-up process in this investigation is in a broad sense, which includes the operating conditions of spin up, speed no-load, load increase, and 100% load. The critical time points marked with circles in Figure 5 were selected to conduct the flow field simulation.
The relative pressure distribution of the PT flow channel during turbine start-up is shown in Figure 6. It can be seen from Figure 6 that as the guide vane opening increases during turbine start-up, the flow rate gradually increases. From t = 0 s to t = 8.8 s, the pressure of the spiral case gradually increases through the stay ring to the inner surface of the head-cover. When the rotational speed is close to the rated speed, the guide vanes will be slightly closed to prevent over speed. The fluid pressure in the spiral case and stay ring area decrease significantly until t = 31.2 s. As the guide vanes open further, the speed of the turbine gradually increases. From t = 53.7 s to t = 161.4 s, the pressure on the inner surface of the spiral case, the stay ring and the head-cover increases again, and from t = 188.3 s to t = 197.3 s, the pressure slightly declines. The PT unit operates stably until the guide vane opening, the flow rate, the rotational speed and the torque of the unit no longer change, and the pressure in the flow channel remain relatively stable.
It can be seen from Figure 7 that from t = 0 s to t = 13.2 s during turbine start-up as the opening of the guide vanes increases, the flow increases, and the pressure in the area between the stay vanes and the guide vanes also increases. The high-pressure area at the trailing edge of the guide vanes the increases, while the pressure on the runner blade surface also increases. From t = 18.7 s, the high-pressure area on the trailing edges of the guide vanes reduces, and the low-pressure area appears on the blade outlet edge. When the rotating speed of the runner reaches the rated speed, the guide vane will close a little to avoid the over speed. Therefore, from t = 26.7 s on, the pressure in the area between the stay vanes and the guide vanes gradually decreases, the pressure on the trailing edge of the guide vanes decreases, and the low-pressure area on the runner blade outlet increases. After t = 53.7 s, the opening of the guide vane remains constant for a period of time, so the pressure in the channels of guide vanes and runner blades does not change much during this period. From t = 134.4 s to 197.3 s, the opening of the guide vanes increases largely, and the flow velocity increases correspondingly. The pressure in the area between the stay vanes and the guide vanes decreases, and the low-pressure area on the blade surface reduces.
Figure 8 shows the normalised velocity characteristics of the flow in the PT unit at various time points during turbine start-up. As the guide vane opening increases, the flow rate from the spiral case to the runner increases. Due to the small opening of the guide vanes, a high-speed circulation is formed in the vaneless area, and the maximum velocity appears at t = 8.8 s, as shown in Figure 8. When the speed approaches the rated speed, the guide vanes will be closed slightly and the rotational speed of the PT will decrease until 31.2 s. As the guide vanes open further from t = 107.5 s, the velocity from the spiral case inlet to the runner outlet increases gradually, and the velocity distributions within the guide vane and the runner become more uniform.
Figure 9 shows the flow changes in the runner during start-up. When the machine has just been turned on, the opening of the guide vanes is quite small, and the vortexes are generated in the blade channels at the runner inlet side. As the opening of the guide vanes increases, the vortexes at the runner inlet side decrease, and at t = 18.7 s, the vortexes are located in the middle of the runner blade channels. At t = 26.7 s, the opening of the guide vane is slightly closed, and the vortex structure in the runner blade channels becomes complicated. The opening of the guide vanes basically remains constant until 107.5 s, and the flow in the runner does not change much during this period either. After t = 134.4 s, the opening of the guide vanes increases largely, the vortex area in the runner flow passage decreases, and the streamline becomes smoother gradually.

4. Flow-Induced Stress Analysis

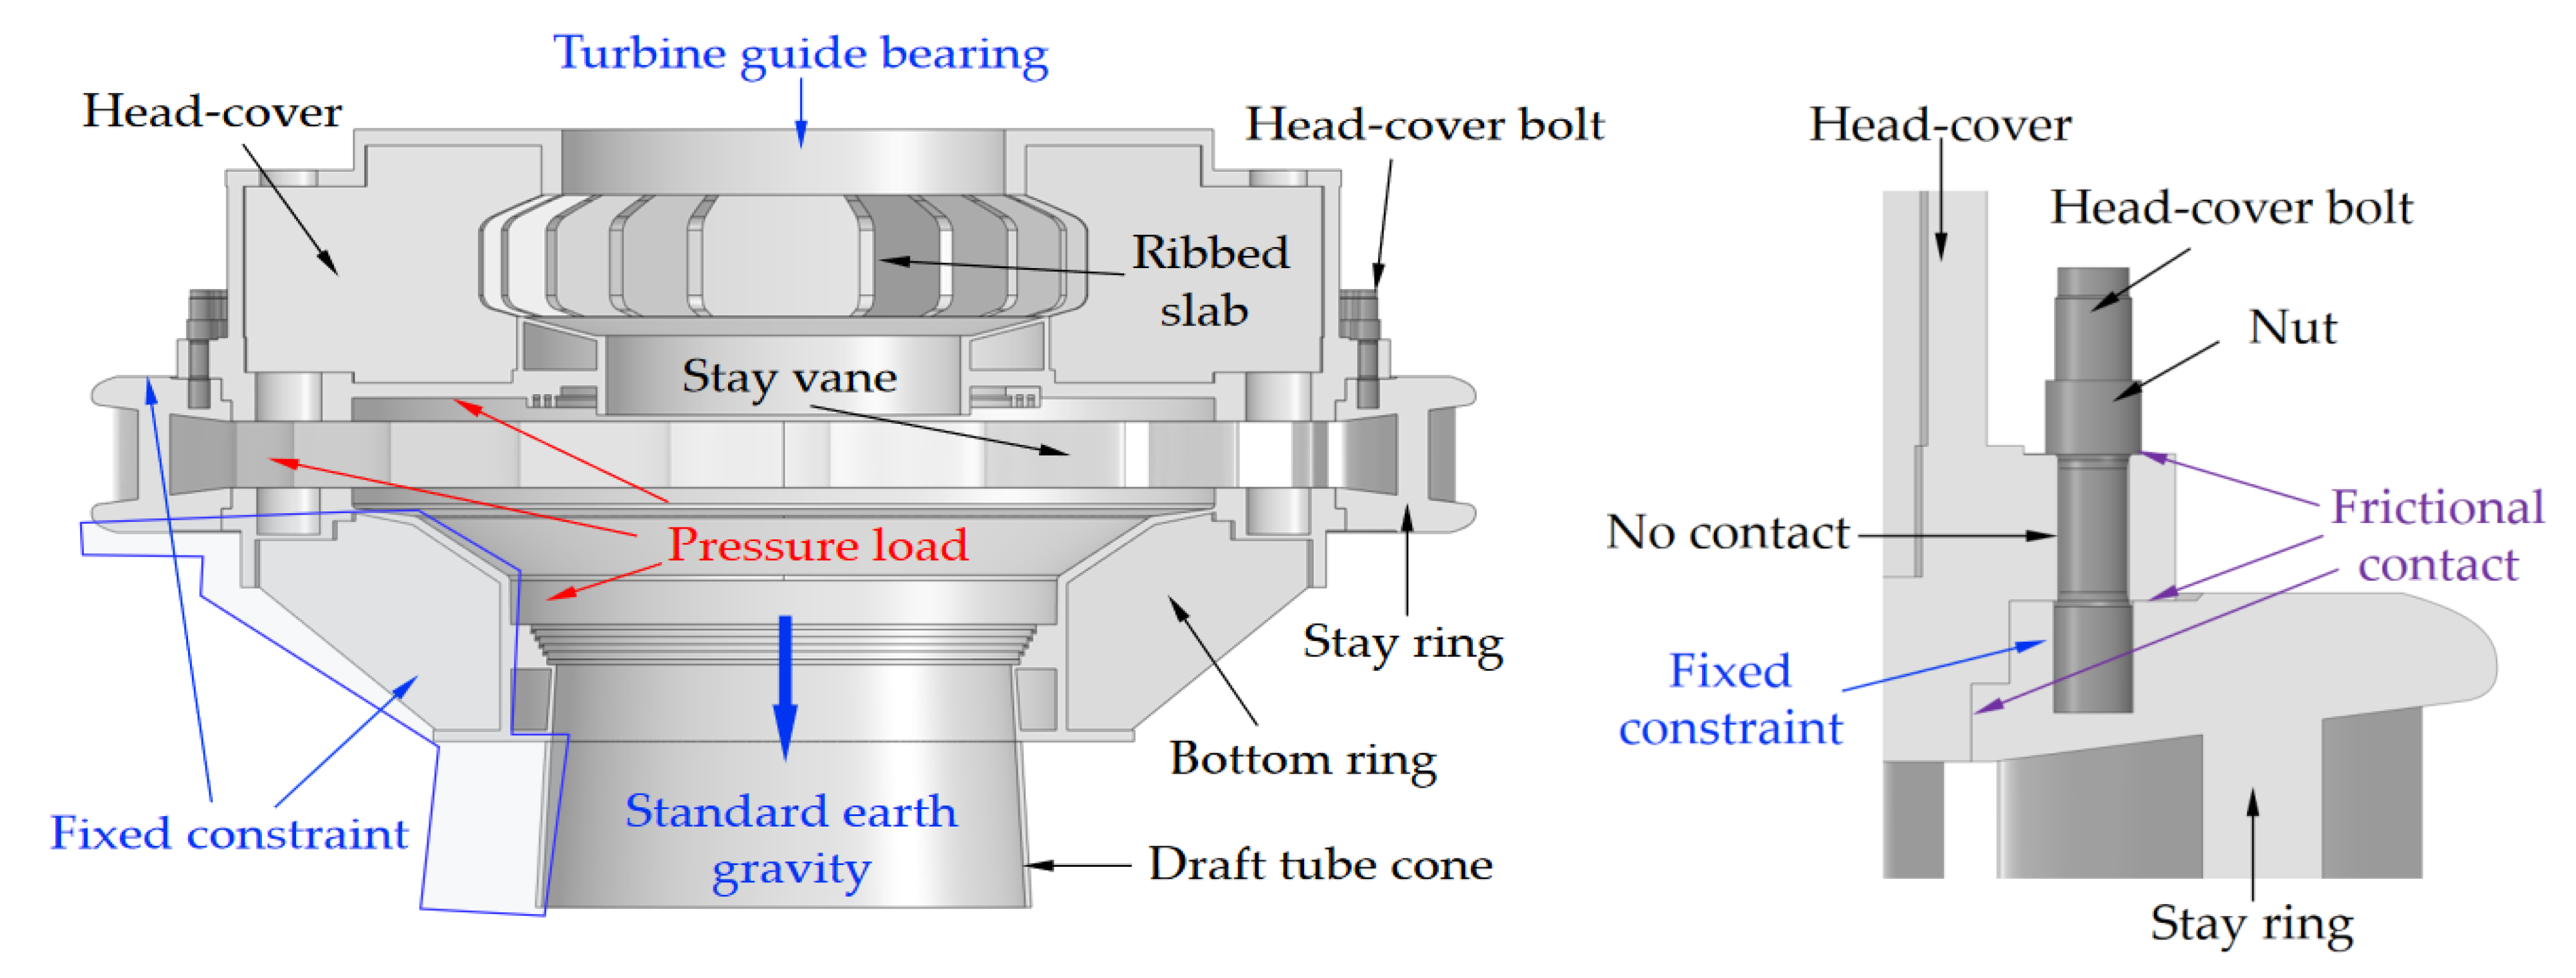
4.1. The Calculation Model and Boundary Conditions

Flow-induced stress analysis has been conducted with ANSYS Mechanical. The material and mechanical properties of the research object were configured according to Table 2.
The CAD model of the head-cover, stay ring, bottom ring, draft tube cone, and head-cover bolts (M115), as well as the boundary conditions, are shown in Figure 10. The head-cover has 20 ribbed slabs and 88 head-cover bolts.
The stay ring, bottom ring, and draft tube cone were considered as an integral structure and fixed in the concrete. The connection surface between the structure and the concrete was designated as a fixed constraint. The standard earth gravity was applied to the structures, and the stiffness coefficient of turbine guide bearing was 1 × 10⁹ N·m1.
The head-cover and the stay ring shall be assembled by the head-cover bolts with preloads before filling the high-pressure water in the flow channel of the PT unit so that the head-cover is able to hold the guide vanes and labyrinth seals to form a flow channel. Therefore, the surfaces between the head-cover and the stay ring, and the surfaces between the nuts and the head-cover, are set as frictional contacts, where the friction coefficient is 0.1. Since the bolt shank diameter is slightly smaller than the bolt-hole in the head-cover, there is no contact between the bolt middle section of the bolt and the bolt-hole. Bolt thread details are not included in this study, and the surface between the bolt thread section and the stay ring is set as a fixed constraint. The contact surfaces between the nuts and the head-cover bolts are also assigned as fixed constraints.

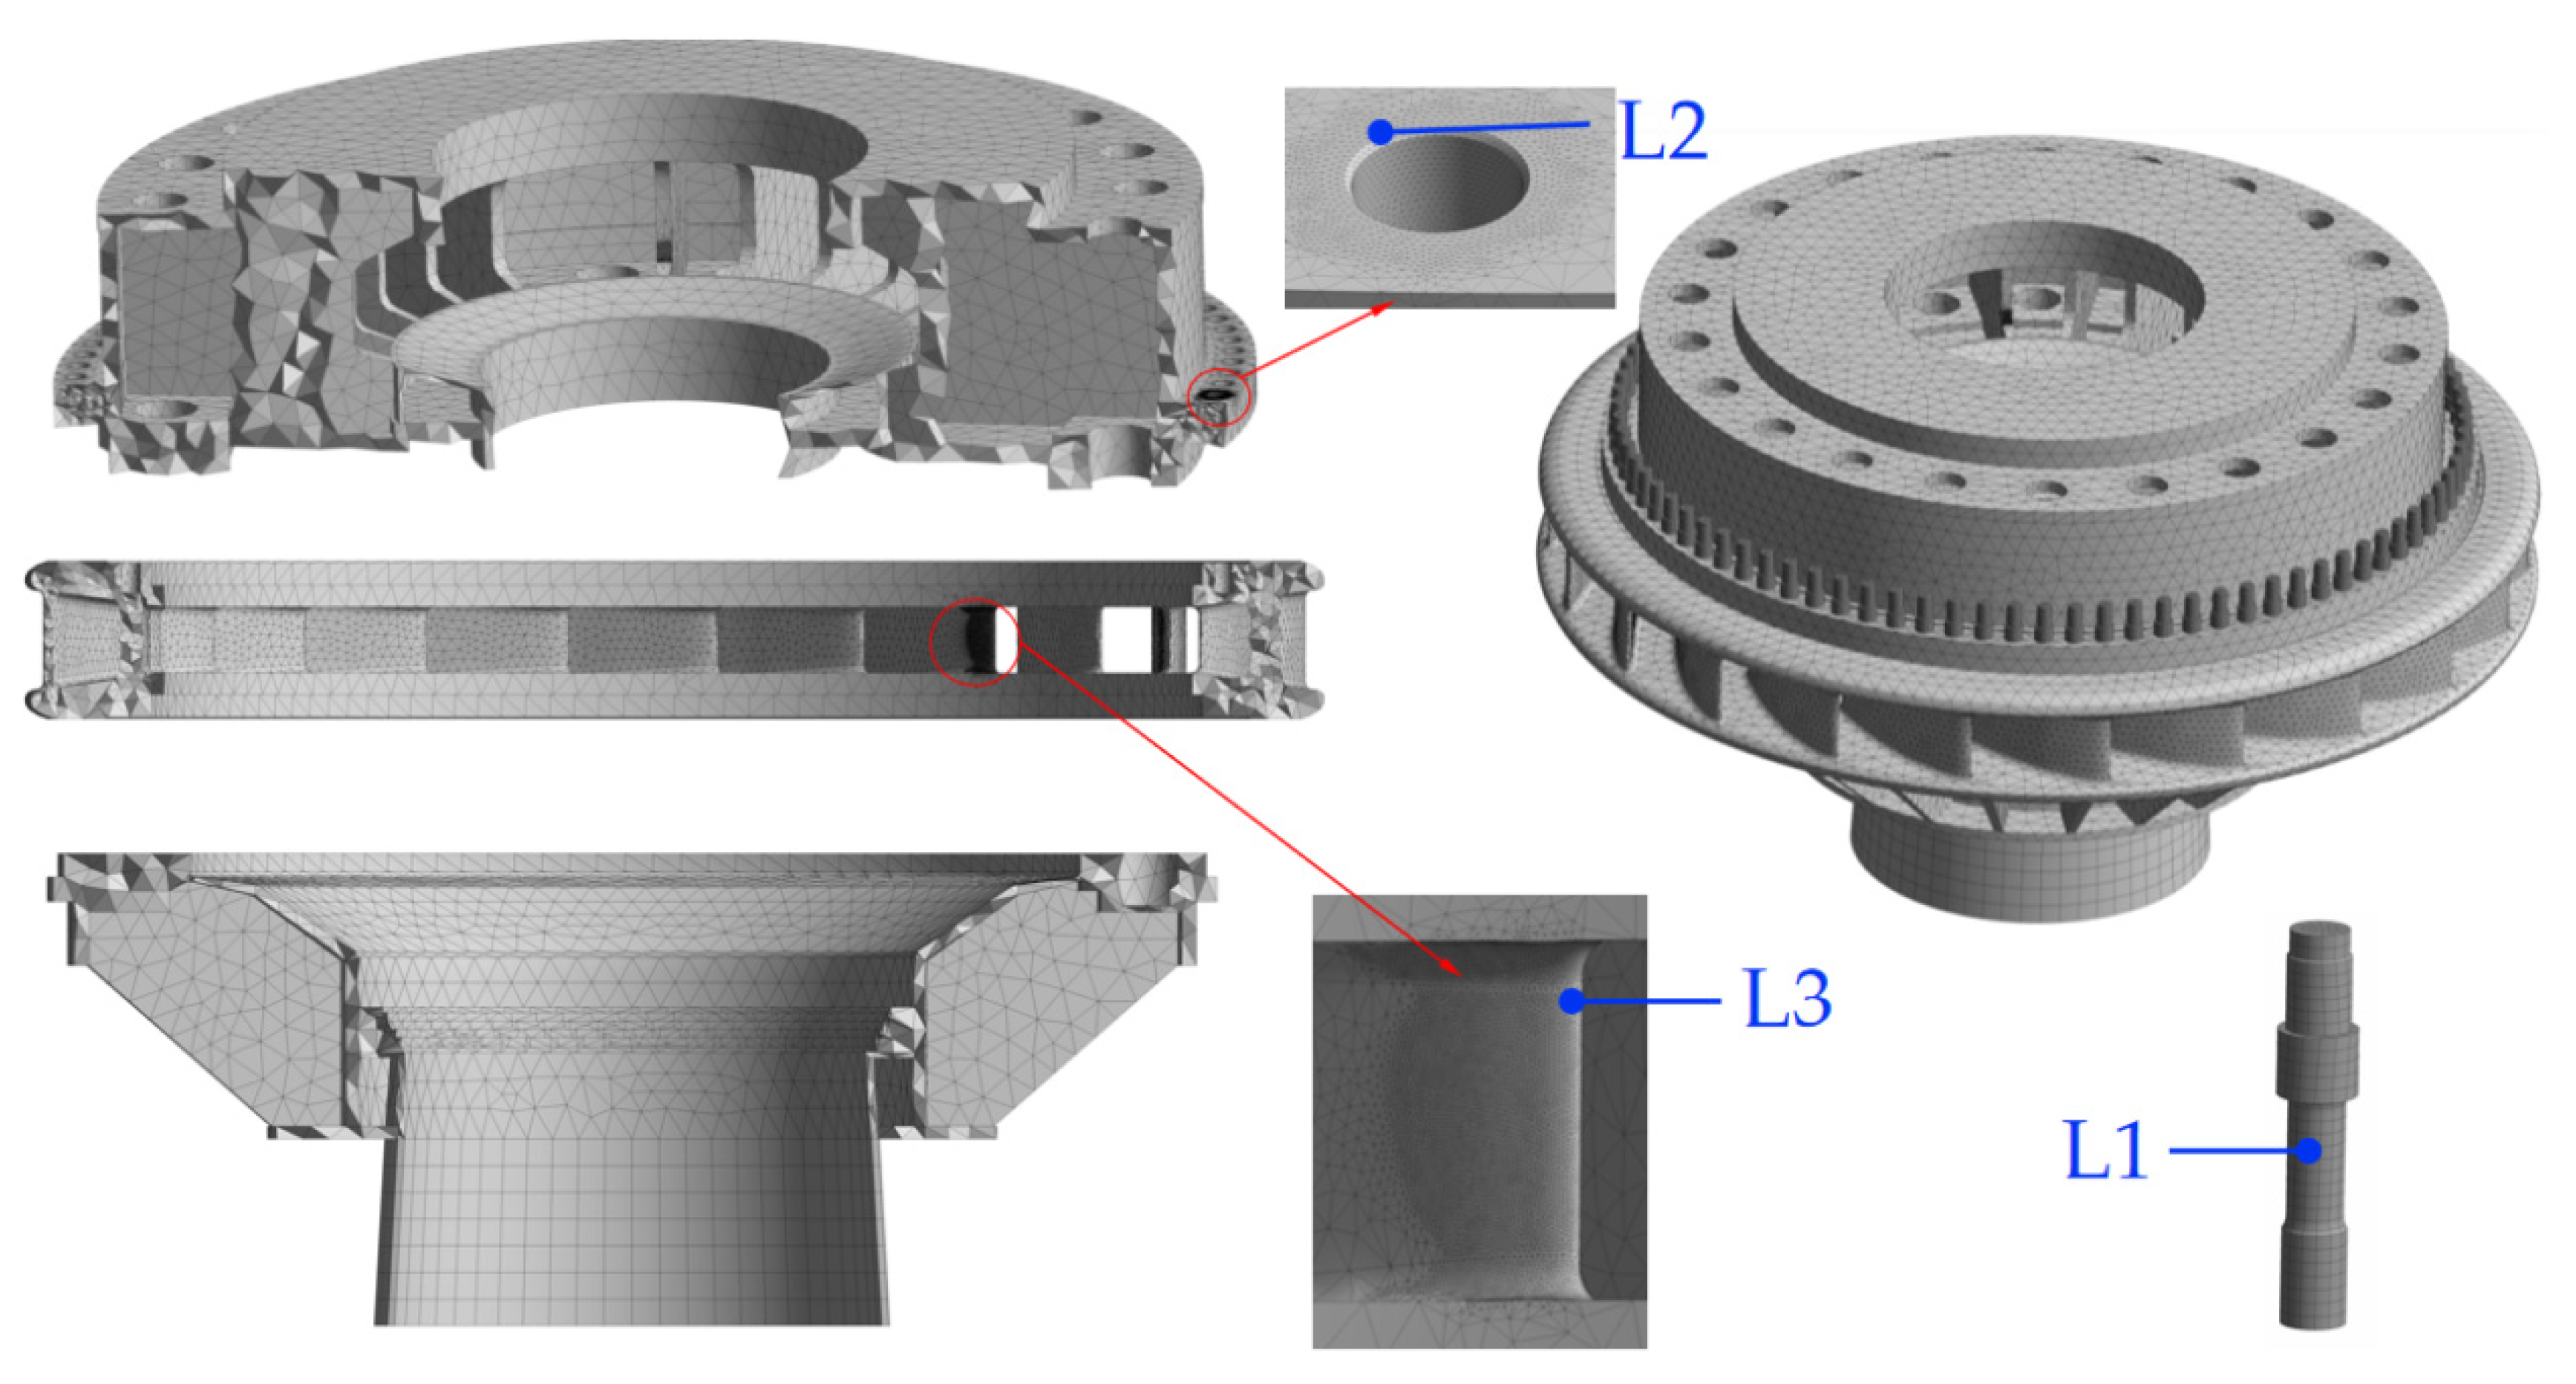
4.2. Mesh Sensitivity Analysis

The finite element model for calculation is presented in Figure 11. According to the topological characteristics of the studied structures, a hybrid finite element model with tetrahedral and hexahedral elements was created to achieve a good balance between calculation accuracy and calculation time. Since an overly coarse mesh can lead to inaccurate results, it is essential to perform a mesh sensitivity analysis and select an efficient and reliable mesh for the analysis. The meshes at typical stress concentration locations are refined to obtain more accurate stress results.
Three groups of high-quality meshes with different element sizes are created, and the numbers of nodes and elements of these three groups of meshes are 1.04 × 10⁶, 1.44 × 10⁶, 1.84 × 10⁶, and 6.1 × 10⁵, 7.4 × 10⁵, and 1.0 × 10⁶, respectively. Three typical stress concentration locations (L1, L2, and L3) are selected to perform the mesh sensitivity analysis. L1 is located in the middle of a head-cover bolt and usually has the highest preload stress. L2 is located on the connecting surface of the head-cover flange and a head-cover bolt, and L3 is located at the fillet of the trailing edge of the stay vane. To compare the maximum stress values of L1, L2, and L3, the von Mises stress of L1 under the preload force of 4196 kN listed in Table 2, and the stresses of L2 and L3 under the preload and the highest hydraulic pressure of t = 8.8 s shown in Figure 3 are extracted from the simulations with the three groups of meshes. All the stresses are normalised by dividing by the maximum stress value of L1 (Figure 12). It is clear that the second grope of mesh with 1.44 × 10⁶ nodes and 7.4 × 10⁵ elements is sufficient to perform the flow-induced stress in this study.

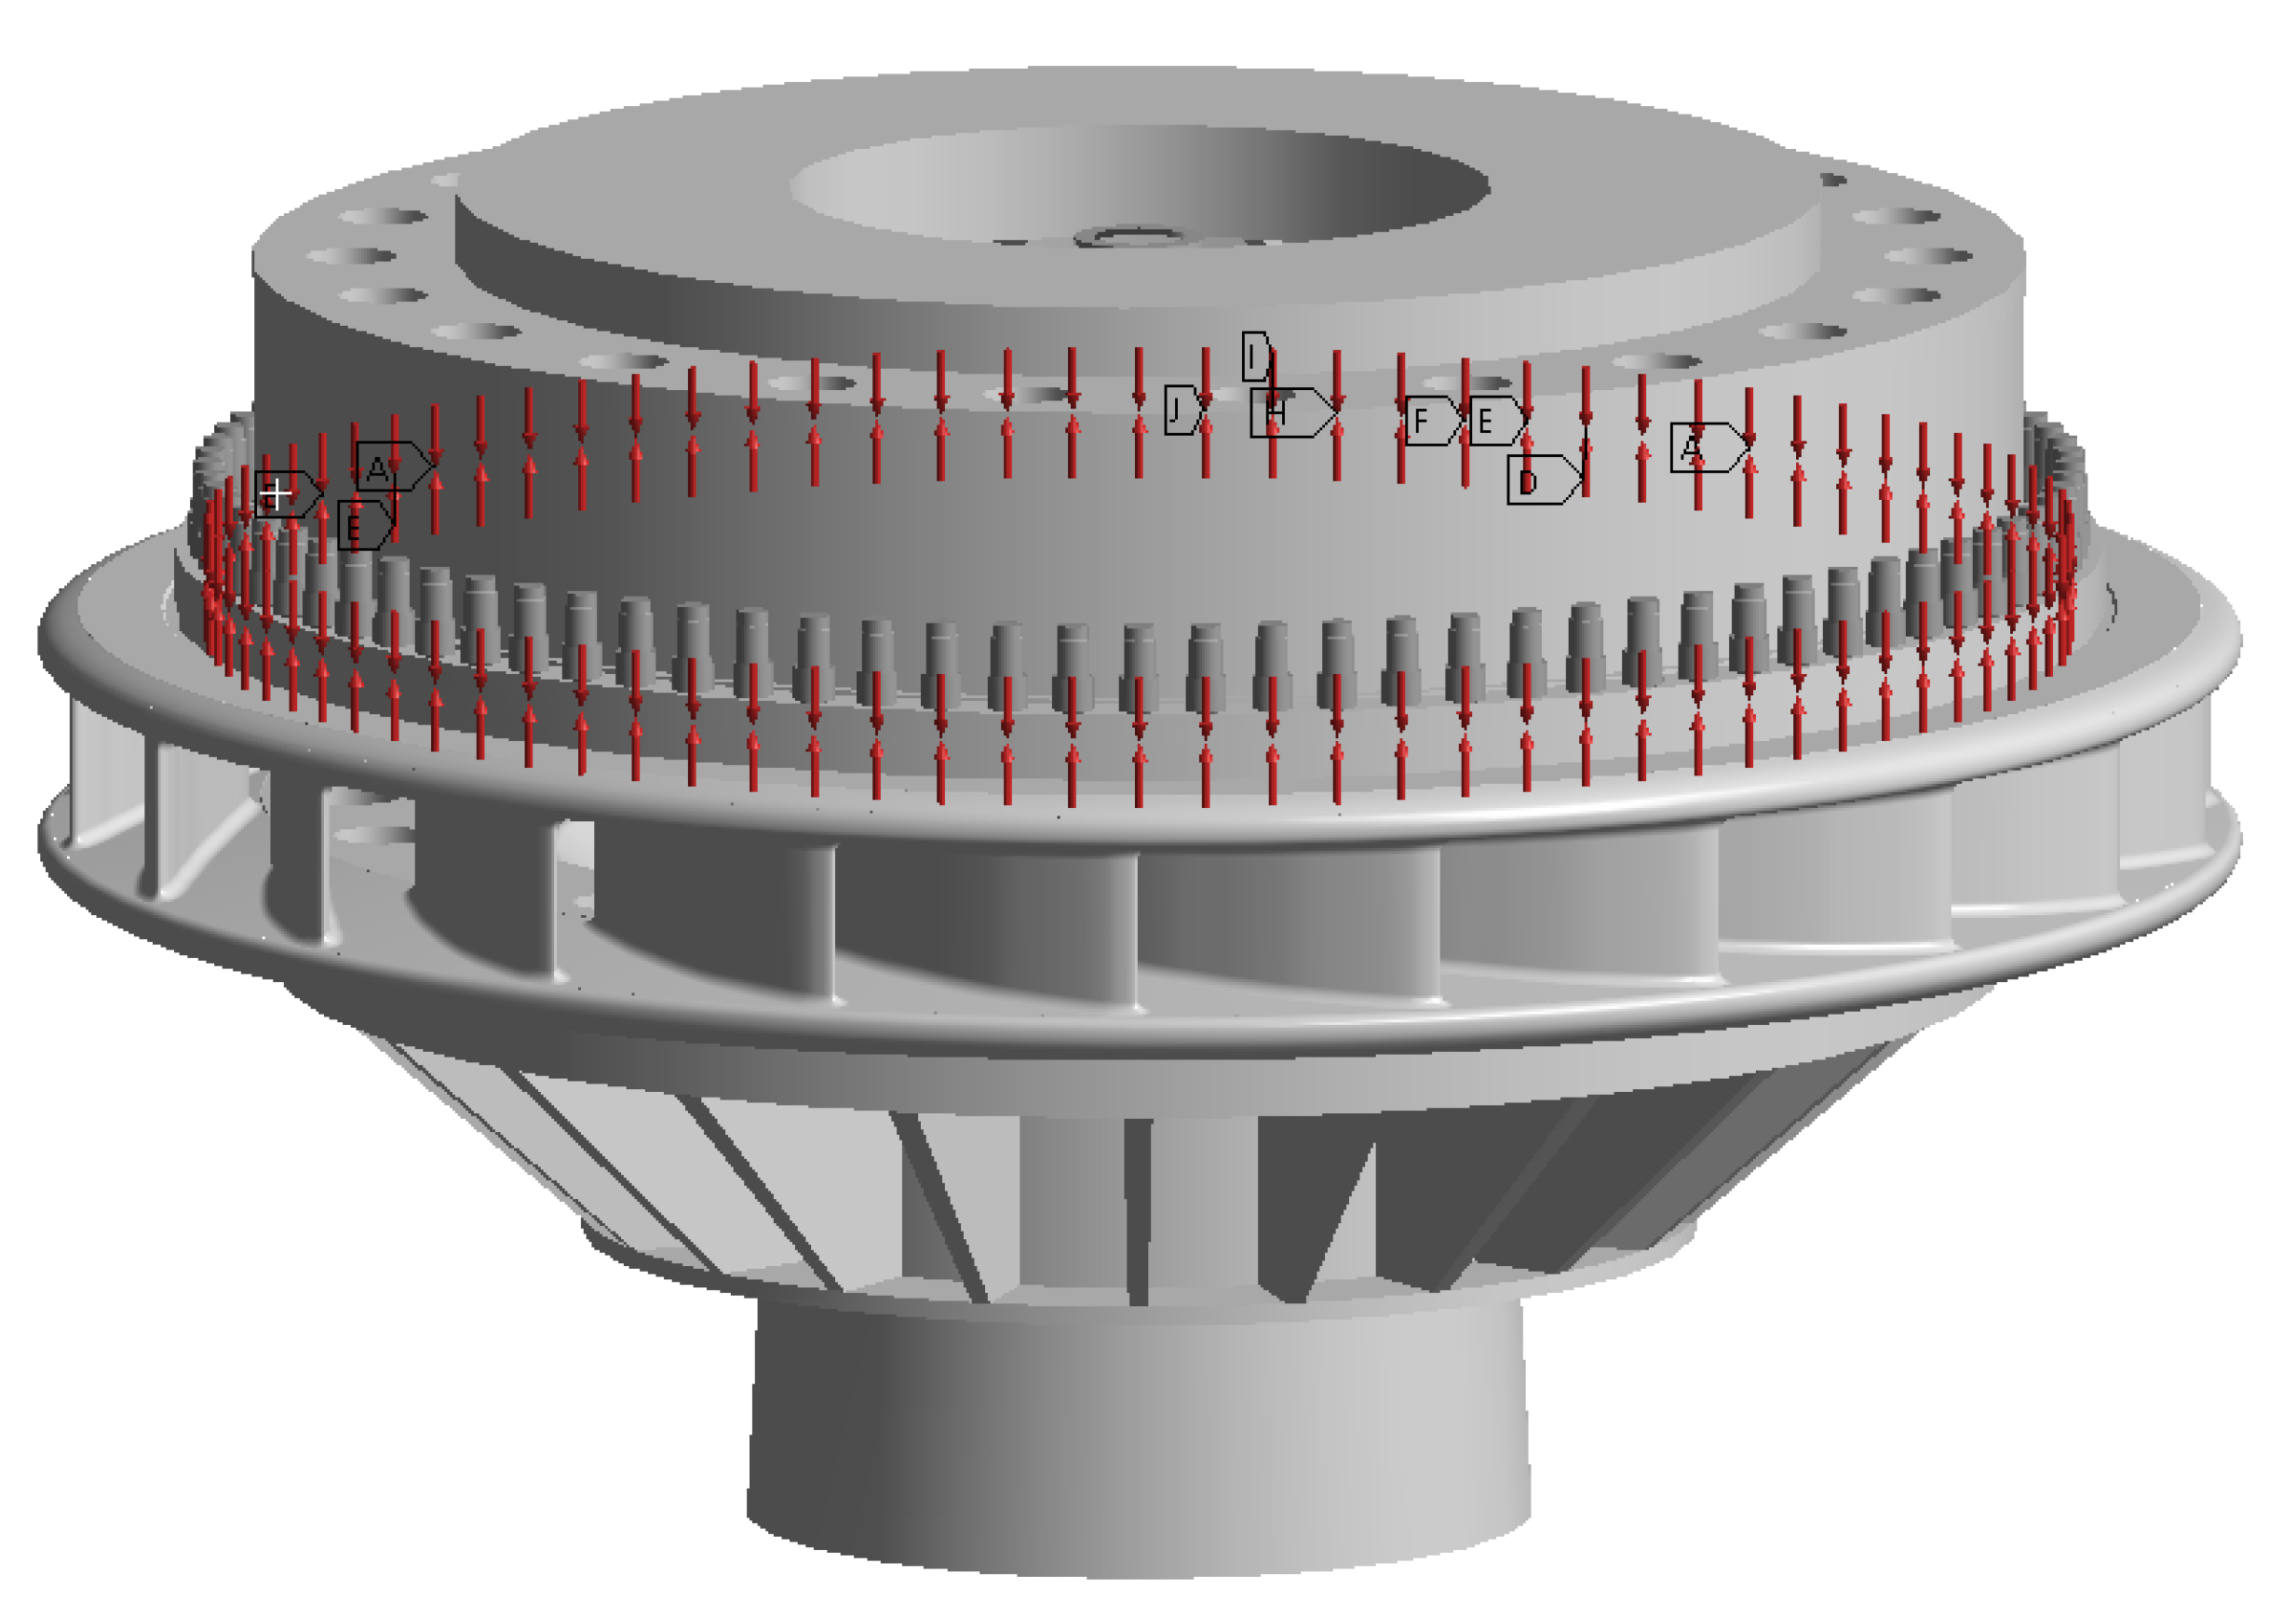
4.3. Head-Cover Bolts Preloading and Fluid–Structure Coupling

The professional hydraulic torque wrench is used to tighten head-cover bolts on site. The preload 4196 kN as required by the design was applied on each bolt, and at this moment the high-pressure water has not yet filled the flow channel of the PT unit. In this study, pretension elements are used to simulate the preload applied on the bolts (Figure 13).
When the water flows in the fluid channel, the high water pressure acts on the inner surfaces of the head-cover and the stay ring, etc., so the head-cover bolts connecting the head-cover and the stay ring start to bear the large hydraulic forces. During the turbine start-up transient process, the large hydraulic forces changed dramatically with time due to the unsteady flow in the PT unit. The pressure loads calculated by the CFD at the key time points during the turbine start-up are exported as time series files, including the coordinates and the pressure value of each node of the fluid domain. The meshes for fluid and structural calculations are created separately, so the fluid mesh and the structural mesh on the FSC interface are usually different. With the built-in tool of ANSYS Mechanical, the nodal pressure loads can be effectively and accurately interpolated and mapped on the nearest structural nodes based on their coordinate values. As shown in Figure 14, the calculated pressure distributions during turbine start-up are sequentially transferred and mapped on the finite element model of the structural components, including head-cover, stay ring, and bottom ring, to calculate the structural deformations and stresses.

5. Results and Discussions

5.1. Axial Hydraulic Thrust Force of the Head-Cover

The axial hydraulic force on the head-cover, also called head-cover axial hydraulic thrust, is an important parameter for the initial assessment of the vibration behaviour of the head-cover in operation. The relative hydraulic force coefficient F H C * is defined in Equation (8) to evaluate the hydraulic forces acting on the head-cover during turbine start-up (Figure 15). The positive direction of the axial hydraulic force is axially upward.
    F H C * = F H C m H C g  
where F H C is the hydraulic forces acting on the head-cover calculated by the CFD, m H C is the mass of the head-cover, and g is the gravitational acceleration, 9.8 m·s-².
Figure 15 shows that the axial hydraulic force acting on the head-cover changes dramatically. It reaches a local peak at t = 8.8 s, which is about 33 times the gravity of the head-cover. The pressure distribution in the crown chamber becomes more uniform and stable after t = 197.3 s, and the pressure acting on the head-cover is slightly larger than before. The axial hydraulic force reaches almost 35 times the gravity of the head-cover. Compared to the axial hydraulic forces, the radial hydraulic forces on the head-cover during turbine start-up are negligible.

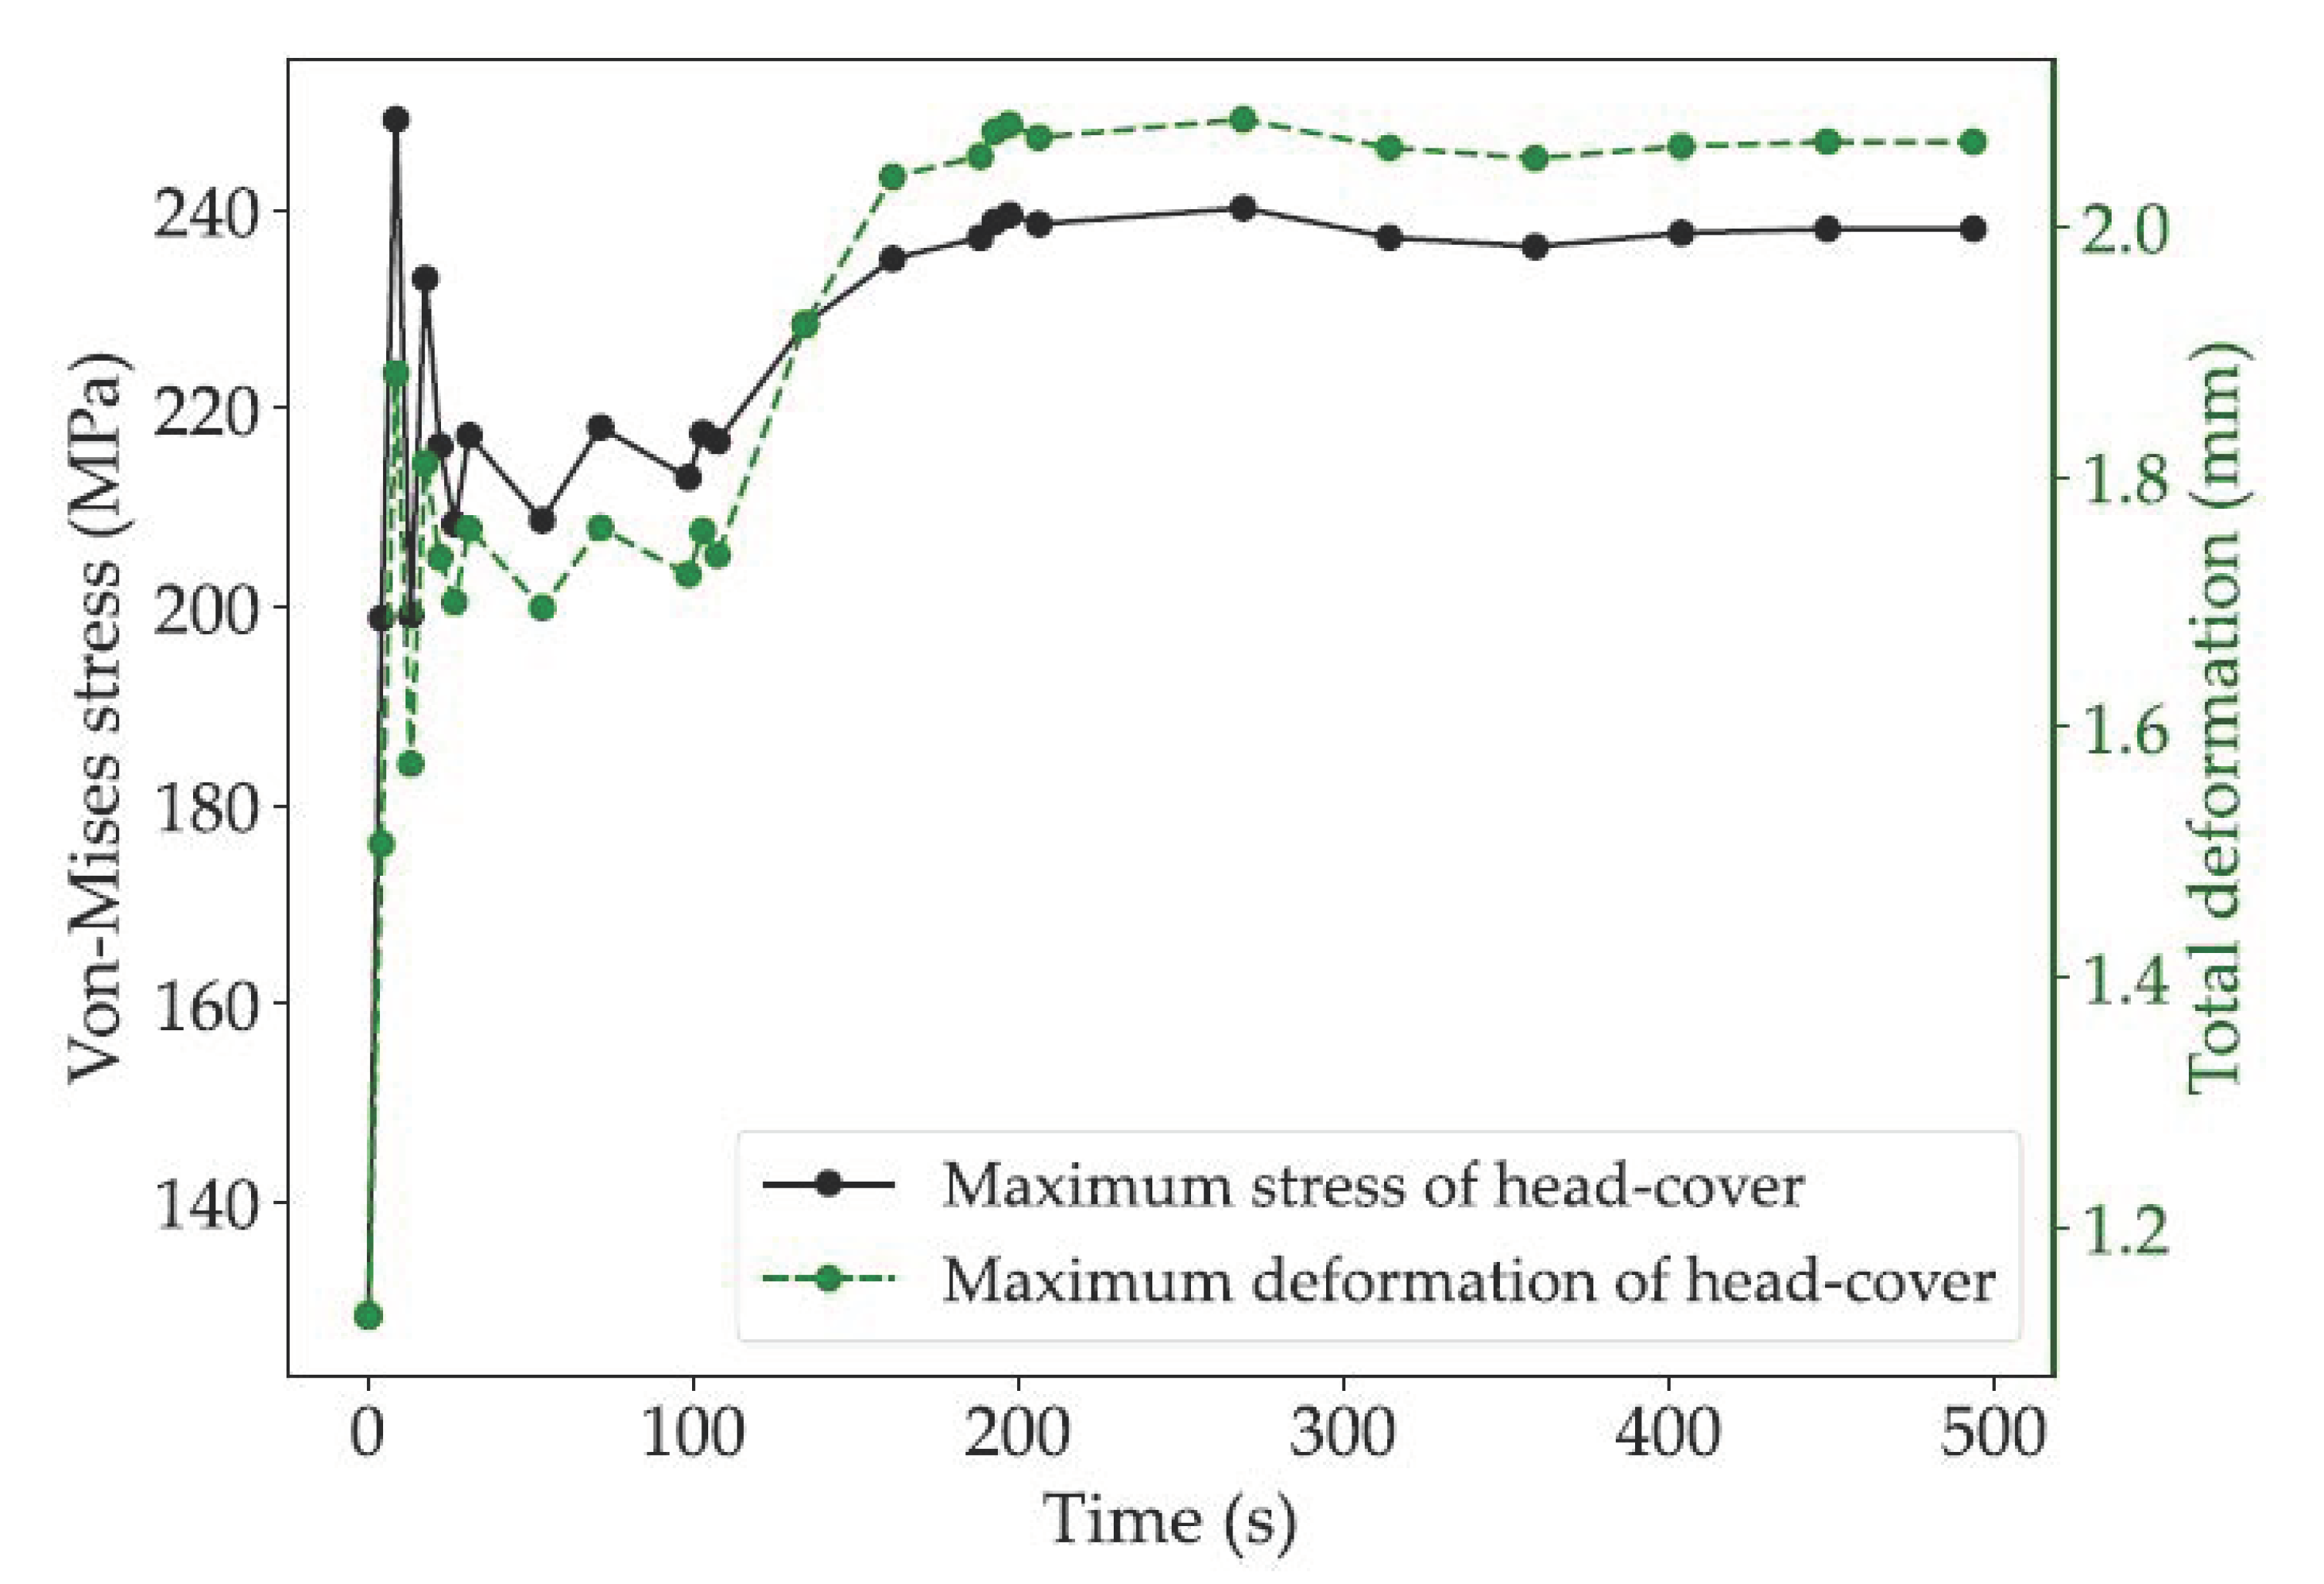
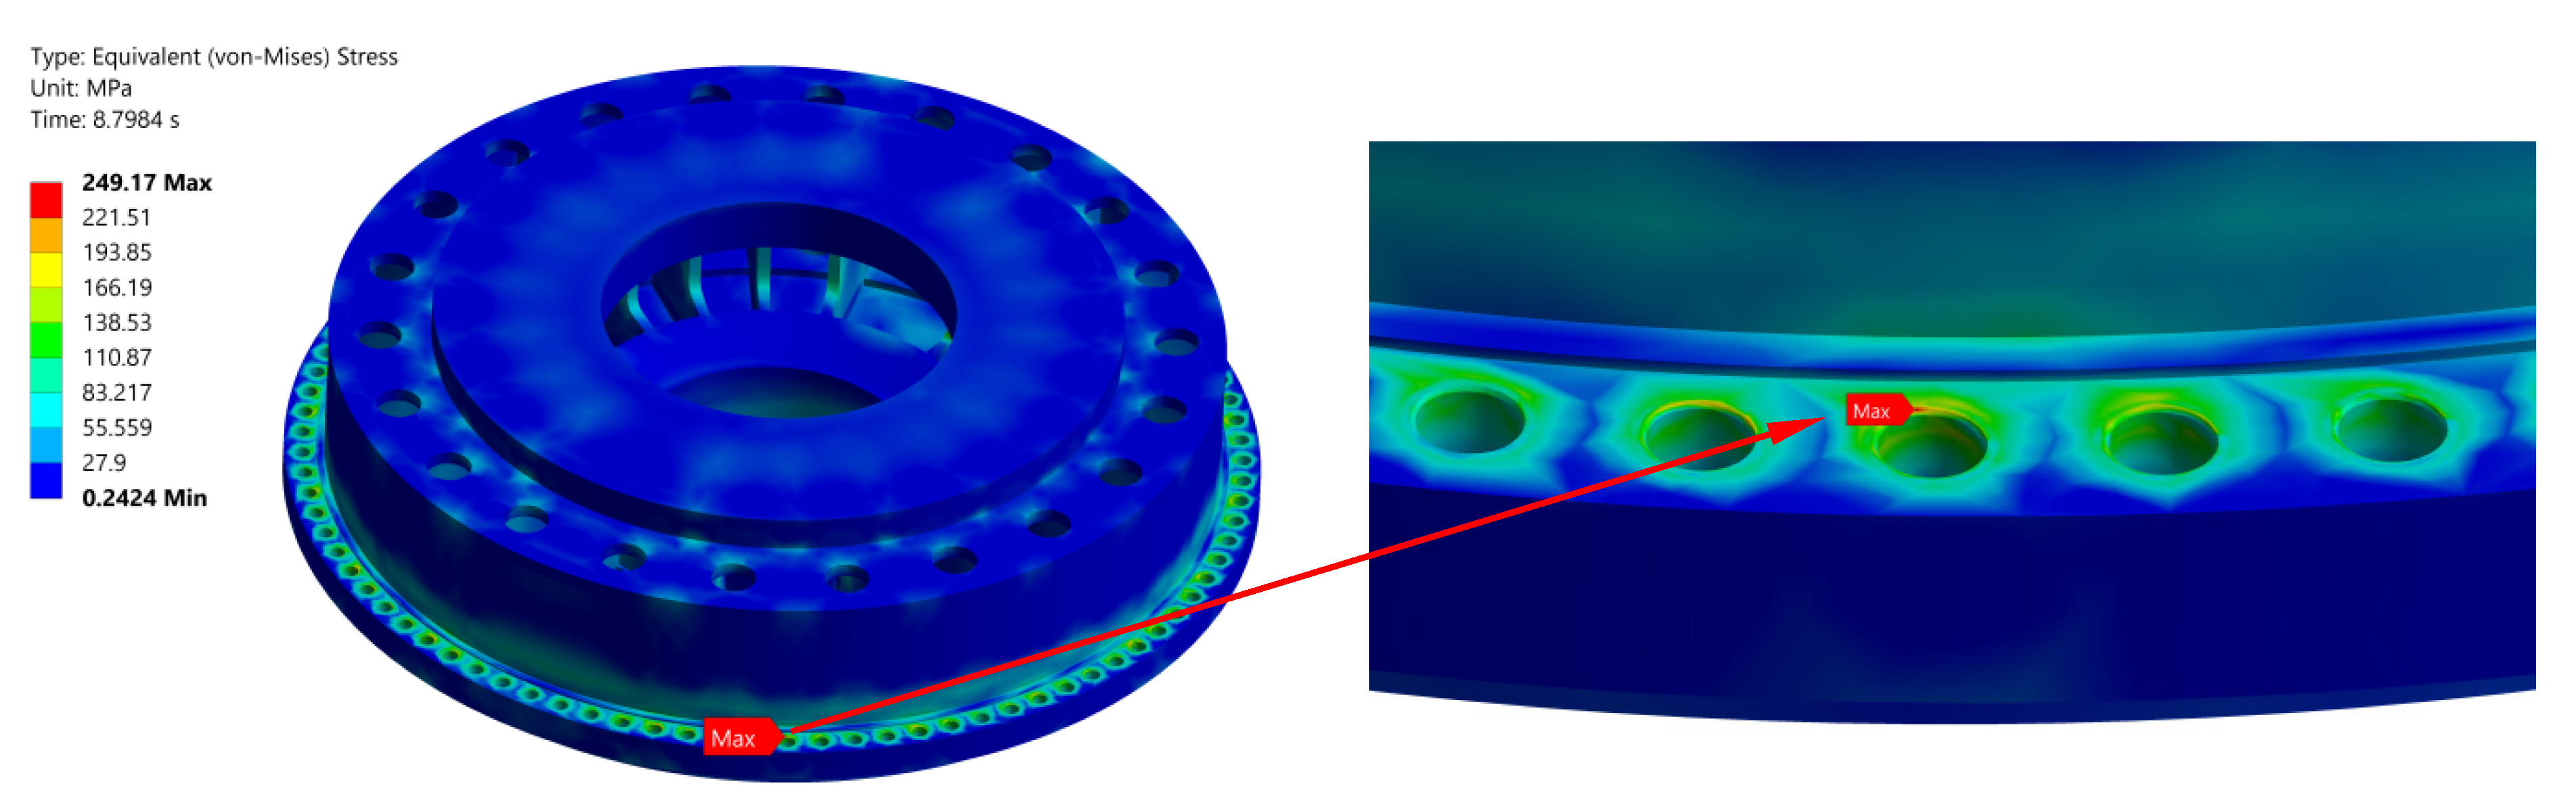
5.2. Stress and Deformation Distribution of the Head-Cover

The maximum deformation and the maximum stress of the head-cover during turbine start-up are shown in Figure 16, Figure 17 and Figure 18. The head-cover is lifted under the action of axial hydraulic thrust, and the maximum deformation occurs on the inner head-cover because it is unsupported in the axial direction. The maximum deformation value varies with time and reaches a local peak at t = 8.8 s due to a sudden pressure increase in the flow channel. It increases to a stable value of 2.1 mm after t = 192.8 s, when the PT unit is operating in a stable condition and the pressure in the crown chamber becomes more uniform and slightly larger than before.
The ribbed slabs between the inner and outer head-cover are used to strengthen the head-cover structure, and the ribbed plates are welded in the head-cover unevenly, in the circumferential direction. The deformation of the head-cover at the place with a ribbed plate is smaller than that in the locations without ribbed slabs. The head-cover bolts near this position are subject to the large axial hydraulic thrust and therefore have high-stress concentrations. The maximum stress of the head-cover appears on the connecting surface of the head-cover flange and a head-cover bolt. The maximum stress value changes significantly at different times during turbine start-up. It reaches the peak value of 249 MPa at t = 8.8 s, which is below the yield stress 265 MPa of the head-cover material.

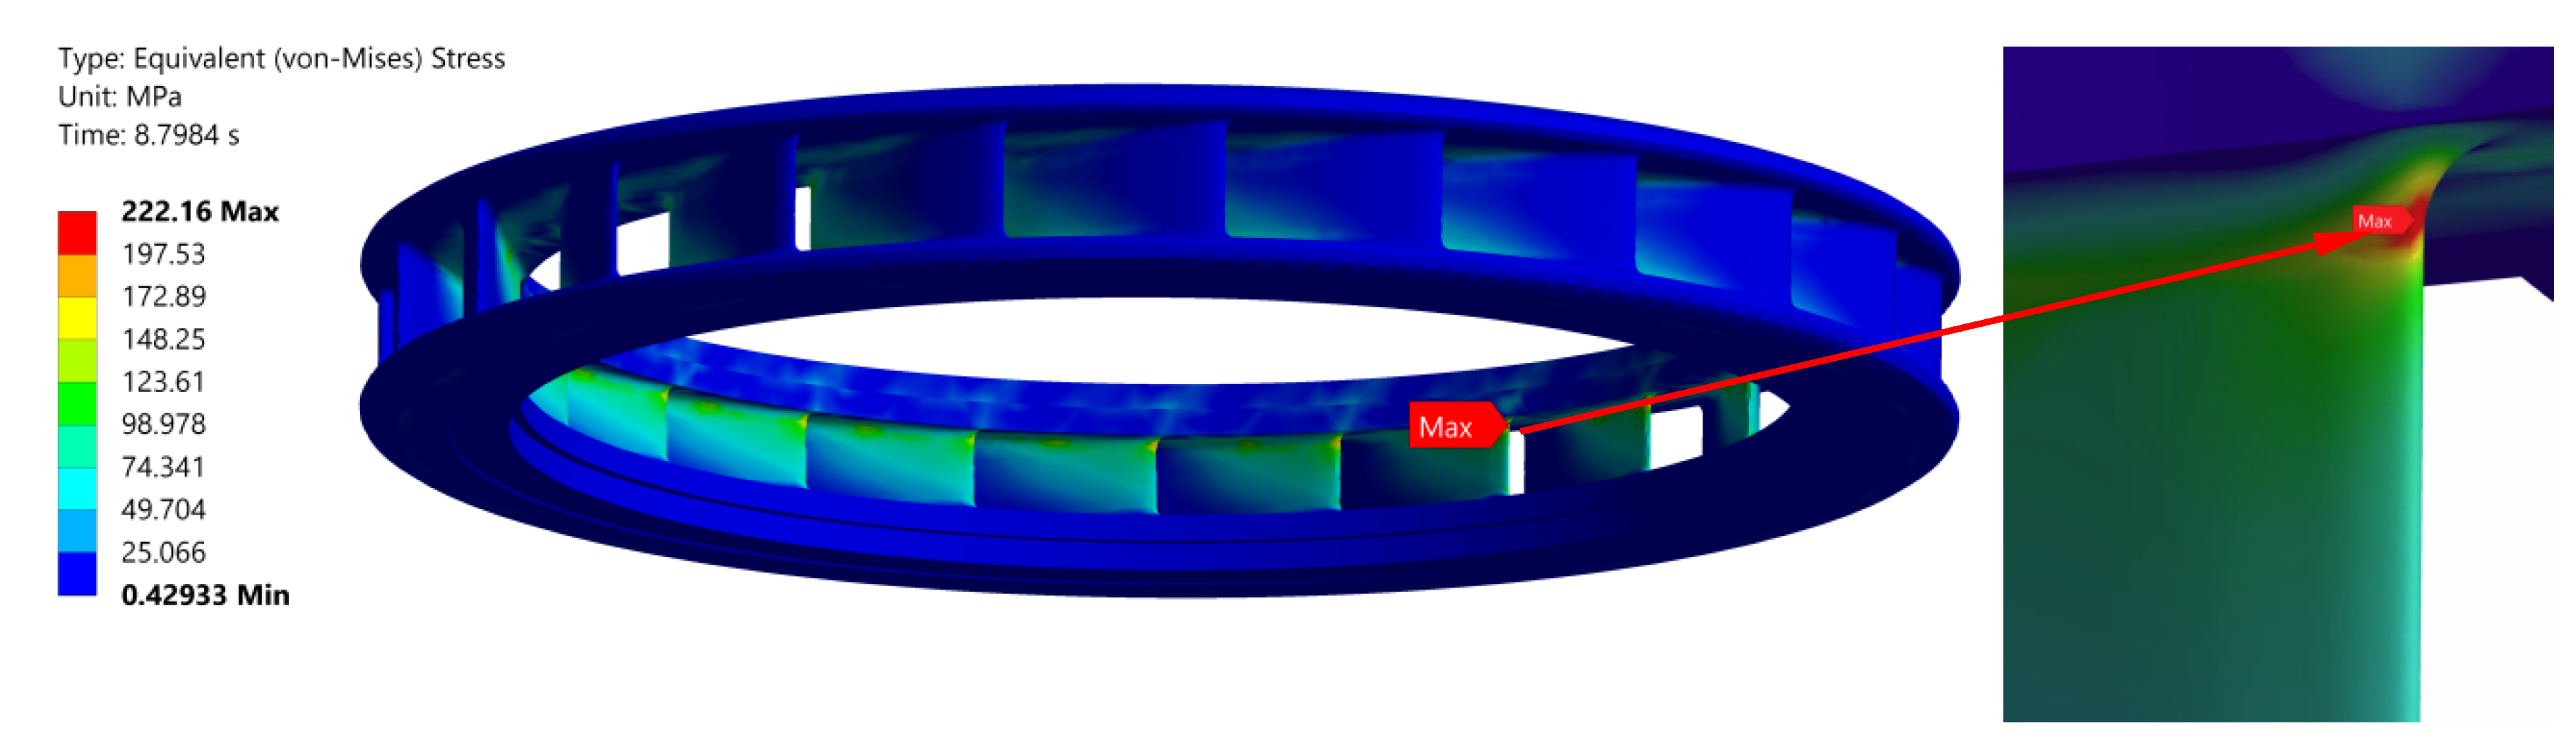
5.3. Stress Distribution of the Stay Ring

The maximum stress distribution of the stay ring during turbine start-up is shown in Figure 19 and Figure 20. The fluctuating pressure applied on the head-cover and bottom ring lifts the head-cover up and pushes the bottom ring down, so the stay vanes will be stretched, and the maximum stress appears in the fillet of the trailing edge of a stay vane. At the beginning of the turbine start-up, the unsteady flow-induced stress at the hot spot changes dramatically and reaches a maximum value of 222 MPa, which is below the material yield stress (830 MPa) of the stay ring.
When the flow in the stay vane channel is fully developed after t = 107.5 s, the pressure loads acting on the upper and lower surfaces of the stay ring cancel each other out and the maximum stress of the stay vane drops to a stable level.

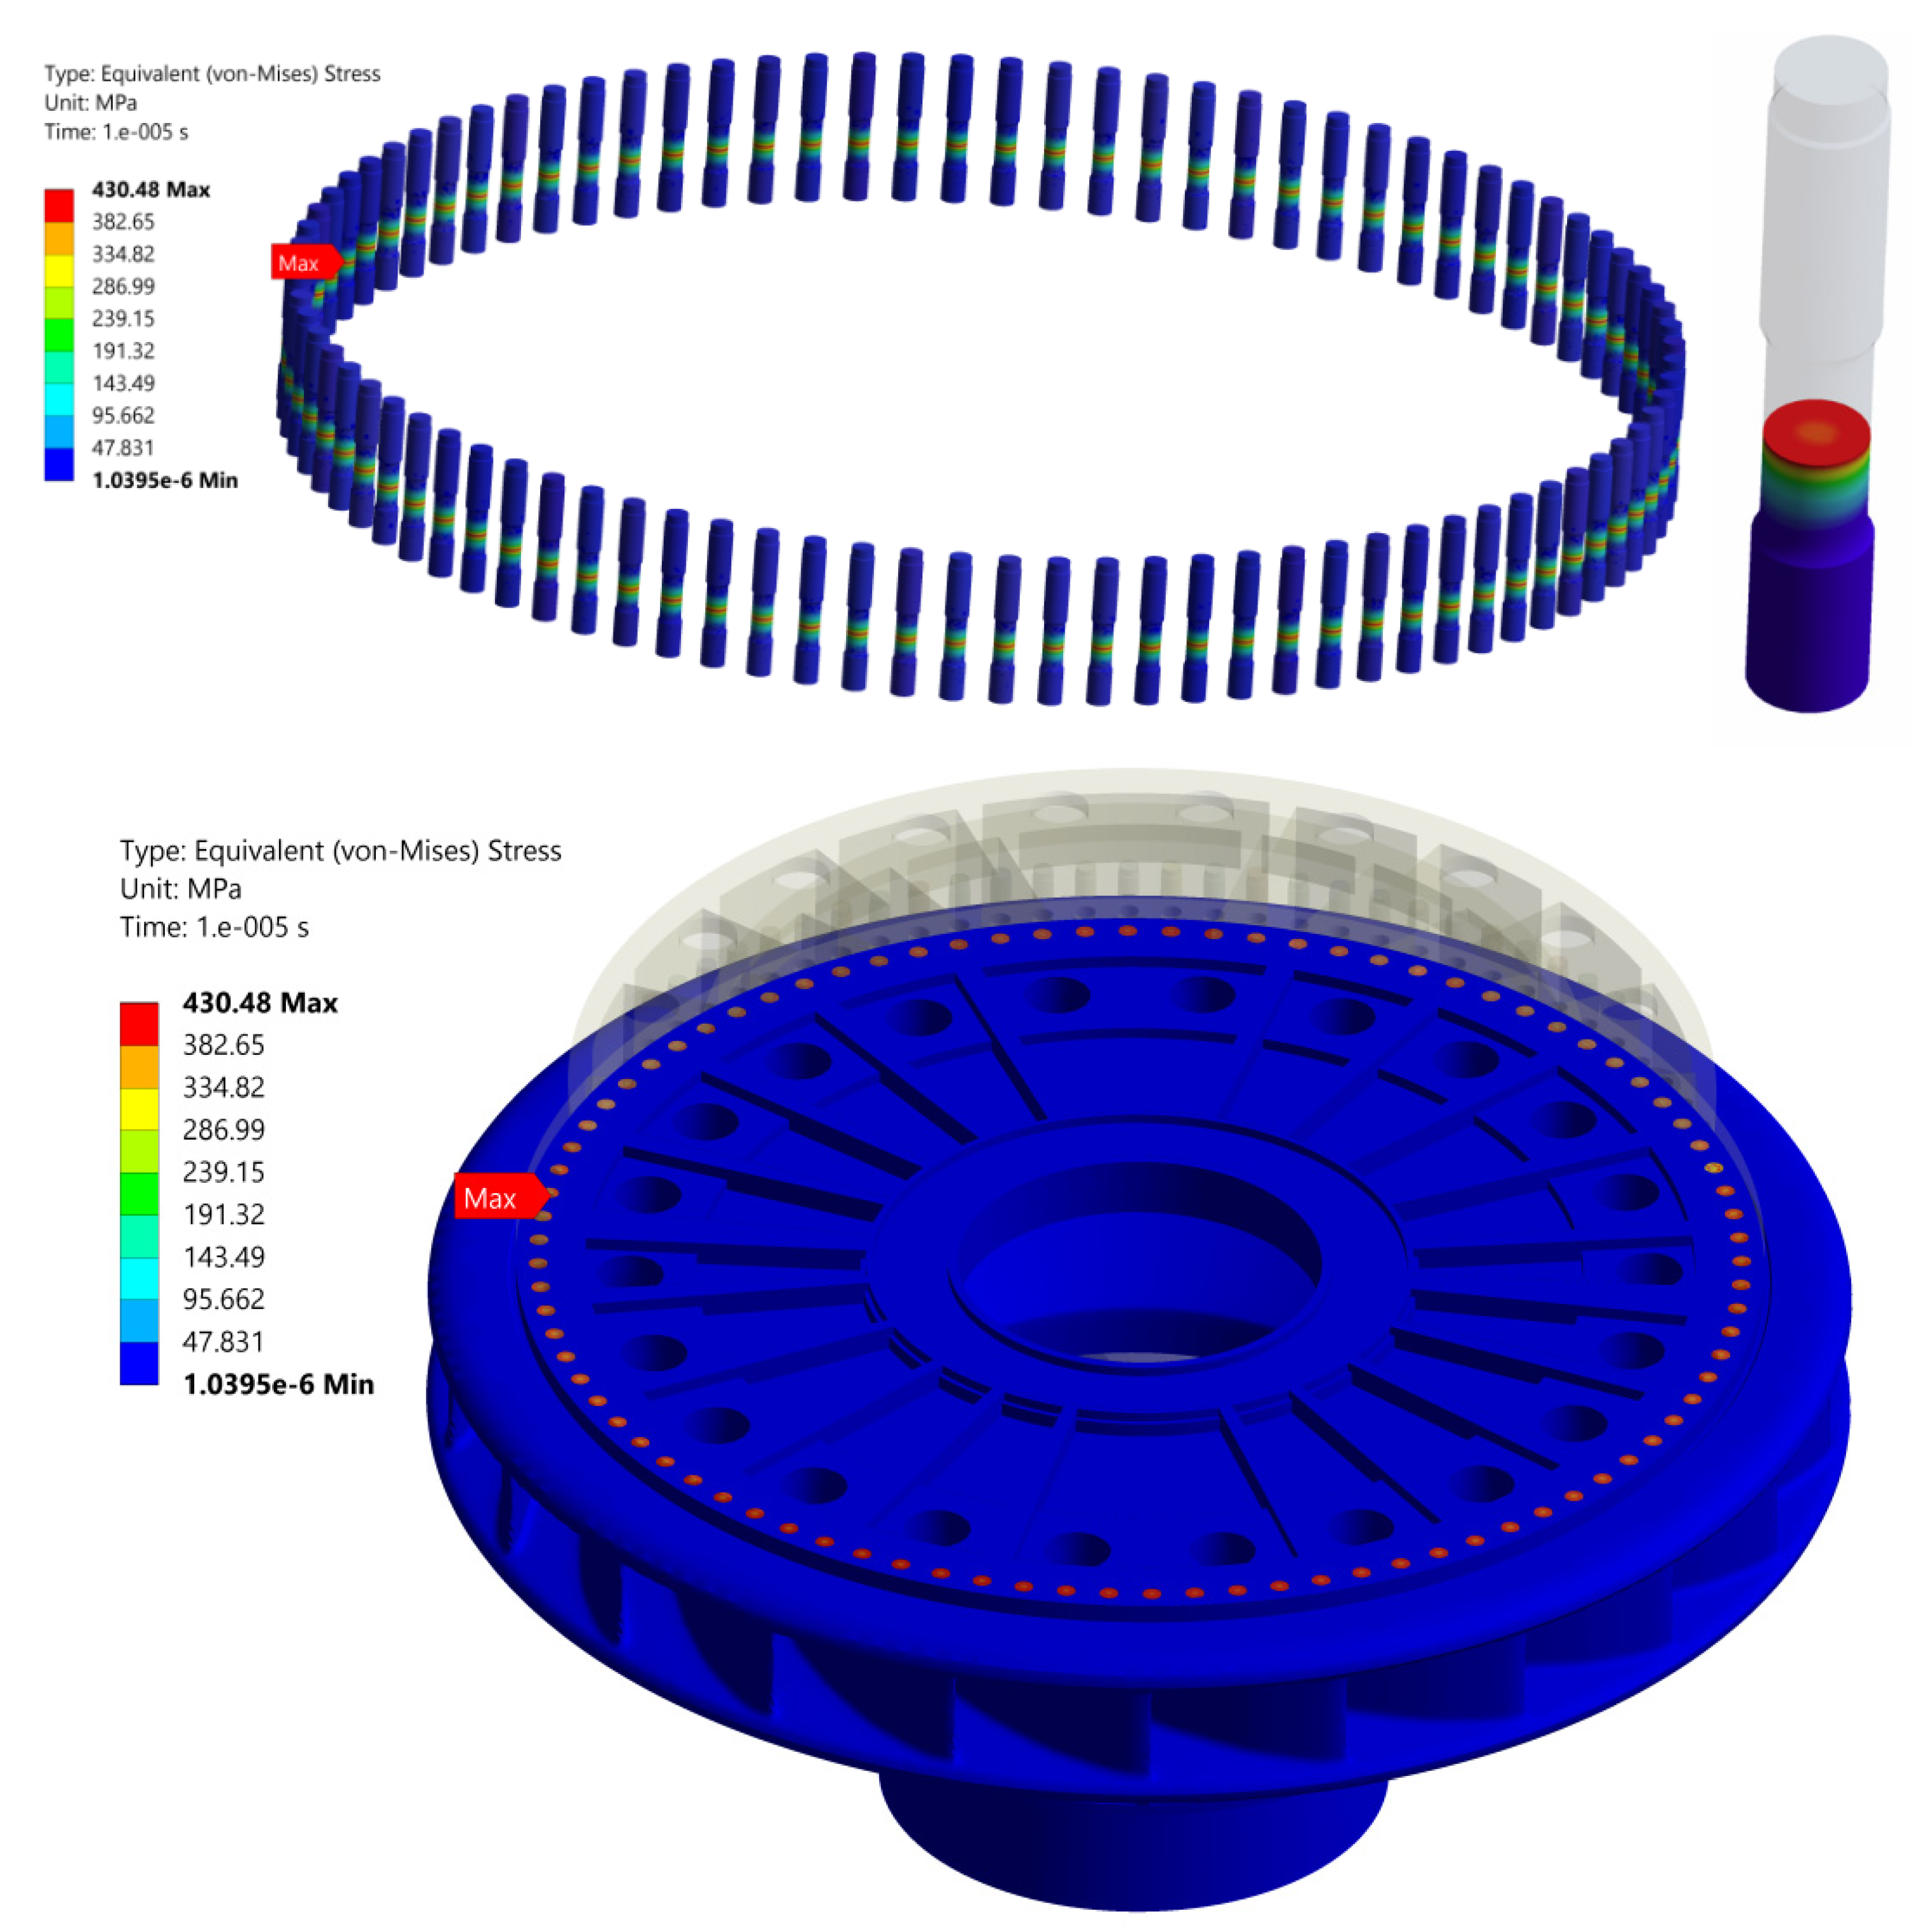
5.4. Stress Distribution of the Head-Cover Bolts

When the head-cover bolts are installed in the PT unit, a tightening force of 4196 kN as preload is applied to each bolt (Figure 13). The distribution of the von Mises stresses for all 88 bolts is shown in Figure 21. The maximum stress occurs in the middle of each bolt. Figure 10 also demonstrates the stress distribution in the middle section for different bolts. It can be seen that the stresses in the middle section of the head-cover bolts are not uniform and range from 382 to 430 MPa. The stresses in the bolts near the ribbed slabs are larger than those in the bolts away from ribbed slabs.
The flow-induced stresses of the head-cover bolts during turbine start-up are reduced due to the presence of pressure loads compared to the bolt stresses caused by pretension loads. The maximum stress location for each bolt has been moved to the bolt fillet, as shown in Figure 22. As can be seen from Figure 23, the maximum stress distribution of the head-cover bolts changes significantly during turbine start-up, reaching a peak of 377 MP at t = 8.8 s, which is lower than the yield stress of the bolt material (960 MPa).
It can also be found that the maximum stresses in the head-cover bolts and the head-cover change in the same trend during turbine start-up, although the maximum stresses in the head-cover bolts are always higher than those of the head-cover at a given time. The maximum stress of the stay vane is less than the one of head-cover bolts and the head-cover. Therefore, the most critical components of the PT unit during turbine start-up are the head-cover bolts.
From Figure 24, it can be seen that the ribbed slabs are unevenly distributed in the head-cover. The axial hydraulic thrust force lifts the head-cover, and the bolt heads bend radially outward. The head-cover flange deforms the least at the location with the thickest ribbed slab, while the bolts are under the most stress. It can be clearly seen from Figure 24 that the deformations of the head-cover bolts vary greatly. The maximum stress occurs in the bolt with the least deformation. The position of the bolt with the maximum stress and the position of the bolt with the maximum deformation differ by approximately 90 degrees in the circumferential direction.

6. Conclusions

The operating condition of pump-turbines is complicated because the machine has to switch its operating modes much more frequently than the other types of hydraulic turbines. The head-cover bolts have to suffer from high stress and vibration during turbine start-up, which may decrease their operation life or even cause damage. The pressure distribution of the flow channel during turbine start-up has been calculated. The stresses of head-cover bolts under preload and during the turbine start-up transient process are analysed based on the one-way FSC method. Conclusions are listed below:
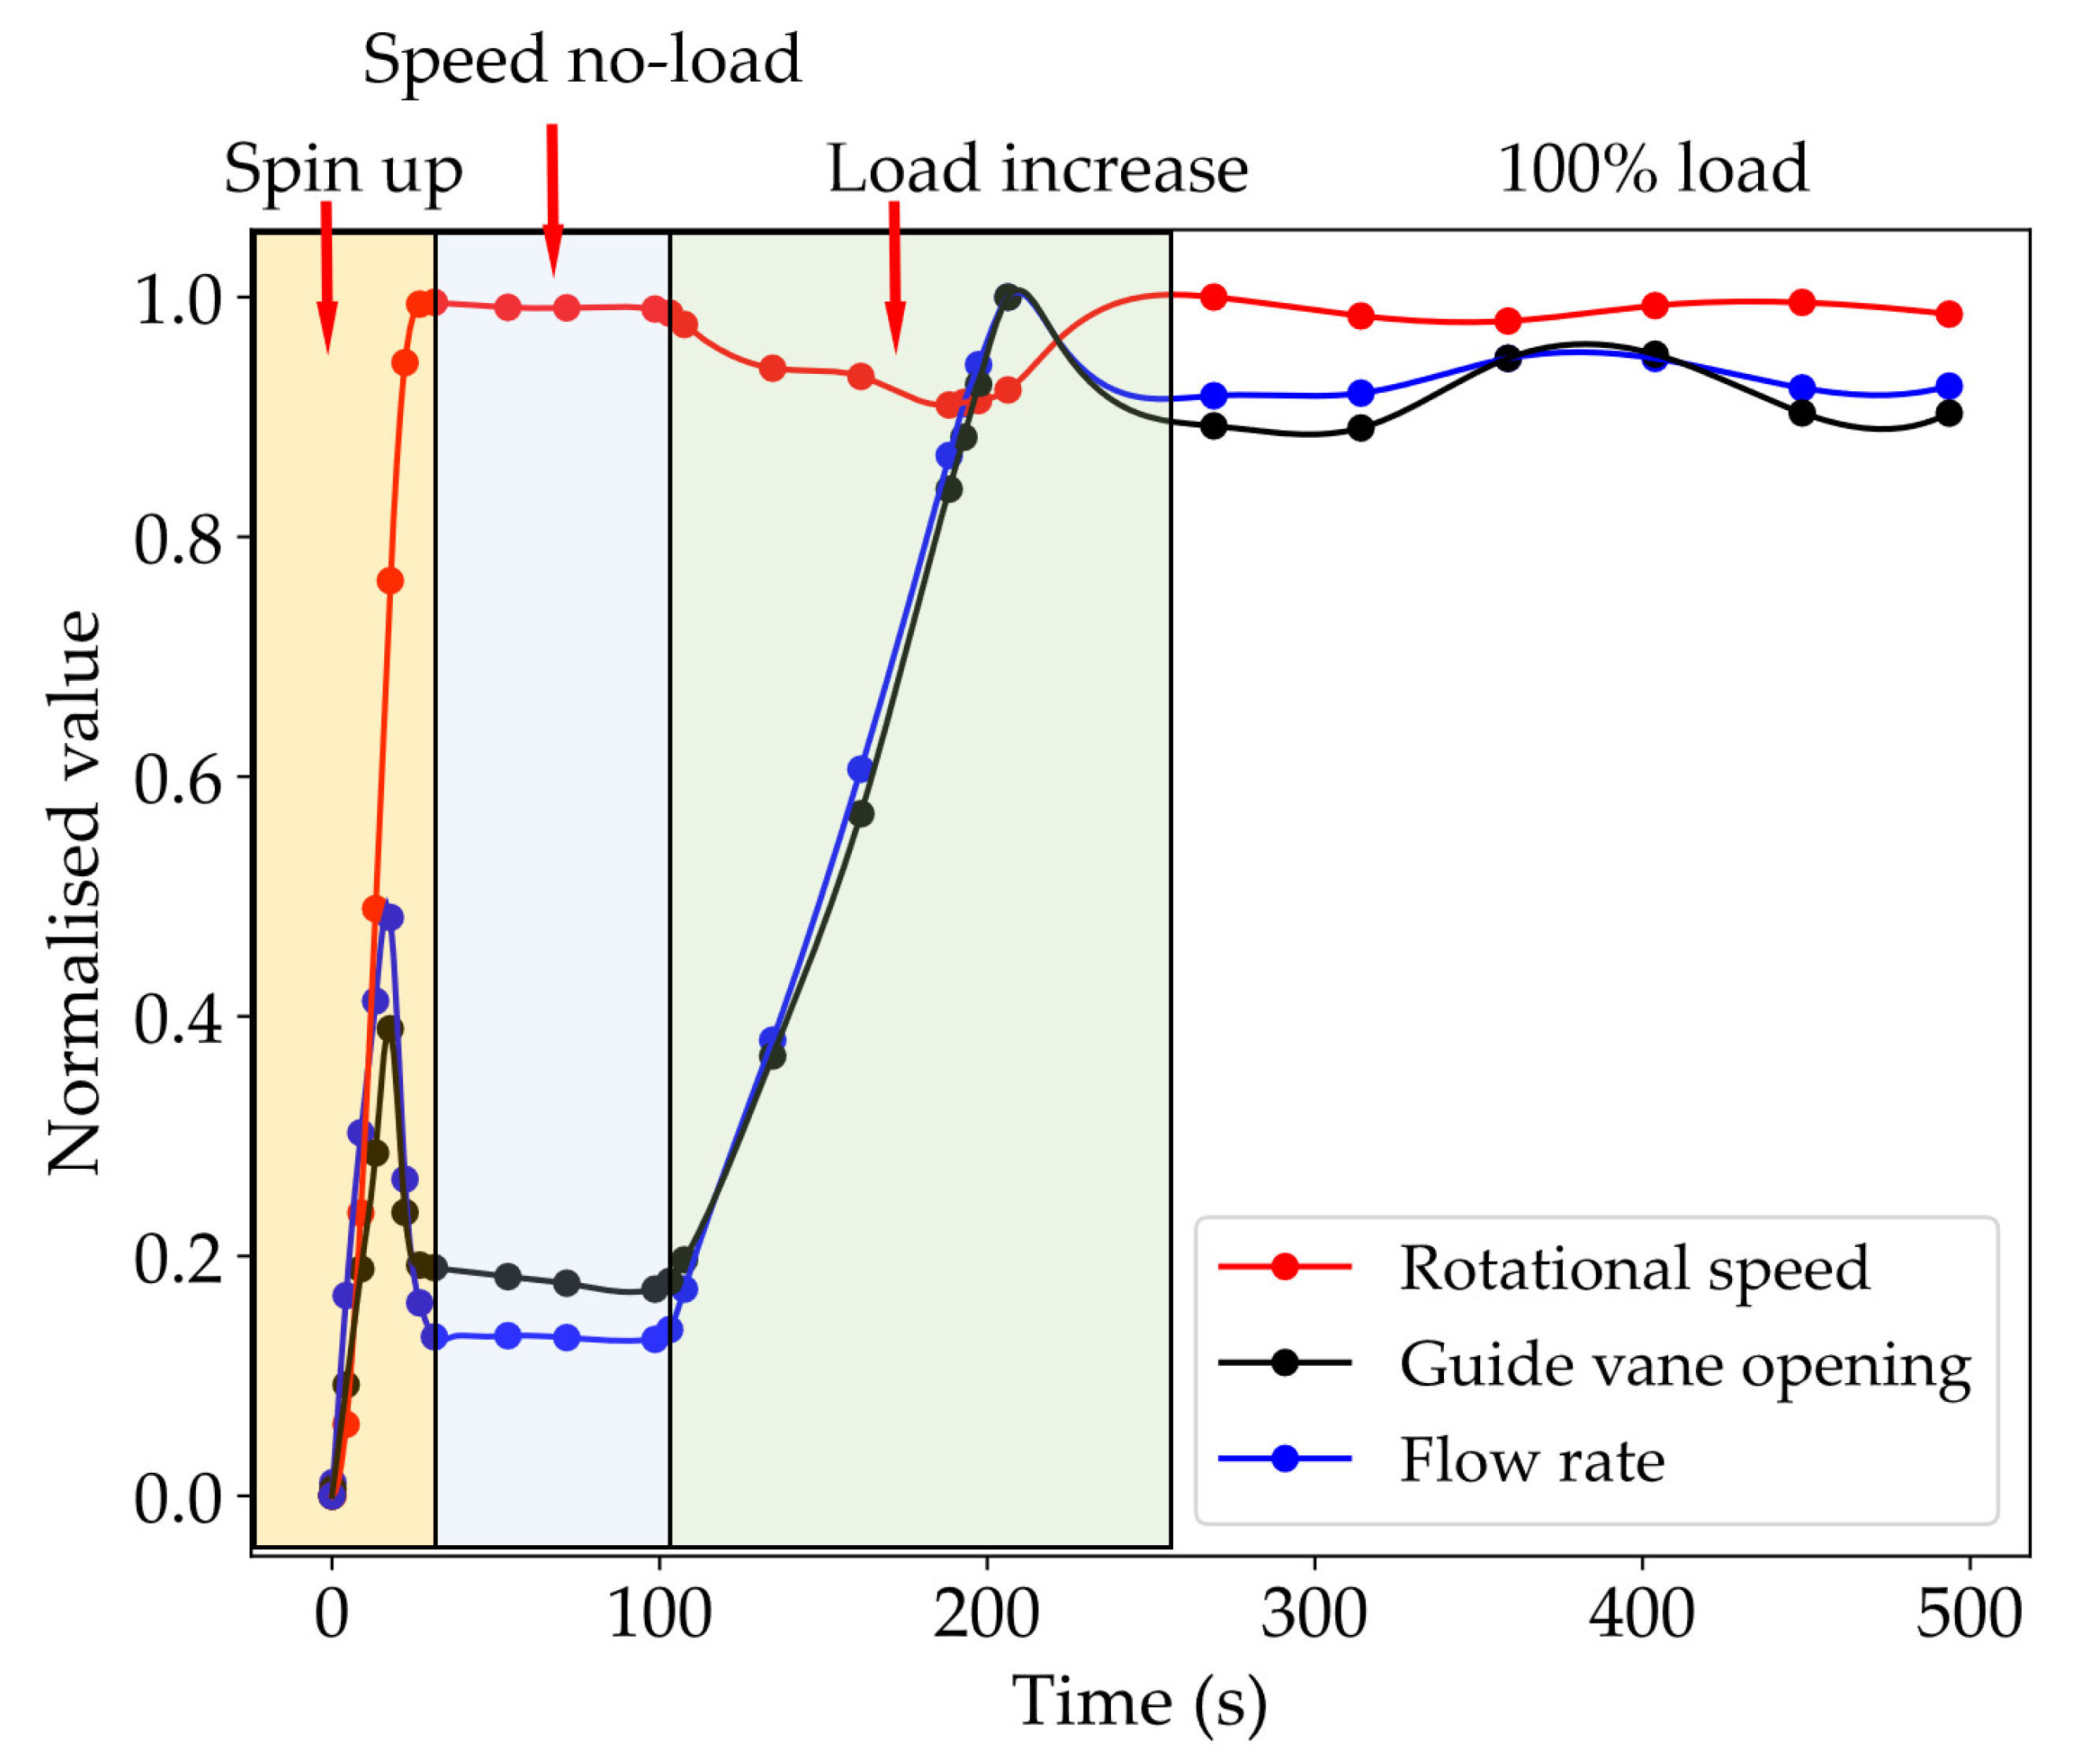
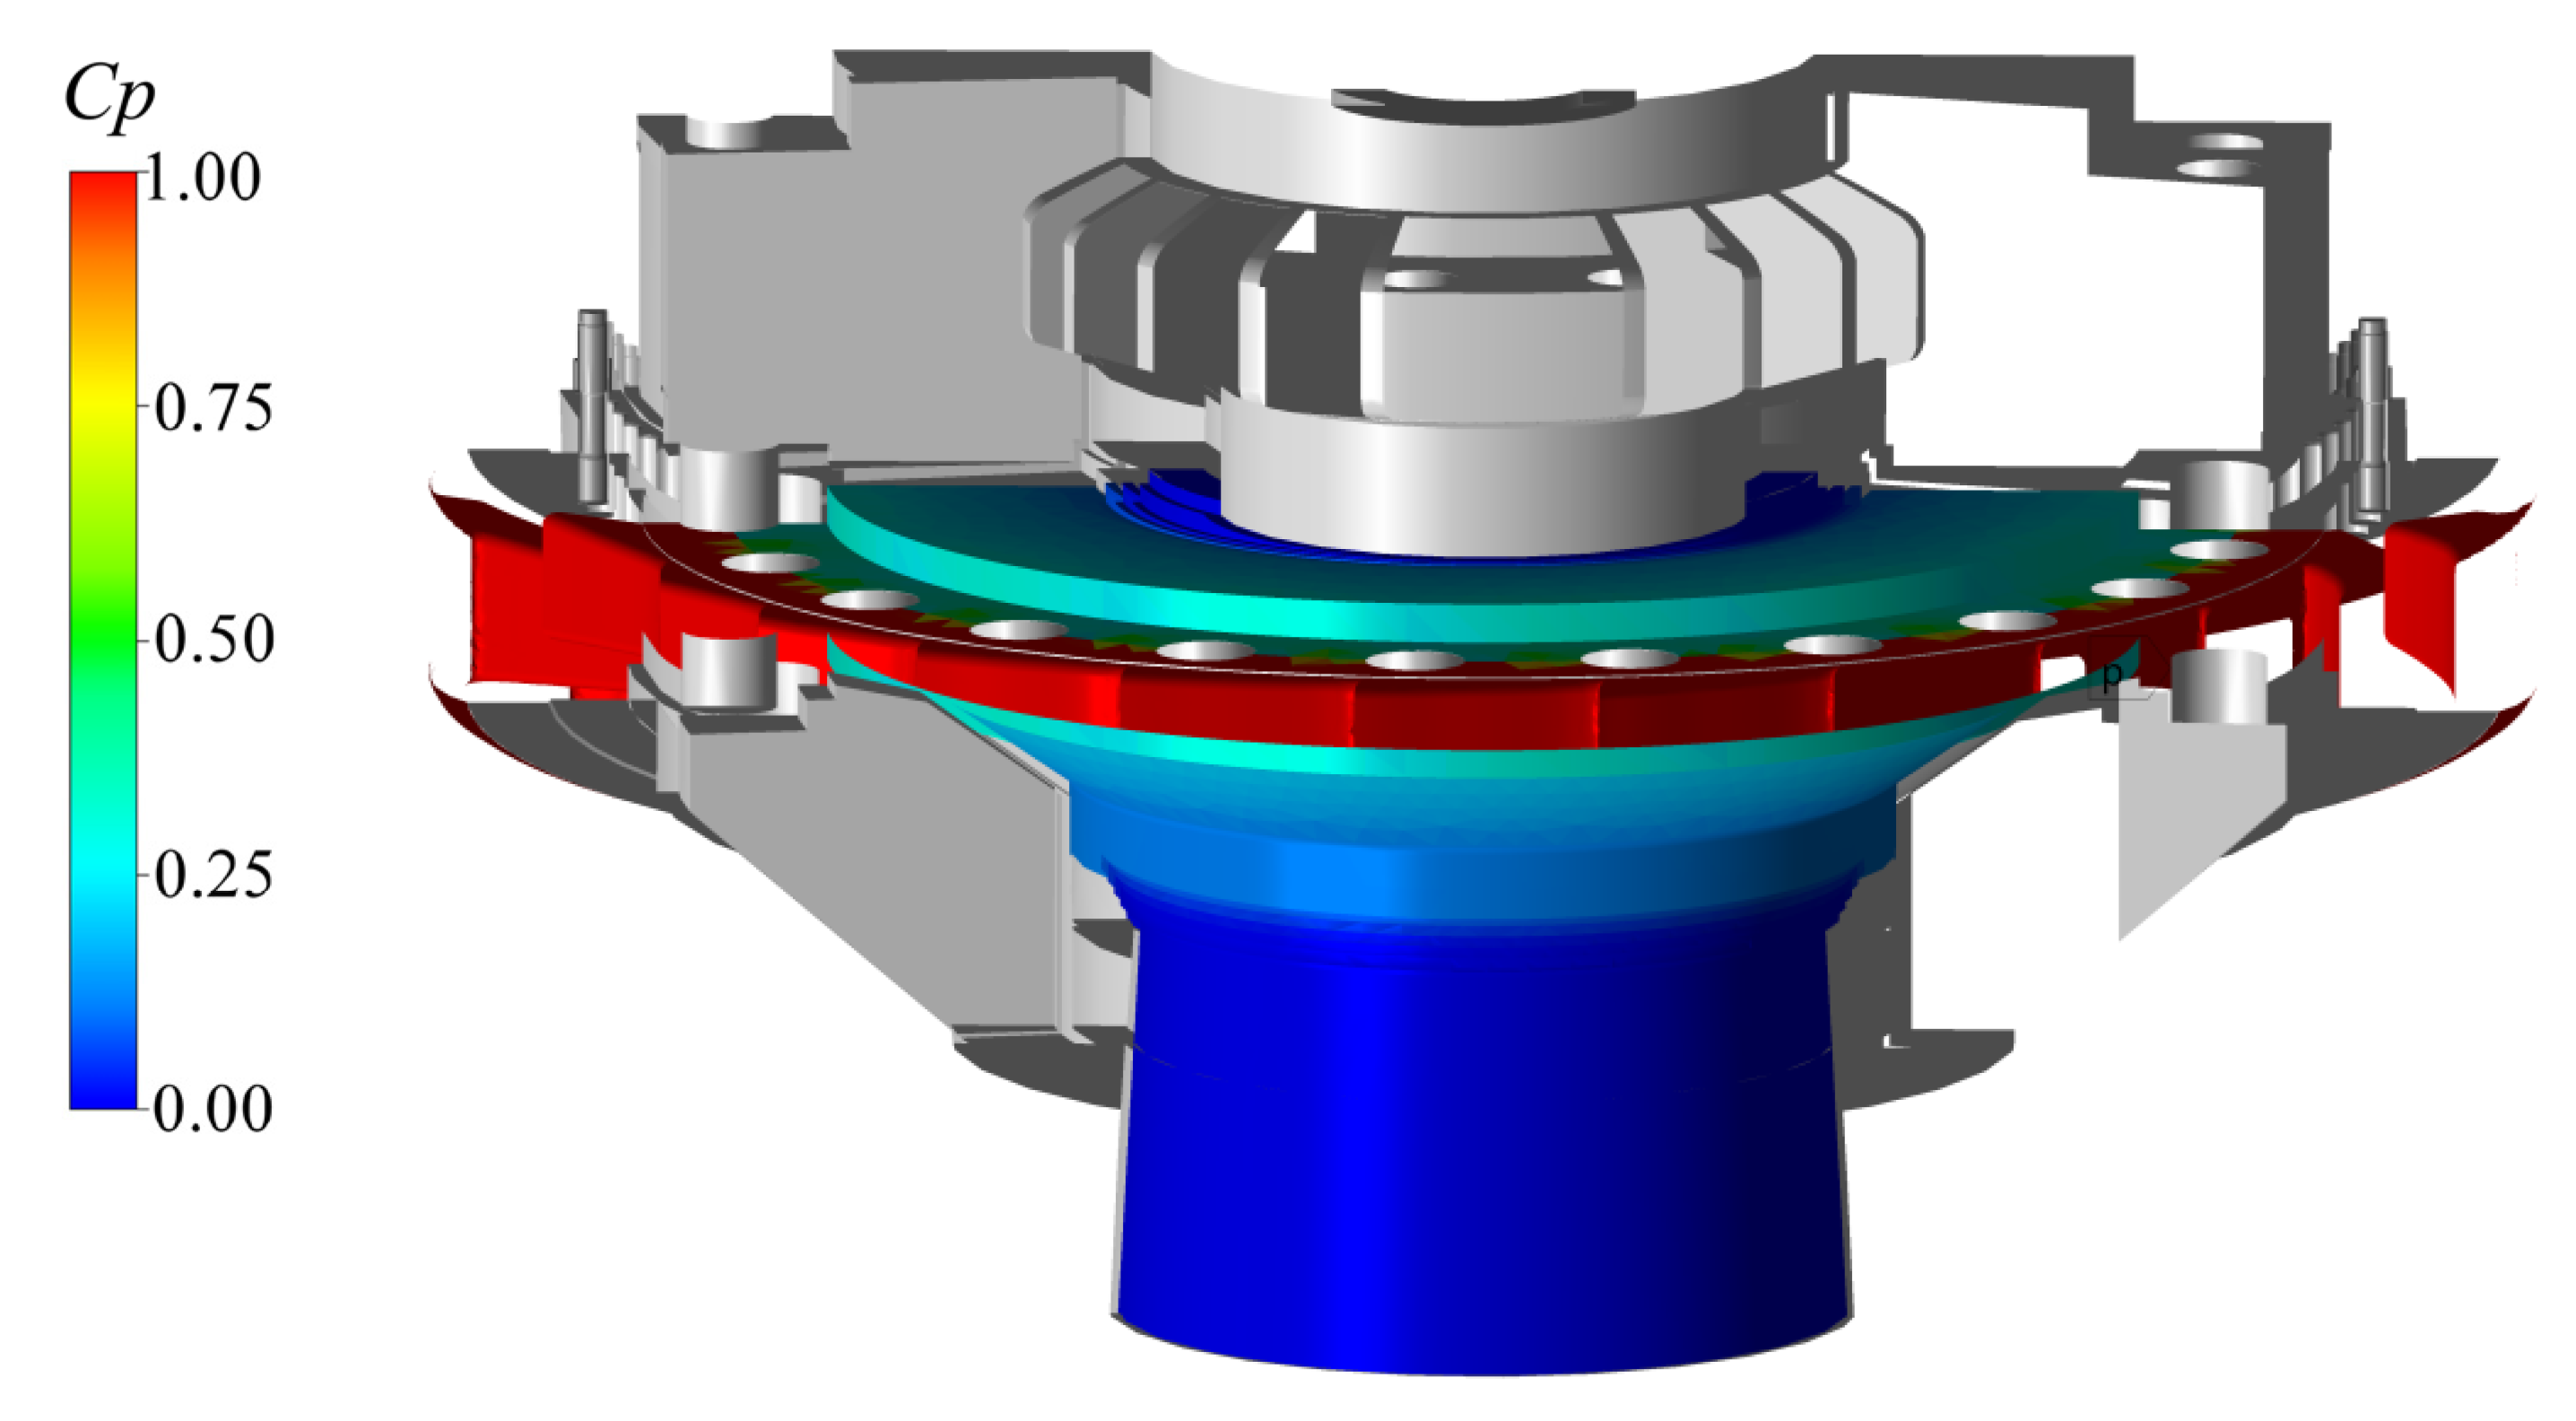
  • The fluid flow and pressure distribution of the pump-turbine flow channel during turbine start-up have been analysed. The head-cover and head-cover bolts are excited by large hydraulic forces, which cause uneven stress distribution of the structures in the circumferential direction.
  • As for the stress distribution of the head-cover bolts, the maximum stress occurs in the bolt with the least deformation. Due to the axisymmetric feature of the head-cover, the bolt positions with the maximum stress and with the maximum deformation differ by approximately 90 degrees in the circumferential direction.
  • The maximum von Mises stress of the head-cover during turbine start-up is located in the connecting surface of the head-cover flange and a head-cover bolt. The maximum stress of the head-cover is around 249 MPa, which is below the yield stress 265 MPa of the head-cover material.
  • The maximum von Mises stress of the stay ring during turbine start-up is in the fillet of the stay vane. The maximum stress of the stay ring is about 222 MPa, which is below the yield stress of 830 MPa of the stay ring material.
  • The maximum von Mises stress of the head-cover bolts due to pretension force is located in the middle of each bolt. The maximum stress of the head-cover bolts is about 430 MPa, which is below the yield stress of 960 MPa of the bolt material.
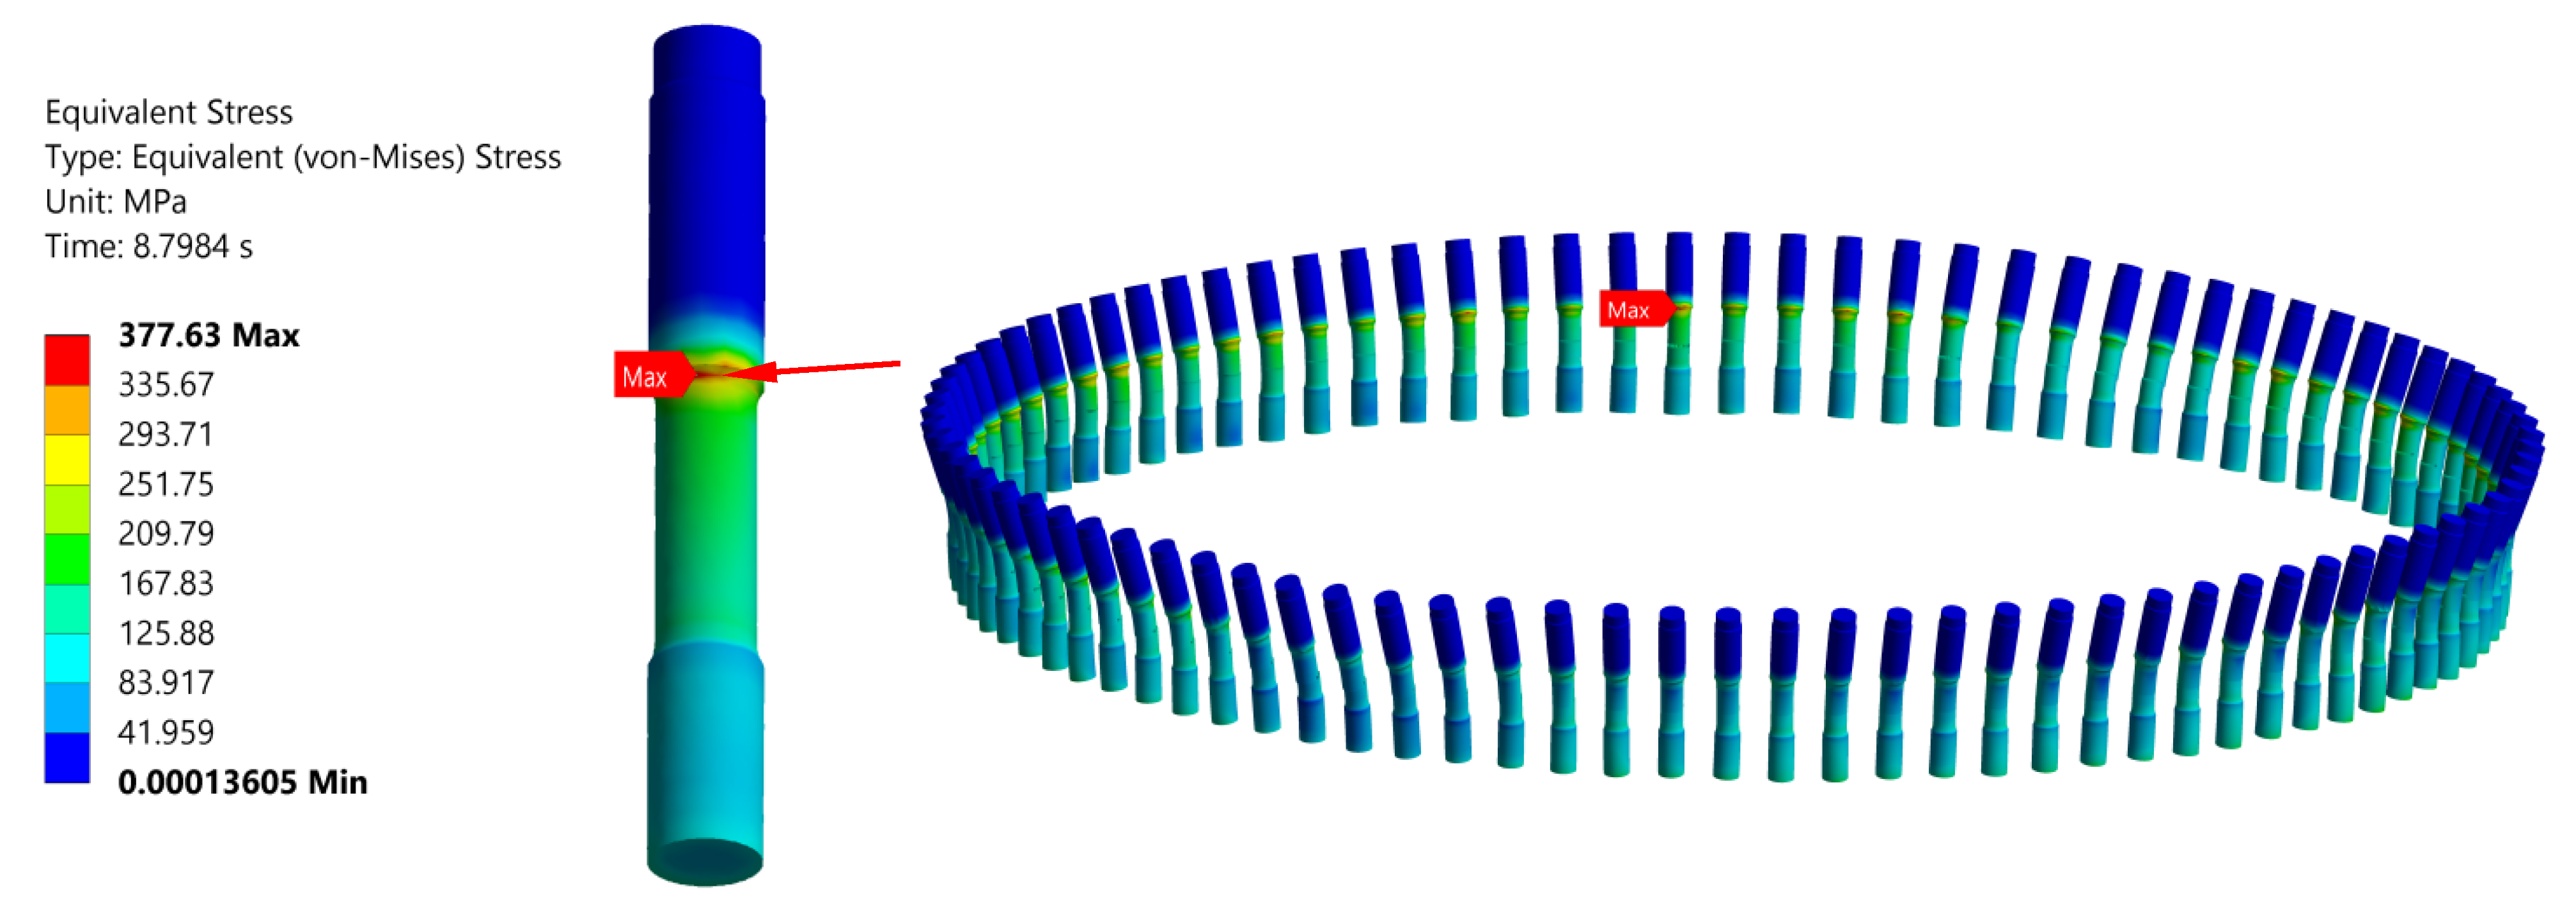
  • The maximum von Mises stress of the head-cover bolts during turbine start-up appears in the fillet of the bolts closed to the head-cover outer flange. The maximum stress of the head-cover bolts is about 377 MPa, which is below the yield stress of 960 MPa of the bolt material.
  • During turbine start-up, the maximum stress of the head-cover bolts and the head-cover follow the same trend. At a certain time, the maximum stress of the head-cover bolts is always higher than the stress of the head-cover. Additionally, the maximum stress of the guide vane is less than the one of the head-cover bolts and the head-cover.
  • It can be seen that the design of stationary structures and head-cover bolts are safe during turbine start-up which is a very challenging operation condition for the PT unit. The design, simulation methods, and conclusions in this investigation can be used as a good reference for evaluating the flow-induced stress characteristics of head-cover bolts of similar hydraulic pump-turbine units.

Author Contributions

Methodology, Z.W.; investigation, J.Y., J.Q.; validation, W.W.; writing—original draft preparation, Z.W.; writing—review and editing, X.H., W.Z. All authors have read and agreed to the published version of the manuscript.

Funding

This work was supported by National Natural Science Foundation of China (No.: 51876099).

Institutional Review Board Statement

Not applicable.

Informed Consent Statement

Not applicable.

Data Availability Statement

Not applicable.

Acknowledgments

Thanks for the test data provided by relevant units and the support of National Natural Science Foundation of China (No.: 51876099).

Conflicts of Interest

The authors declare no conflict of interest.

Abbreviations

CFDcomputational fluid dynamics
FEMfinite element method
FSCfluid–structure coupling
FVMfinite volume method
PSPSpumped-storage power station
PTpump-turbine

References

  1. Luna-Ramírez, A.; Campos-Amezcua, A.; Dorantes-Gómez, O.; Mazur-Czerwiec, Z.; Muñoz-Quezada, R. Failure Analysis of Runner Blades in a Francis Hydraulic Turbine—Case Study. Eng. Fail. Anal. 2016, 59, 314–325. [Google Scholar] [CrossRef]
  2. Peltier, R.; Boyko, A.; Popov, S.; Krajisnik, N. Investigating the Sayano-Shushenskaya Hydro Power Plant Disaster. Power 2010, 154, 48. [Google Scholar]
  3. Zhao, Q.; Chai, J.; Ma, C.; Ding, J.; Li, B. Causes of Header Bolt Fracture of a Pumped Storage Power Station. J. Yangtze River Sci. Res. Inst. 2019, 36, 134–138. [Google Scholar]
  4. Ling, L.; Rong, W. Failure Analysis on Fracture of Worm Gear Connecting Bolts. Eng. Fail. Anal. 2014, 36, 439–446. [Google Scholar] [CrossRef]
  5. Liu, D.; Shang, X. Failure Investigation of the Wind Turbine Blade Root Bolt. J. Fail. Anal. Prev. 2013, 13, 333–339. [Google Scholar] [CrossRef]
  6. Curtis, L.R. Metallurgical Failure Analysis of Fasteners in an Impeller Assembly. J. Fail. Anal. Prev. 2006, 6, 17–22. [Google Scholar] [CrossRef]
  7. Casanova, F.; Mantilla, C. Fatigue Failure of the Bolts Connecting a Francis Turbine with the Shaft. Eng. Fail. Anal. 2018, 90, 1–13. [Google Scholar] [CrossRef]
  8. Grimsmo, E.L.; Aalberg, A.; Langseth, M.; Clausen, A.H. Failure Modes of Bolt and Nut Assemblies under Tensile Loading. J. Constr. Steel Res. 2016, 126, 15–25. [Google Scholar] [CrossRef]
  9. Deng, X.; Li, H.; Huang, S.; Liu, H. Fatigue Life Research on the Connection Bolts of head-cover of Pump-Storage Plant. In Proceedings of the 2019 Annual Academic Conference of China Hydropower Engineering Society Power Grid Peak Shaving and Pumped Storage Professional Committee, Beijing, China, 1 September 2019; pp. 156–161. [Google Scholar]
  10. Huang, Y.; Guan, Z.; Li, H.; Yang, X.; Li, Z.; Sun, Y. Effects of Chamfering, Cold Expansion, Bolt Clamping, and Their Combinations on Fatigue Life of Aluminum–Lithium Alloy Single Plate. Adv. Mech. Eng. 2018, 10, 1687814017750681. [Google Scholar] [CrossRef] [Green Version]
  11. Shahani, A.R.; Shakeri, I. Experimental Evaluation of the Effect of Preload on the Fatigue Life of Bolts. Int. J. Steel Struct. 2015, 15, 693–701. [Google Scholar] [CrossRef]
  12. Luo, Y.; Chen, F.; Chen, L.; Wang, Z.; Yu, J.; Zhu, X.; Zhao, Z.; Ren, S.; Li, J.; Lu, X. Study on Stresses of head-cover Bolts in a pump-turbine Based on FSI. In IOP Conference Series: Earth and Environmental Science; IOP Publishing: Lausanne, Switzerland, 21 March 2021; Volume 804, p. 042062. [Google Scholar]
  13. Luo, Y.; Chen, F.; Chen, L.; Wang, Z.; Yu, J.; Luo, C.; Zhao, Z.; Ren, S.; Li, J.; Deng, D. Stresses and Relative Stiffness of the head-cover Bolts in a pump-turbine. In IOP Conference Series: Materials Science and Engineering; IOP Publishing: Stuttgart, Germany, 9 October 2019; Volume 493, p. 012113. [Google Scholar]
  14. Chen, F.; Chen, L.; Wang, Z.; Yu, J.; Luo, C.; Zhao, Z.; Ren, S.; Li, J.; Deng, D. Computation of Static Stresses of the head-cover Bolts in a pump-turbine. In IOP Conference Series: Materials Science and Engineering; IOP Publishing: Stuttgart, Germany, 9 October 2019; Volume 493, p. 012143. [Google Scholar]
  15. Brekke, H. Performance and Safety of Hydraulic Turbines. In IOP Conference Series: Earth and Environmental Science; IOP Publishing: Timisoara, Romania, 20 September 2010; Volume 12, p. 012061. [Google Scholar]
  16. Chen, L.; Li, H.; Yu, J.; Luo, Y.; Wang, Z.; Zhu, X.; Zhao, Z.; Lu, X. Stress Analysis of Screw Connection of Key Structural Components in pump-turbine. In IOP Conference Series: Earth and Environmental Science; IOP Publishing: Lausanne, Switzerland, 21 March 2021; Volume 804, p. 032037. [Google Scholar]
  17. Gagnon, M.; Tahan, A.; Bocher, P.; Thibault, D. Impact of startup scheme on Francis runner life expectancy. In IOP Conference Series: Earth and Environmental Science; IOP Publishing: Timisoara, Romania, 20 September 2010; Volume 12. [Google Scholar] [CrossRef]
  18. Gagnon, M.; Nicolle, J.; Morissette, J.; Lawrence, M. A look at Francis runner blades response during transients. In IOP Conference Series: Earth and Environmental Science; IOP Publishing: Grenoble, France, 4 July 2016; Volume 49, p. 052005. [Google Scholar] [CrossRef] [Green Version]
  19. Seidel, U.; Mende, C.; Hübner, B.; Weber, W.; Otto, A. Dynamic loads in Francis runners and their impact on fatigue life. In IOP Conference Series: Earth and Environmental Science; IOP Publishing: Montreal, Canada, 22 September 2014; Volume 22, p. 032054. [Google Scholar] [CrossRef] [Green Version]
  20. Huang, X.; Chamberland-Lauzon, J.; Oram, C.; Klopfer, A.; Ruchonnet, N. Fatigue analyses of the prototype Francis runners based on site measurements and simulations. In IOP Conference Series: Earth and Environmental Science; IOP Publishing: Montreal, QC, Canada, 22 September 2014; Volume 22, p. 012014. [Google Scholar] [CrossRef] [Green Version]
  21. Liang, Q.; Lais, S.; Gentner, C.; Braun, O. Efficient runner safety assessment during early design phase and root cause analysis. In Proceedings of the 26th IAHR Symp. on Hydraulic Machinery and Systems, Beijing, China, 19 August 2012. [Google Scholar]
  22. Lais, S.; Liang, Q.; Henggeler, U.; Weiss, T.; Escaler, X.; Egusquiza, E. Dynamic Analysis of Francis Runners-Experiment and Numerical Simulation. Int. J. Fluid Mach. Syst. 2009, 2, 303–314. [Google Scholar] [CrossRef] [Green Version]
  23. Xie, J.; Huang, B.; Fu, L. Reinforcement and resonance control of head cover of Francis turbine by finite element analysis and modal testing. In IOP Conference Series: Earth and Environmental Science; IOP Publishing: Bristol, UK, 3 July 2020; Volume 560, p. 012051. [Google Scholar] [CrossRef]
  24. Jia, Y.; Li, F.; Wei, X.; Li, X.; Li, Z. A method for analysis of head cover deformation and vibration amplitude in Francis hydro-turbine system by combination of CFD and FEA. J. Mech. Sci. Technol. 2017, 31, 4255–4266. [Google Scholar] [CrossRef]
  25. Zhang, Y.; Chen, T.; Li, J.; Yu, J. Experimental study of load variations on pressure pulsations in a prototype reversible pump-turbine in generating mode. Fluids Eng. 2017, 139, 074501. [Google Scholar] [CrossRef]
  26. Wang, W.; Wang, X.; Wang, Z.; Ni, M.; Yang, C. Analysis of Internal Flow Characteristics of a start-up pump-turbine at the Lowest Head under No-Load Conditions. J. Mar. Sci. Eng. 2021, 9, 1360. [Google Scholar] [CrossRef]
  27. Mao, Z.; Tao, R.; Chen, F.; Wang, Z. Investigation of the Starting-Up Axial Hydraulic Force and Structure Characteristics of pump-turbine in Pump Mode. Mar. Sci. Eng. 2021, 9, 158. [Google Scholar] [CrossRef]
  28. Egusquiza, E.; Valero, M.; Presas, A.; Huang, X.; Guardo, A.; Seidel, U. Analysis of the dynamic response of pump-turbine impellers. Influ. Rotor. Mech. Syst. Signal Process. 2016, 68–69, 330–341. [Google Scholar] [CrossRef]
  29. He, L.; Wang, Z.; Kurosawa, S.; Nakahara, Y. Resonance investigation of pump-turbine during startup process. In IOP Conference Series: Earth and Environmental Science; IOP Publishing: Montreal, QC, Canada, 2014; Volume 22, p. 32024. [Google Scholar]
  30. Kolsek, T.; Duhovnik, J.; Bergant, A. Simulation of unsteady flow and runner rotation during shut-down of an axial water turbine. J. Hydraul. Res. Jan. 2006, 44, 129–137. [Google Scholar] [CrossRef]
  31. Ciocan, G.D.; Iliescu, M.S.; Vu, T.C.; Nennemann, B.; Avellan, F. Experimental Study and Numerical Simulation of the FLINDT Draft Tube Rotating Vortex. J. Fluids Eng. 2006, 129, 146–158. [Google Scholar] [CrossRef]
  32. Huang, X.; Oram, C.; Sick, M. Static and dynamic stress analyses of the prototype high head Francis runner based on site measurement. In IOP Conference Series: Earth and Environmental Science; IOP Publishing: Montreal, QC, Canada, 2014; Volume 2, p. 032052. [Google Scholar]
  33. Goyal, R.; Cervantes, M.; Gandhi, B. Characteristics of Synchronous and Asynchronous modes of fluctuations in Francis turbine draft tube during load variation. Int. J. Fluid Mach. Syst. 2017, 10, 164–175. [Google Scholar] [CrossRef]
  34. Fu, X.; Li, D.; Wang, H.; Zhang, G.; Li, Z.; Wei, X. Dynamic instability of a pump-turbine in load rejection transient process. Sci. China (Technol. Sci.) 2018, 61, 1765–1775. [Google Scholar] [CrossRef]
  35. Avdyushenko, A.; Chernyi, S.; Chirkov, D. Numerical algorithm for modelling three-dimensional flows of an incompressible fluid using moving grids. Comput. Technol. 2012, 17, 3–25. [Google Scholar]
  36. Widmer, C.; Staubli, T.; Ledergerber, N. Unstable Characteristics and Rotating Stall in Turbine Brake Operation of Pump-Turbines. J. Fluids Eng. 2011, 133, 041101. [Google Scholar] [CrossRef]
  37. Nicolle, J.; Giroux, A.; Morissette, J. CFD configurations for hydraulic turbine startup. In IOP Conference Series: Earth and Environmental Science; IOP Publishing: Montreal, QC, Canada, 2014; Volume 22, p. 032021. [Google Scholar]
  38. Bi, H.; Chen, F.; Wang, C.; Wang, Z.; Fan, H.; Luo, Y. Analysis of dynamic performance in a pump-turbine during the successive load rejection. In IOP Conference Series: Earth and Environmental Science; IOP Publishing: Lausanne, Switzerland, 2021; Volume 774, p. 012152. [Google Scholar]
  39. Li, X.; Mao, Z.; Lin, W.; Bi, H.; Tao, R.; Wang, Z. Prediction and Analysis of the Axial Force of Pump-Turbine during Load-Rejection Process. In IOP Conference Series: Earth and Environmental Science; IOP Publishing: Lausanne, Switzerland, 2021; Volume 440, p. 052081. [Google Scholar]
  40. Münch, C.; Ausoni, P.; Braun, O.; Farhat, M.; Avellan, F. Fluid–structure coupling for an oscillating hydrofoil. J. Fluids Struct. 2010, 26, 1018–1033. [Google Scholar] [CrossRef]
  41. Benra, F.; Dohmen, H. Comparison of Pump Impeller Orbit Curves Obtained by Measurement and FSI Simulation. Asme Press. Vessel. Pip. Conf. 2007, 42827, 41–48. [Google Scholar]
  42. Kato, C.; Yoshimura, S.; Yamade, Y.; Jiang, Y.Y.; Wang, H.; Imai, R.; Katsura, H.; Yoshida, T.; Takano, Y. Prediction of the Noise From a Multi-Stage Centrifugal Pump. In Proceedings of the Fluids Engineering Division Summer Meeting, Houston, TX, USA, 19 June 2005. [Google Scholar]
  43. Jiang, Y.; Yoshimura, S.; Imai, R.; Katsura, H.; Yoshida, T.; Kato, C. Quantitative evaluation of flow-induced structural vibration and noise in turbomachinery by full-scale weakly coupled simulation. J. Fluids Struct. 2007, 23, 531–544. [Google Scholar] [CrossRef]
  44. Menter, F.R. Two-equation eddy-viscosity turbulence models for engineering applications. AIAA 1994, 32, 1598–1605. [Google Scholar] [CrossRef] [Green Version]
Figure 1. Fracture of two head-cover bolts [3].
Energies 15 01832 g001
Figure 2. 3D models and the boundary conditions of the flow field simulation [26].
Energies 15 01832 g002
Figure 3. Finite volume mesh of the entire flow field of the PT unit.
Energies 15 01832 g003
Figure 4. Comparison of numerical simulation and experimental results [26].
Energies 15 01832 g004
Figure 5. The operating parameters of the PT unit during turbine start-up.
Energies 15 01832 g005
Figure 6. Pressure distribution of the PT flow channel during turbine start-up.
Energies 15 01832 g006aEnergies 15 01832 g006b
Figure 7. Pressure distribution of the critical zone during turbine start-up.
Energies 15 01832 g007
Figure 8. The internal flow characteristic of the PT unit during turbine start-up.
Energies 15 01832 g008aEnergies 15 01832 g008b
Figure 9. The internal flow changes in the runner during turbine start-up.
Energies 15 01832 g009aEnergies 15 01832 g009b
Figure 10. 3D model and the boundary conditions of the investigated structures.
Energies 15 01832 g010
Figure 11. Finite element mesh of the investigated structures.
Energies 15 01832 g011
Figure 12. Mesh sensitivity analysis.
Energies 15 01832 g012
Figure 13. Preload applied on the head-cover bolts.
Energies 15 01832 g013
Figure 14. The mapped pressure distribution on the structural components (8.8 s).
Energies 15 01832 g014
Figure 15. The relative hydraulic force coefficient of the head-cover during turbine start-up.
Energies 15 01832 g015
Figure 16. The maximum stress and the maximum deformation of the head-cover during turbine start-up.
Energies 15 01832 g016
Figure 17. Total deformation distribution of the head-cover.
Energies 15 01832 g017
Figure 18. Von Mises stress distribution of the head-cover.
Energies 15 01832 g018
Figure 19. The maximum stress of the stay vane during turbine start-up.
Energies 15 01832 g019
Figure 20. Von Mises stress distribution on the stay ring.
Energies 15 01832 g020
Figure 21. Stress distribution of the head-cover bolts under preload.
Energies 15 01832 g021
Figure 22. Von Mises stress distribution of the head-cover bolts.
Energies 15 01832 g022
Figure 23. Comparison of the maximum stress during turbine start-up.
Energies 15 01832 g023
Figure 24. Stress and deformation distribution in the cross-section of different bolts.
Energies 15 01832 g024
Table 1. Element numbers of the finite volume mesh for each sub-domain.
Spiral CaseStay VaneGuide
Vane
RunnerCrown
Chamber
Band
Chamber
Pressure-Balance PipeDraft
Tube
Total
Element
number
57,796103,493593,2103,417,050531,518422,70053,11386,0415,264,921
Table 2. Material and mechanical properties of the structures.
Head-Cover BoltHead-CoverStay Ring
Material34CrNi3MoQ345CCr13Ni5Mo
Density (kg·m−3)785078507850
Elastic modulus (MPa)2.1 × 1052.1 × 1052.1 × 105
Poisson’s ratio 0.30.30.3
Tightening force (kN)4196--
Yield stress (MPa)960265830
Ultimate stress (MPa)1100450980
Publisher’s Note: MDPI stays neutral with regard to jurisdictional claims in published maps and institutional affiliations.

