
Seismic-Geological Integrated Study on Sedimentary Evolution and Peat Accumulation Regularity of the Shanxi Formation in Xinjing Mining Area, Qinshui Basin

 ,
,
Abstract
:1. Introduction
2. Geological Background
2.1. Tectonic Setting
2.2. Coal-Bearing Formations and Coal Seams
2.3. Lithofacies and Sedimentary Facies Types
3. Data and Method
3.1. Data Base
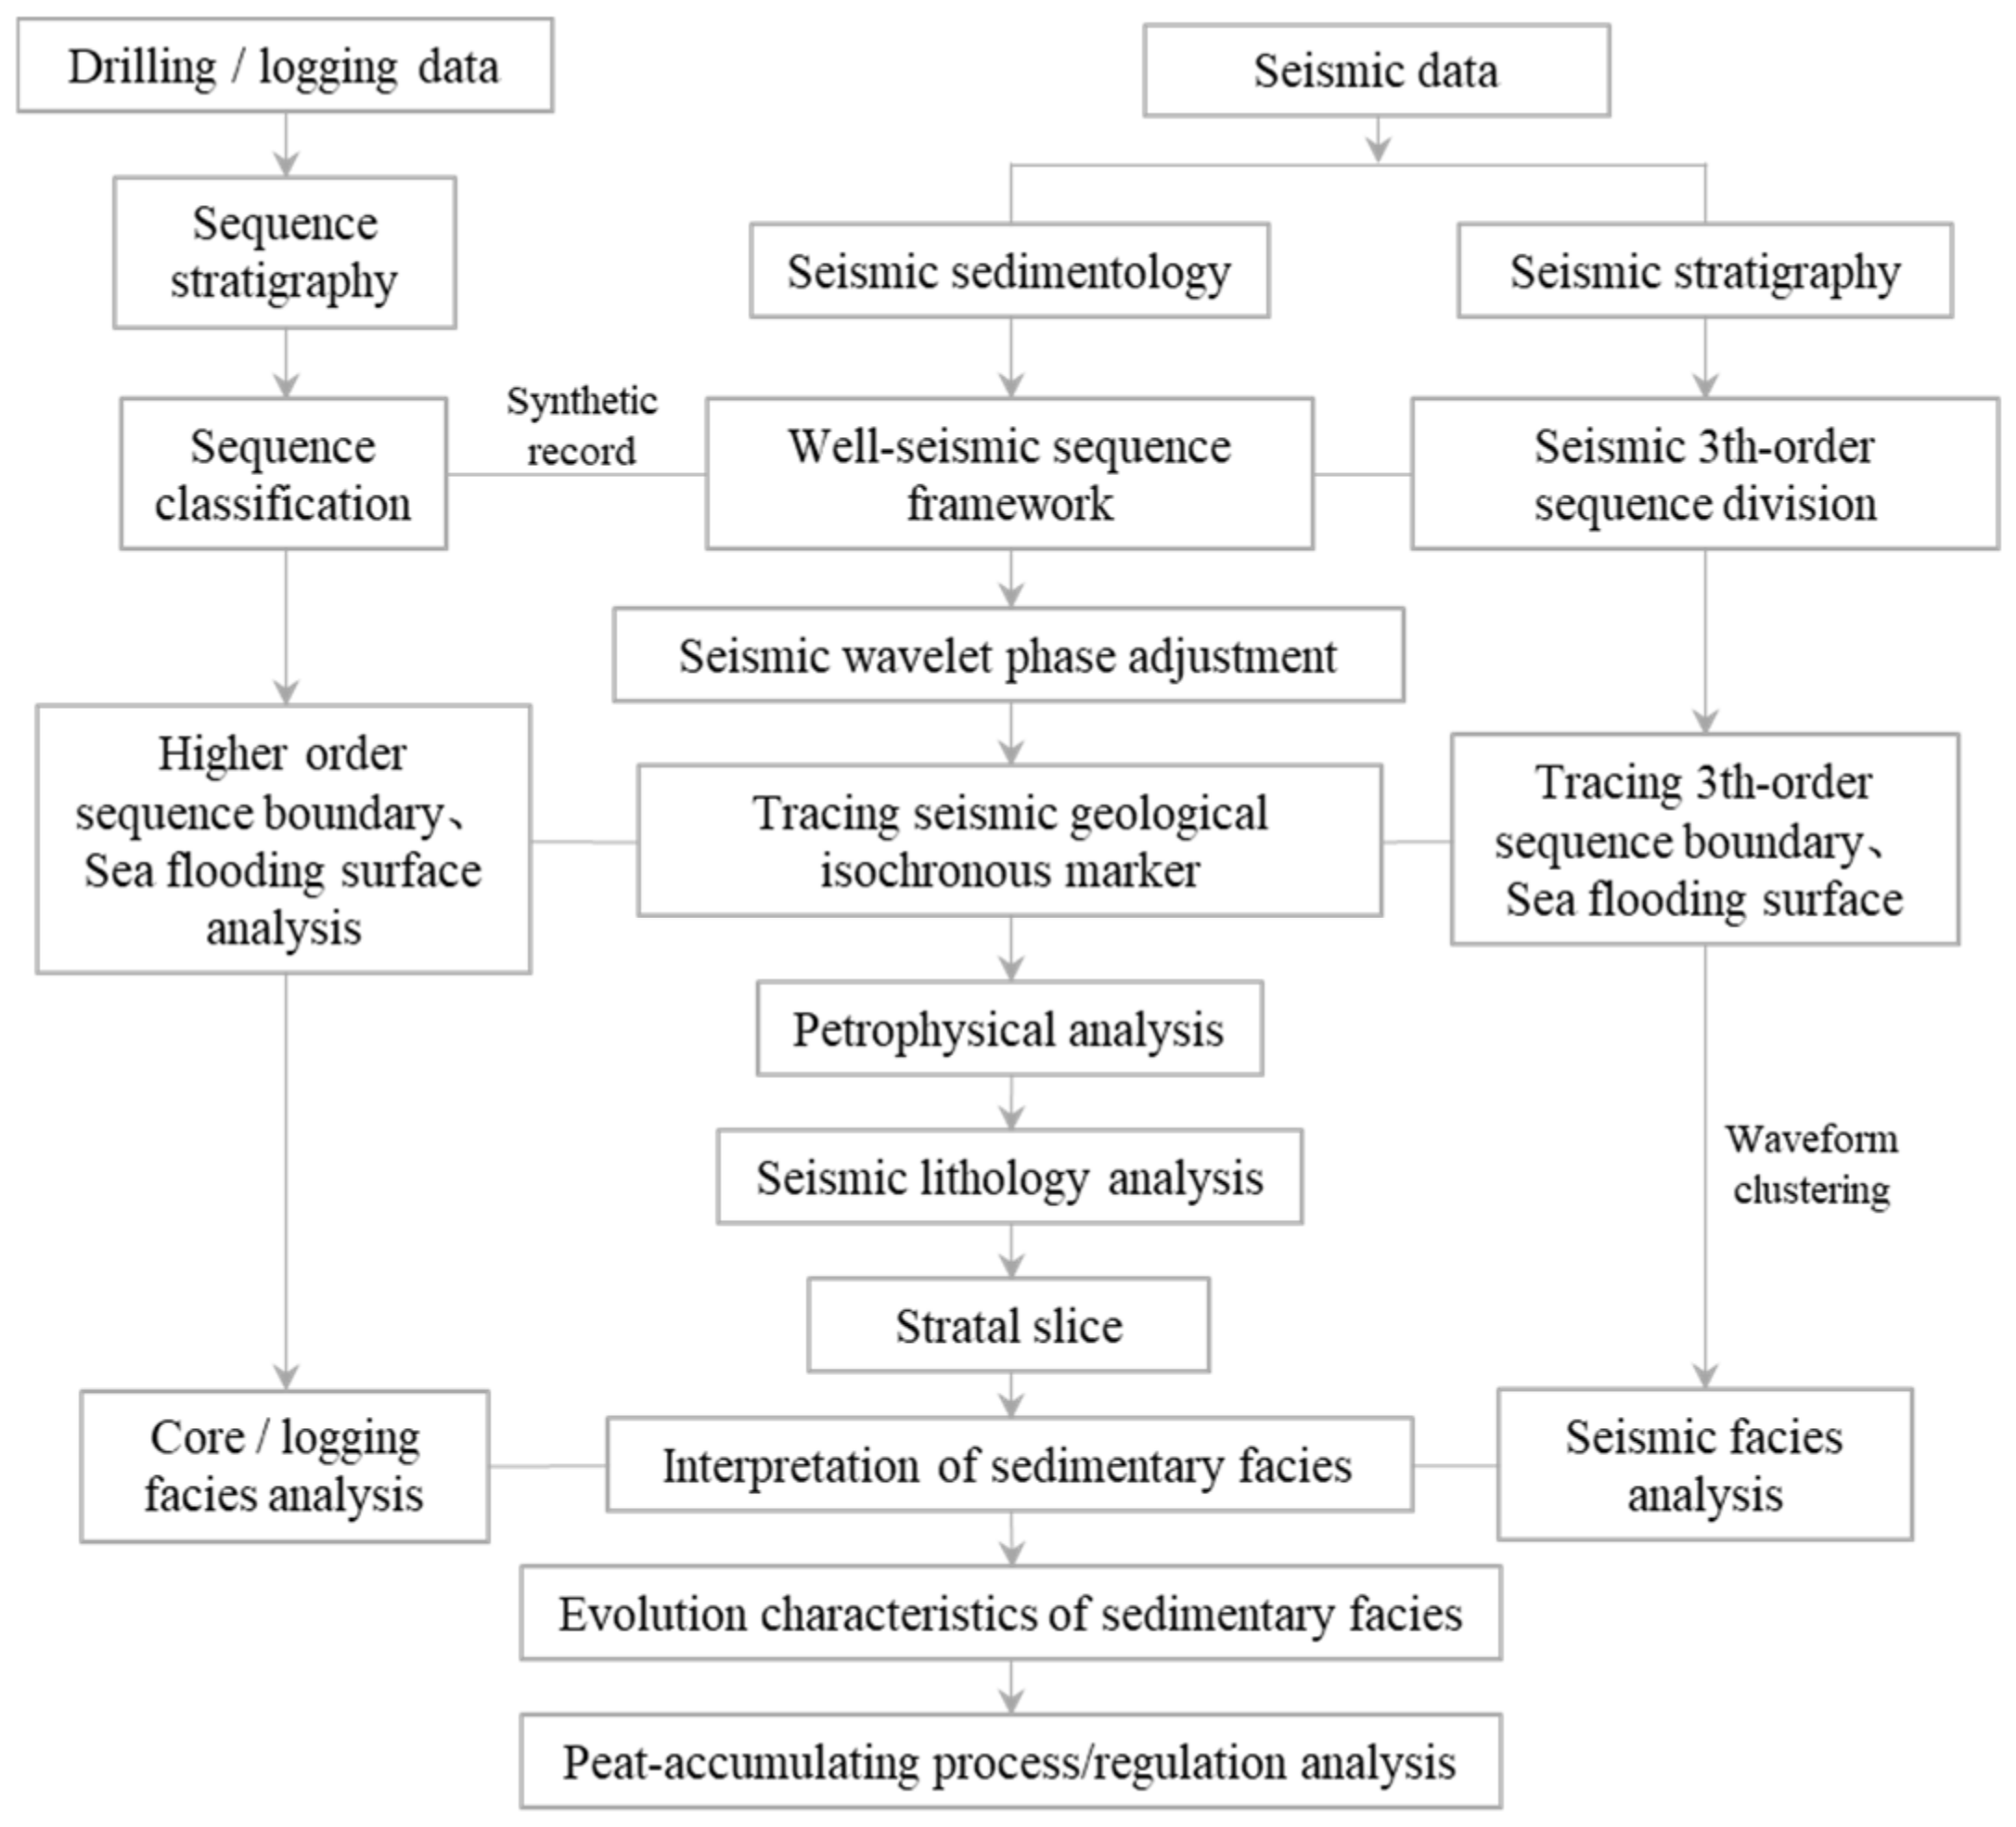
3.2. Method
4. Results and Discussion
4.1. Isochronous Stratigraphic Frame
4.1.1. Sequence Classification
Identification of Sequence Boundary
Sequence Classification
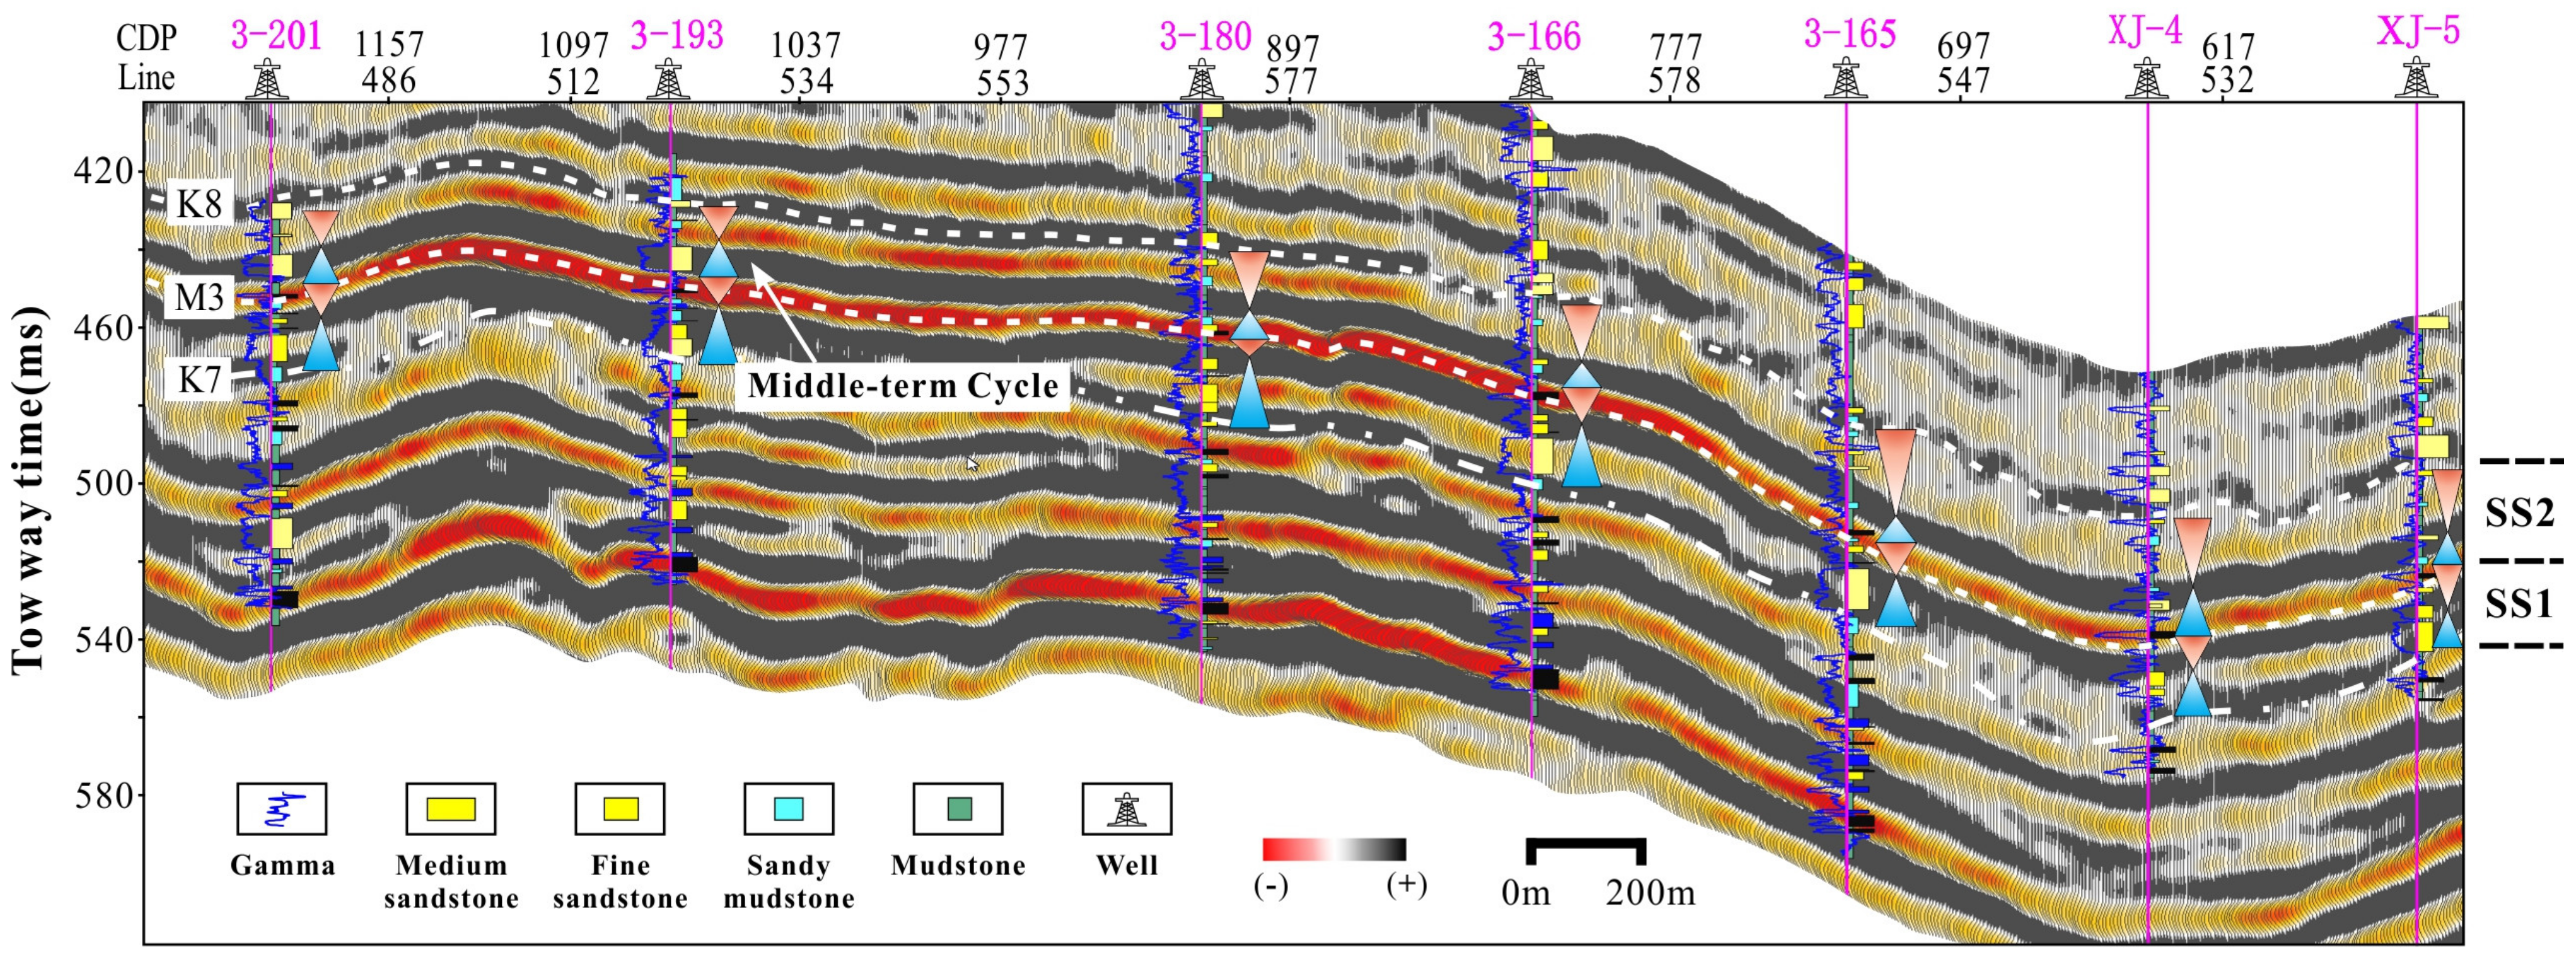
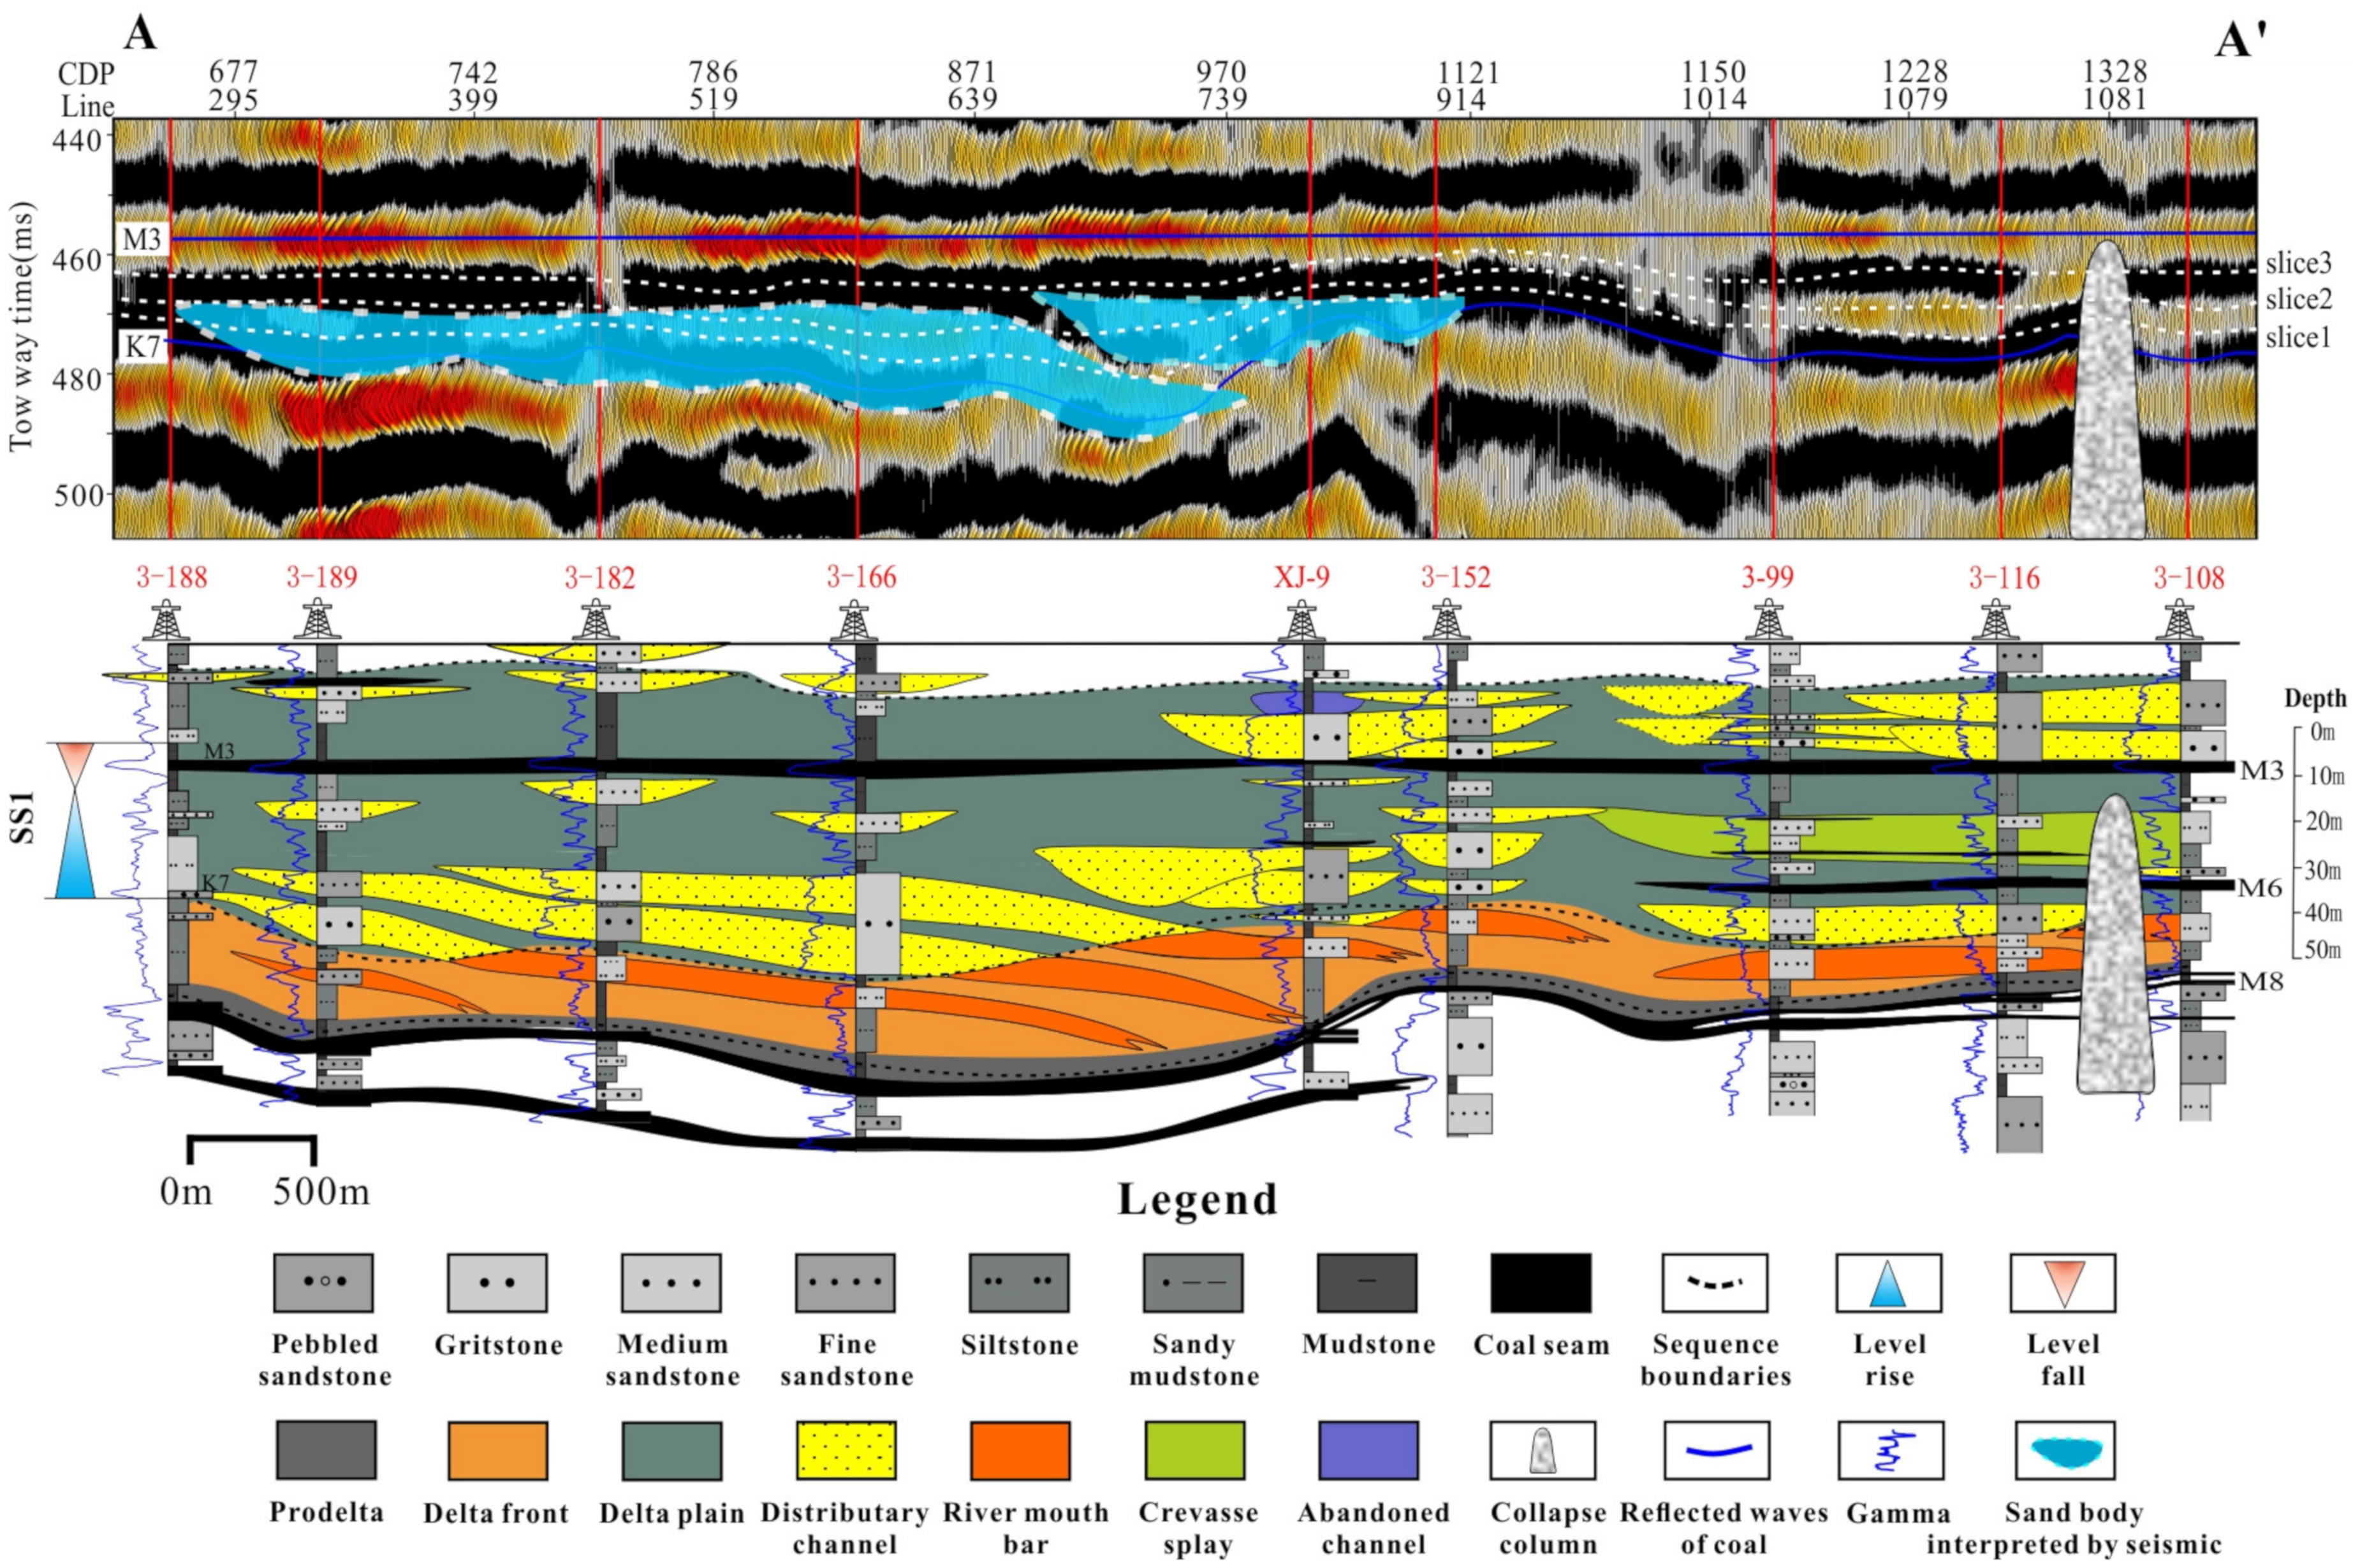
4.1.2. Seismic–Geological Isochronous Stratigraphic Framework
4.2. Petrophysics and Seismic Lithology
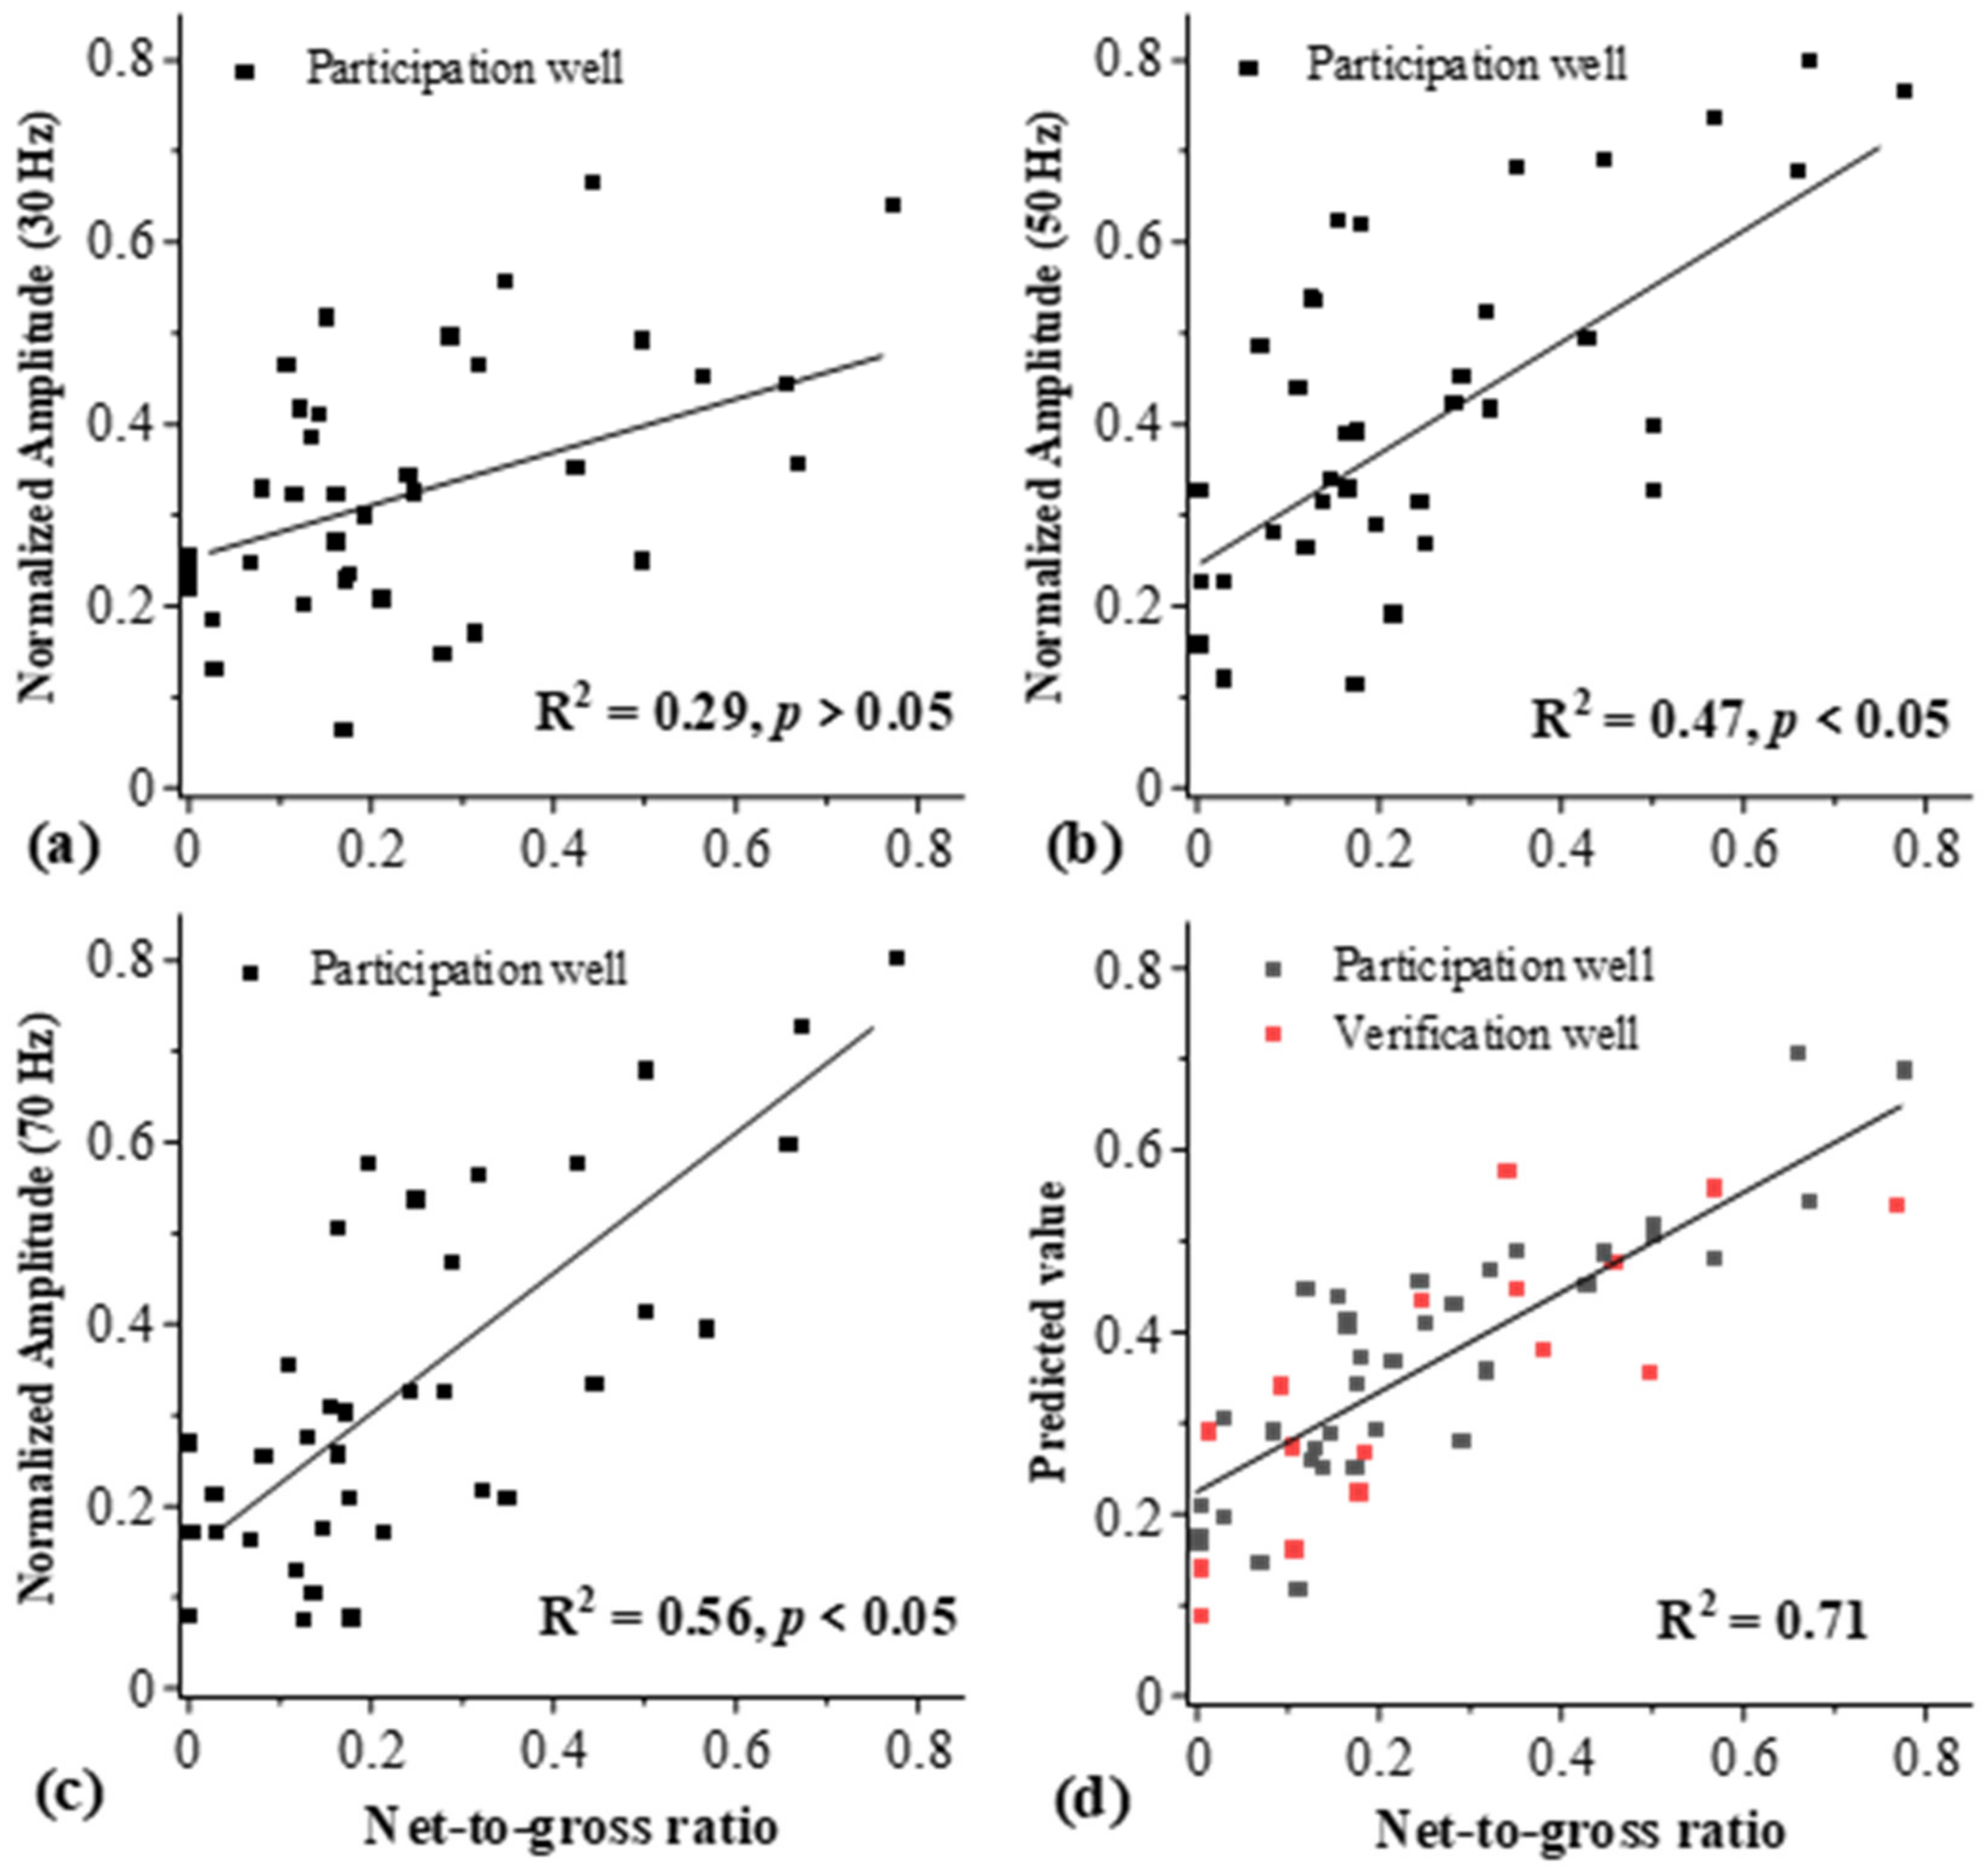
4.2.1. Petrophysical Analysis
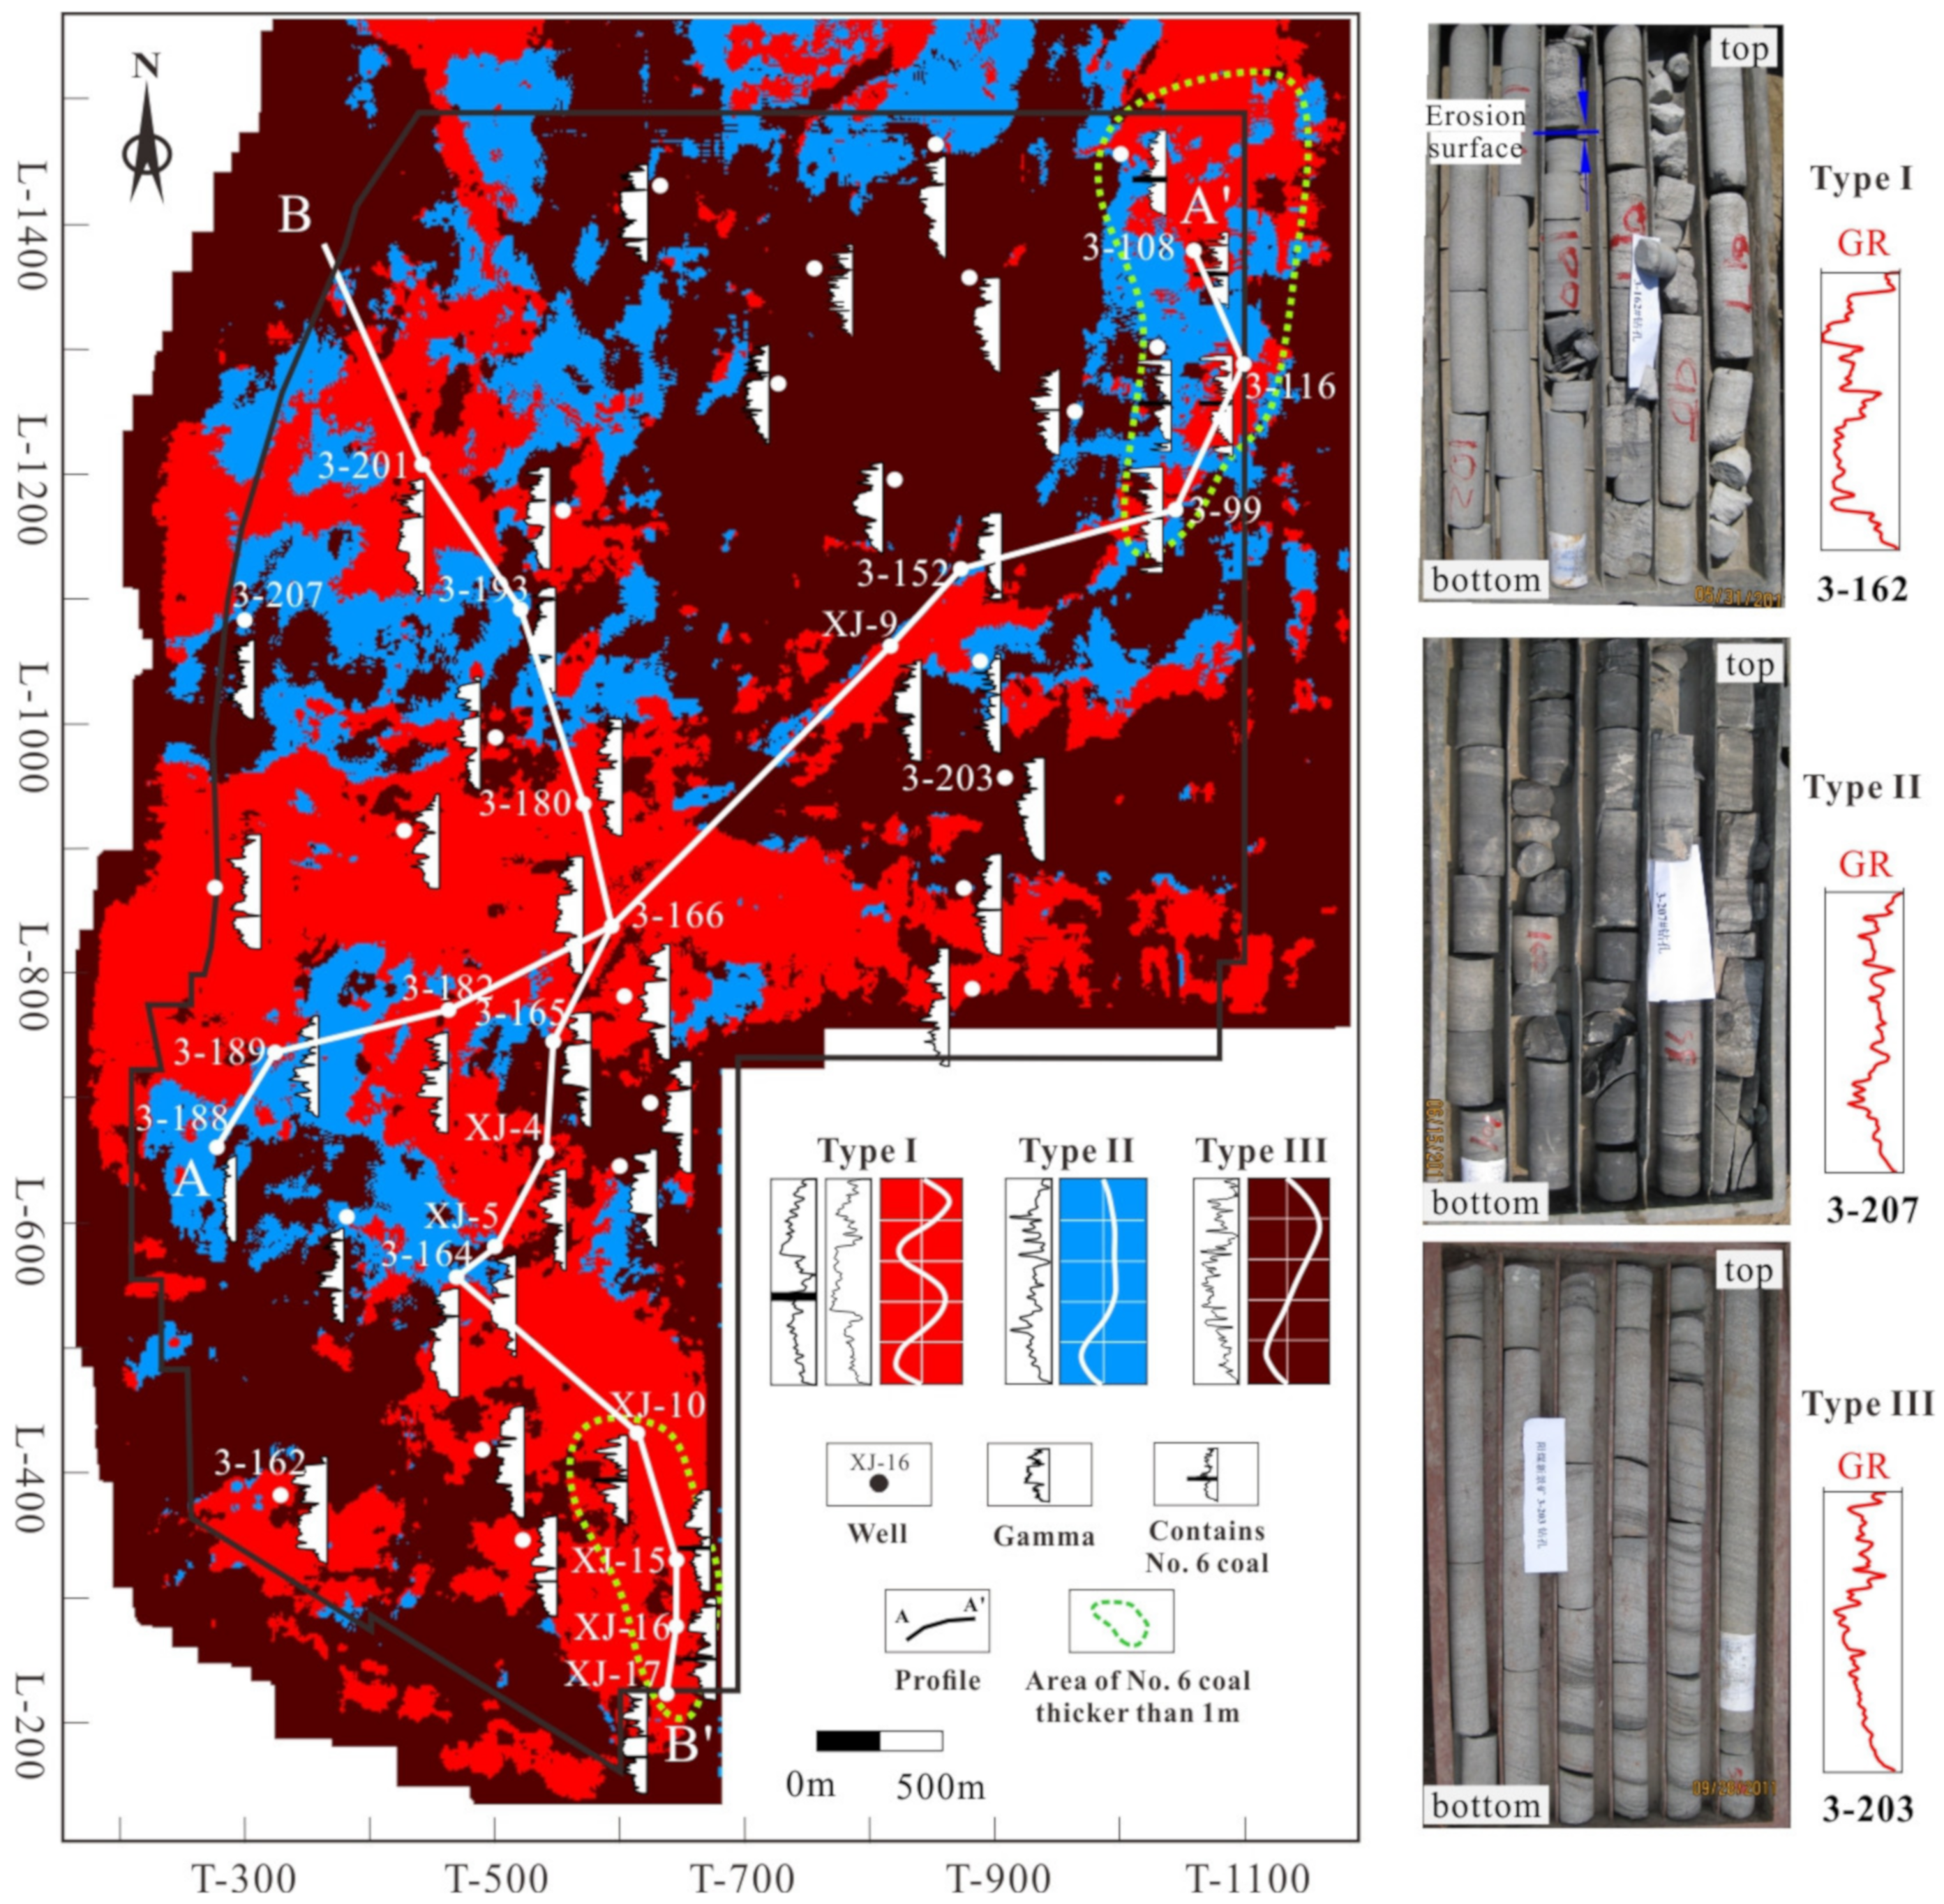
4.2.2. Seismic Lithology Characteristics
4.3. Coal-Bearing Series Sedimentary Facies and Evolution Characteristics
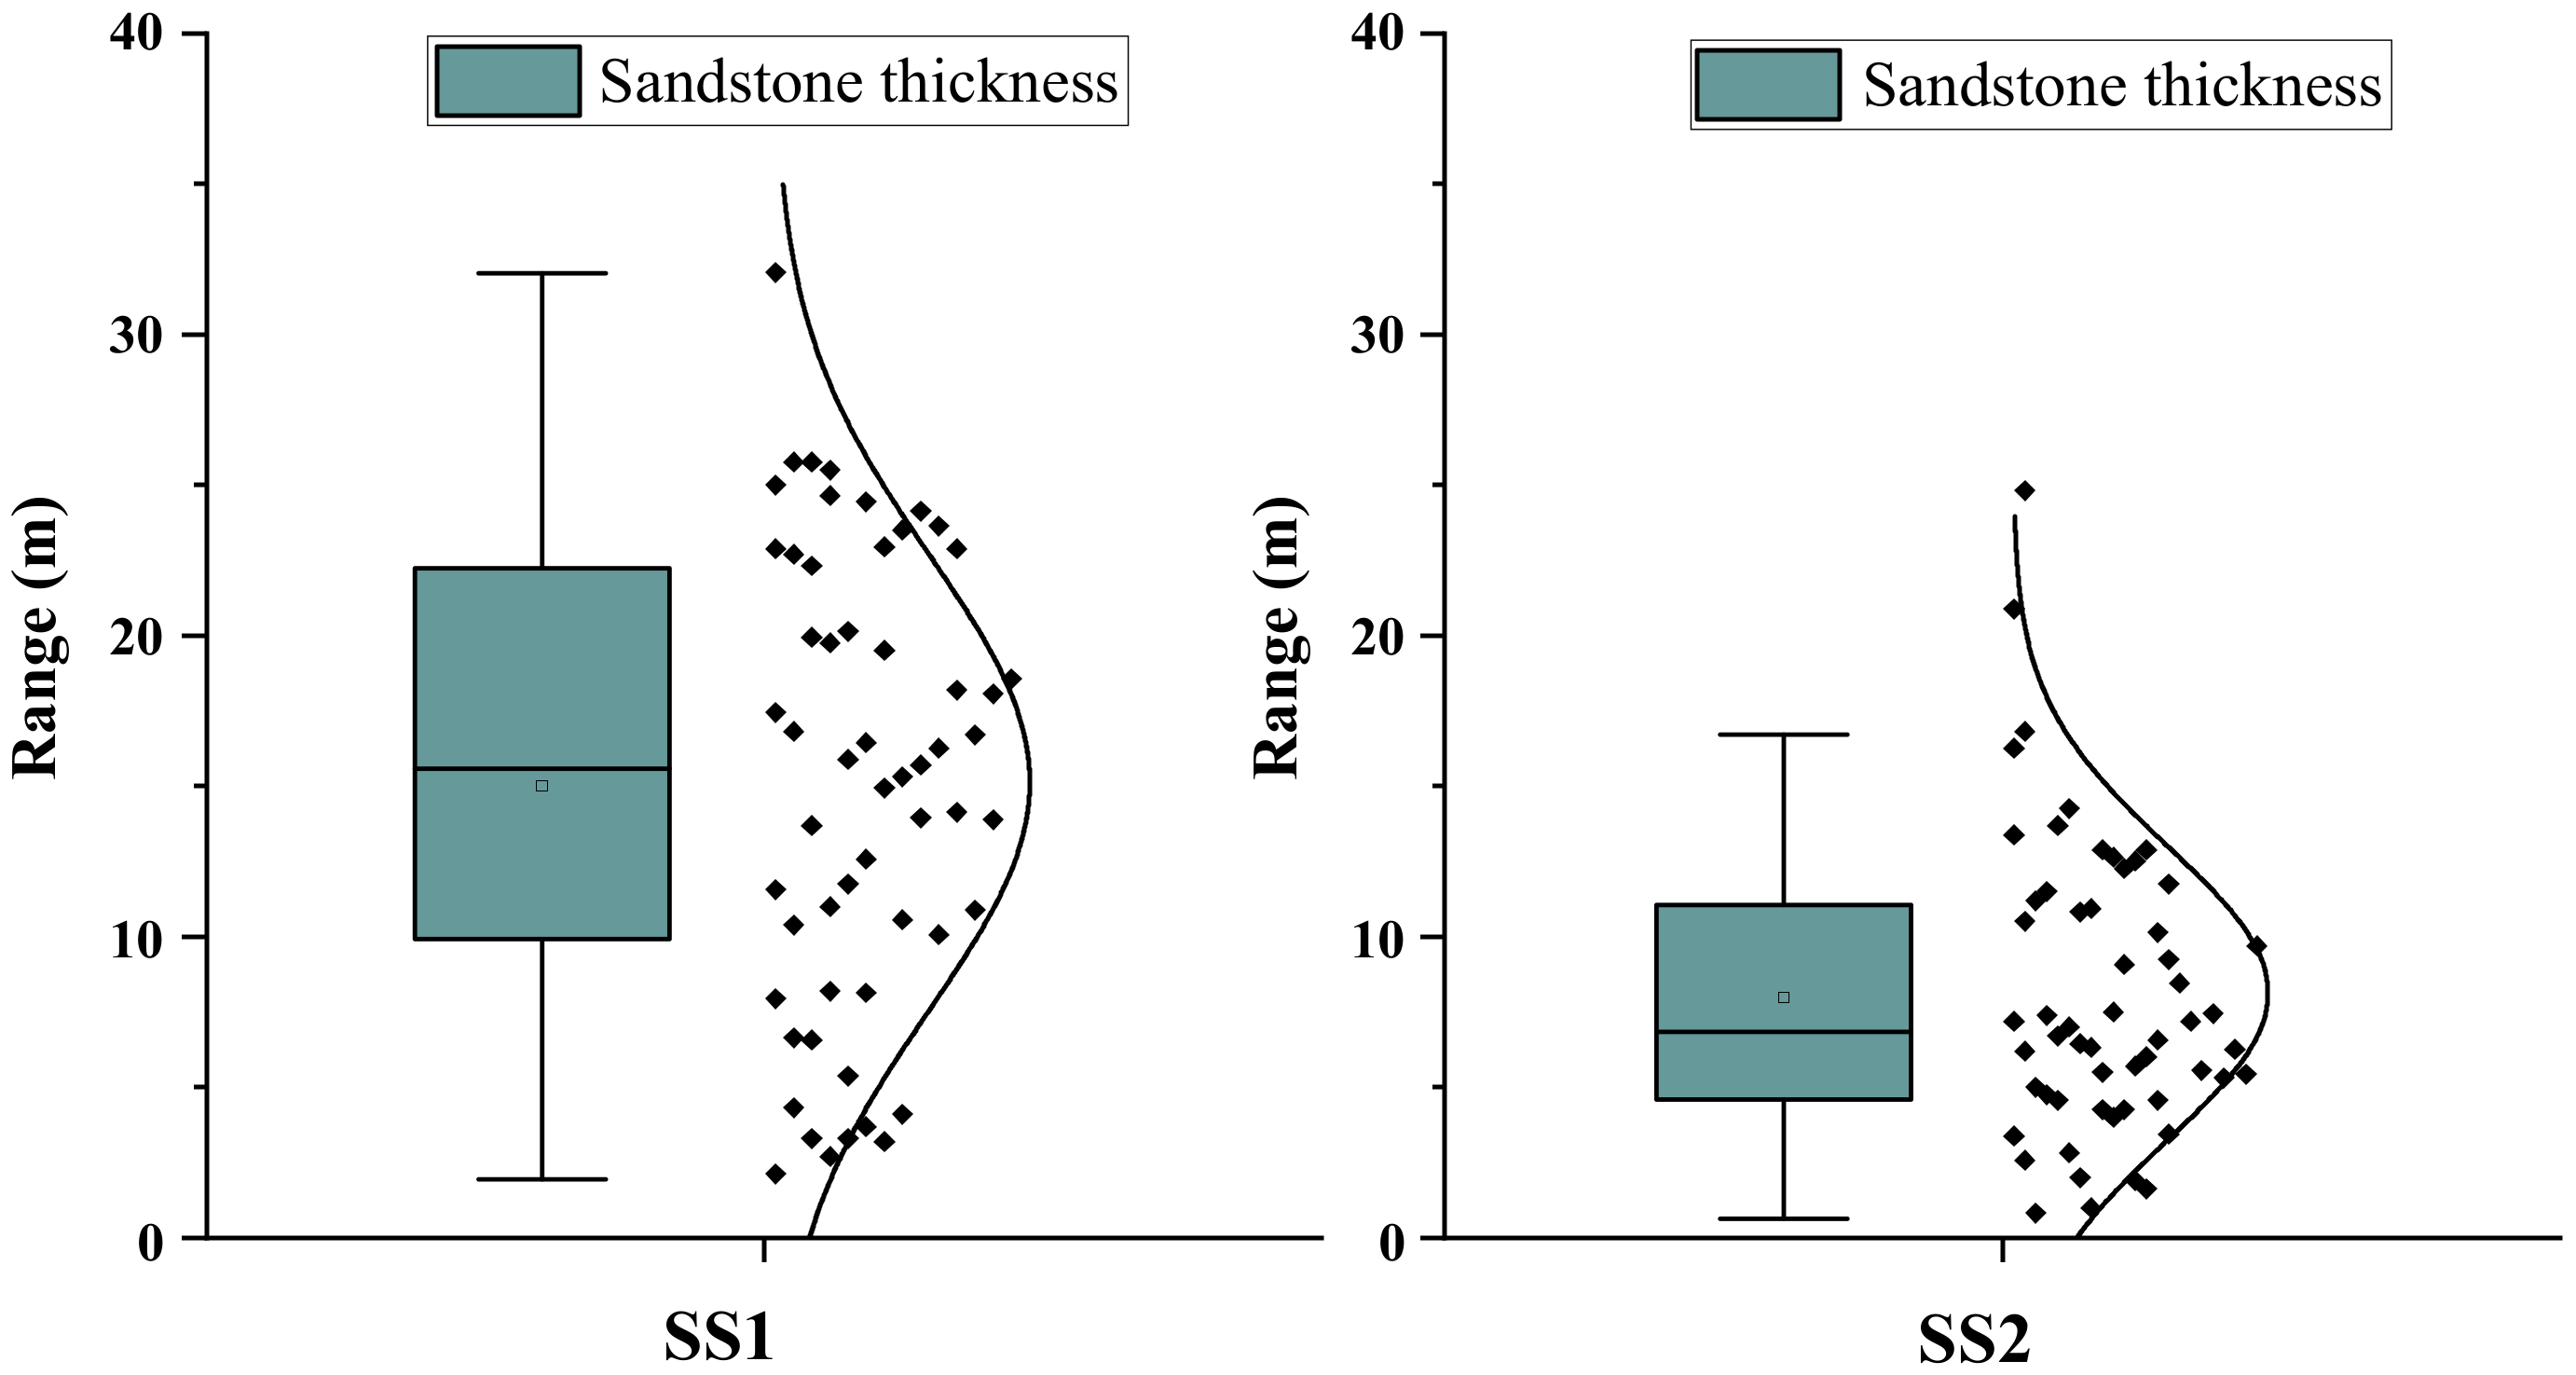
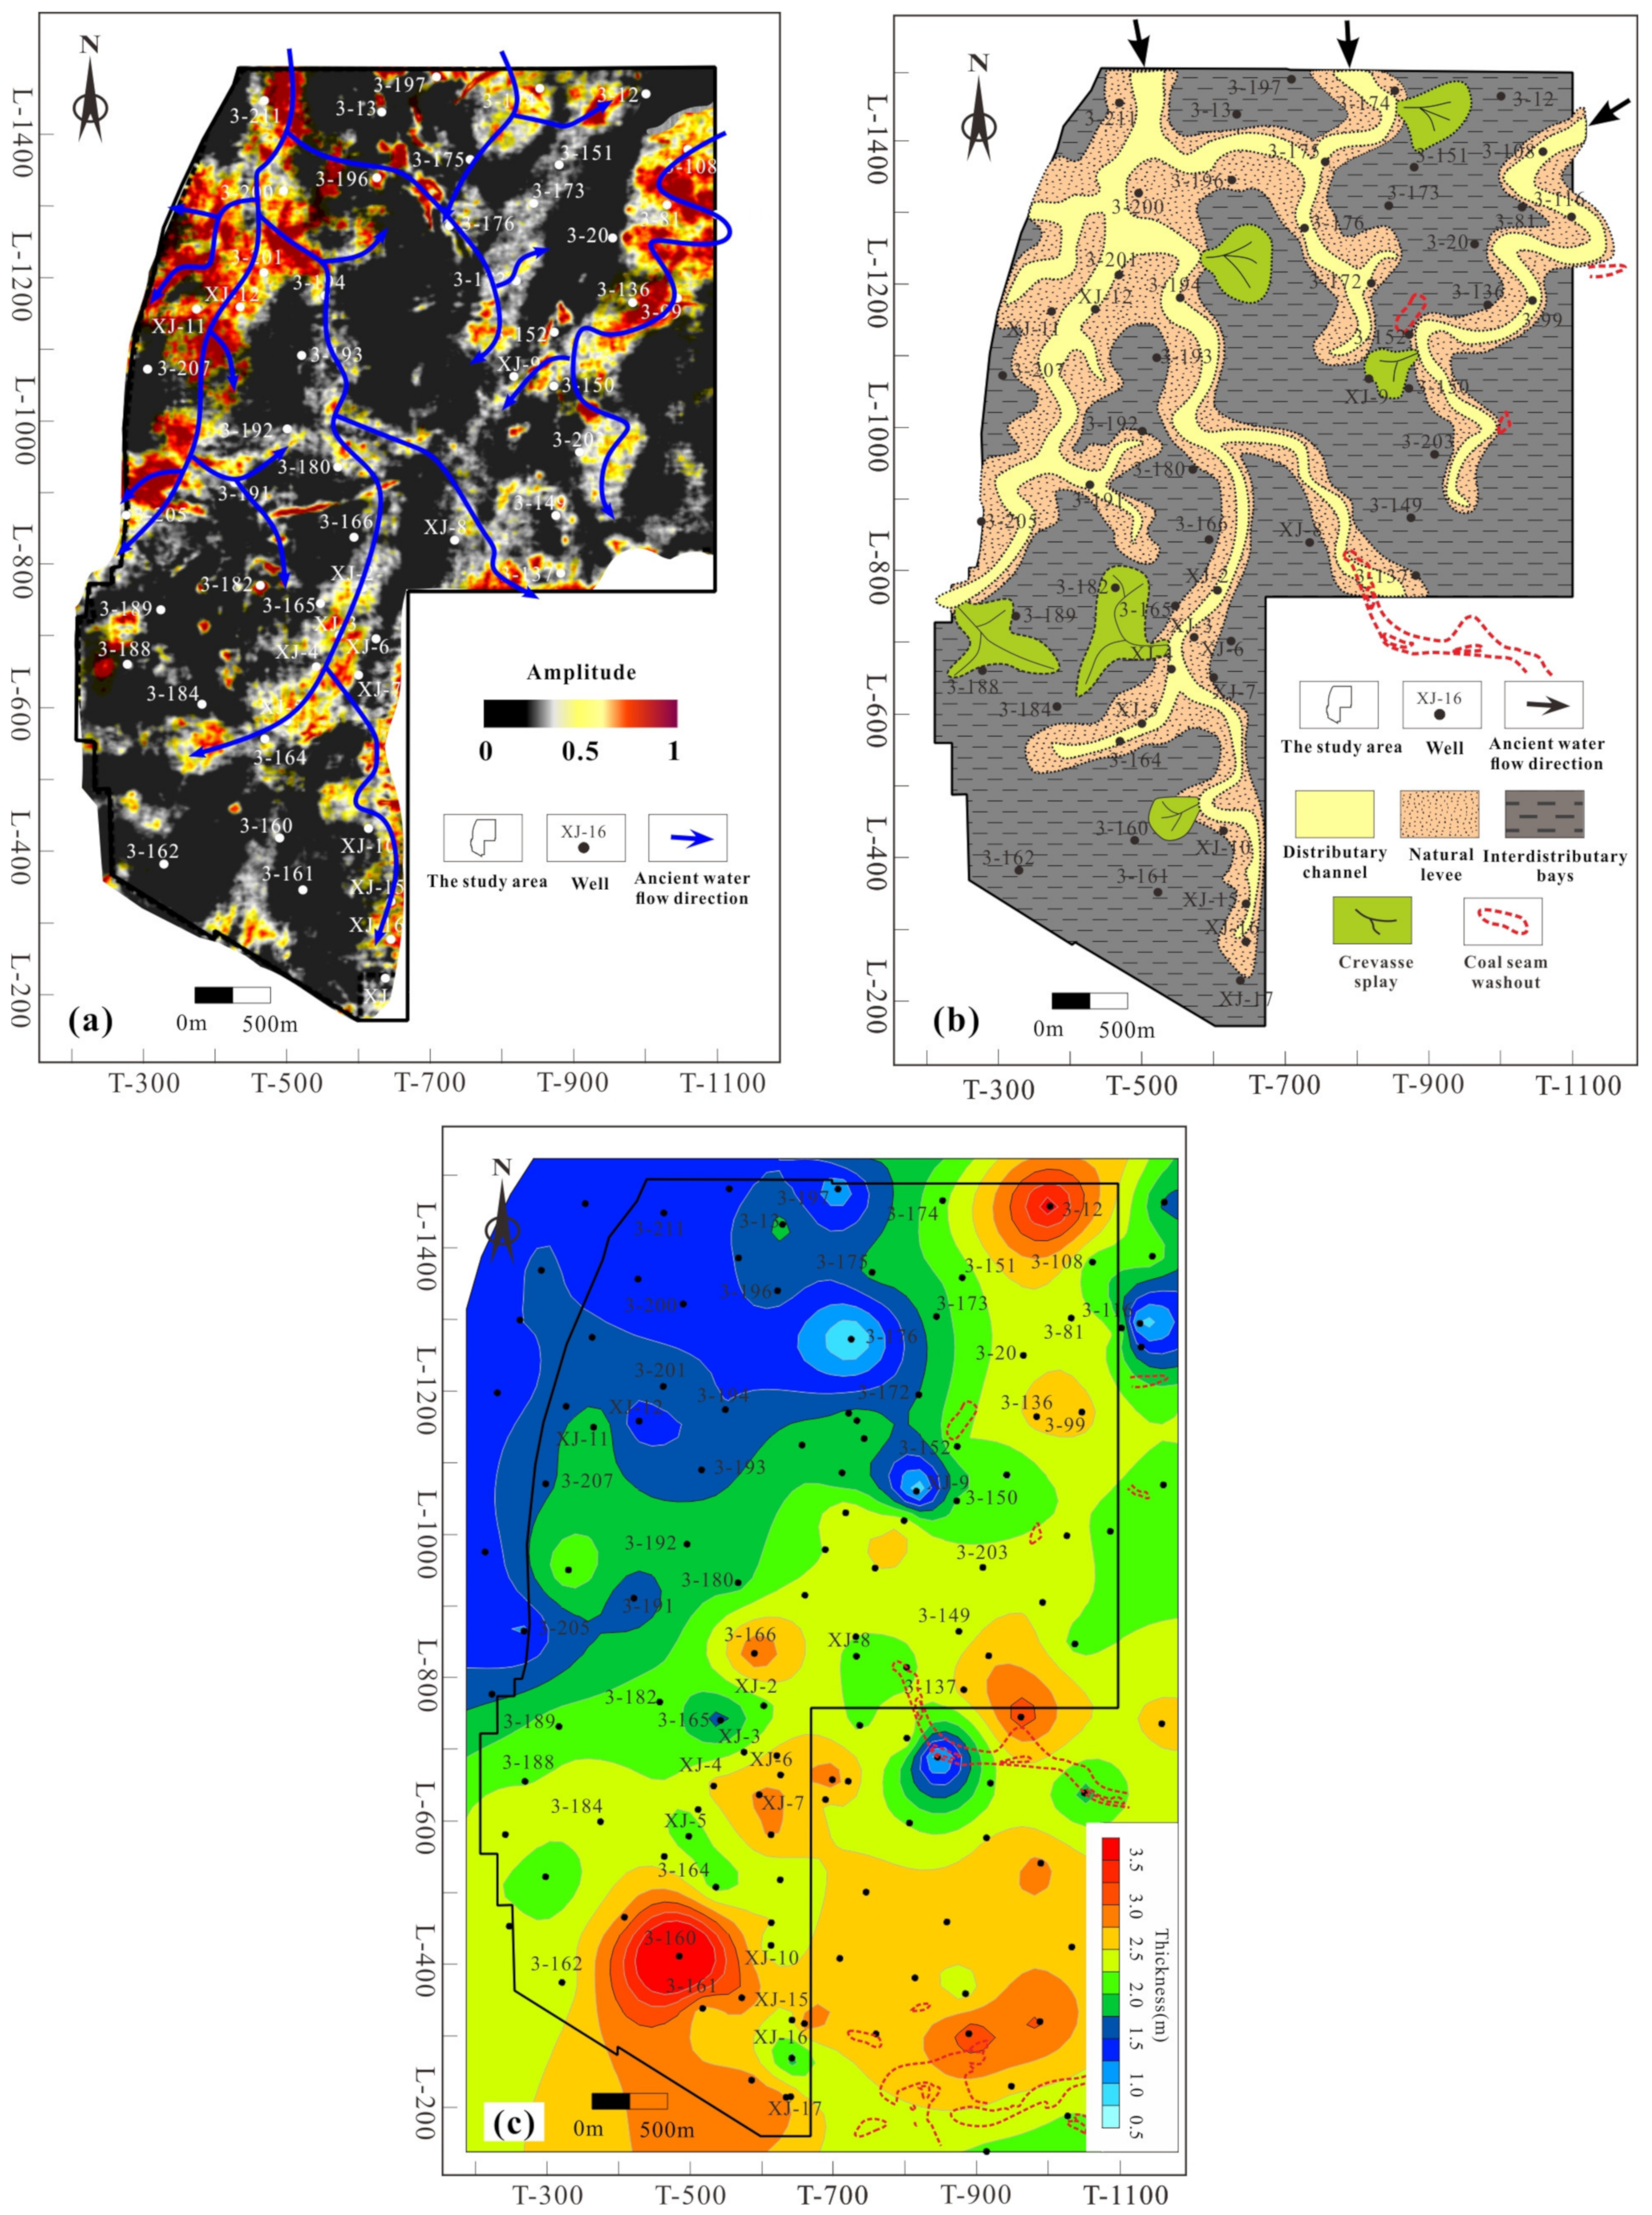
4.3.1. Sedimentary Facies Characteristics of SS1 Sequence
4.3.2. Sedimentary Facies Characteristics of SS2 Sequence
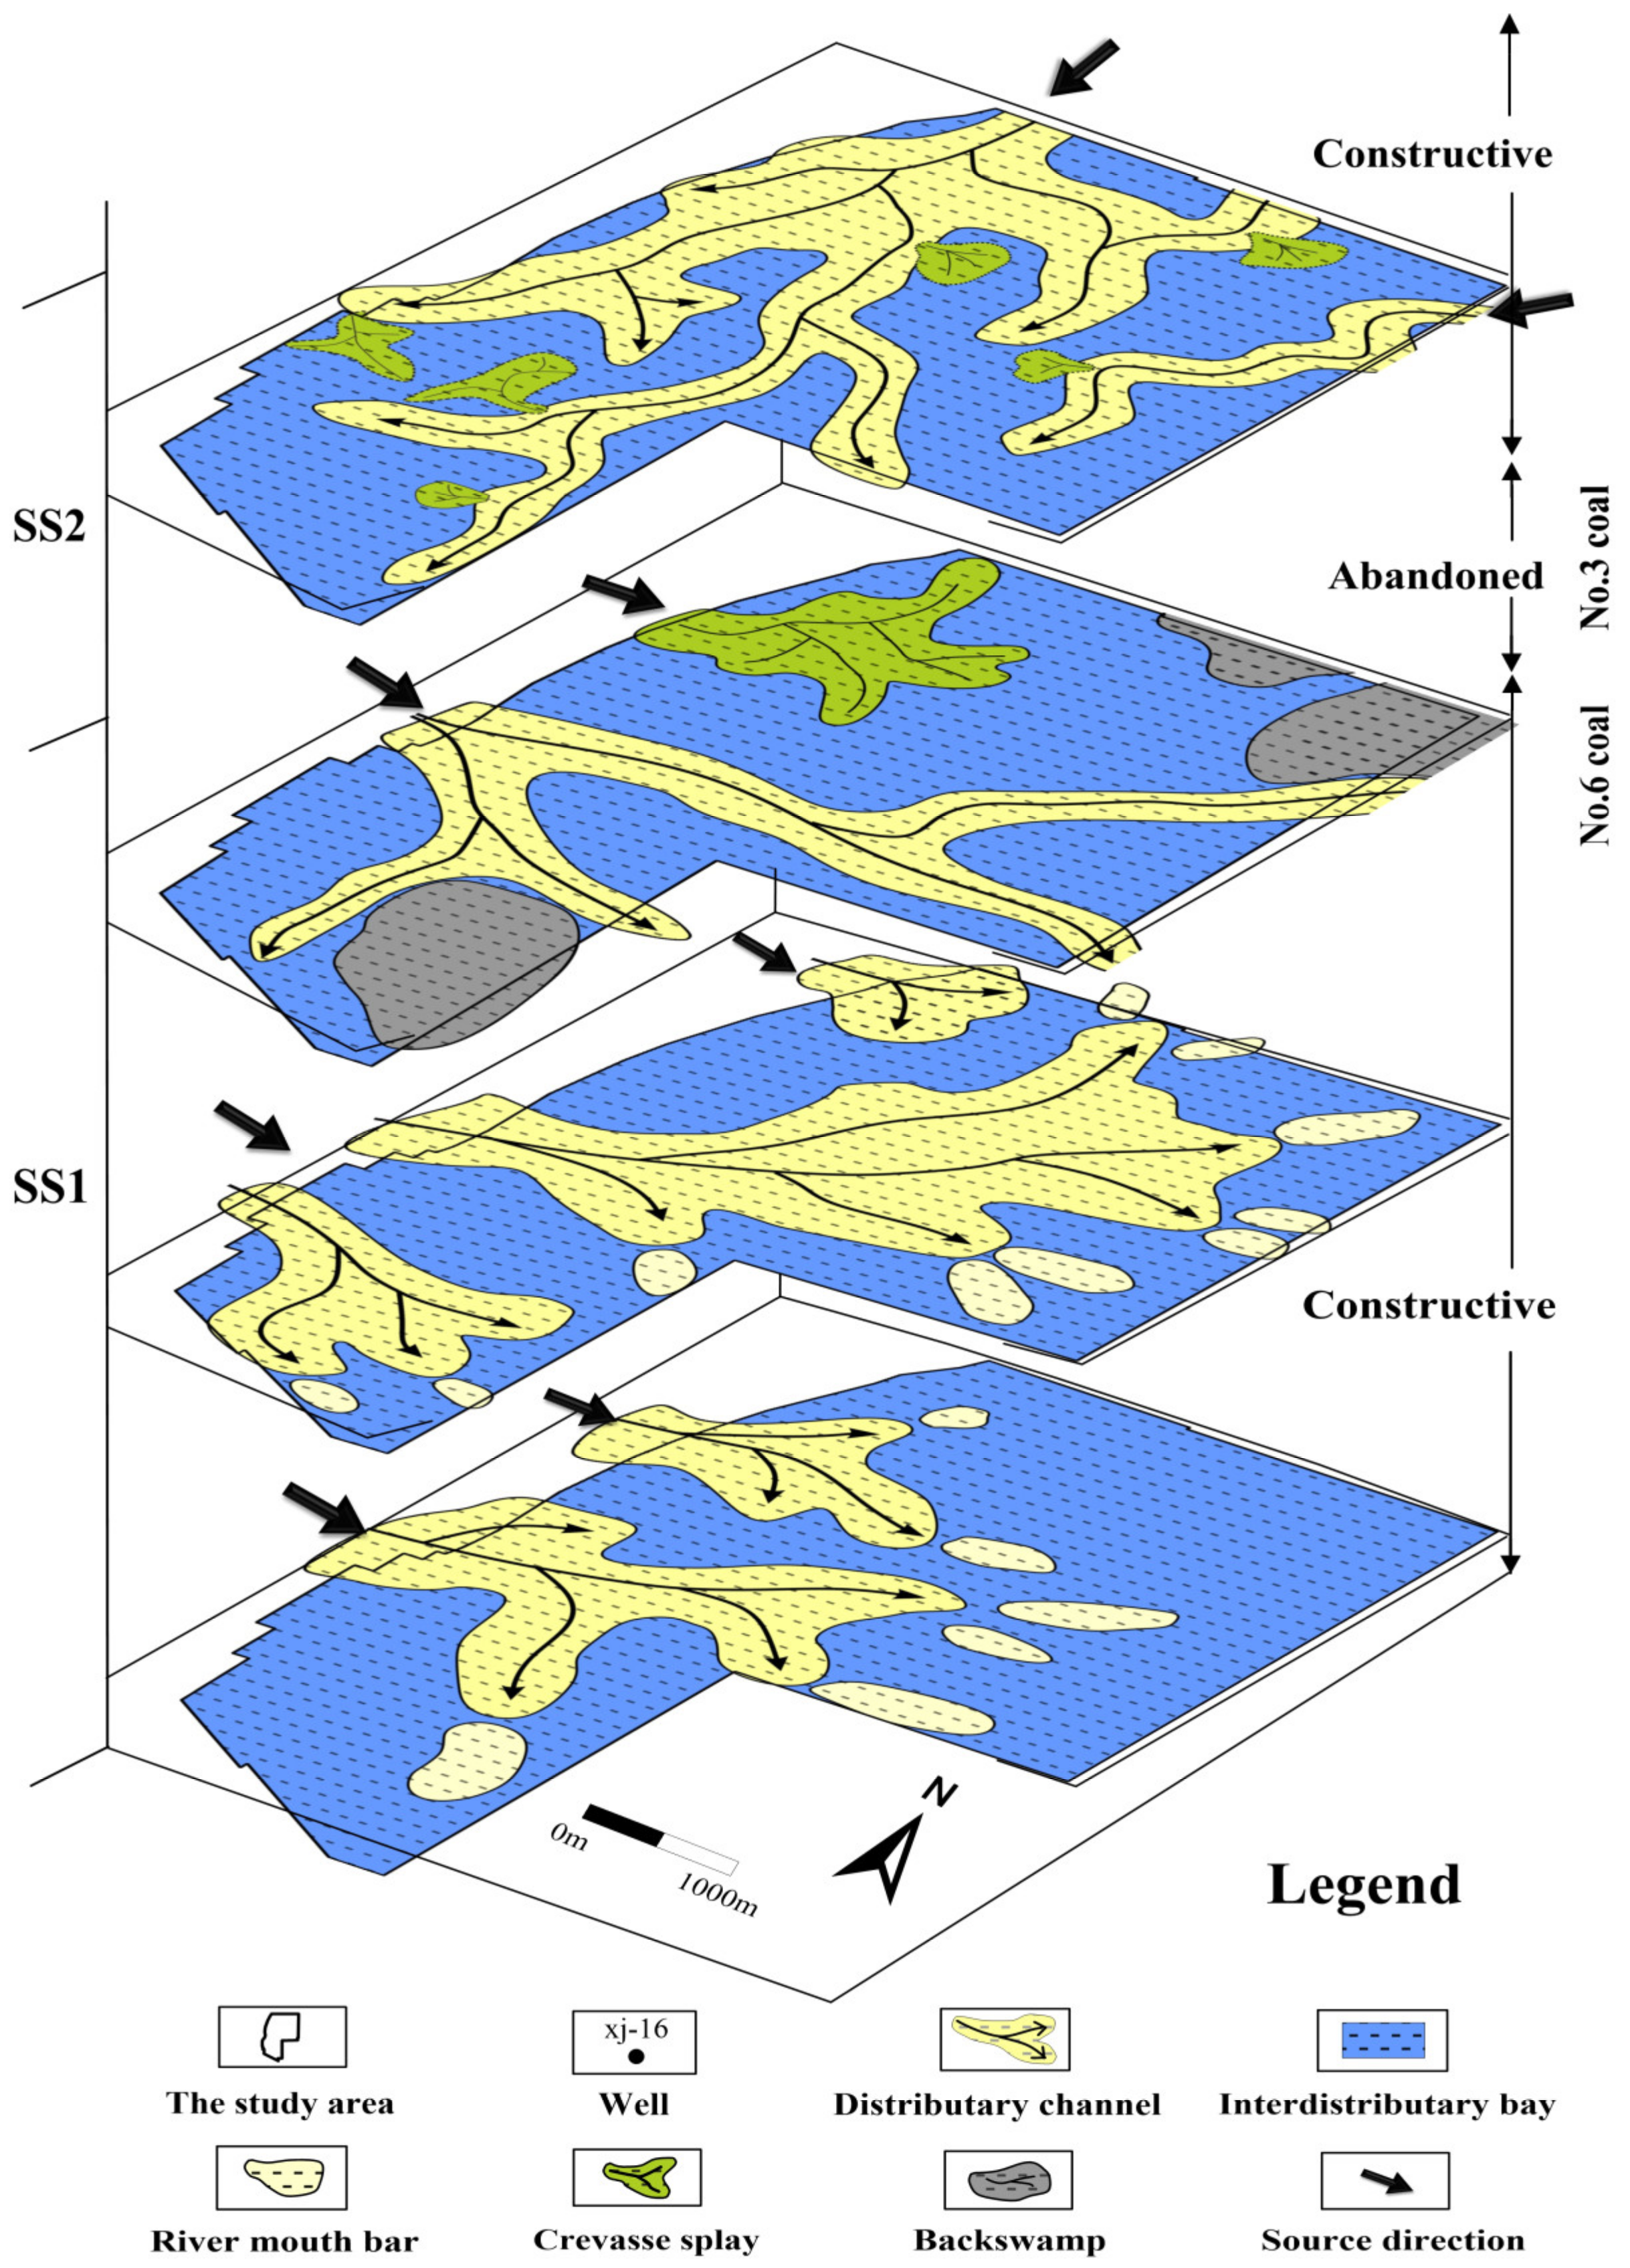
4.3.3. Evolution Characteristics of Sedimentary Facies
Stratal Slices Description and Interpretation
Sedimentary Evolution Characteristics of Shanxi Formation
4.4. Peat-Accumulating Regularity of Main Coal Seams
5. Conclusions
Author Contributions
Funding
Data Availability Statement
Conflicts of Interest
References
- Dai, S.; Bechtel, A.; Eble, C.F.; Flores, R.M.; French, D.; Graham, I.T.; Hood, M.M.; Hower, J.C.; Korasidis, V.A.; Moore, T.A.; et al. Recognition of peat depositional environments in coal: A review. Int. J. Coal Geol. 2020, 219, 103383. [Google Scholar] [CrossRef]
- Shao, L.; Wang, X.; Lu, J.; Wang, D.; Hou, H. A Reappraisal on Development and Prospect of Coal Sedimentology in China. Acta Sedimentol. Sin. 2017, 35, 1016–1031. [Google Scholar] [CrossRef]
- Wang, Y.; Zhu, Y.; Liu, Y.; Chen, S. Reservoir characteristics of coal–shale sedimentary sequence in coal-bearing strata and their implications for the accumulation of unconventional gas. J. Geophys. Eng. 2018, 15, 411–420. [Google Scholar] [CrossRef] [Green Version]
- Cecil, C.B. An overview and interpretation of autocyclic and allocyclic processes and the accumulation of strata during the Pennsylvanian–Permian transition in the central Appalachian Basin, USA. Int. J. Coal Geol. 2013, 119, 21–31. [Google Scholar] [CrossRef]
- Çelik, Y.; Karayigit, A.I.; Oskay, R.G.; Kayseri-Özer, M.S.; Christanis, K.; Hower, J.C.; Querol, X. A multidisciplinary study and palaeoenvironmental interpretation of middle Miocene Keles lignite (Harmancık Basin, NW Turkey), with emphasis on syngenetic zeolite formation. Int. J. Coal Geol. 2021, 237, 103691. [Google Scholar] [CrossRef]
- Opluštil, S.; Lojka, R.; Pšenička, J.; Yilmaz, Ç.; Yilmaz, M. Sedimentology and stratigraphy of the Amasra coalfield (Pennsylvanian), NW Turkey–New insight from a 1 km thick section. Int. J. Coal Geol. 2018, 195, 317–346. [Google Scholar] [CrossRef]
- Ge, B.; Yin, G.; Li, C. A preliminary study on sedimentary environments and law of coal-bearing formation in Yangquan, Shanxi. Acta Sedimentol. Sin. 1985, 3, 33–44. [Google Scholar] [CrossRef]
- Jiao, X.; Wang, Y. Depositional environments of the coal-bearing strata and their controls on coal seams in the Yangquan mining district, Shanxi. Sediment. Facies Palaeogeogr. 1999, 19, 30–39. [Google Scholar]
- Shao, L.; Dong, D.; Li, M.; Wang, H.; Wang, D.; Lu, J.; Zheng, M.; Cheng, A. Sequence-paleogeography and coal accumulation of the Carboniferous-Permian in the North China Basin. J. China Coal Soc. 2014, 39, 1725–1734. [Google Scholar] [CrossRef]
- Cai, Y.; Liu, D.; Yao, Y.; Li, J.; Qiu, Y. Geological controls on prediction of coalbed methane of No. 3 coal seam in Southern Qinshui Basin, North China. Int. J. Coal Geol. 2011, 88, 101–112. [Google Scholar] [CrossRef]
- Chang, S.; Chen, Q.; Liu, D.; Pan, Y.; Gui, W.; Liu, Z.; Cao, L.; Feng, A. Preliminary discussion on coal bed methane storage unit and its seismic geology comprehensive identification method. J. China Coal Soc. 2016, 41, 57–66. [Google Scholar] [CrossRef]
- Ren, J.; Wang, H.; Sun, M.; Gan, H.; Song, G.; Sun, Z. Sequence stratigraphy and sedimentary facies of Lower Oligocene Yacheng Formation in deepwater area of Qiongdongnan Basin, Northern South China Sea: Implications for coal-bearing source rocks. J. Earth Sci. 2014, 25, 871–883. [Google Scholar] [CrossRef]
- Catuneanu, O.; Abreu, V.; Bhattacharya, J.; Blum, M.; Dalrymple, R.; Eriksson, P.; Fielding, C.; Fisher, W.; Galloway, W.; Gibling, M.; et al. Towards the standardization of sequence stratigraphy. Earth Sci. Rev. 2009, 92, 1–33. [Google Scholar] [CrossRef] [Green Version]
- Vail, P. Seismic stratigraphy and global changes of sea level. Bull. Am. Assoc. Petrol. Geol. Mem. 1977, 26, 49–212. [Google Scholar]
- Ferreira, D.; Lupinacci, W.M.; Neves, I.D.A.; Zambrini, J.P.R.; Ferrari, A.L.; Gamboa, L.A.P.; Azul, M.O. Unsupervised seismic facies classification applied to a presalt carbonate reservoir, Santos Basin, offshore Brazil. AAPG Bull. 2019, 103, 997–1012. [Google Scholar] [CrossRef]
- De Ruig, M.J.; Hubbard, S.M. Seismic facies and reservoir characteristics of a deep-marine channel belt in the Molasse foreland basin, Puchkirchen Formation, Austria. AAPG Bull. 2006, 90, 735–752. [Google Scholar] [CrossRef]
- Du, H.-K.; Cao, J.-X.; Xue, Y.-J.; Wang, X.-J. Seismic facies analysis based on self-organizing map and empirical mode decomposition. J. Appl. Geophys. 2015, 112, 52–61. [Google Scholar] [CrossRef]
- Zeng, H. What is seismic sedimentology? A tutorial. Interpretation 2018, 6, SD1–SD12. [Google Scholar] [CrossRef]
- Zhu, X.; Dong, Y.; Zeng, H.; Huang, H.; Liu, Q.; Qin, Y.; Ye, L. New development trend of sedimentary geology: Seismic sedimentology. J. Palaeogeogr. 2019, 21, 189–201. [Google Scholar] [CrossRef]
- Liu, H.; Zhang, M.; Chi, X. Application of seismic sedimentology in a fluvial reservoir: A case study of the Guantao Formation in Dagang Oilfield, Bohai Bay Basin, China. Geol. J. 2021, 56, 5125–5139. [Google Scholar] [CrossRef]
- Zeng, H.; Backus, M.M. Interpretive advantages of 90°-phase wavelets: Part 1–Modeling. Geophys. 2005, 70, C7–C15. [Google Scholar] [CrossRef]
- Zeng, H.; Zhu, X.; Zhu, R.; Zhang, Q. Guidelines for seismic sedimentologic study in non-marine postrift basins. Pet. Explor. Dev. 2012, 39, 295–304. [Google Scholar] [CrossRef]
- Abbas, A.; Zhu, H.; Zeng, Z.; Zhou, X. Sedimentary facies analysis using sequence stratigraphy and seismic sedimentology in the Paleogene Pinghu Formation, Xihu Depression, East China Sea Shelf Basin. Mar. Pet. Geol. 2018, 93, 287–297. [Google Scholar] [CrossRef]
- Luo, Y.; Huang, H.; Yang, Y.; Li, Q.; Zhang, S.; Zhang, J. Deepwater reservoir prediction using broadband seismic-driven impedance inversion and seismic sedimentology in the South China Sea. Interpretation 2018, 6, SO17–SO29. [Google Scholar] [CrossRef]
- Zeng, H.; Zhao, W.; Xu, Z.; Fu, Q.; Hu, S.; Wang, Z.; Li, B. Carbonate seismic sedimentology: A case study of Cambrian Longwangmiao Formation, Gaoshiti-Moxi area, Sichuan Basin, China. Pet. Explor. Dev. 2018, 45, 830–839. [Google Scholar] [CrossRef]
- Cao, L.; Chang, S.; Yao, Y. Application of seismic sedimentology in predicating sedimentary microfacies and coalbed methane gas content. J. Nat. Gas Sci. Eng. 2019, 69, 102944. [Google Scholar] [CrossRef]
- Zeng, H.; Backus, M.M.; Barrow, K.T.; Tyler, N. Stratal slicing, Part I: Realistic 3-D seismic model. Geophysics 1998, 63, 502–513. [Google Scholar] [CrossRef]
- Grana, D.; Della Rossa, E. Probabilistic petrophysical-properties estimation integrating statistical rock physics with seismic inversion. Geophysics 2010, 75, O21–O37. [Google Scholar] [CrossRef]
- Verma, S.; Bhattacharya, S.; Lujan, B.; Agrawal, D.; Mallick, S. Delineation of early Jurassic aged sand dunes and paleo-wind direction in southwestern Wyoming using seismic attributes, inversion, and petrophysical modeling. J. Nat. Gas Sci. Eng. 2018, 60, 1–10. [Google Scholar] [CrossRef]
- Zhang, S.; Huang, H.; Dong, Y.; Yang, X.; Wang, C.; Luo, Y. Direct estimation of the fluid properties and brittleness via elastic impedance inversion for predicting sweet spots and the fracturing area in the unconventional reservoir. J. Nat. Gas Sci. Eng. 2017, 45, 415–427. [Google Scholar] [CrossRef]
- Meng, Z.-P.; Guo, Y.-S.; Wang, Y.; Pan, J.-N.; Lu, J. Predicting Models of Coal Thickness Based on Seismic Attributions and Their Applications. Chin. J. Geophys. 2006, 49, 450–457. [Google Scholar] [CrossRef]
- Puryear, C.I.; Castagna, J.P. Layer-thickness determination and stratigraphic interpretation using spectral inversion: Theory and application. Geophysics 2008, 73, R37–R48. [Google Scholar] [CrossRef]
- Ling, Y.; Gao, J.; Sun, D.; Lin, J. Spatially relative resolution based on geological concept and its application in seismic exploration. Geophys. Prospect. Pet. 2007, 46, 19. [Google Scholar]
- Li, W.; Yue, D.; Wang, W.; Wang, W.; Wu, S.; Li, J.; Chen, D. Fusing multiple frequency-decomposed seismic attributes with machine learning for thickness prediction and sedimentary facies interpretation in fluvial reservoirs. J. Pet. Sci. Eng. 2019, 177, 1087–1102. [Google Scholar] [CrossRef]
- Manzi, M.S.D.; Hein, K.; Durrheim, R.; King, N. Seismic attribute analysis to enhance detection of thin gold-bearing reefs: South Deep gold mine, Witwatersrand basin, South Africa. J. Appl. Geophys. 2013, 98, 212–228. [Google Scholar] [CrossRef]
- Lyu, B.; Qi, J.; Li, F.; Hu, Y.; Zhao, T.; Verma, S.; Marfurt, K.J. Multispectral coherence: Which decomposition should we use? Interpretation 2020, 8, T115–T129. [Google Scholar] [CrossRef]
- Zeng, H.; Marfurt, K.J. Recent progress in analysis of seismically thin beds. Interpretation 2015, 3, SS15–SS22. [Google Scholar] [CrossRef]
- Hong, Z.; Li, K.-H.; Su, M.-J.; Hu, G.-M.; Yang, J.; Gao, G.; Hao, B. A DTW distance-based seismic waveform clustering method for layers of varying thickness. Appl. Geophys. 2020, 17, 171–181. [Google Scholar] [CrossRef]
- Song, C.; Liu, Z.; Wang, Y.; Li, X.; Hu, G. Multi-waveform classification for seismic facies analysis. Comput. Geosci. 2017, 101, 1–9. [Google Scholar] [CrossRef]
- Van Toorenenburg, K.A.; Donselaar, M.E.; Noordijk, N.; Weltje, G. On the origin of crevasse-splay amalgamation in the Huesca fluvial fan (Ebro Basin, Spain): Implications for connectivity in low net-to-gross fluvial deposits. Sediment. Geol. 2016, 343, 156–164. [Google Scholar] [CrossRef] [Green Version]
- Li, C.; Ge, B. The sedimentary characteristic and sedimentary environments of the Shanxi Formation in the Yangquan coal district, Province Shanxi. J. Jiaozuo Min. Inst. 1985, 02, 33–51. [Google Scholar]
- Omodeo-Salé, S.; Deschamps, R.; Michel, P.; Chauveau, B.; Suárez-Ruiz, I. The coal-bearing strata of the Lower Cretaceous Mannville Group (Western Canadian Sedimentary Basin, South Central Alberta), PART 2: Factors controlling the composition of organic matter accumulations. Int. J. Coal Geol. 2017, 179, 219–241. [Google Scholar] [CrossRef]
- Liu, J.; Dai, S.; Hower, J.C.; Moore, T.A.; Moroeng, O.M.; Nechaev, V.P.; Petrenko, T.I.; French, D.; Graham, I.T.; Song, X. Stable isotopes of organic carbon, palynology, and petrography of a thick low-rank Miocene coal within the Mile Basin, Yunnan Province, China: Implications for palaeoclimate and sedimentary conditions. Org. Geochem. 2020, 149, 104103. [Google Scholar] [CrossRef]
- Prinz, L.; Zieger, L.; Littke, R.; McCann, T.; Lokay, P.; Asmus, S. Syn- and post-depositional sand bodies in lignite—The role of coal analysis in their recognition. A study from the Frimmersdorf Seam, Garzweiler open-cast mine, western Germany. Int. J. Coal Geol. 2017, 179, 173–186. [Google Scholar] [CrossRef]


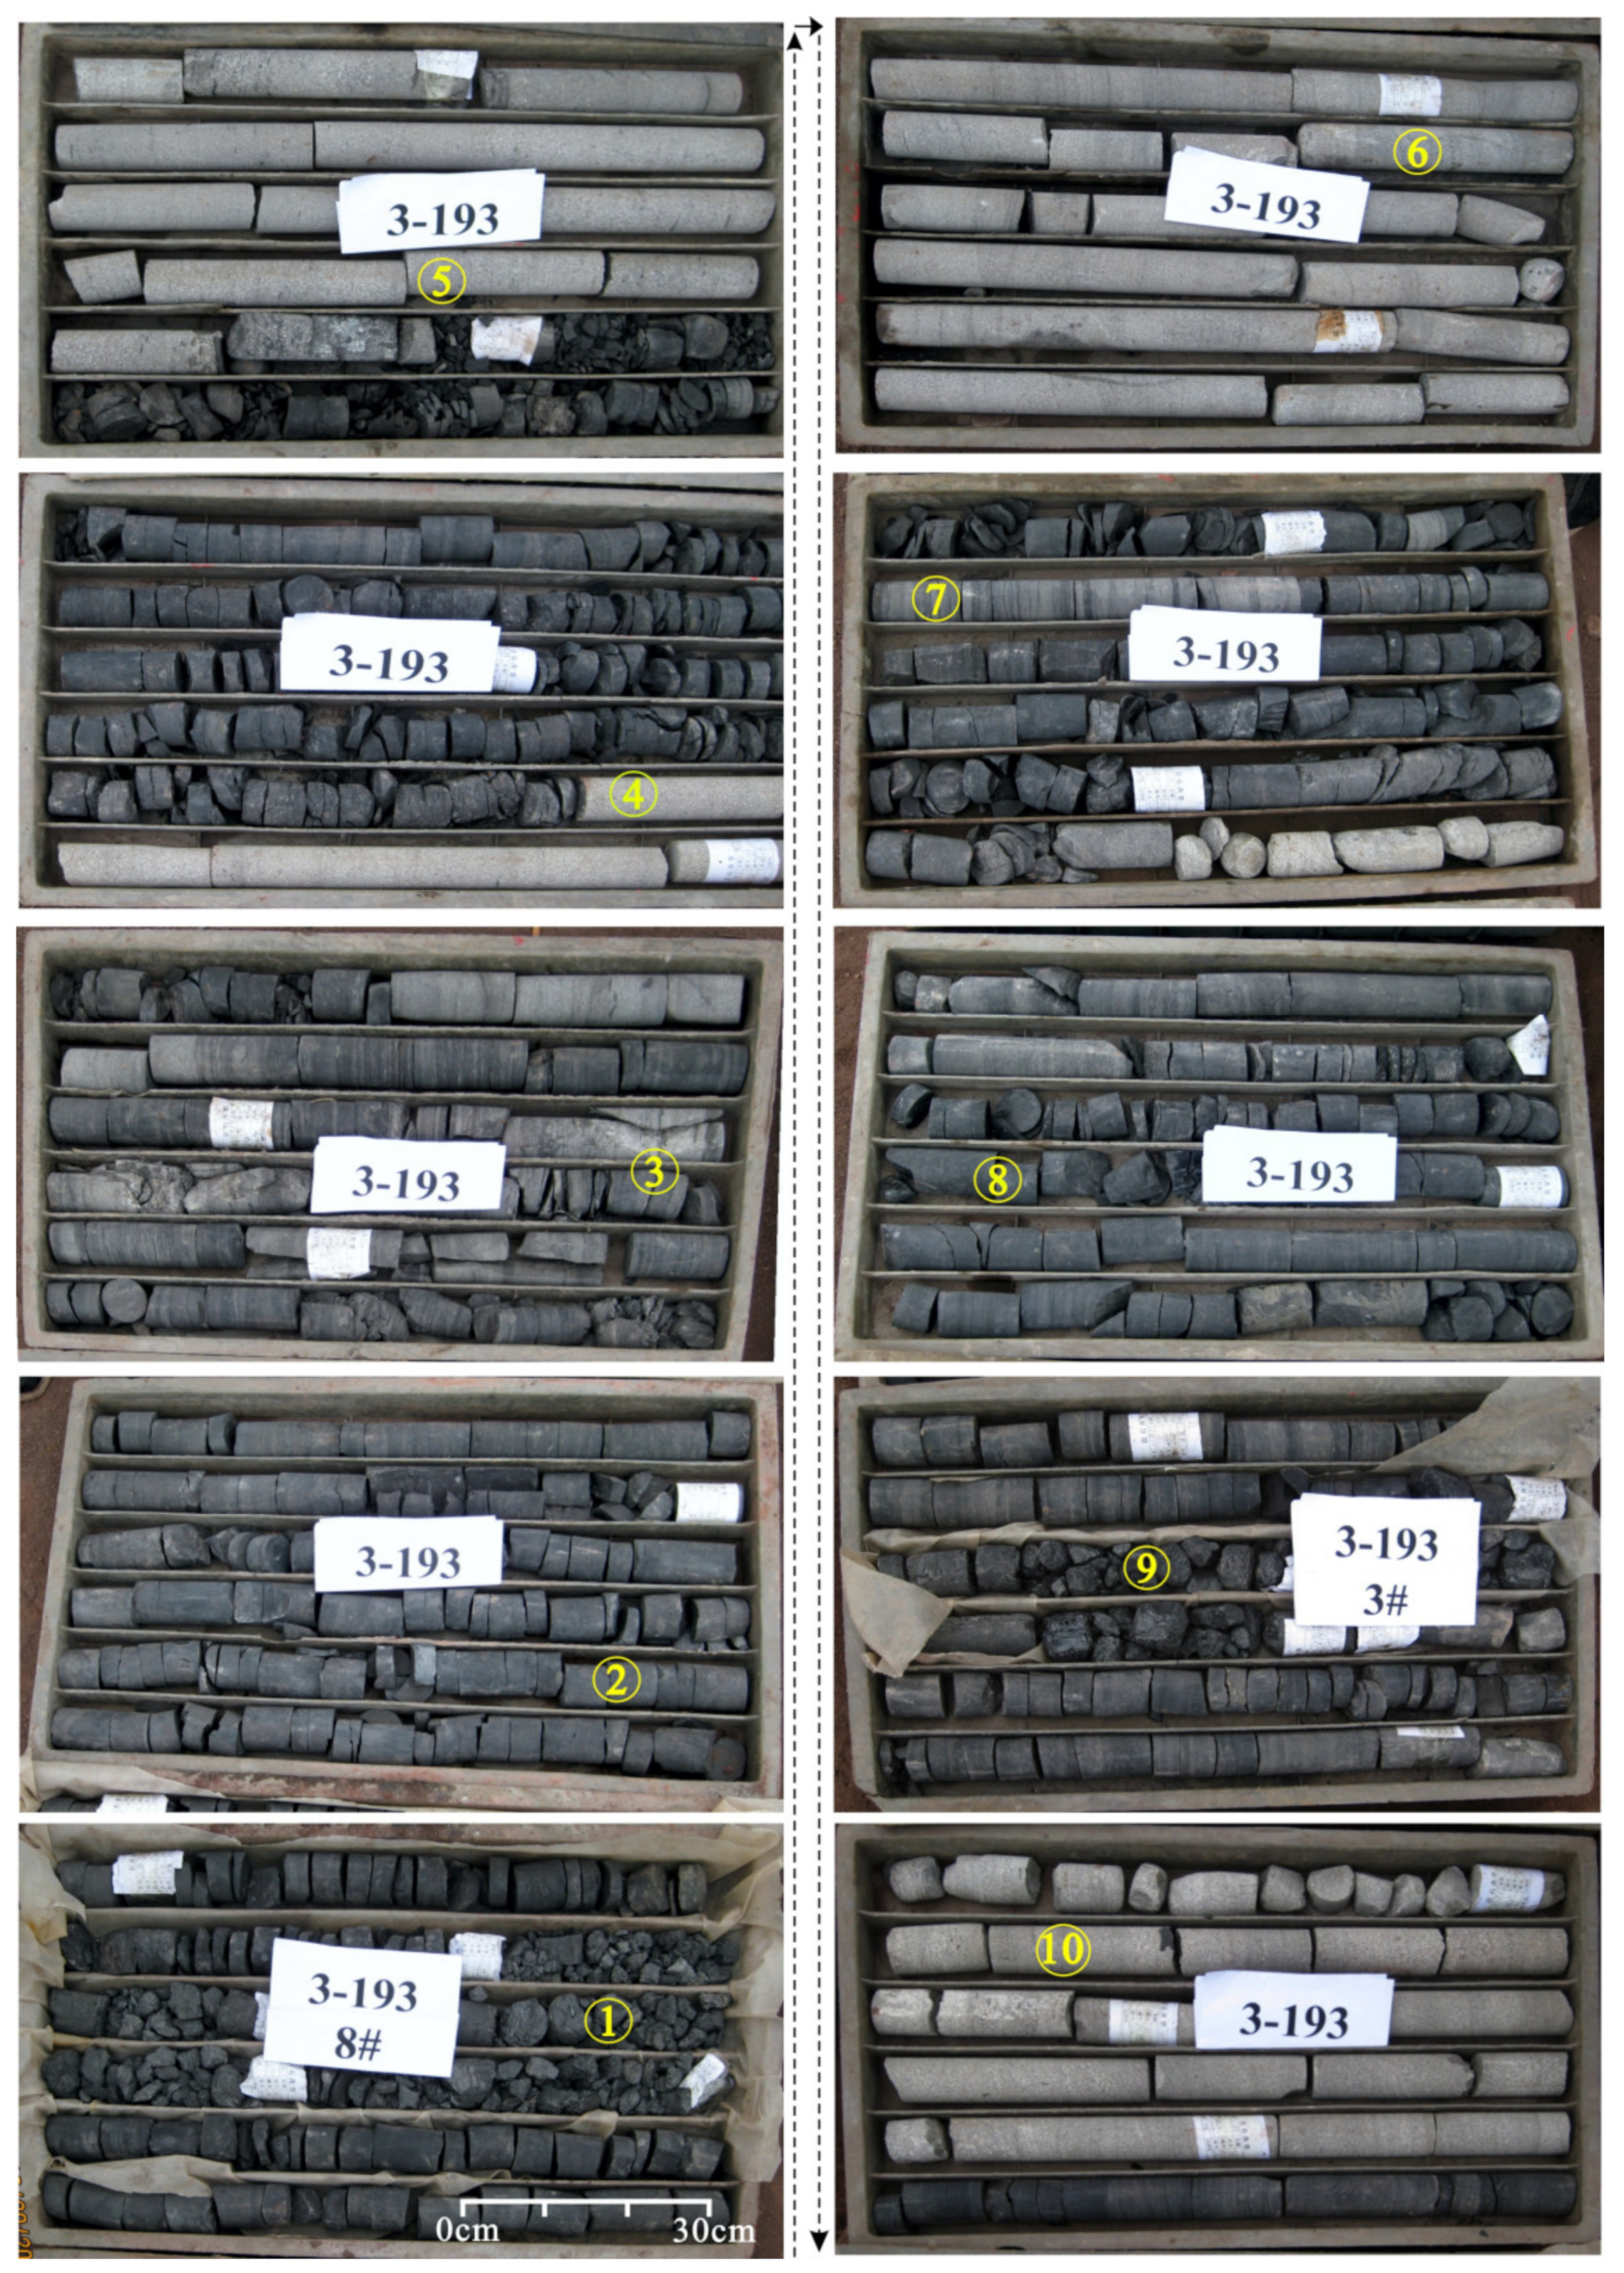
| Sedimentary Facies | Sedimentary Sub-Facies | Sedimentary Microfacies | Lithofacies and Sedimentary Structure |
|---|---|---|---|
| River-dominated delta | Delta plain | Distributary channel | 10 Greyish to dark grey medium sandstones with tabular cross-bedding and wedge cross-bedding; poor to moderate psephicity |
| Peat swamp | 1,9 Coal and carbonaceous mudstones | ||
| Interdistributary bay | 8 Gray–black mudstones and sandy mudstones with horizontal bedding | ||
| Crevasse splay | 7 Gray fine sandstones and siltstones with massive bedding | ||
| Distributary channel | 5,6 Greyish to dark grey pebbled gritstone, coarse- to medium-grained sandstones; tabular cross-bedding and groove cross-bedding; poor to moderate psephicity | ||
| Delta front | River mouth bar | 4 Gray–white medium sandstones and fine sandstones with wedge cross-bedding | |
| Distal bar | 3 Gray–black siltstones with wavy bedding | ||
| Prodelta | 2 Dark gray–black mudstones and sandy mudstones with massive bedding and horizontal bedding |
| Coefficients | Standard Error | p-Value | Lower 95% | Upper 95% | VIF | R Square | F | |
|---|---|---|---|---|---|---|---|---|
| Intercept | −0.089 | 0.046 | 0.002 | −0.254 | −0.064 | - | 0.72 | 47.436 |
| NA50 Hz | 0.480 | 0.102 | 0.001 | 0.273 | 0.687 | 1.179 | ||
| NA70 Hz | 0.592 | 0.099 | 0.000 | 0.392 | 0.795 | 1.179 |
Publisher’s Note: MDPI stays neutral with regard to jurisdictional claims in published maps and institutional affiliations. |
© 2022 by the authors. Licensee MDPI, Basel, Switzerland. This article is an open access article distributed under the terms and conditions of the Creative Commons Attribution (CC BY) license (https://creativecommons.org/licenses/by/4.0/).
Share and Cite
Liu, B.; Chang, S.; Zhang, S.; Li, Y.; Yang, Z.; Liu, Z.; Chen, Q. Seismic-Geological Integrated Study on Sedimentary Evolution and Peat Accumulation Regularity of the Shanxi Formation in Xinjing Mining Area, Qinshui Basin. Energies 2022, 15, 1851. https://doi.org/10.3390/en15051851
Liu B, Chang S, Zhang S, Li Y, Yang Z, Liu Z, Chen Q. Seismic-Geological Integrated Study on Sedimentary Evolution and Peat Accumulation Regularity of the Shanxi Formation in Xinjing Mining Area, Qinshui Basin. Energies. 2022; 15(5):1851. https://doi.org/10.3390/en15051851
Chicago/Turabian StyleLiu, Bo, Suoliang Chang, Sheng Zhang, Yanrong Li, Zhihua Yang, Zuiliang Liu, and Qiang Chen. 2022. "Seismic-Geological Integrated Study on Sedimentary Evolution and Peat Accumulation Regularity of the Shanxi Formation in Xinjing Mining Area, Qinshui Basin" Energies 15, no. 5: 1851. https://doi.org/10.3390/en15051851