Article

Study on the Emission Reduction Effect and Spatial Difference of Carbon Emission Trading Policy in China

1
School of Business, Hohai University, Nanjing 211100, China
2
Jiangsu Research Base of Yangtze Institute for Conservation and High-Quality Development, Nanjing 211100, China
3
Yangtze Institute for Conservation and Development, Nanjing 210098, China
*
Author to whom correspondence should be addressed.
Energies 2022, 15(5), 1921; https://doi.org/10.3390/en15051921
Submission received: 3 February 2022 / Revised: 4 March 2022 / Accepted: 4 March 2022 / Published: 6 March 2022

Abstract

:
To cope with huge carbon emission pressure, China has implemented a carbon emissions trading pilot policy that aims to provide reasonable suggestions for the smooth operation of the national carbon market. This paper selects the provincial panel data in China from 2005 to 2019 and uses the propensity score matching-difference in difference (PSM-DID) method to evaluate the carbon emission policy’s reduction effect. Based on carbon emissions (CE) and carbon emission intensity (CI), provinces and cities are divided into four regions, and each region is verified by spatial difference analysis. Furthermore, the mediating effects of carbon emission reduction through the dual aspects of technological progress and industry structure are also discussed. Results verified that, (1) under the carbon emission trading policy, regional carbon emissions and carbon emission intensity are both significantly reduced. (2) Technological progress helps to reduce carbon emissions, while industrial structure shows no obvious contribution. (3) The four regions all show ideal emission reduction effects, of which the High CE-High CI region shows the best, but is greatly restricted by techniques. The industrial structure of the High CE-Low CI region needs to be further optimized for carbon reduction. In the Low CE-High CI region, the carbon emissions brought by economic development fail to effectively improve per capita GDP. The Low CE-Low CI region contributes greatly to carbon emission reduction with technical advantages.

1. Introduction

At present, extreme climate events such as high temperature, cold, flood, and drought occur frequently, which has brought increasingly serious disaster problems to the world. The main factor in global climate problems is the large emission of greenhouse gases, among which carbon dioxide emitted from fossil fuel combustion and industrial enterprise production is the main source. In order to control global warming and reduce the occurrence of severe climate disasters, many countries signed the United Nations Framework Convention on Climate Change in 1992, and have actively implemented energy conservation and emission reduction policies to control greenhouse gas emissions. Controlling carbon dioxide emissions and establishing a green, low-carbon, and sustainable global governance system have become the common development goals of all countries. Among them, the carbon emissions generated by developing countries account for a considerable proportion, which puts heavy pressure on their own emission reduction, as well as global carbon emission reduction [1]. As BRICS (Brazil, Russia, China, India, and South Africa) countries, China, India, and Russia accounted for 41.2% of the world’s total carbon emissions in 2014, up from 24.3% in 2000. It can be seen that the carbon emissions of BRICS countries account for an increasing proportion of the world’s total carbon emissions, and environmental pollution has become more and more serious [2]. As a developing country with the largest carbon emissions in the world, China is facing great pressure for carbon emission reduction [3,4]. For countries with rapid economic development such as China, energy consumption is inevitable, and carbon emissions will continue to rise in the future. Effective control of carbon emission intensity has also become the focus of public attention. These countries are facing similar problems: the uncertainty of the effect of carbon emission reduction policies and the particularity of policy-making in different regions. Under the general trend of carbon emission reduction in the world, every country cannot be alone, especially developing countries with large population and unclear carbon emission reduction policies. More importantly, even if many countries have implemented carbon emission reduction policies, the effects of policies are different due to regional differences, so pilot projects in different regions are needed to make final policy decisions.
Pachauri et al. [5] pointed out in the fifth assessment report of the Intergovernmental Panel on Climate Change that the combustion of fossil fuels and greenhouse gases and industrial production are the main causes of global warming. In order to deal with this environmental problem with negative externalities, Coase [6] put forward the property right theory in 1960 and advocated using the market method to solve the negative externalities of pollution. Subsequently, in 1968, combined with Coase’s property rights theory, Dales [7] proposed emissions trading; that is, issuing emissions trading permits to enterprises to make emissions legal. By commercializing carbon emission permits, carbon-intensive enterprises can meet government regulatory requirements by purchasing permits on the market; meanwhile, low-carbon enterprises can sell licenses for profit. Carbon emissions trading is an important exploration of both market and policy instruments, which can urge enterprises to develop clean energy technology and change industrial structures to promote carbon emission reduction [8,9]. It can be concluded that the carbon emission trading policy is a powerful tool to promote carbon emission reduction, which should also be implemented in the long run. The analysis on the effect of carbon emission trading policy in the pilot areas can provide experience for the national launch of this policy, which has strong practical significance.
As a developing country with the largest carbon emissions, China also has much potential for carbon emission reduction, and has made many practical efforts [10,11]. In 2014, the Chinese government announced the carbon emission trading pilot policy in seven provinces, providing experience for promoting the national carbon emission trading market [12]. Moreover, China also expanded the pilot scope and established a carbon market for carbon emission trading in the following year. Analyzing carbon emission reduction policy in a pilot can provide predictable results for the emission reduction effect in all regions of China. What is more, analysis on the carbon emission reduction at the sub-regional level should be further explained at the national level due to China’s vast territory and great differences between different regions. Regional division based on carbon emissions and carbon emission intensity can more accurately analyze the emission reduction effect. For many developing countries, such as the BRICS, the difference in carbon emissions and intensity between those countries is similar to the difference between different regions in China. That is, the carbon emission reduction analysis in different regions of China can also provide some reference and suggestions for similar developing countries or regions. Studying the emission reduction effect of China’s carbon emission trading policy has strong practical significance not only for China, but also for other countries. Therefore, this paper aims to study the reduction effect, spatial difference, and mechanism of China’s carbon emission trading policy, and tries to answer the following questions. Can the carbon emission trading policy effectively reduce carbon emissions? Is the carbon emission trading policy universal under different regions, and what is the reduction effect in these regions? What kind of transmission mechanism exists between policy and carbon emission reduction? This study aims to provide empirical evidence and policy suggestions to promote the smooth operation of the national carbon emission trading market for China and other similar countries.
This study enriches relevant studies in the following aspects: (1) the emission reduction effect of China’s carbon emission trading policy; (2) the new division method of regions based on carbon emissions and carbon emission intensity for reduction effect analysis; (3) the PSM-DID method and intermediary effect test used to evaluate the impact of the pilot policy on carbon emissions.

2. Literature Review and Theoretical Hypothesis

2.1. Literature Review

There is a consensus all over the world on environmental pollution caused by excessive carbon. For this environmental problem with negative externalities, environmental regulations are necessary. The “Porter Hypothesis” argues that environmental regulation could stimulate enterprise innovation to compensate for the costs of environmental regulation and enhance market profitability, thereby improving industrial competitiveness [13,14]. Xu and Zuo [15] confirmed the rationality of the “Porter Hypothesis” by retesting different polluting industries. To solve the negative externalities caused by carbon emissions, Pigou [16] first proposed in The Economics of Welfare in 1920 to control emissions by taxing polluters, the essence of which is to equate private cost to social cost through tax means so as to internalize the negative externality of pollution. However, taxes are an economic leakage, which is not conducive to the enthusiasm of social subjects and damages overall social welfare. To solve this problem, Coase [6] put forward the property right theory in his article “Social Cost Problem”, and advocated using the market method to solve the negative externality of pollution. Combined with Coase’s property rights theory, Dales [7] proposed emissions trading, that is, issuing emissions trading permits to enterprises to make emissions legal. When it comes to domestic literature research, Zhang and Peng [17] proposed that emission trading should make full use of market mechanisms to control environmental pollution, and achieve optimal allocation of environmental capacity through amount control and emission trading regulation. The essence of this is the institutional change process clarifying the property right of environmental capacity. With the increase in pollution caused by carbon emissions, the concept of carbon emission rights is popular and widely researched by scholars in the theoretical field. Zeng [18] also believed that the carbon emission right, as a market-oriented means of carbon emission reduction and an environmental policy management tool, is the core of the carbon financial system and can effectively limit the emission of specific pollutants. Li [19], Wang et al. [20], Liu et al. [21], Feng [22], and Hua et al. [23] all believed that carbon emission trading has become an important way to reduce carbon dioxide emissions and confirmed the reduction effect of carbon emission rights through empirical research.
In terms of evaluation methods of carbon emission trading policies, most scholars use the single difference method and the double difference method (DID method) to evaluate the policy effect of carbon emission trading. There are many defects in the single difference method, such as the inability to peel off the non-influencing factors of carbon emission reduction effect, which leads to the misjudgment of policy factors. Therefore, the DID method is mostly used in the literature. Xuan et al. [24] used a DID model to find that carbon emissions trading policy, economic development level, technical research level, and openness could significantly reduce carbon dioxide emissions intensity by promoting carbon reduction. Chen et al. [25] studied the impact of low-carbon city construction on enterprise carbon emission reduction by using the DID model, and obtained positive results. Many Chinese scholars have also studied carbon reduction according to the national conditions and policies of the Chinese market. Since China has carried out a carbon emission trading pilot for nine years, relevant research has mainly been carried out from a macro perspective. Huang [26] and Lu et al. [27] tested the panel data of 30 provinces in China by using the DID method, and analyzed the carbon emission reduction effects of different provinces. However, there are significant differences in carbon emissions among regions, and the DID method fails to meet the assumption that the experiment group and the control group have a common trend. Therefore, more and more researchers are adopting the PSM-DID method for empirical research. Sun et al. [28] adopted the PSM-DID method to analyze the emission reduction effect of carbon trading policies, but only verified the emission reduction effect at the provincial level.
It can be seen that the previous literature has performed some research on the effect of carbon emission policy, but there are still many deficiencies. First of all, in terms of research scope, most of the literature only analyzes the emission reduction effect from the national or provincial level. However, there is no specific research on the emission reduction effect in regions with different carbon emission and intensity. Secondly, in terms of research methods, most research uses the single difference method and the DID method to evaluate the policy effect, which are not suitable for spatial difference analysis. The PSM-DID method not only adapts to the common trend assumption, but also applies to large data samples. Therefore, this paper adopts the PSM-DID method to conduct empirical research on the sample data of 30 provinces in China (excepting Tibet, Hong Kong, Macao, and Taiwan due to data missing). Firstly, propensity score matching is carried out on provincial samples to eliminate mismatched samples. Secondly, on the basis of reasonable matching results, this paper makes an empirical analysis of the actual effect of carbon emission reduction under the carbon trading policies of 30 provinces and cities in the mainland of China from 2005 to 2019. After that, 30 provinces and cities are divided into the High CE-High CI region, the High CE-Low CI region, the Low CE-High CI region, and the Low CE-Low CI region, after which the effect of emission reduction is further analyzed according to regional differences.

2.2. Theoretical Hypothesis

As an institutional arrangement of “government creation and market operation”, carbon trading can spontaneously encourage enterprises to save energy and reduce emissions [29]. The allocation of carbon emission quotas to emission-control enterprises commercializes carbon emission rights. Once the emission of emission-control enterprises exceeds the allocated quotas, they must purchase quotas from the government or the market; otherwise, they will be punished. As a “rational” economic individual, enterprises will make corresponding adaptive behavior response under the stimulation of environmental regulation to pursue profit [30]. In addition, enterprises will strive to reduce their carbon emissions to meet the requirements formulated by the government, so as to reduce costs. If enterprises have surplus carbon emission quotas, they can also sell quotas from the market to make profits. Based on this, the following assumptions are put forward:
Hypothesis 1.
Carbon emissions trading policy can significantly inhibit the reduction of regional carbon emissions and carbon emission intensity.
For the realization of carbon emission reduction, combined with the relevant empirical research of domestic and foreign scholars, this paper takes industrial structure and clean energy technology innovation as the mediate factors, and tries to put forward the following research hypotheses:
The first mediate factor is the optimization of industrial structures. China’s energy consumption mainly comes from the use of energy in the production and operation of the power and heat industry, which means the change of industrial structure is related to carbon emissions. Taking Beijing as an example, empirical results show that there is a significant relationship between the primary, secondary, and tertiary industrial structure and carbon emission level in Beijing. It is suggested to promote the internal upgrading and coordinated development of the industry, so as to achieve the goal of carbon emission reduction [31]. For foreign countries and regions, the peak of industrial carbon emission is also the result of the industrial structure adjustment and technological progress in energy conservation and emission reduction [32]. Therefore, under the quota pressure of carbon trading policy, carbon emission enterprises will give priority to adjusting high carbon emission industries and focus on developing industries with less energy consumption. The above proves that there is a strong correlation effect between industrial structure and carbon emission. With this background, the industrial structure can be optimized through reasonably controlling high energy consumption and high pollution industries, as well as vigorously developing low-carbon tertiary industries that can effectively reduce carbon emissions [33,34,35]. Accordingly, the following assumption is made:
Hypothesis 2a.
The optimization of industrial structure has a mediating effect on carbon emission trading policy, thereby affecting carbon emission.
The second mediate factor is the improvement of clean energy technology. There are two ways for technological innovation to promote enterprise emission reduction; one is to improve energy efficiency. Technological innovation enables equal production with less energy consumption. That is to say, technological innovation will reduce energy consumption and promote carbon reduction. The second is to promote the use of clean new energy. In order to seek long-term sustainable development, emission-control enterprises will increase R&D investment, and new clean energy will be continuously developed and utilized. With the popularization and use of new clean energy, low-cost clean energy will gradually replace fossil fuels, so as to achieve carbon emission reduction [36,37,38]. Yang [39] studied the driving factors of carbon dioxide emission changes of major industries in various regions of China and found that carbon emission reduction mainly depends on technological progress, and the theoretical emission reduction rate brought by technological progress is 5.66%. From other respects, the impact of technological progress on carbon emission reduction is not obvious in a short time. At present, the coal-based energy structure of China is difficult to change in the long run while the energy pricing mechanism is not perfect. As a result, the carbon emission potential brought by technological progress is difficult to release in the short term, while they have strong carbon emission reduction potential in the long term. Therefore, the progress of clean energy technology is an important project that China needs to adhere to for a long time in carbon emission reduction [40]. Accordingly, the following assumption is made:
Hypothesis 2b.
The improvement of technology level has a mediating effect on carbon emission trading policy, thereby affecting carbon emission.

3. Methodology and Data

3.1. PSM-DID Model

On the basis of Hypothesis 1, this paper adopts a PSM-DID model to evaluate the policy implementation effect. The PSM-DID method is an improvement of the DID method, which is a classical evaluation model of policy implementation effect. The observable variables of the sample are matched by propensity score, and the samples of the control group and experiment group will correspond one to one. In 2014, the Chinese government implemented a pilot policy on carbon emissions trading; the pilot provinces and cities are: Beijing, Tianjin, Shanghai, Chongqing, Hubei, Guangdong, and Shenzhen. For the convenience of research in this paper, Shenzhen is merged into Guangdong Province. Considering that the actual start-up time of the carbon trading pilot was between the end of 2013 and the beginning of 2014, this paper takes 2014 as the dividing point between the pilot period and the non-pilot period. In order to test Hypothesis 1, this paper establishes the following model to test the impact of carbon trading pilot policy on carbon emissions and carbon emission intensity.
l n C E i , t = α 0 + α 1 T r e a t i + α 2 T t + α 3 T r e a t × T + α x C o n t r o l + λ i + γ i + μ i , t
l n C I i , t = β 0 + β 1 T r e a t i + β 2 T t + β 3 T r e a t × T + β x C o n t r o l + λ i + γ i + μ i , t
where l n C E i , t refers to the logarithm of carbon emissions by province, while l n C I i , t refers to the logarithm of carbon intensity by province; i and t represent province and year, respectively. T r e a t means the virtual variable of province. If province i is the pilot province of carbon emission trading, then T r e a t i = 1 and belongs to the experiment group; if this province is not a pilot, then T r e a t i = 0 and belongs to the control group. T t means the virtual variable of year. This paper took 2014 as the policy time point. When t ≥ 2014, T t = 1; otherwise T t = 0. The multiplicative term is the core explanatory variable to investigate whether the carbon emission trading policy improves the carbon emission performance of the pilot provinces. This paper mainly focuses on the coefficients α 3 and β 3 . If these are negative and significant, it shows that the carbon emission trading policy can significantly reduce carbon emissions and intensity in province pilots. λ i represents the individual fixed effect of province; c γ i represents the fixed effect of time; μ i , t represents random disturbing item; α 0 and β 0 are both intercept term. Based on the models above, this paper adds some control variables to explain the model more clearly.

3.2. Mediating Effect Model

In order to further analyze the implementation path and mechanism of carbon emission trading policy to verify H2a and H2b, this paper establishes the following mediating effect model [41]:
M i , t = β 0 + β 1 T r e a t i , t × T + λ i + γ i + μ i , t
M i , t refers to the explained variable, which is also the mechanism variable of promoting carbon emission reduction under the carbon trading policy. The DID model will be adopted to analyze whether these mechanism variables have a positive impact on carbon reduction under the policy, so as to test H2a and H2b.

3.3. Variables Selection and Data Description

3.3.1. Explained Variables

The explained variables of this paper are carbon emission (CE) and carbon emission intensity (CI). Carbon emission (CE) is the logarithm of the carbon emission value of each province in that year, that is, lnCE; the carbon emission intensity (CI) is the ratio of carbon emission and the GDP of each province in this year, and the logarithm is taken after standardization, that is, lnCI. As for the calculation of carbon emissions, considering that most of the carbon dioxide emissions comes from the combustion of fossil energy, this paper calculates the carbon emissions by referring to the energy discount coefficient and carbon emission coefficient provided by the Intergovernmental Panel on Climate Change in 2006. Seven kinds of energy consumption—coal, coke, gasoline, kerosene, diesel, fuel oil and natural gas—are selected to calculate carbon emissions, combined with the carbon emission coefficient table determined with reference to Shi [42]. The annual energy consumption data of each province are from the website of the National Bureau of Statistics. The calculation formula for carbon emission is:
C E = i = 1 7 E n i , t , j × θ i i
i means different types of energy; j means different provinces; t means different provinces; E n means consumption of each energy; θ i means carbon emission coefficient of different energy. The carbon emission coefficient table is shown in Table 1, and the calculated annual carbon emissions and growth rate of 30 provinces from 2005–2019 in China are shown in Figure 1. Moreover, the carbon emission and intensity of 30 provinces and cities in 2019 are shown in Figure 2.

3.3.2. Control Variables

There are many factors affecting carbon emissions. Based on the research focus of this paper and the existing research, this paper selects the following observable variables in terms of economic development, population scale, technical level, and industrial development:
(1)
Per capita GDP (rgdp). Per capita GDP can reflect the economic development and living standard of the province. Economically-developed provinces tend to have more developed industries, resulting in more carbon emissions. At the same time, well-developed provinces often master clean energy technology, which is conducive to the realization of long-term carbon emission reduction. Therefore, in this paper, GDP per capita is selected to represent the degree of economic development, and the logarithm is lnrgdp.
(2)
The size of permanent population at the end of the year (pop). Population size and carbon emissions are inseparable. Population-intensive areas not only consume more energy in daily life, but also increase industrial carbon emissions. In this paper, the permanent population at the end of the year in each province is selected to represent the demographic variable, and the logarithm is lnrgdp.
(3)
Technical progress (tec). On one hand, technological progress can improve energy efficiency and reduce carbon emissions under the premise of certain output; on the other hand, the improvement of clean energy technology will gradually eliminate backward production capacity and further provide technical support for carbon emission reduction. Technological progress is the critical way of achieving the goal of carbon emission reduction in the long run. In this paper, the technology market turnover is selected to represent the level of technological progress, and will be used as a mechanism variable to test whether hypothesis H2a is valid. The logarithm is lntec.
(4)
Industrial structure (is). Industrial structure affects the total energy consumption and carbon emission intensity, which are also directly related to carbon emission. The optimization and upgrading of the industrial structure in each province can effectively promote carbon emission reduction in the long run, but whether the structural adjustment at this stage can bring a significant carbon emission reduction effect still needs to be verified and discussed. Since the secondary industry accounts for the vast majority of carbon emissions, this paper selects the proportion of secondary industry and regional GDP to describe changes in regional industrial structure and test whether hypothesis H2b is valid. The logarithm is lnis.
The panel data of 30 provinces in China (excepting Tibet, Hong Kong, Macao, and Taiwan due to data missing) from 2005 to 2019 are selected. The specific variable meaning and descriptive statistics are shown in Table 2. All the data are from the website of the National Bureau of Statistics and the statistical yearbooks of provinces and regions.

4. Empirical Analysis

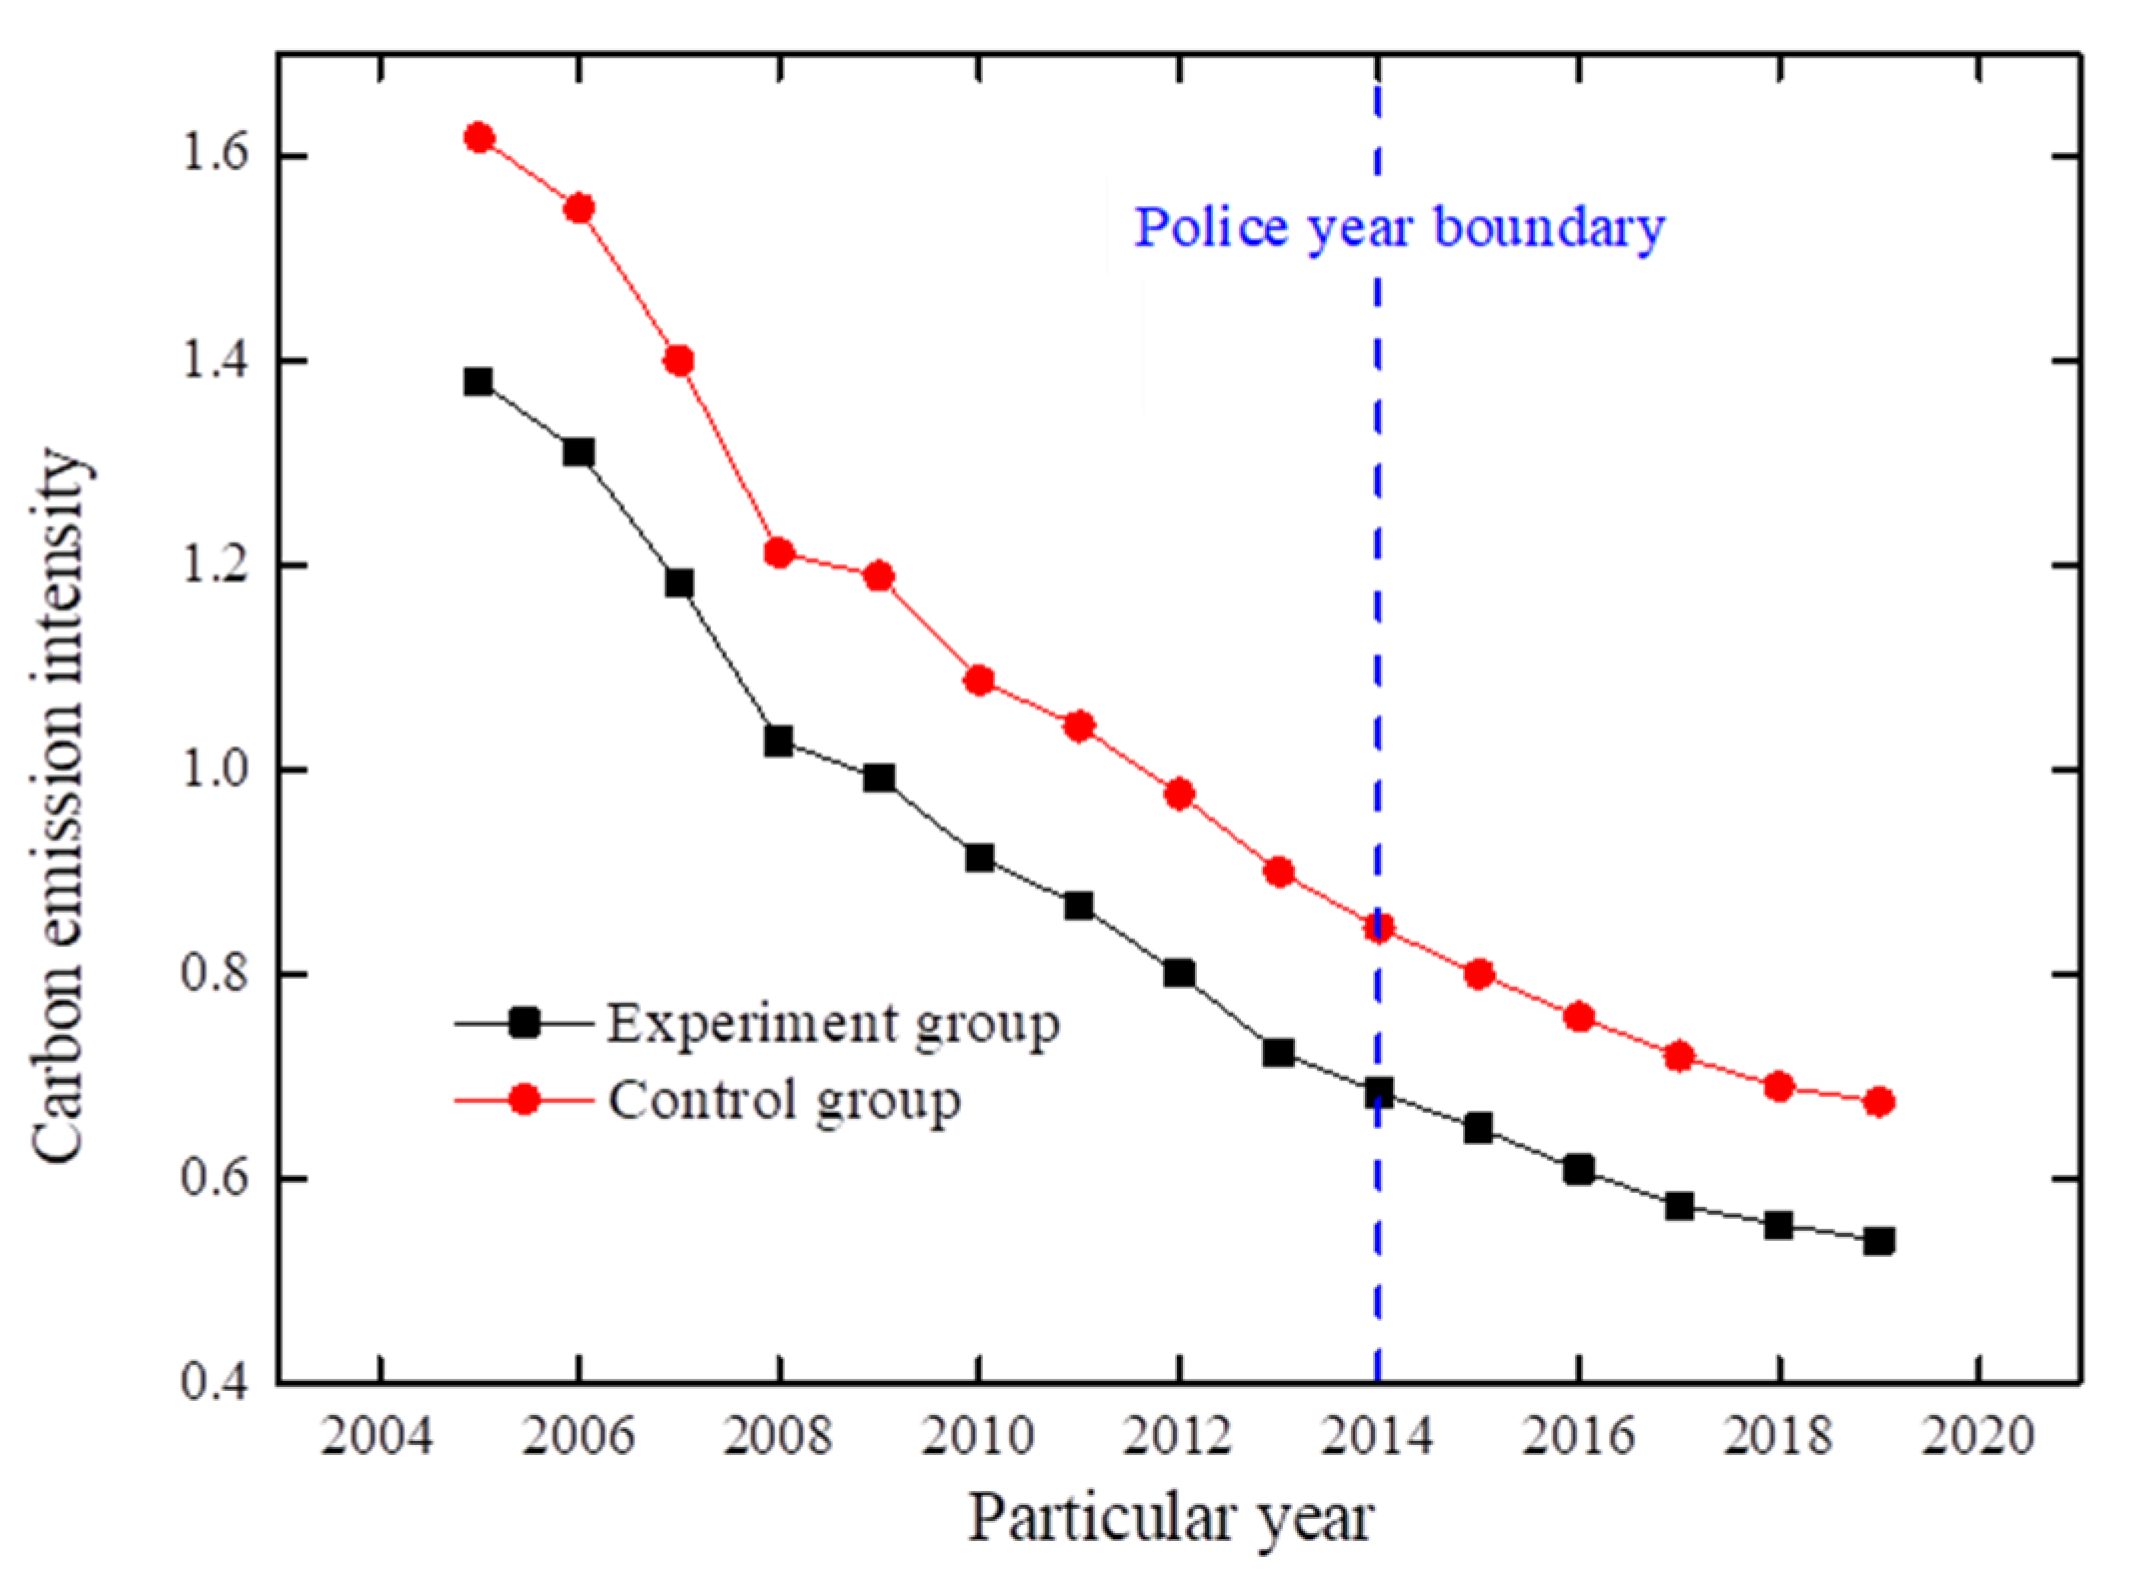
4.1. Analysis of PSM-DID Regression Results

4.1.1. Effect Analysis of Carbon Emission Reduction at National Level

In China, different provinces and regions have strong heterogeneity in terms of economic development, environmental resource endowment, and carbon emissions. Therefore, this paper adopts the PSM-DID method proposed by Heckman et al. [43] to empirically analyze the carbon emission reduction effects of different provinces under the pilot of carbon emission rights. Firstly, PSM matching and a stationary test were carried out.
This paper selects 2005 to 2019 as the time range of the sample, with 2014 as the dividing point year and 30 provinces in mainland China as the sample object. Six provinces including Beijing, Shanghai, Tianjin, Chongqing, Hubei and Guangdong (Shenzhen was merged into Guangdong Province) were taken as the subjects of the experiment group, and the other 24 provinces were taken as the subjects of the control group.
When matching the propensity score, the observable variables adopted are per capita GDP (lnrgdp), permanent population of each province (lnpop), technological progress (lntec), and industrial structure (lnis). Based on the above indicators, this paper uses the kernel matching method to determine the weight, estimates the propensity score according to the experiment group variables and control variables, and realizes it by probit regression.
According to the matching results, 13 samples that were not successfully matched were eliminated; 83 experiment group samples and 354 control group samples were obtained. In order to ensure the rationality of the matching method and results, the results should be tested for stability after the matching to guarantee that there is no significant difference in the observable variables of the matched samples. The stationarity test of observable variables before and after propensity score matching is shown in Table 3.
It can be seen from the table that before matching, the variables of per capita GDP, technological progress, and industrial structure are not significant, accepting the original hypothesis at the level of 1%. After matching, the differences of per capita GDP and technological progress between the experiment group and the control group decreased significantly. Moreover, the population variable reduced some differences between the experiment group and the control group, and also showed relative significance. It can be concluded that the matching method is relative appropriate and the matching results support the stationarity test, showing no obvious difference between the variables. As a result, the experiment group and control group show similar probability of implementing carbon emission trading policy in 2014, which meets the comparability requirements.
The following is the result analysis. Based on PSM propensity score matching, this paper calculates and regresses the carbon emissions and carbon emission intensity of 30 provinces from 2005 to 2019, so as to analyze the impact of carbon emission trading policy on carbon emission reduction. Firstly, the regression analysis of carbon emission reduction is carried out for 30 provinces at the national level. The results are shown in Table 4.
In order to ensure the accuracy and reliability of the model results, this paper adopts the fixed effect, that is, the provinces and years are fixed, and carries out regression on this basis. Columns (1) and (2) are the regression results of the pilot policy on the carbon emissions of 30 provinces; Columns (3) and (4) are the regression results of the pilot policy on the carbon emission intensity of 30 provinces.
Taking carbon emissions (lnCE) as the explanatory variable, it can be seen from Column (1) that the coefficient of the interactive term Treat*T is significantly negative, with a coefficient value of −0.2216, indicating that the implementation of the carbon emission trading policy has a significant negative impact on the carbon emissions of all provinces at the national level. In Column (2), control variables such as per capita GDP (lnrgdp), year-end permanent population (lnpop), technological progress (lntec), and industrial structure (lnis) are added. It can be seen that the interactive term Treat*T remains significant at the level of 1%, and the coefficient increases from −0.2216 to −0.2741, which shows that the addition of control variables makes the carbon emission reduction effect more obvious. Among the control variables, per capita GDP, year-end permanent population, and technological progress are significant at the level of 1% and 5%, with coefficient values of 0.5013, 0.924, and −0.0597, respectively. The increase of per capita GDP and permanent population show that the improvement of regional economic development and the increase of energy use are not conducive to the realization of carbon emission reduction to a certain extent. In contrast, the improvement of technology level and the activity of technology market will promote the upgrading and innovation of emission reduction technology and play a positive role in carbon emission reduction. Emerging energy-saving and emission-reduction technologies will become more popular and help the global carbon reduction process. It is worth noting that the industrial structure variable is not significant here, with a coefficient value of −0.0134, indicating that the upgrading and optimization of industries have not shown a great contribution to carbon reduction.
Similarly, taking the carbon emission intensity (lnci) as the explanatory variable, Columns (3) and (4) show that the coefficient of the interactive term Treat*T increases from −0.2457 to −0.2896, indicating that the carbon emission right policy also has a significant inhibitory effect on carbon emission intensity. The addition of control variables obviously promotes the effect of carbon emission reduction. It is worth noting that per capita GDP variables have a negative impact on carbon emission intensity, with coefficient value of −0.509. Considering that carbon emission intensity is the ratio of carbon emission to per capita GDP, under the premise of constant total carbon emission, higher GDP per capita will inevitably bring lower carbon emission intensity, which can also be verified in many economically-developed provinces and cities. The above proves the rationality of H1, that is, the carbon emission right policy has a significant inhibitory effect on the carbon emissions and carbon emission intensity of each province, indicating the dual effectiveness of the effect of carbon emission policy.

4.1.2. Effect Analysis of Carbon Emission Reduction at the Regional Level

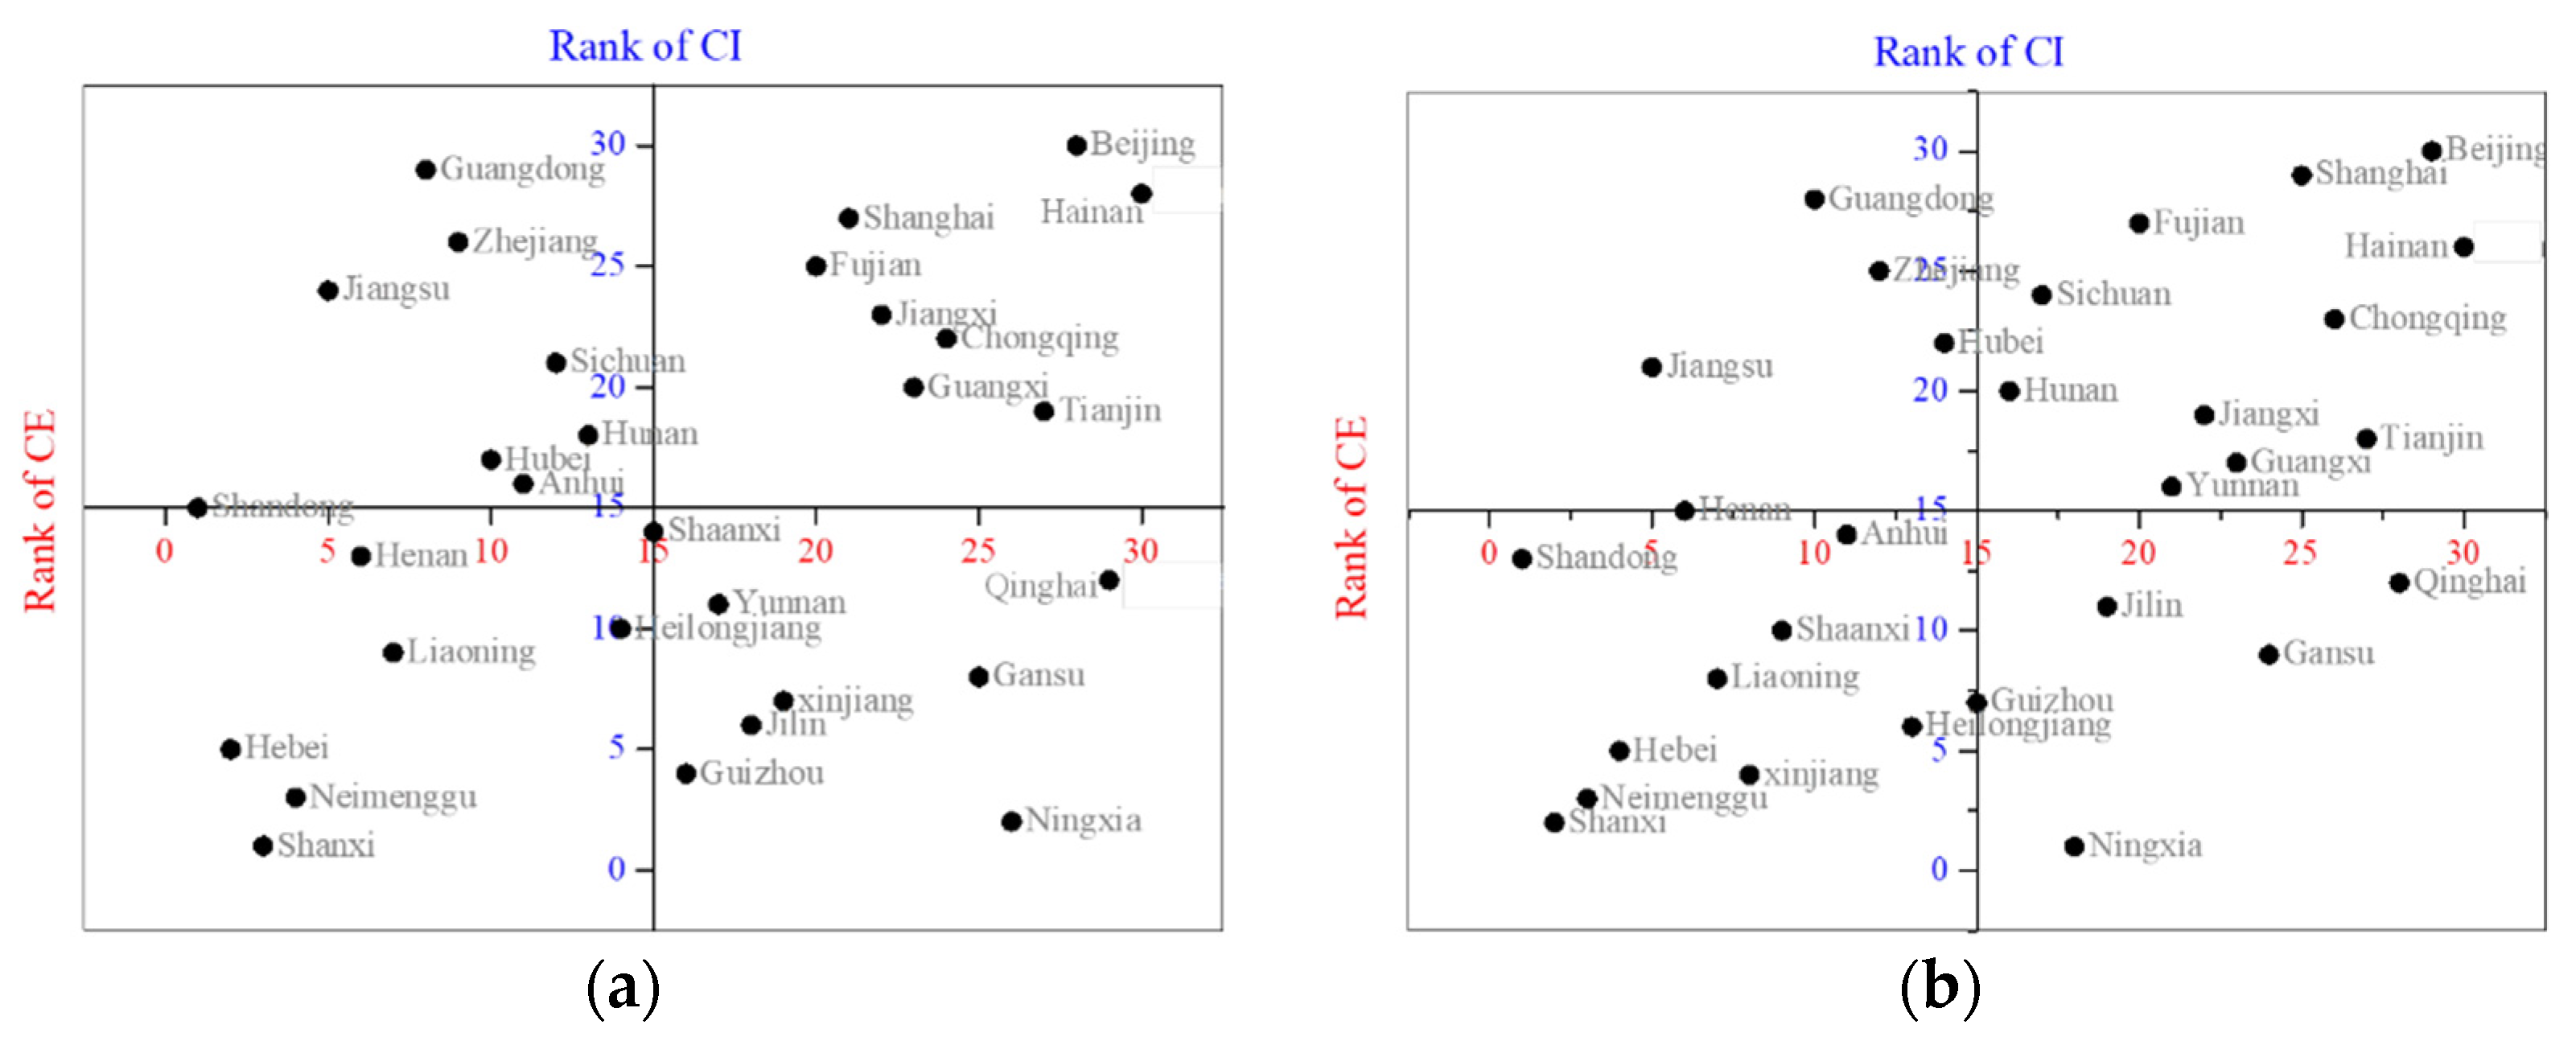
Region Division Based on Carbon Emissions and Carbon Emission Intensity

In order to further analyze the effect of carbon trading policy on China’s emissions reduction, sub-regional analysis is an effective method. If the division is only based on geographical location, there are still great differences in different regions, such as natural geographical environment and resource endowment. Since this paper mainly studies the emission reduction effect of carbon trading policies, we should focus on carbon emissions (CE) and carbon emission intensity (CI). Therefore, after the analysis at the national level, the 30 provinces and cities are divided into four parts according to their carbon emission and intensity: High CE-High CI region, High CE-Low CI region, Low CE-High CI region, and Low CE-Low CI region.
The division method of the quadrant diagram is adopted. Firstly, the carbon emissions and carbon emission intensity of 30 provinces and cities are ranked; then, the ranking of each province or city is filled in four quadrants to obtain four different regions. Since the implementation time of the carbon trading policy is about 2014, a four-quadrant graph was drawn based on the data from 2005 to 2013, and then another four-quadrant graph was drawn based on the data from 2014 to 2019. The final results of the two graphs were used to reasonably select the provinces or cities of four regions. It is worth noting that in order to obtain the test data, some of provinces or cities were adjusted to obtain more scientific results. Specifically, there are only six provinces are trading pilots (Shenzhen is merged into Guangdong Province for research convenience), and some of regions may have no pilot provinces without adjustment. In order to ensure that each region has at least one pilot city, some adjustments were made. For example, the dot of Hubei Province originally belongs to the High CE-Low CI region in the four-quadrant diagram, but the dot of Hubei Province is also very close to the High CE-High CI region. Considering that there is no pilot in a High CE-High CI region, Hubei Province was classified as a High CE-High CI region. In addition, the classification result is the combination of the two four-quadrant maps. The following Table 5 is the carbon emissions, carbon emission intensity, and ranking of provinces or cities before the implementation of carbon trading policy (2005–2013) and after the implementation of carbon trading policy (2014–2019).
The following Figure 3 are the two four-quadrant figures, the Table 6 is the adjusted regions division and the related provinces or cities.

Basic Background of Four Regions

The High CE-High CI region contains the most provinces and cities. Most of these provinces have a large population and relatively high GDP, but there are still great deficiencies in technological progress and innovation. The High CE-Low CI region contains the least provinces, but almost every province, such as Jiangsu, Zhejiang, and Guangdong, are at the forefront of China’s economy. At the same time, these provinces have large population density and elaborate industrial systems, all of which bring about more carbon emission; in Low CE-High CI region, most of these provinces are in a state of economic backwardness, with a small population and low industrial development. Accordingly, the technologies of energy saving and emission reduction in these provinces are far behind the average level; in the Low CE-Low CI region, most provinces, such as Beijing and Shanghai, have more advanced technology and high per capita GDP. They are committed to energy conservation and emission reduction, and are the pioneers of China’ s carbon emission reduction.

Analysis on Carbon Emission Effect in Different Regions

After the regional division, the fixed effect model is adopted to carry out DID regression for the four regions respectively. The results are shown in Table 7:
Whether CE or CI, all the four regions show that carbon trading policy is significantly negatively correlated with carbon emissions and carbon emission intensity, with max and min coefficient values of −0.4352 and −0.203; that is to say, with the promotion of carbon trading policy, carbon emissions and intensity are inhibited to some extent. In terms of the carbon emission reduction effect, Columns (1) and (2) of Table 7 indicate that the High CE-High CI region shows the best reduction effect, since the coefficient of Treat*t is relatively higher both for CE and CI. For the High CE-High CI region, larger population and dense industrial zones mean larger carbon emissions and greater pressure on carbon reduction. The per capita GDP has a strong positive correlation with the effect of carbon emission reduction, with coefficients of 0.507 for CE and −0.5099 for CI; technology shows a negative correlation with policy, indicating that the technical level of carbon emission reduction in High CE-High CI region plays a vital role in promoting carbon emission reduction. Therefore, when continuing to implement carbon emission reduction policy in High CE-High CI region, it is necessary to vigorously promote the innovation of technology. Moreover, large-scale heavy pollution and heavy emission enterprises should be focused on more to promote carbon emission reduction, since industrial structure is also significantly correlated.
Columns (3) and (4) of Table 7 show the effect of carbon reduction in the High CE-Low CI region. Compared with the High CE-High CI region, the coefficients of carbon emission reduction effect in this region are slightly lower compared with other regions, with coefficient of −0.255 and −0.203, but they also show a significant negative correlation. The region has a highly-developed economy, elaborate industrial structure, and leading energy conservation and emission reduction technology. It is worth noting that industrial structure variables show a significant positive relationship in this region, with coefficient values of 1.316 and 1.3057. The industrial structure variables selected in this paper are mainly the proportion of the secondary industry to the total output value. More industrially-intensive cities bring more carbon emissions. This region should make the most of its technological advantages and actively optimize the industrial structure to promote the realization of carbon emission reduction.
Columns (5) and (6) of Table 7 show the regression results of carbon trading policies on carbon emission reduction in the Low CE-High CI region. It is worth noting that the carbon emission intensity in this region has increased significantly, with a coefficient of −0.4352, showing an ideal emission reduction effect. Most provinces in the region are in a relatively backward economic state, with a small population and low level of advanced technology. Although carbon emissions are small, carbon emission intensity is strong, which means that the carbon emissions brought by economic development cannot effectively improve the per capita GDP under the same carbon emissions. The common situation is that although investment and industrial construction have also been carried out, the development speed of per capita GDP has not kept up with the speed of environmental destruction. This is a worrying situation showing that carbon emission reduction policy in this region is a strategic choice that needs to be adhered to for a long time. Moreover, the economic and institutional basis for the implementation of carbon trading policy should be supported to promote the carbon emission market. Furthermore, at this stage, this region should especially be alert to the transfer of backward production capacity from developed, areas which can result in high carbonization of industrial structure. Therefore, under the guidance of policies, government and enterprises should work together to explore reasonable ways for carbon emission reduction in this region.
Columns (7) and (8) of Table 7 show the regression results in the Low CE-Low CI region. In this region, the per capita GDP contributes greatly to carbon emission reduction, with coefficients of 0.5709 and −0.4239, respectively. Some cities in the region, such as Beijing and Shanghai, are in a leading position in China’s economy, with relatively small populations compared to other provinces. Therefore, the variable of population size plays a positive role in controlling carbon emissions. It is worth noting that the coefficient of the technological progress variable is the highest in this region, with coefficient values of −0.0742 and −0.0806, indicating that clean energy technology in this region has greatly promoted carbon emission reduction.

4.2. Robustness Test

4.2.1. Parallel Trend Test

The three hypotheses and DID regression are based on the basic assumption that the control group and the experimental group have a common trend. If their trends are stable before regress, the results are credible. The trend diagram of the average logarithm of carbon emission intensity in the experiment group and the control group from 2005 to 2019 is shown in Figure 4. Before 2014, the experiment group and the control group showed a significant downward trend; that is, the carbon emission intensity was continuously decreasing. After the implementation of the carbon emission trading policy in 2014, the carbon emission intensity of the experiment group decreased more obviously. The control group still showed a downward trend, but the decline range was smaller than the experiment group. In general, the experiment group and the control group have similar trends after PSM matching, meeting the requirements of parallel trend. In addition, after the implementation of the policy, the steeper decline curve of carbon emission intensity in the control group also shows the significant impact of the policy.

4.2.2. Robustness Test of Changing Time Width

The above results show that carbon emissions trading policy has a significant negative effect on carbon emissions and carbon emission intensity. In order to make the results more reliable, this paper changes the time width of the experimental group and the control group for regression. The specific method is to reduce the length of the sample time by 1 year, 2 years, and 3 years. If there is no significant change in the visibility of the regression results, the estimation results in this paper are robust. Therefore, the time width was changed to 2005–2016, 2005–2017, 2005–2018 for regression, and the results are as follows. According to the regression results, the interaction term Treat*T is significantly negative at the level of 1% in any period of investigation, which is consistent with the results above. In summary, the results of this paper are robust and reliable, with results shown in Table 8.

4.3. Test of Mediating Effect

According to the above analysis, the carbon emission trading policy can effectively reduce regional carbon emissions and carbon emission intensity, which verifies the reliability of Hypothesis 1. In order to verify Hypothesis 2a and Hypothesis 2b, the following part of the paper will further test whether carbon trading can help reduce carbon emission through the dual channels of the optimization of industrial structure and the improvement of technological level. Test results as shown in Table 9:
Columns (1) and (2) show that after matching in the second stage, the technological progress coefficient is significantly positive at the level of 1%, with a coefficient value of 0.3493, which means the implementation of carbon trading policy has effectively promoted the innovation of carbon emission reduction technology. For high carbon emission enterprises, carbon emission has become an inevitable challenge under severe carbon emission restrictions. The emergence of carbon emission trading enables high carbon emission enterprises to purchase carbon emission rights in the market to meet regulatory requirements. However, the purchase of carbon emission power increases the cost of enterprises, forcing enterprises to carry out technological innovation to control the cost of carbon emission reduction, so as to enhance market competitiveness. Once enterprises master advanced clean technologies, the cost of carbon emission reduction will be reduced in the long run, and enterprises will be increasingly motivated to develop and invest in clean carbon reduction technologies. Therefore, the implementation of the carbon emission right policy can achieve carbon emission reduction by promoting enterprises to strengthen the R&D of clean technologies. Technological innovation is also a necessary path for sustainable development of high-carbon emission enterprises. For low-carbon technology intensive enterprises, after implementing the carbon emission trading policy, the surplus carbon emission rights will enter the carbon market as commodities to provide carbon emission capacity for high-carbon enterprises. Through technological innovation, low-carbon emission enterprises can minimize their carbon emissions, and sell the remaining carbon emission rights on the market to obtain additional profits. Therefore, carbon emissions trading policy can promote both high-carbon enterprises and low-carbon technology-intensive enterprises to maximize their own interests through technological innovation, thus reducing carbon emissions as a whole.
Similarly, Columns (3) and (4) show that after matching in the second stage, the interaction coefficient of industrial structure Treat*T is slightly negative compared with the first stage, with the coefficient values of −0.0114 and −0.0245, indicating that the emission reduction effect of industrial structure is not obvious. Since the implementation of the carbon trading policy, local governments have provided subsidies for clean energy, which promotes the use of clean energy. However, China’s energy consumption structure is still dominated by coal, and this stable trend cannot be significantly improved through the adjustment of industrial structure in the short term. Carbon trading policy can promote the improvement of energy structure through the market and technology. However, due to the short time of the policy implementation, as well as the fact that the small adjustment of energy structure at this stage cannot offset the increase of carbon consumption caused by the increase of energy consumption, the emission reduction effect of carbon emission reduction policy on industrial structure is not obvious. In the long run, it also shows that there is still great improvement space for promoting carbon emission reduction through the optimization and adjustment of industrial structure. As a policy tool, carbon emission trading does not provide timely assistance to the optimization of industrial structure in the short term. However, with the maturity of the carbon trading market, it is bound to become a favorable channel to optimize industrial structure.

5. Conclusions and Implications

The evaluation of the carbon emission reduction effect of carbon emission trading policy can provide a reference for the national promotion of the carbon trading market. Based on the panel data of 30 provinces and cities in China from 2005 to 2019, this paper uses the PSM-DID method to evaluate the carbon emission reduction effect of each province. In addition, provinces and cities are divided into four regions—the High CE-High CI region, the High CE-Low CI region, the Low CE-High CI region, and the Low CE-Low CI region—based on their carbon emission and carbon emission intensity, after which the carbon emission reduction effects of the four regions are analyzed respectively. This paper also examines mediating effects through the dual channels of technological progress and industrial structure optimization. The results show that (1) under the carbon trading policy, regional carbon emissions and carbon emission intensity are both significantly reduced. (2) Carbon trading policy can reduce carbon emissions as a whole by promoting high-carbon enterprises and low-carbon technology intensive enterprises through technological innovation. (3) The effect of carbon trading pilot policy on the emission reduction of industrial structure is not obvious, but this paper also shows that promoting carbon emission reduction through the optimization of industrial structure has great room for improvement in the long run. (4) Among the four regions, the High CE-High CI region shows the best reduction effect, but the lack of advanced emission reduction technology has become a key factor restricting further carbon emission reduction; the High CE-Low CI region is facing great pressure for emission reduction due to its large population and imperfect industrial system. More attention should be paid to actively optimizing and improving the industrial structure to promote carbon emission reduction. The carbon emissions caused by economic development in the Low CE-High CI region have not effectively improved per capita GDP. This region should pay attention to the coordinated development of economy and carbon emission reduction to reduce carbon emission intensity and actively promote the realization of carbon trading. The Low CE-Low CI region contributes significantly to carbon emission reduction, for which the advanced technology and elaborate industrial structure are the key factors.
Based on the above conclusions, this study puts forward the following policy recommendations:
(1)
Accelerate the improvement of the institutional system and infrastructure of the carbon emission trading market and use the practical experience of the pilot areas to promote the stable operation and sustainable development of the national carbon emission trading market. At present, the national carbon emission trading market has been officially opened in China, but its system and technical specifications are still in the initial stage, which needs a host of pilot experience to support and gradually improve with market feedback. For most countries, the implementation of carbon emission trading policy is a strategic choice that can be adhered to for a long time. Therefore, they should accumulate experience from the pilot and vigorously support the construction of a carbon market.
(2)
Formulate emission reduction policies according to regional emission differences. There are great differences in terms of economic development, resource endowment, and environmental policies in different regions of China. Therefore, the formulation of carbon trading policy should also adapt to local conditions and fully consider regional heterogeneity. The High CE-High CI region should actively develop clean energy technology to further control carbon emission and intensity at the same time; the High CE-Low CI region should make most of its technology advantages and actively optimize the industrial structure to promote carbon reduction; the Low CE-High CI region should pay attention to the coordinated development of economy and carbon emission reduction to reduce carbon emission intensity and adhere to a carbon trading policy for a long time; the Low CE-Low CI region contributes significantly to carbon emission reduction. It should continue developing advanced technology in energy-saving and, furthermore, provide experience and technical support in energy conservation and emission reduction for other areas.
(3)
Improve the clean energy technology innovation capacity, as well as optimize the regional industrial structure. As mentioned above, technological innovation and upgrading can significantly promote carbon emission reduction, which is an important factor to promoting the stable decline of regional carbon emissions in the long run. International advanced technologies for carbon emission reduction should be actively introduced and applied based on the specific situation. The government should also allocate some funds to support the development of clean energy technologies and provide intellectual support for long-term carbon emission reduction. At the same time, industrial structure optimization has great room for improvement in the long run. Therefore, technology progress should be combined with optimization of the industrial structure to promote the green and low-carbon development of regional economies.

Author Contributions

Data curation, S.Y.; formal analysis, S.Y., G.T., Z.W. and Q.X.; funding acquisition, G.T.; investigation, S.Y. and G.T.; project administration, G.T.; writing—original draft, S.Y.; writing—review and editing, S.Y., G.T., Z.W. and Q.X. All authors have read and agreed to the published version of the manuscript.

Funding

This work was supported by the major projects of the National Social Science Foundation of China “Research on Cross-border Water Resources Confirmation and Distribution Method and Guarantee System” (17ZDA064).

Institutional Review Board Statement

Not applicable.

Informed Consent Statement

Not applicable.

Data Availability Statement

Data is contained within the article.

Acknowledgments

The authors are very grateful to the reviewers for carefully reading the manuscript and providing valuable suggestions.

Conflicts of Interest

The authors declare no conflict of interest.

Abbreviations

DID Difference In Difference
PSM-DID Propensity Score Matching-Difference in Difference
CE Carbon Emission
CI Carbon emission Intensity
BRICS Brazil, Russia, China, India, and South Africa

References

  1. Hanif, I.; Aziz, B.; Chaudhry, I.S. Carbon emissions across the spectrum of renewable and nonrenewable energy use in developing economies of Asia. Renew. Energy 2019, 143, 586–595. [Google Scholar] [CrossRef]
  2. Zakarya, G.Y.; Mostefa, B.; Abbes, S.M.; Seghir, G.M. Factors Affecting CO2 Emissions in the BRICS Countries: A Panel Data Analysis. Procedia Econ. Financ. 2015, 26, 114–125. [Google Scholar] [CrossRef] [Green Version]
  3. Fan, Y.; Liu, L.-C.; Wu, G.; Tsai, H.-T.; Wei, Y.-M. Changes in carbon intensity in China: Empirical findings from 1980–2003. Ecol. Econ. 2007, 62, 683–691. [Google Scholar] [CrossRef]
  4. Wu, L.; Kaneko, S.; Matsuoka, S. Driving forces behind the stagnancy of China’s energy-related CO2 emissions from 1996 to 1999: The relative importance of structural change, intensity change and scale change. Energy Policy 2005, 33, 319–335. [Google Scholar] [CrossRef]
  5. Pachauri, K.; Meyer, A. Climate Change 2014. Synthsis Report. Environ. Policy Collect. 2014, 27. [Google Scholar] [CrossRef]
  6. Coase, R.H. The Problem of Social Cost. J. Law Econ. 1960, 3, 1–44. [Google Scholar] [CrossRef]
  7. Dales, J.H. Land, water, and ownership. Can. J. Econ./Rev. Can. D’economique 1968, 1, 791–804. [Google Scholar] [CrossRef]
  8. Wang, R.; Sun, T. Empirical study on the impact of environmental regulation on carbon emissions based on extended STIRPAT model. Feb-Fresenius Environ. Bull. 2019, 28, 7514–7522. [Google Scholar]
  9. Han, Y. Impact of environmental regulation policy on environmental regulation level: A quasi-natural experiment based on carbon emission trading pilot. Environ. Sci. Pollut. Res. 2020, 27, 23602–23615. [Google Scholar] [CrossRef] [PubMed]
  10. Zhang, H.; Duan, M.; Deng, Z. Have China’s pilot emissions trading schemes promoted carbon emission reductions?—the evidence from industrial sub-sectors at the provincial level. J. Clean. Prod. 2019, 234, 912–924. [Google Scholar] [CrossRef]
  11. Chuai, X.; Feng, J. High resolution carbon emissions simulation and spatial heterogeneity analysis based on big data in Nanjing City, China. Sci. Total Environ. 2019, 686, 828–837. [Google Scholar] [CrossRef]
  12. Wang, R.; Liu, W.; Xiao, L.; Liu, J.; Kao, W. Path towards achieving of China’s 2020 carbon emission reduction target—A discussion of low-carbon energy policies at province level. Energy Policy 2011, 39, 2740–2747. [Google Scholar] [CrossRef]
  13. Michael, P. America’s green strategy. Sci. Am. 1991, 264, 168. [Google Scholar]
  14. Porter, M.E.; Van der Linde, C. Toward a new conception of the environment-competitiveness relationship. J. Econ. Perspect. 1995, 9, 97–118. [Google Scholar] [CrossRef] [Green Version]
  15. Xu, M.; Zuo, H.P. Study on the relationship between environmental regulation and industrial competitiveness under agglomeration effect——“Porter Hypothesis” Re-Examination. China Ind. Econ. 2013, 3, 72–84. [Google Scholar]
  16. Pigou, A.C. The Economics of Welfare; Macmillan: London, UK, 1920. [Google Scholar]
  17. Zhang, L.F.; Peng, Y.Y. Research progress of emission trading mechanism. Econ. Perspect. 2011, 4, 135–140. [Google Scholar]
  18. Zeng, G.; Wan, J.H. Carbon emission permits trading: A summary. Chin. Rev. Financ. Stud. 2010, 2, 54–67. [Google Scholar]
  19. Li, Z.X.; Zhang, X.J.; Dong, Y.Y. Research on China’s carbon emissions trading market status, Problemsand Measures. Ecol. Environ. Sci. 2014, 23, 1876–1882. [Google Scholar]
  20. Wang, W.J.; Xie, P.C.; Li, C.M. The key elements analysis from the mitigation effectiveness assessment of Chinese pilots carbon emission trading system. China Popul. Resour. Environ. 2018, 28, 26–34. [Google Scholar]
  21. Liu, C.M.; Sun, Z.; Zang, J. Research on the effect of carbon emission reduction policy in China’s carbon emissions trading pilot. China Popul. Resour. Environ. 2019, 29, 49–58. [Google Scholar]
  22. Feng, Y. Does China’s carbon emission trading policy alleviate urban carbon emissions? IOP Conf. Ser. Earth Environ. Sci. 2020, 508, 012044. [Google Scholar] [CrossRef]
  23. Hua, G.; Cheng, E.; Wang, S. Managing carbon footprints in inventory management. Int. J. Prod. Econ. 2011, 132, 178–185. [Google Scholar] [CrossRef]
  24. Xuan, D.; Ma, X.; Shang, Y. Can China’s policy of carbon emission trading promote carbon emission reduction? J. Clean. Prod. 2020, 270, 122383. [Google Scholar] [CrossRef]
  25. Chen, S.; Mao, H.; Sun, J. Low-Carbon City Construction and Corporate Carbon Reduction Performance: Evidence from a Quasi-Natural Experiment in China. J. Bus. Ethics 2021, 1–19. [Google Scholar] [CrossRef]
  26. Huang, Z.P. Does the carbon emission trading scheme promote carbon mitigation? J. Arid. Land Resour. Environ. 2018, 32, 32–36. [Google Scholar]
  27. Lu, Z.N.; Luo, Y.S. Analysis of China’s carbon trading policy in mitigation effectiveness. J. Arid. Land Resour. Environ. 2020, 34, 1–7. [Google Scholar]
  28. Sun, Z.Q.; Li, H.H.; Liu, B.L. Research on regional emission reduction potential under carbon trading policy. Sci. Technol. Prog. Policy 2020, 37, 28–35. [Google Scholar]
  29. Dai, Y.; Li, N.; Gu, R.; Zhu, X. Can China’s Carbon Emissions Trading Rights Mechanism Transform its Manufacturing Industry? Based on the Perspective of Enterprise Behavior. Sustainability 2018, 10, 2421. [Google Scholar] [CrossRef] [Green Version]
  30. Pashigian, B.P. A Theory of Prevention and Legal Defense with an Application to the Legal Costs of Companies. J. Law Econ. 1982, 25, 247–270. [Google Scholar] [CrossRef]
  31. Zhang, H.Y.; Jiang, Y.M.; Feng, T.T. Research on industrial structure adjustment to the influence of Beijing carbon emissions reduction targets. China Population. Resour. Environ. 2016, 26, 58–67. [Google Scholar]
  32. Guo, C.X. Estimation of industrial carbon emission reduction potential in China. China Popul. Resour. Environ. 2014, 24, 13–20. [Google Scholar]
  33. Ren, S.; Yuan, B.; Ma, X.; Chen, X. The impact of international trade on China’s industrial carbon emissions since its entry into WTO. Energy Policy 2014, 69, 624–634. [Google Scholar] [CrossRef]
  34. Springer, C.; Evans, S.; Lin, J.; Roland-Holst, D. Low carbon growth in China: The role of emissions trading in a transitioning economy. Appl. Energy 2019, 235, 1118–1125. [Google Scholar] [CrossRef]
  35. Ren, J.L.; Xu, C.L.; Chen, Y.B. Research on industrial structure adjustment and carbon emissions of the Yellow River delta high-efficiency ecological economic region. China Popul. Resour. Environ. 2015, 25, 35–42. [Google Scholar]
  36. Abolhosseini, S.; Heshmati, A. The main support mechanisms to finance renewable energy development. Renew. Sustain. Energy Rev. 2014, 40, 876–885. [Google Scholar] [CrossRef] [Green Version]
  37. Najm, S.; Matsumoto, K. Does renewable energy substitute LNG international trade in the energy transition? Energy Econ. 2020, 92, 104964. [Google Scholar] [CrossRef]
  38. Tu, Z.G. China’s carbon emission reduction path and strategic choice. Soc. Sci. China 2012, 3, 78–94. [Google Scholar]
  39. Yang, L.J.; Zhu, J.P.; Jia, Z.J. Influencing factors and current challenges of CO2 emission reduction in China: A perspective based on technological progress. Econ. Res. J. 2019, 54, 118–132. [Google Scholar]
  40. Wang, C.; Cai, W.; Liao, H.; Lin, J. China’s carbon mitigation strategies: Enough? Energy Policy 2014, 73, 47–56. [Google Scholar] [CrossRef]
  41. Baron, R.M.; Kenny, D.A. The moderator–mediator variable distinction in social psychological research: Conceptual, strategic, and statistical considerations. J. Pers. Soc. Psychol. 1986, 51, 1173–1182. [Google Scholar] [CrossRef]
  42. Shi, Y.L.; Hu, S.M. Dynamic analysis of technological progress and economic growth on carbon dioxide emission. Stat. Decis. 2017, 16, 149–151. [Google Scholar]
  43. Heckman, J.J.; Ichimura, H.; Todd, P. Matching As an Econometric Evaluation Estimator. Rev. Econ. Stud. 1998, 65, 261–294. [Google Scholar] [CrossRef]
Figure 1. Carbon emission and increase rate of 30 provinces in China from 2005 to 2019.
Energies 15 01921 g001
Figure 2. (a). Carbon emission of 30 provinces and cities of China in 2019. (b). Carbon emission intensity of 30 provinces and cities of China in 2019.
Energies 15 01921 g002
Figure 3. (a) The ranking of carbon emission and intensity of 30 provinces and cities before trading policy (2005–2013). (b) The ranking of carbon emission and intensity of 30 provinces and cities after trading policy (2014–2019).
Energies 15 01921 g003
Figure 4. Trend chart of carbon emission intensity before and after carbon emission trading pilot policy.
Energies 15 01921 g004
Table 1. Carbon emission coefficient.
TypeCoalCokeGasolineKeroseneDiesel OilFuel OilNatural Gas
Carbon emission coefficient (ton/standard coal)0.75590.8550.55380.57140.59210.61850.4483
Note: the carbon emission data comes from 2006 IPCC guidelines for national greenhouse gas inventories.
Table 2. Meaning and descriptive statistics of each variable.
VariablelncelncilnrgdplnpoplnteclnisNumbers
All
samples
Mean9.04206.572110.41078.18104.02636.044017450
Std.deviation0.88450.83500.64680.74841.85880.2243153
Minimum5.87303.33518.55996.2971−0.63495.074501
Maximum10.63268.567712.01119.43268.64746.429079
Experiment
group
Mean8.65695.785210.92688.07485.81715.93987590
Std.deviation0.66390.77530.60540.71831.33960.3223677
Minimum6.90313.33519.33636.94993.57545.074501
Maximum9.70837.079712.01119.43268.64746.250909
Control groupMean9.13836.768810.28168.20763.57856.070053360
Std.deviation0.90700.72720.59060.75441.69450.1837659
Minimum5.87305.18278.55996.2971−0.63495.314727
Maximum10.63268.567711.71509.22097.29416.429079
Table 3. Stationary test of variables before and after matching.
VariablesSamplesMean ValueBias (%)Test
Experiment GroupControl GroupT-Valuep-Value
Per GDPbefore10.92110.19134.112.880.000
after10.68210.688−1.0−0.080.933
Populationbefore8.12198.2066−11.4−1.100.271
after8.2388.3111−9.8−0.640.525
Technical progressbefore5.54823.3671141.413.560.000
after4.80864.8762−4.4−0.340.737
Industrial structurebefore5.93940.4476−66.5−6.830.000
after6.04576.0478−0.9−0.080.938
Table 4. Impact of national carbon trading policy on carbon emissions and carbon intensity.
VariablesCarbon EmissionCarbon Emission Intensity
(1)(2)(3)(4)
Treat*T−0.2216 ***−0.2741 ***−0.2457 ***−0.2896 ***
(0.056)(0.04)(0.001)(0.0396)
lnrgdp 0.5013 *** −0.509 ***
(0.0312) (0.0308)
lnpop 0.924 *** 0.2399
(0.1934) (0.1913)
lntec −0.0597 ** −0.0579 ***
(0.0131) (0.013)
is −0.0134 0.0793
(0.0972) (0.41)
cons8.9741 ***−3.3583 **6.8644 ***9.708 ***
[0.000][0.045][0.000][0.000]
Province fixedYESYESYESYES
Year fixedYESYESYESYES
Note: the values in parentheses are standard errors and those in brackets are p values; ***, **, and * indicate significance at the 1%, 5%, and 10% levels, respectively.
Table 5. The carbon emission, intensity, and rank of provinces or cities before and after the carbon trading policy.
Before Carbon Trading Policy (2005–2013)After Carbon Trading Policy (2014–2019)
Provinces or CitesPer Carbon Emission
(1000 tons)
RankPer Carbon Emission IntensityRankPer Carbon Emission
(1000 tons)
RankPer Carbon Emission IntensityRank
Beijing2755.94280.2346301385.81290.051030
Tianjin4366.20270.7741194415.61270.370218
Hebei26,310.8121.7085529,690.5441.01165
Shanxi25,496.9233.4925134,324.7522.47762
Neimenggu20,933.4842.9394332,467.4732.23913
Liaoning15,564.7971.2519917,442.1170.80488
Jilin7658.83181.443867928.67190.744611
Heilongjiang9421.69141.23451011,216.25130.90566
Shanghai5899.34210.3926275385.21250.175329
Jiangsu20,064.1950.58612424,791.3250.309721
Zhejiang11,323.2290.49522612,138.07120.245825
Anhui10,246.71110.92671613,846.51110.492914
Fujian6281.93200.5067257342.56200.230827
Jiangxi5275.80220.6813237141.62220.369619
Shandong30,237.4411.04881537,275.0710.619213
Henan20,057.7861.07721320,135.1160.480315
Hubei10,635.99100.82061710,855.41140.309522
Hunan9464.26130.77501810,195.56160.319720
Guangdong13,454.6880.34322915,613.85100.182628
Guangxi5192.45230.7142206665.18230.393717
Hainan637.20300.3549281031.94300.242326
Chongqing4657.08240.6857225027.57260.274323
Sichuan9840.54120.7001219235.85170.265124
Guizhou8979.40162.3808410,478.53150.85387
Yunnan8030.51171.2307117287.74210.419716
Shaanxi9155.40151.07621416,014.1790.777510
Gansu4529.65251.314685781.91240.79489
Qinghai1204.61291.1913121623.40280.702612
Ningxia4513.80263.421728633.85182.82231
Xinjiang6810.96191.3476716,310.4981.49664
Table 6. Regional division and the related provinces or cities.
Region CategoryProvinces or Cities
High CE-High CIShanxi, Neimenggu, Xinjiang, Hebei, Liaoning, Shaanxi, Shandong, Anhui, Henan, Hubei
High CE-Low CIJiangsu, Zhejiang, Guangdong, Hunan, Sichuan
Low CE-High CINingxia, Gansu, Jilin, Qinghai, Heilongjiang, Guizhou, Tianjin
Low CE-Low CIYunnan, Guangxi, Jiangxi, Chongqing, Hainan, Fujian, Shanghai, Beijing
Table 7. Effects of carbon trading policies on carbon emissions and carbon intensity in different regions.
VariablesHigh CE-High CI RegionHigh CE-Low CI RegionLow CE-High CI RegionLow CE-Low CI
Region
(1) CE(2) CI(3) CE(4) CI(5) CE(6) CI(7) CE(8) CI
Treat*T−0.38 ***−0.3736 ***−0.255 **−0.203 *−0.3311 ***−0.4352 ***−0.3245 ***−0.3326 ***
(0.0767)(0.0745)(0.014)(0.049)(0.0947)(0.0944)(0.0795)(0.0821)
lnrgdp0.507 ***−0.5099 ***0.3523 ***−0.6082 ***0.5069 ***−0.5065 ***0.5709 ***−0.4239 ***
(0.0563)(0.0547)(0.000)(0.000)(0.0672)(0.067)(0.0693)(0.0715)
lnpop3.5747 ***2.9013 ***0.7776 ***−0.1951 *1.3083 ***0.5585 *−0.9191 *−1.8072 ***
(0.558)(0.5423)(0.000)(0.07)(0.3063)(0.3053)(0.4722)(0.4874)
lntec−0.0659 **−0.0631 ***−0.0549−0.0664−0.0538 **−0.0477 *−0.0742 **−0.0806 **
(0.021)(0.0205)(0.183)(0.106)(0.0268)(0.0268)(0.0318)(0.0328)
lnis0.5061 **0.5862 ***1.316 ***1.3057 ***−0.2015−0.08260.30090.3391
(0.206)(0.2001)(0.000)(0.000)(0.1419)(0.1415)(0.2912)(0.3005)
cons−28.669 ***−15.6522 ***−8.9739 ***6.6173 ***−4.8867 **8.7655 ***8.0596 *23.037 ***
[0.000][0.000][0.000][0.000][0.02][0.000][0.086][0.000]
Province fixedYESYESYESYESYESYESYESYES
Year fixedYESYESYESYESYESYESYESYES
R20.80690.85580.67910.87650.73760.87490.58060.8914
Note: the values in parentheses are standard errors, and those in brackets are p values; ***, **, * indicate significance at the 1%, 5%, and 10% levels, respectively.
Table 8. Robustness test with different time widths.
Variables2005–20162005–20172005–2018
lnCElnCIlnCElnCIlnCElnCI
Treat*T−0.2045 ***−0.2060 ***−0.2272 ***−0.2287 ***−0.2371 ***−0.2287 ***
[0.000][0.000][0.000][0.000][0.000][0.000]
t−0.0834 ***−0.0810 ***−0.0856 ***−0.0837 ***−0.0942 ***−0.0934 ***
[0.001][0.000][0.000] [0.000][0.000][0.000]
lnrgdp0.5217 ***−0.4874 ***0.5152 ***−0.4758 ***0.5243 ***−0.4918 ***
[0.000][0.000][0.000][0.000][0.000][0.000]
lnpop0.7271 ***−0.03660.8243 ***0.11130.9969 ***0.3594 *
[0.000][0.864][0.000][0.594][0.000][0.088]
lntec−0.0395 ***−0.0380 ***−0.0453 ***−0.0433 ***−0.0591 ***−0.0557 ***
[0.007][0.009][0.002][0.002][0.007][0.009]
is−0.07750.0773−0.029580.0426−0.14810.0806
[0.762][0.762][0.778][0.684][0.173][0.452]
cons−2.033512.1687 ***−2.601210.8323 ***−3.3522 *9.5339 ***
[0.226][0.000][0.161][0.000][0.066][0.000]
Province fixedYESYESYESYESYESYES
Year fixedYESYESYESYESYESYES
R20.80710.83580.77390.84440.74690.8527
N281281316316346346
Note: brackets are p values and ***, **, * indicate significance at the 1%, 5%, and 10% levels, respectively.
Table 9. Regression results of policy action mechanism.
VariableTechnology ProgressIndustrial Structure
First Stage (1)Second Stage (2) First Stage (3)Second Stage (4)
Treat*T0.19930.3493 **−0.0114−0.0245 ***
(0.189)(0.015)(0.543)(0.008)
lnrgdp1.3954 ***1.553 ***0.0014−0.02738 ***
(0.000)(0.000)(0.709)(0.000)
lnpop−2.75 ***−2.998 ***004489 ***−0.08387 *
(0.000)(0.000)(0.000)(0.078)
Control variablesYESYESYESYES
Cons13.29376 **13.89091 **0.08231.380604 ***
(0.024)(0.016)(0.125)(0.000)
Province fixedYESNOYESNO
Year fixedYESNOYESNO
R20.67300.66560.29180.2625
Note: ***, **, * indicate significance at the 1%, 5%, and 10% levels, respectively.
Publisher’s Note: MDPI stays neutral with regard to jurisdictional claims in published maps and institutional affiliations.

