
Numerical Simulation of a 10 kW Gas-Fueled Chemical Looping Combustion Unit


Abstract
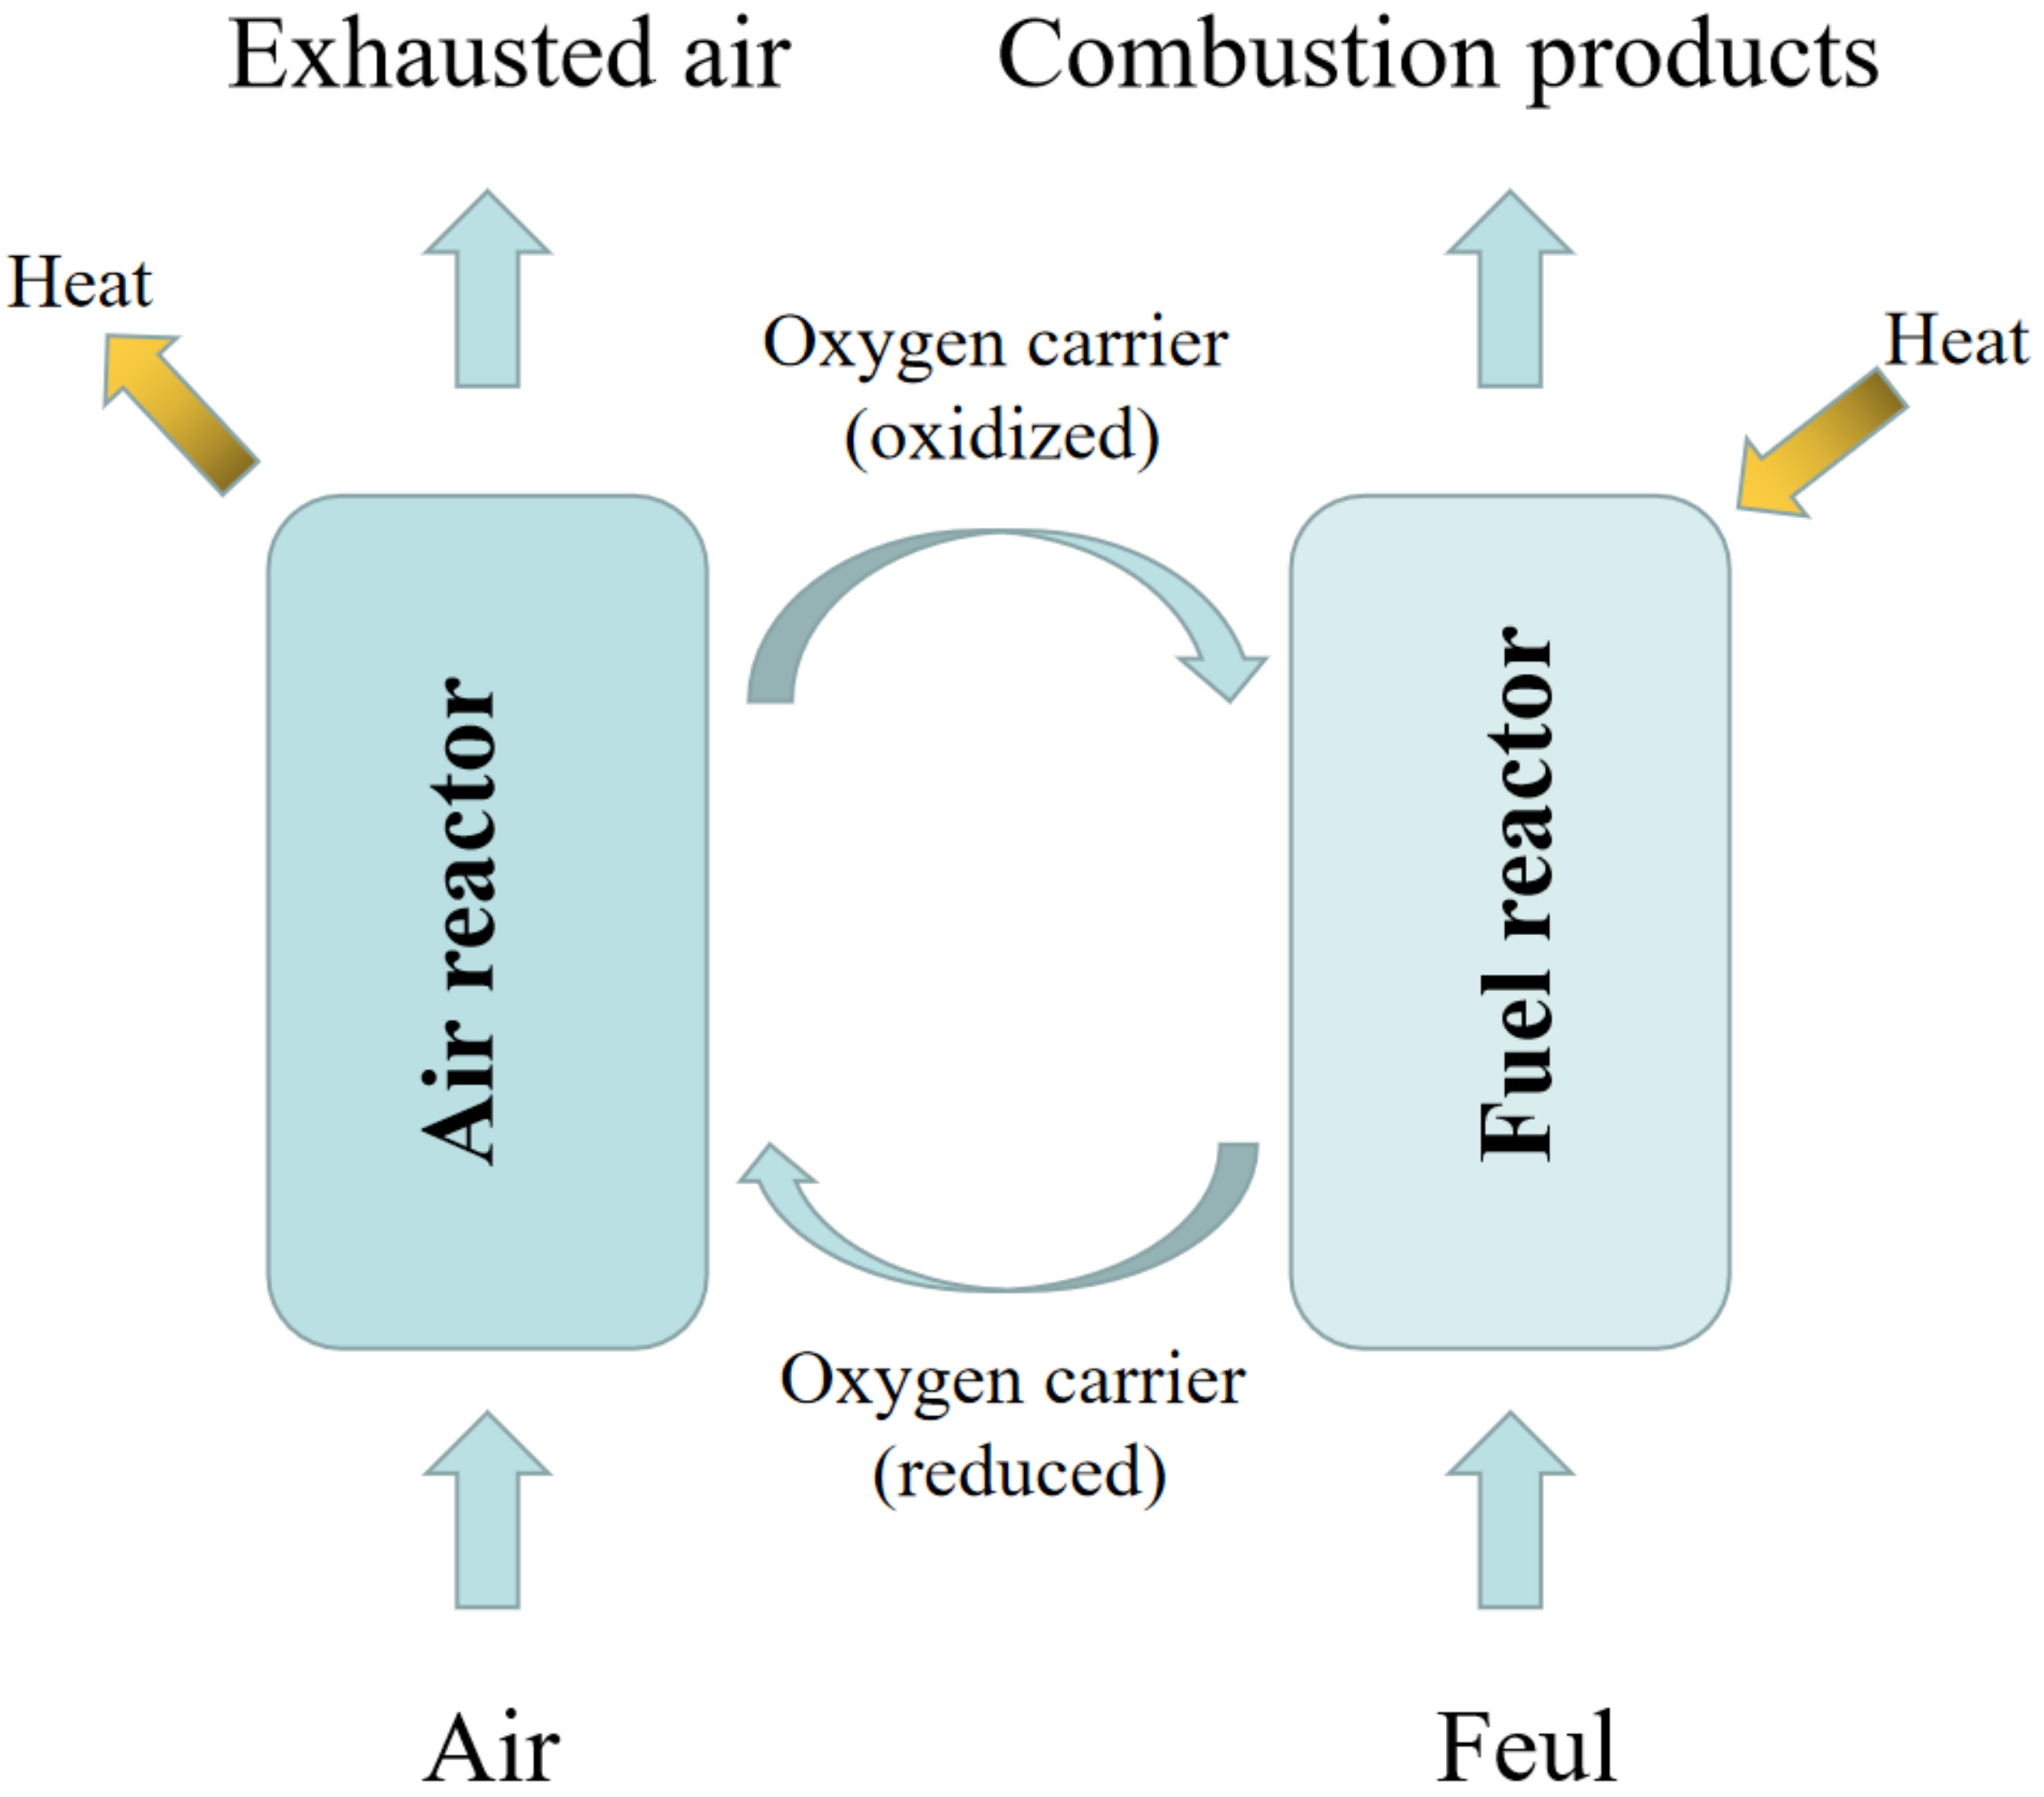
:1. Introduction
2. Mathematical Models
4Fe3O4 + O2 → 6Fe2O3
3. Simulation Setup
4. Results and Discussion
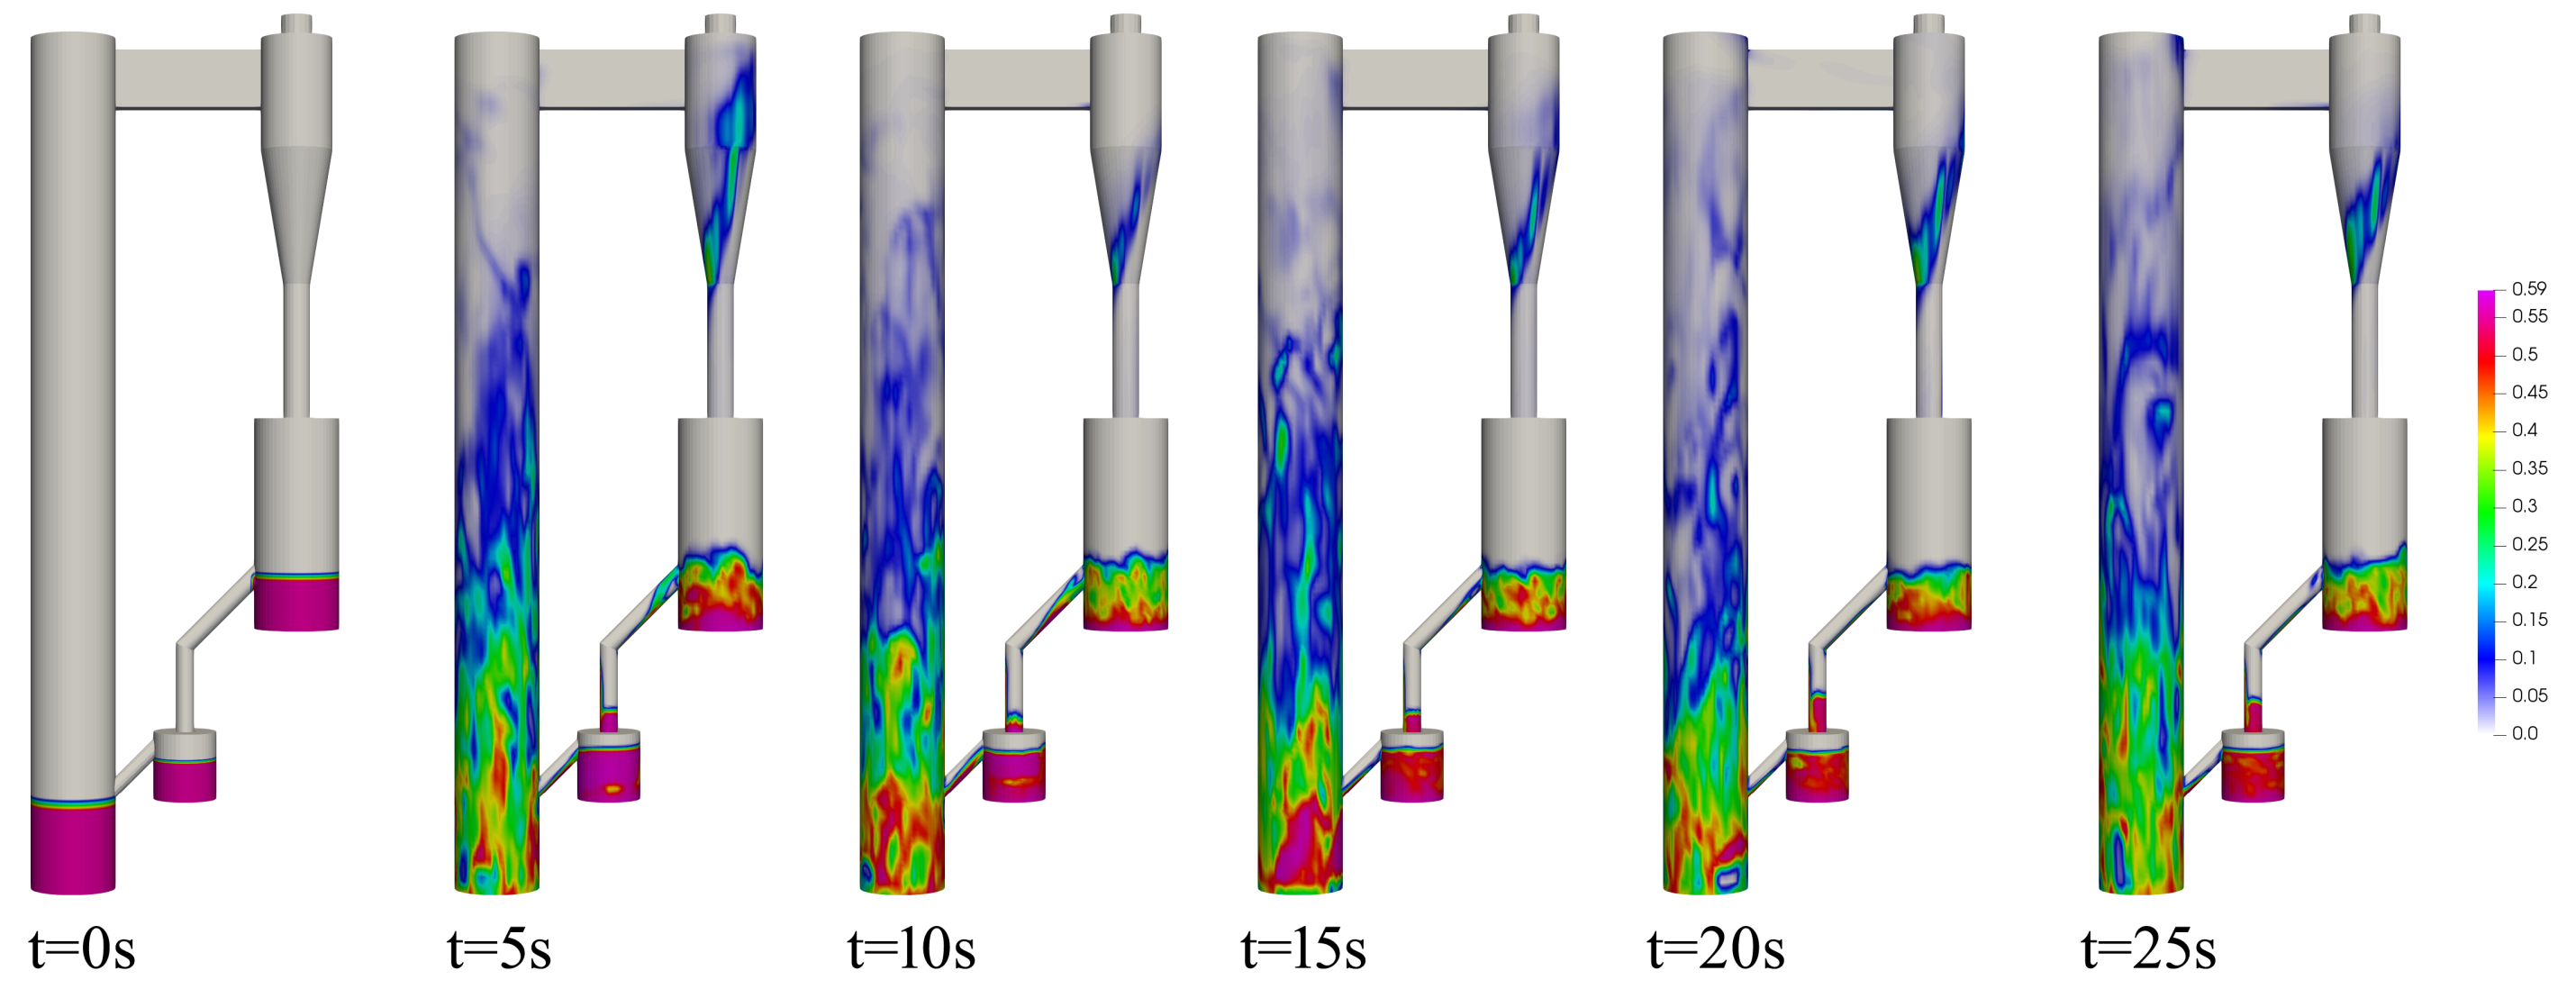
4.1. Flow Behavior of CLC System
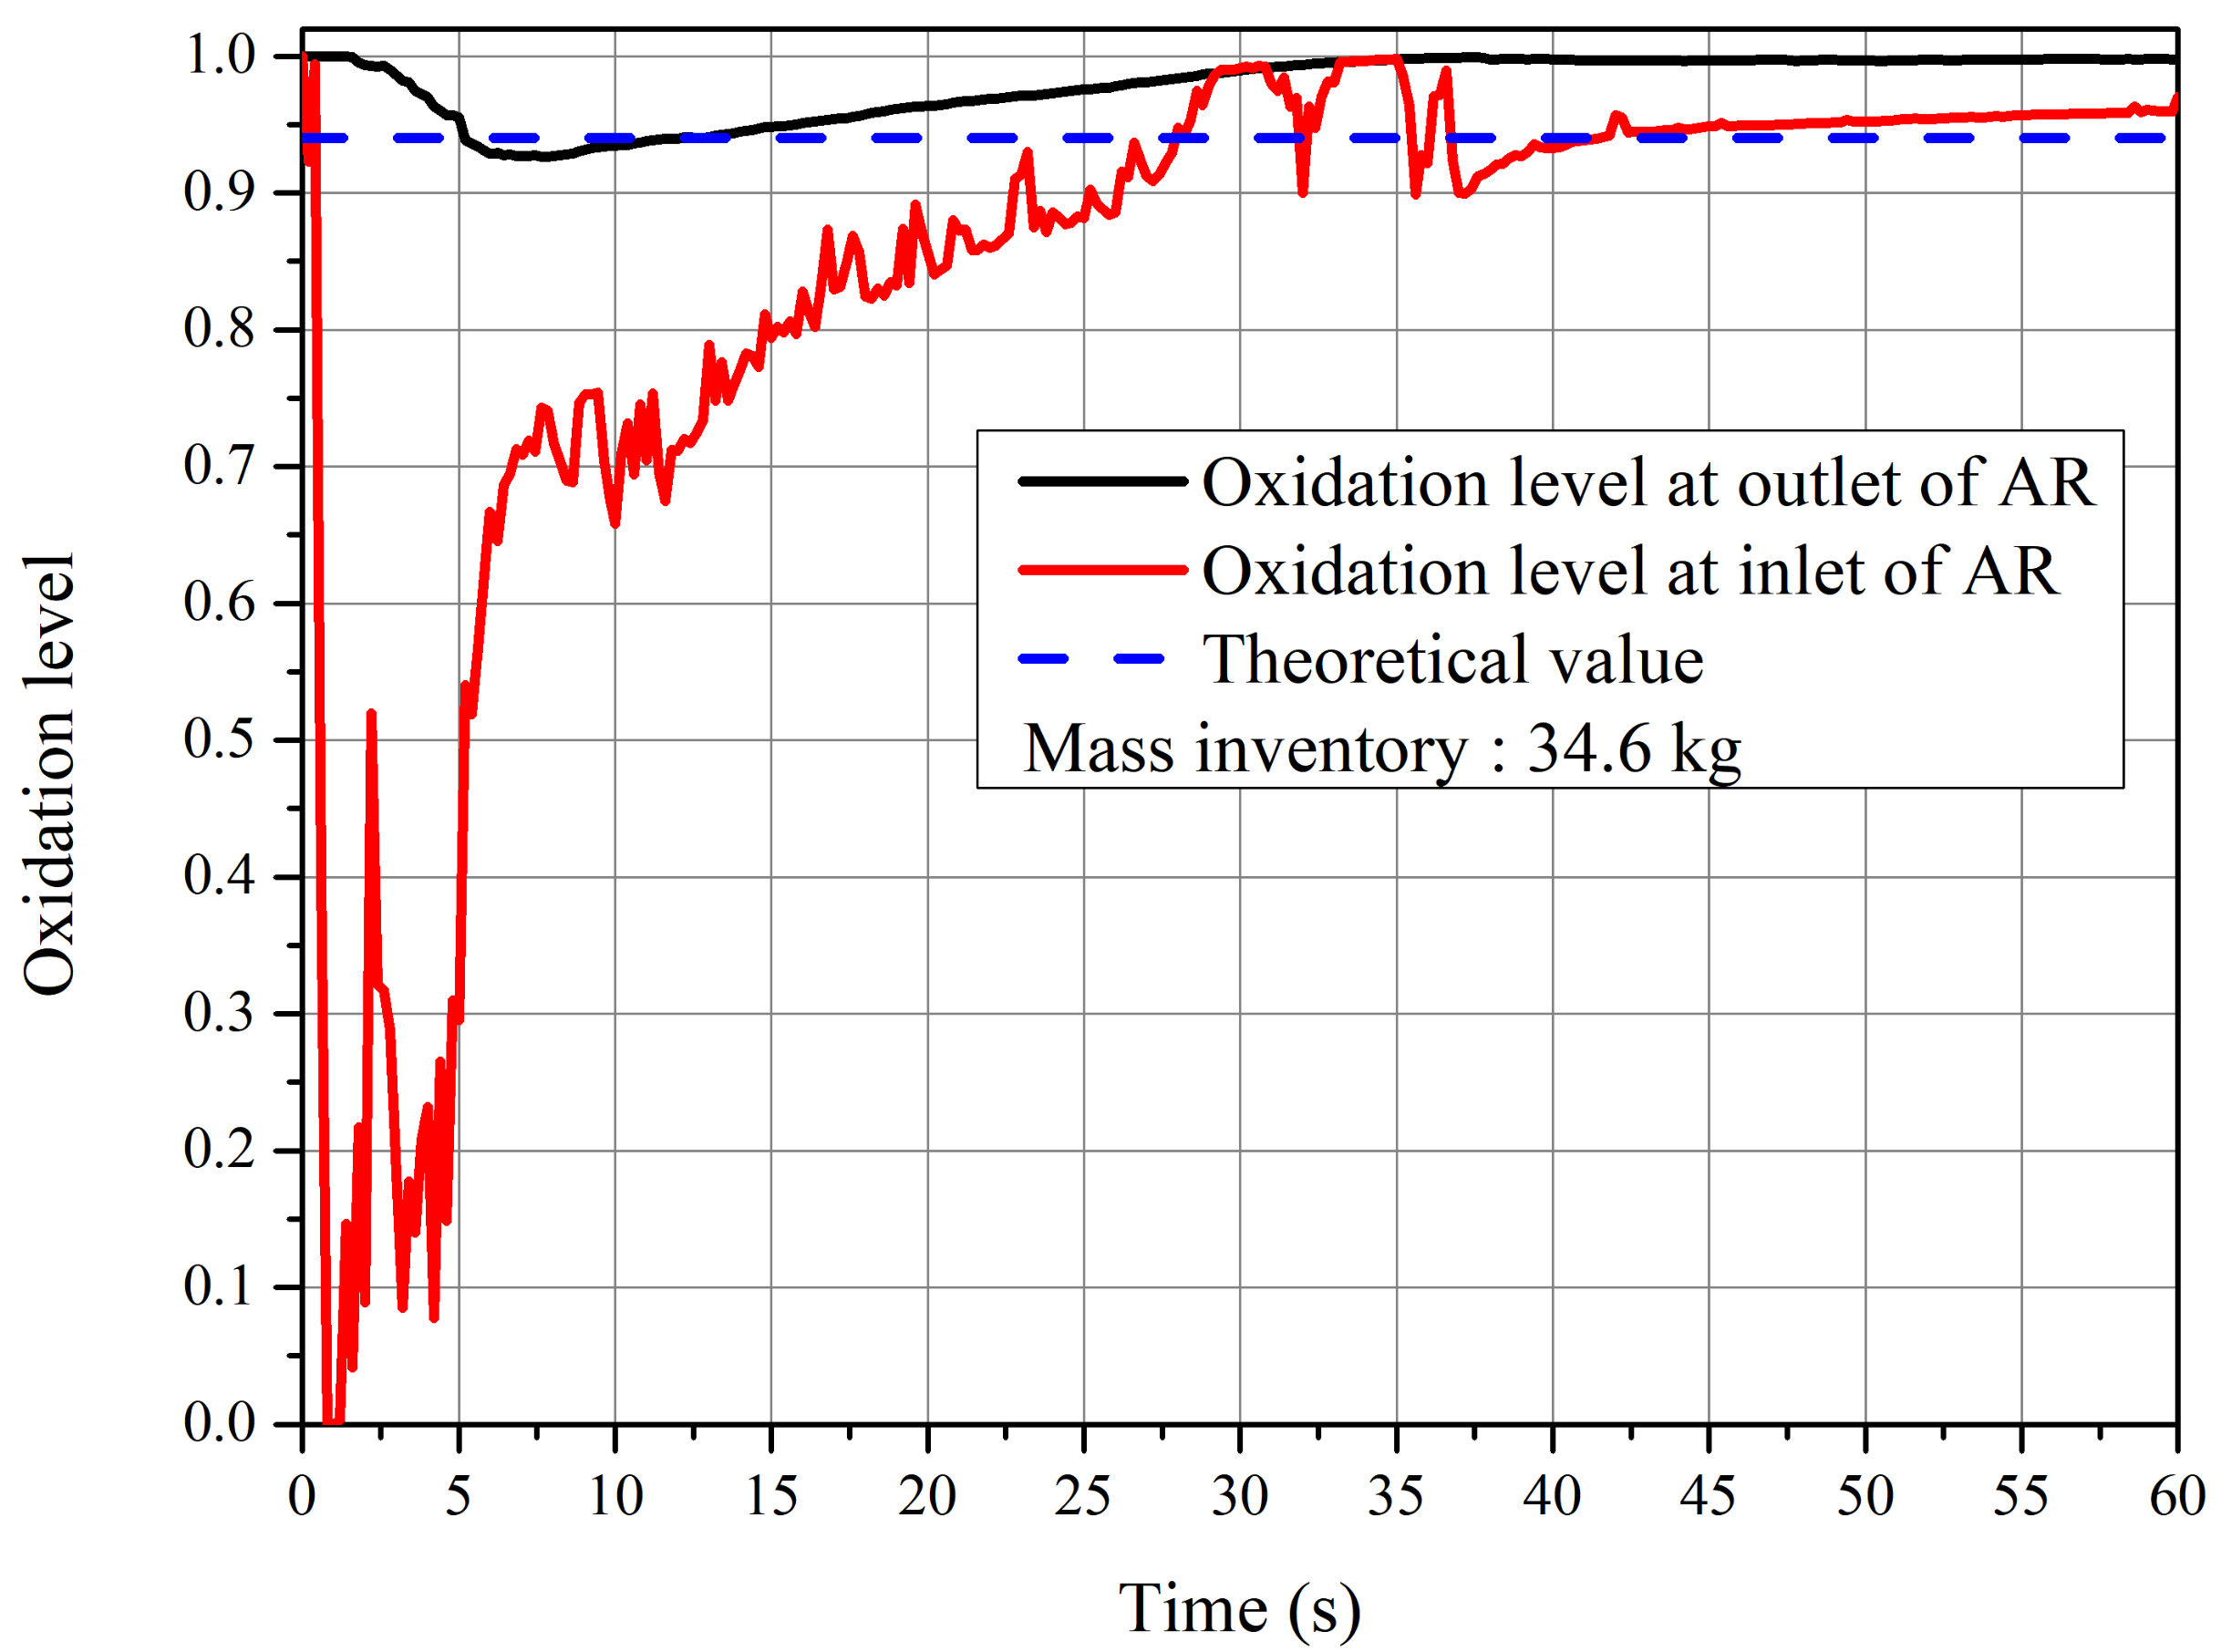
4.2. Reaction Behavior of CLC System
4.3. Influence of Fuel Inlet Rate
4.4. Influence of Operating Temperature
5. Conclusions
Author Contributions
Funding
Institutional Review Board Statement
Informed Consent Statement
Data Availability Statement
Conflicts of Interest
Appendix A

| Mass balance equation | |
| T1 | |
| T2 | |
| Momentum equation | |
| T3 | |
| T4 | |
| k- model | |
| T5 | |
| T6 | |
| Transport equation of granular temperature | |
| T7 | |
| Species transport equation | |
| T8 | |
| T9 | |
| Transport equation of enthalpy | |
| T10 | |
| T11 |
| Stress tensor | |
| C1 | |
| C2 | |
| Interphase momentum transfer coefficient | |
| C3 | |
| C4 | |
| C5 | |
| shear viscosity | |
| C6 | |
| C7 | |
| Solid pressure | |
| C8 | |
| Conductivity of fluctuating energy | |
| C9 | |
| Dissipation rate of fluctuating energy | |
| C10 | |
| Heat transfer coefficient | |
| C11 | |
| C12 | |
| C13 |
References
- Saqline, S.; Chua, Z.Y.; Liu, W. Coupling chemical looping combustion of solid fuels with advanced steam cycles for CO2 capture: A process modelling study. Energy Convers. Manag. 2021, 244, 114455. [Google Scholar] [CrossRef]
- Bui, M.; Adjiman, C.S.; Bardow, A.; Anthony, E.J.; Boston, A.; Brown, S.; Fennell, P.S.; Fuss, S.; Galindo, A.; Hackett, L.A.; et al. Carbon capture and storage (CCS): The way forward. Energy Environ. Sci. 2018, 11, 1062–1176. [Google Scholar] [CrossRef] [Green Version]
- Abad, A.; Mattisson, T.; Lyngfelt, A.; Rydén, M. Chemical-looping combustion in a 300W continuously operating reactor system using a manganese-based oxygen carrier. Fuel 2006, 85, 1174–1185. [Google Scholar] [CrossRef]
- Ishida, M.; Zheng, D.; Akehata, T. Evaluation of a chemical-looping-combustion power-generation system by graphic exergy analysis. Energy 1987, 12, 147–154. [Google Scholar] [CrossRef]
- Chein, R.Y.; Chen, W.H. Thermodynamic analysis of integrated adiabatic chemical looping combustion and supercritical CO2 cycle. Energy Convers. Manag. X 2021, 10, 100078. [Google Scholar] [CrossRef]
- Abad, A.; Mattisson, T.; Lyngfelt, A.; Johansson, M. The use of iron oxide as oxygen carrier in a chemical-looping reactor. Fuel 2007, 86, 1021–1035. [Google Scholar] [CrossRef]
- Cuadrat, A.; Abad, A.; García-Labiano, F.; Gayán, P.; de Diego, L.; Adánez, J. The use of ilmenite as oxygen-carrier in a 500 Wth Chemical-Looping Coal Combustion unit. Int. J. Greenh. Gas Control 2011, 5, 1630–1642. [Google Scholar] [CrossRef] [Green Version]
- Abdu, Y.A.; Inambao, F.L.; JHassan, A.S.; Nura, S.S.; Karthickeyan, V. Comparative study on pyrolysis and combustion behavior of untreated Matooke biomass wastes in East Africa via TGA, SEM, and EDXS. Int. J. Energy Environ. Eng. 2020, 11, 265–273. [Google Scholar]
- Leion, H.; Mattisson, T.; Lyngfelt, A. Solid fuels in chemical-looping combustion. Int. J. Greenh. Gas Control 2008, 2, 180–193. [Google Scholar] [CrossRef]
- Korus, A.; Klimanek, A.; Sładek, S.; Szlęk, A.; Tilland, A.; Bertholin, S.; Haugen, N.E.L. Kinetic parameters of petroleum coke gasification for modelling chemical-looping combustion systems. Energy 2021, 232, 120935. [Google Scholar] [CrossRef]
- Shen, L.; Wu, J.; Xiao, J.; Song, Q.; Xiao, R. Chemical-Looping Combustion of Biomass in a 10 kWth Reactor with Iron Oxide As an Oxygen Carrier. Energy Fuels 2009, 23, 2498–2505. [Google Scholar] [CrossRef]
- Moldenhauer, P.; Rydén, M.; Mattisson, T.; Jamal, A.; Lyngfelt, A. Chemical-looping combustion with heavy liquid fuels in a 10 kW pilot plant. Fuel Process. Technol. 2017, 156, 124–137. [Google Scholar] [CrossRef] [Green Version]
- Mahalatkar, K.; Kuhlman, J.; Huckaby, E.D.; O’Brien, T. CFD simulation of a chemical-looping fuel reactor utilizing solid fuel. Chem. Eng. Sci. 2011, 66, 3617–3627. [Google Scholar] [CrossRef]
- Yu, H.; Zhang, H.; Buahom, P.; Liu, J.; Xia, X.; Park, C.B. Prediction of thermal conductivity of micro/nano porous dielectric materials: Theoretical model and impact factors. Energy 2021, 233, 121140. [Google Scholar] [CrossRef]
- Wang, X.; Shao, Y.; Jin, B. Thermodynamic Evaluation and Modelling of an Auto-thermal Hybrid System of Chemical Looping Combustion and Air Separation for Power Generation Coupling with CO2 Cycles. Energy 2021, 236, 121431. [Google Scholar] [CrossRef]
- Wang, X.; Jin, B.; Zhang, Y.; Zhang, Y.; Liu, X. Three Dimensional Modeling of a Coal-Fired Chemical Looping Combustion Process in the Circulating Fluidized Bed Fuel Reactor. Energy Fuels 2013, 27, 2173–2184. [Google Scholar] [CrossRef]
- Wang, S.; Chen, J.; Lu, H.; Liu, G.; Sun, L. Multi-scale simulation of chemical looping combustion in dual circulating fluidized bed. Appl. Energy 2015, 155, 719–727. [Google Scholar] [CrossRef]
- Chen, L.; Yang, X.; Li, G.; Li, X.; Snape, C. Prediction of bubble fluidisation during chemical looping combustion using CFD simulation. Comput. Chem. Eng. 2017, 99, 82–95. [Google Scholar] [CrossRef]
- Luo, H.; Lin, W.; Song, W.; Li, S.; Dam-Johansen, K.; Wu, H. Three dimensional full-loop CFD simulation of hydrodynamics in a pilot-scale dual fluidized bed system for biomass gasification. Fuel Process. Technol. 2019, 195, 106146. [Google Scholar] [CrossRef]
- Parker, J.M. CFD model for the simulation of chemical looping combustion. Powder Technol. 2014, 265, 47–53. [Google Scholar] [CrossRef]
- Kong, D.; Zhou, M.; Wang, S.; Luo, K.; Li, D.; Fan, J. Eulerian-Lagrangian simulation of chemical looping combustion with wide particle size distributions. Chem. Eng. Sci. 2021, 245, 116849. [Google Scholar] [CrossRef]
- Lin, J.; Luo, K.; Hu, C.; Sun, L.; Fan, J. Full-loop simulation of a 1 MWth pilot-scale chemical looping combustion system. Chem. Eng. Sci. 2022, 249, 117301. [Google Scholar] [CrossRef]
- García-Labiano, F.; de Diego, L.F.; Gayán, P.; Abad, A.; Adánez, J. Fuel reactor modelling in chemical-looping combustion of coal: 2—Simulation and optimization. Chem. Eng. Sci. 2013, 87, 173–182. [Google Scholar] [CrossRef] [Green Version]
- Menon, K.G.; Patnaikuni, V.S. CFD simulation of fuel reactor for chemical looping combustion of Indian coal. Fuel 2017, 203, 90–101. [Google Scholar] [CrossRef]
- Shuai, W.; Yunchao, Y.; Huilin, L.; Jiaxing, W.; Pengfei, X.; Guodong, L. Hydrodynamic simulation of fuel-reactor in chemical looping combustion process. Chem. Eng. Res. Des. 2011, 89, 1501–1510. [Google Scholar] [CrossRef]
- May, J.; Alobaid, F.; Ohlemüller, P.; Stroh, A.; Ströhle, J.; Epple, B. Reactive two–fluid model for chemical–looping combustion—Simulation of fuel and air reactors. Int. J. Greenh. Gas Control 2018, 76, 175–192. [Google Scholar] [CrossRef]
- Li, S.; Shen, Y. CFD study of nonuniformity of gas-solid flow through a chemical looping combustion system with symmetrical series loops. Powder Technol. 2021, 387, 108–124. [Google Scholar] [CrossRef]
- Kong, D.; Wang, S.; Luo, K.; Hu, C.; Li, D.; Fan, J. Three-dimensional simulation of biomass gasification in a full-loop pilot-scale dual fluidized bed with complex geometric structure. Renew. Energy 2020, 157, 466–481. [Google Scholar] [CrossRef]
- Lin, J.; Sun, L.; Luo, K.; Kong, D.; Fan, J. Three-dimensional simulation of a gas-fueled chemical looping combustion system with dual circulating fluidized bed reactors. Energy 2022, 246, 123293. [Google Scholar] [CrossRef]
- Abad, A.; Adánez, J.; Cuadrat, A.; García-Labiano, F.; Gayán, P.; de Diego, L.F. Kinetics of redox reactions of ilmenite for chemical-looping combustion. Chem. Eng. Sci. 2011, 66, 689–702. [Google Scholar] [CrossRef] [Green Version]
- Donskoi, E.; Mcelwain, S.; Wibberley, L. Estimation and modeling of parameters for direct reduction in iron ore/coal composites: Part II. Kinetic parameters. Metall. Mater. Trans. B 2003, 34, 255–266. [Google Scholar] [CrossRef]
- Gerber, S.; Behrendt, F.; Oevermann, M. An Eulerian modeling approach of wood gasification in a bubbling fluidized bed reactor using char as bed material. Fuel 2010, 89, 2903–2917. [Google Scholar] [CrossRef]
- Johansson, E.; Lyngfelt, A.; Mattisson, T.; Johnsson, F. Gas leakage measurements in a cold model of an interconnected fluidized bed for chemical-looping combustion. Powder Technol. 2003, 134, 210–217. [Google Scholar] [CrossRef]
- Guan, Y.; Chang, J.; Zhang, K.; Wang, B.; Sun, Q. Three-dimensional CFD simulation of hydrodynamics in an interconnected fluidized bed for chemical looping combustion. Powder Technol. 2014, 268, 316–328. [Google Scholar] [CrossRef]
- Kong, D.; Wang, S.; Zhou, M.; Luo, K.; Hu, C.; Li, D.; Fan, J. Three-dimensional full-loop numerical simulation of co-combustion of coal and refuse derived fuel in a pilot-scale circulating fluidized bed boiler. Chem. Eng. Sci. 2020, 220, 115612. [Google Scholar] [CrossRef]
- Ohlemüller, P.; Reitz, M.; Ströhle, J.; Epple, B. Investigation of chemical looping combustion of natural gas at 1 MWth scale. Proc. Combust. Inst. 2019, 37, 4353–4360. [Google Scholar] [CrossRef]
- Zhang, H.; Liu, X.; Hong, H.; Jin, H. Characteristics of a 10 kW honeycomb reactor for natural gas fueled chemical-looping combustion. Appl. Energy 2018, 213, 285–292. [Google Scholar] [CrossRef]
- Pérez-Vega, R.; Abad, A.; García-Labiano, F.; Gayán, P.; de Diego, L.F.; Adánez, J. Coal combustion in a 50 kWth Chemical Looping Combustion unit: Seeking operating conditions to maximize CO2 capture and combustion efficiency. Int. J. Greenh. Gas Control 2016, 50, 80–92. [Google Scholar] [CrossRef]
- Li, Y.; Luo, C.; Su, Q. Cold start-up study of methanol reformer based on chemical-looping combustion. Fuel 2022, 317, 122850. [Google Scholar] [CrossRef]


| (mol m ) | (molms) | (kJ mol) | n | ||
|---|---|---|---|---|---|
| 13,590 | 5.78 | 9.8 | 1 |
Publisher’s Note: MDPI stays neutral with regard to jurisdictional claims in published maps and institutional affiliations. |
© 2022 by the authors. Licensee MDPI, Basel, Switzerland. This article is an open access article distributed under the terms and conditions of the Creative Commons Attribution (CC BY) license (https://creativecommons.org/licenses/by/4.0/).
Share and Cite
Sun, L.; Lin, J.; Kong, D.; Luo, K.; Fan, J. Numerical Simulation of a 10 kW Gas-Fueled Chemical Looping Combustion Unit. Energies 2022, 15, 1973. https://doi.org/10.3390/en15061973
Sun L, Lin J, Kong D, Luo K, Fan J. Numerical Simulation of a 10 kW Gas-Fueled Chemical Looping Combustion Unit. Energies. 2022; 15(6):1973. https://doi.org/10.3390/en15061973
Chicago/Turabian StyleSun, Liyan, Junjie Lin, Dali Kong, Kun Luo, and Jianren Fan. 2022. "Numerical Simulation of a 10 kW Gas-Fueled Chemical Looping Combustion Unit" Energies 15, no. 6: 1973. https://doi.org/10.3390/en15061973
APA StyleSun, L., Lin, J., Kong, D., Luo, K., & Fan, J. (2022). Numerical Simulation of a 10 kW Gas-Fueled Chemical Looping Combustion Unit. Energies, 15(6), 1973. https://doi.org/10.3390/en15061973