1. Introduction
Wind energy is still one of the main contributors to the global transition to renewable energies. With a wind energy installation of approximately 93 GW in 2020, wind energy represents around 6% of the global power mix [
1]. To achieve the objective of remaining below a 2 °C global temperature increase, the percentage of wind energy should be increased to over 30% by 2050 [
1]. This requires an increase in the annually wind energy installation and ideally cheaper and more efficient wind turbines. This has been classically achieved through higher wind turbines with larger rotors.
In the last few years, the number of studies about the aerodynamic damping of wind turbines has increased. These studies mainly focus on the aerodynamic damping of the wind turbine rotor oscillating in wind direction due to the first bending mode shape of the wind turbine tower, which can reach damping rations between 5% and 15% depending on rotor dimension and other parameters [
2,
3,
4,
5]. Several studies have presented techniques to identify the aerodynamic damping from monitoring data of full-scale turbines [
6,
7,
8,
9], and other studies present semi-analytical expressions after the consideration of certain assumptions [
3,
10,
11,
12]. While the aerodynamic damping of the rotor is already considered in state-of-the art aeroelastic software for wind turbines [
3,
4,
11], the mentioned studies aim at its determination from real wind turbines or to its characterization and identification of its most relevant parameters.
Less attention has been paid to the aerodynamic damping of the support structure, classically a tube steel tower with a circular cross-section. The main reason for this is the relatively small value of the tower’s aerodynamic damping in comparison to the rotor’s. For instance, measurements by Devriendt [
13] on a parked offshore Vestas Wind turbine V90 with 3 MW rated power showed a total damping ratio in the fore-aft and side-to-side directions of around 1.9% and 2.5%, respectively, the side-to-side damping being higher due to the parked blades having a pitch angle close to 90
. Koukoura [
14] determined a mean standstill damping ratio of 1.93% for an offshore Siemens 3.6 MW wind turbine, and Damgaard [
15] found a cross-wind total damping ratio of approximately 2.4%. Rezaei [
16] mentions good agreement in the literature for parked conditions, the fore-aft and side-to-side aerodynamic damping being 1% and 1.5% of critical, respectively. In the BBTI-Project [
17], the along-wind aerodynamic damping of towers was determined through wind tunnel experiments without consideration of Reynolds number effects, and its impact in the wind turbine dynamics was studied by Werkmeister [
18] through Multi-Body Simulations, obtaining around 10% lower damage-equivalent base moments in the simulations where the along-wind aerodynamic damping was modeled. A summary of other study cases can be found in [
19].
Larger turbine dimensions and soft-soft designs may increase the relevance of the tower aerodynamic damping in the system overall dynamics. As shown by Rezaei [
16], a damping ratio increase of around 0.5% can already lead to a turbine lifetime extension of around 2.5 years. In this context, the consideration of the tower’s aerodynamic damping may play a more significant role than it has in the past.
This paper aims at determining the along-wind aerodynamic damping of wind turbine towers through wind tunnel measurements under the consideration of Reynolds number effects and quantifying its impact on the wind turbine’s lifetime. To ensure the necessary level of aerodynamic scaling quality, a thorough study of flow similarity for circular cross-sections has been carried out. In particular, methods to reduce the Reynolds number effects on the wind tunnel are studied in
Section 2, which leads to the choice of models and surface roughness for the aerodynamic damping measurements. The presented relation between critical Reynolds number
and different surface roughness conditions provides guidance for future experimental investigations, as well. In
Section 3, the used aerodynamic damping approaches are presented, as well as the results of the wind tunnel measurements. Conceptually, the theoretical approaches from Steckley [
20] and Holmes [
21] are considered in this study. Both differ with respect to their assumption of generalizing the acting aerodynamic damping forces but have not been compared in previous research. The presented comparison with each other and with experimental data enables a more realistic wind turbine modeling.
Finally, in
Section 4, the obtained results are applied in aeroelastic multi-body simulations of a 6 MW reference wind turbine to study their impact on the wind turbine’s lifetime.
2. Aerodynamic Drag of Wind Turbine Tower Models in Wind Tunnel Experiments: Effects of Surface Roughness and Turbulence Modification
When performing small-scale wind tunnel experiments, similarity rules must be considered in order to faithfully represent the studied aerodynamic phenomena. In the case of wind turbine towers with circular cross-sections, the flow characteristics are highly dependent on the Reynolds number [
22,
23], which depends on the fluid viscosity
, the undisturbed flow speed
v and a characteristic cross-section length
D:
Wind tunnel models are typically hundreds of times smaller than their full-scale counterpart, which makes compensating the diameter reduction with a wind speed increase impracticable. As a result, the Reynolds number in wind tunnel tests does not match that in the full-scale prototype. However, the resulting scale-effects can be reduced to some extent by an increase in the model’s surface roughness [
24,
25,
26,
27,
28,
29] or through the modification of the experiment flow, either increasing flow turbulence [
30] or using pressurized wind tunnels [
31]. Many of these studies are summarized elsewhere [
32,
33,
34,
35,
36].
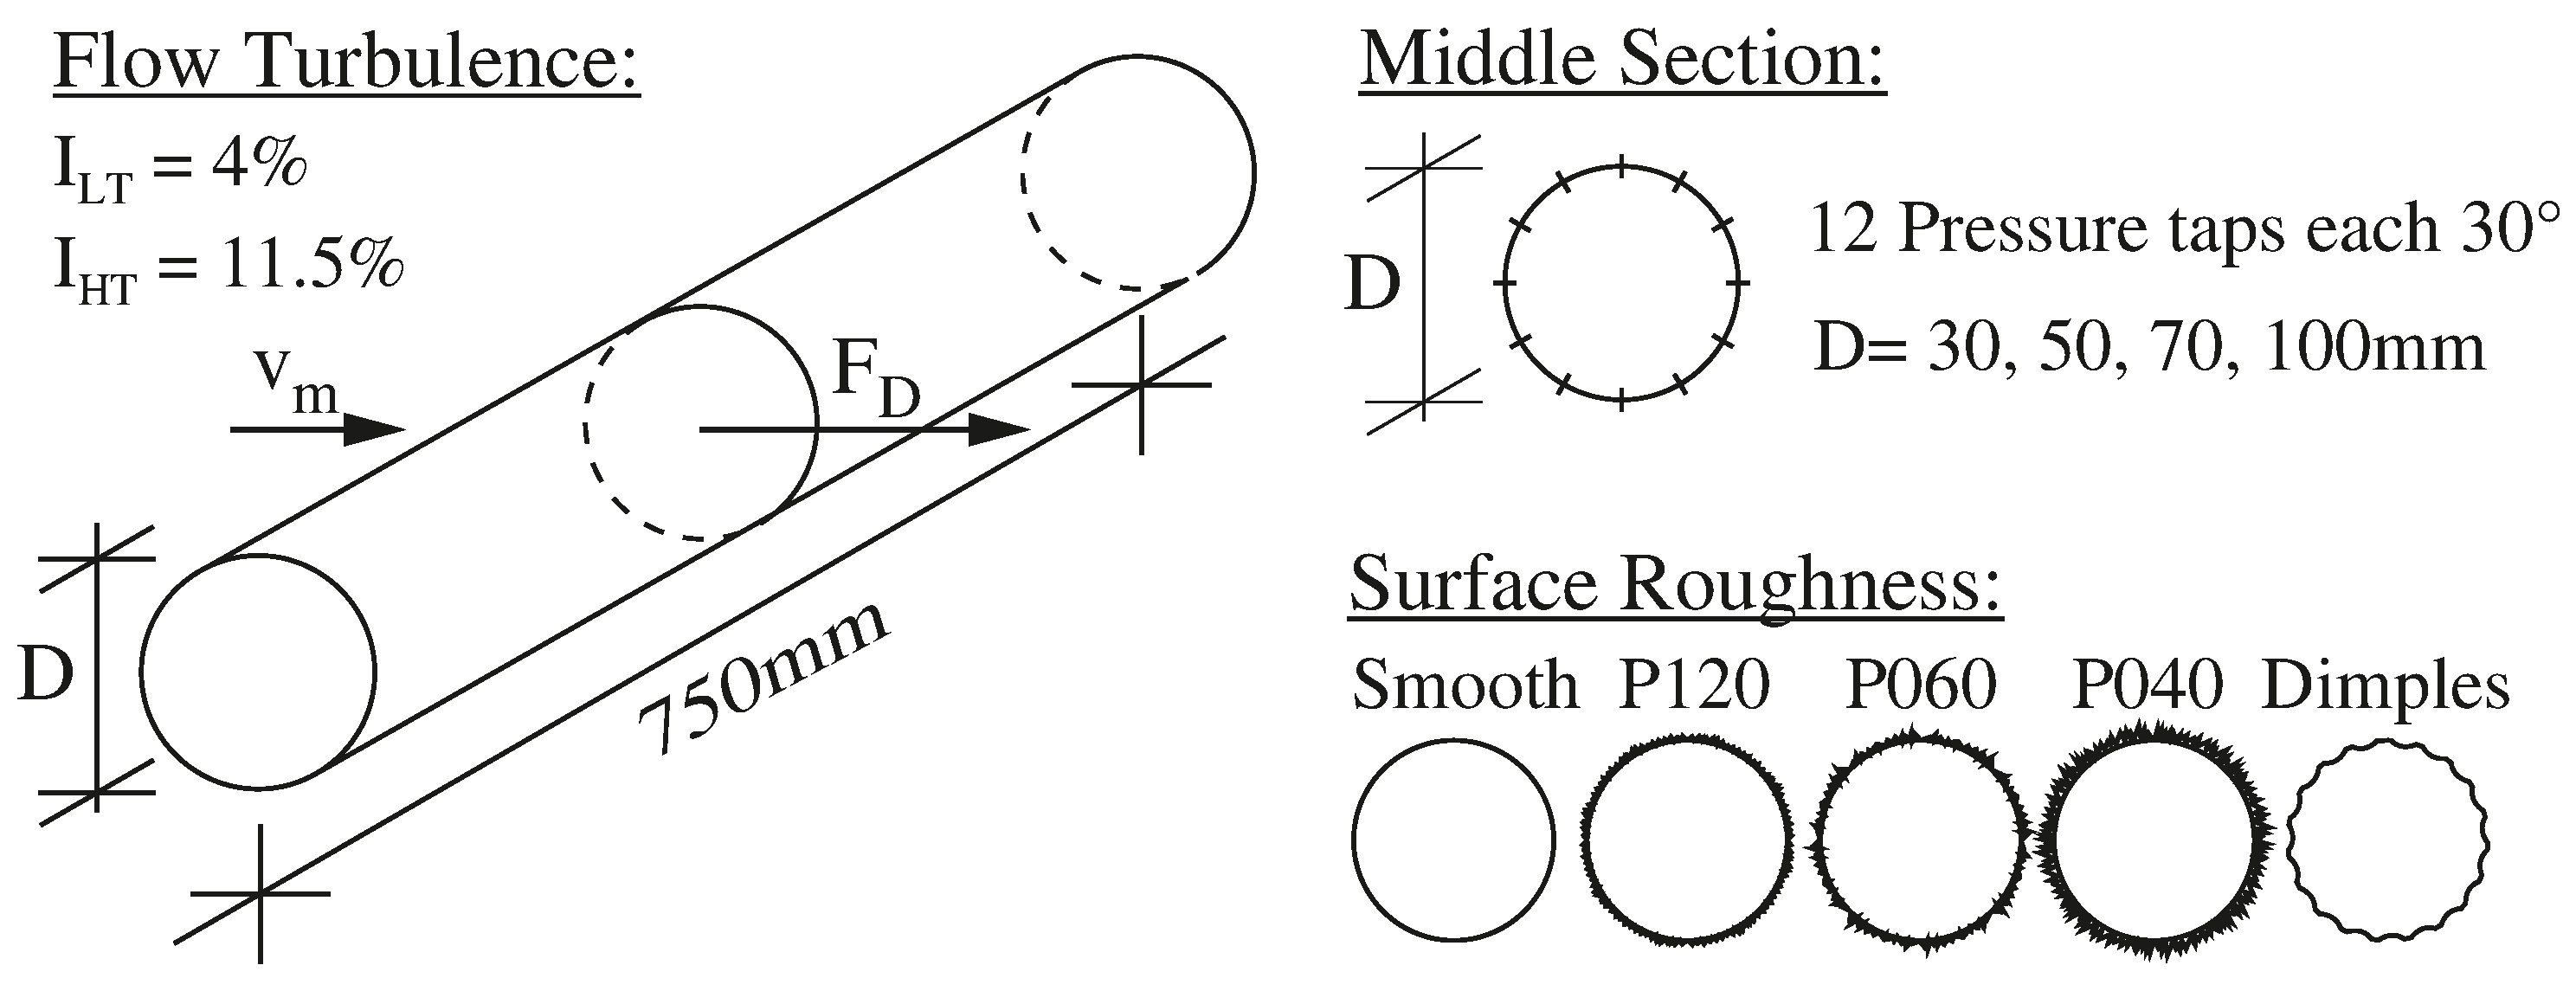
In this study, both surface roughness and flow modification were used to mitigate scale-effects. To this end, cylinder models with circular cross-sections were placed in the wind tunnel horizontally with end plates to reduce tip effects. The diameters of the cylinders were between 30 mm and 100 mm and the lengths around 750 mm. The surface roughness was achieved through sandpapers P040, P060 and P120 (according to FEPA P notation) and a milled dimpled pattern.
The dimpled pattern is roughly based on the patterns shown by Bearman [
26] and Hojo [
28] and is described in detail for its potential use in Reynolds scale effects reduction in wind tunnel measurements. The dimpled pattern was defined through milling dimple spheres of diameter
equal to one-eighth of the model diameter, a depth of 0.025 times the corresponding model diameter, which results in a dimple width
equal to
of the model diameter. The deepest points of the dimples were separated from each other by a distance
equal to the dimple sphere diameter
. The dimple pattern geometry is presented schematically in
Figure 1.
The wind tunnel measurements were performed at wind speeds up to 25 to 30 m/s under low-turbulence (turbulence intensity
, noted as
LT) and turbulent (turbulence intensity
, noted as
HT) flow conditions. Support forces were measured at both model extremes, and 12 pressure taps were located chord-wise at the center of the model to measure the pressure distribution at the cross-section (for more details see [
37]). Because the experiments occur under laboratory conditions, the main uncertainty source is attributed to the precision of the sensors, which is documented in the manufacturer data sheets. Applying these to the average measurement values, precision values of around ±2.5% for the measured wind speed (5.1% for pressure values) and ±4% for the measured forces and ±2.5% for the pressure sensors are estimated, which results in maximum errors of around ±9.5% (multiplication of wind speed error squared and force error) in force measurements and ±7.5% in pressure measurements (multiplication of wind speed error squared and pressure error). The measurements had a duration of 30 s each, which ensured a convergence of the average value within 0.1% of the end value. A schematic representation of the measurements is shown in
Figure 2, while the measured models are summarized in
Table 1.
For the determination of the drag coefficient, the following equation was used:
where
is the average aerodynamic force projected in wind direction,
is the air density,
is the average wind speed,
D is the model diameter and
L is the model length, which in all cases was 750 mm. Because the relative surface
is not considered explicitly in the drag coefficient equation, each drag coefficient curve must be given with its correspondent equivalent roughness
k or relative roughness
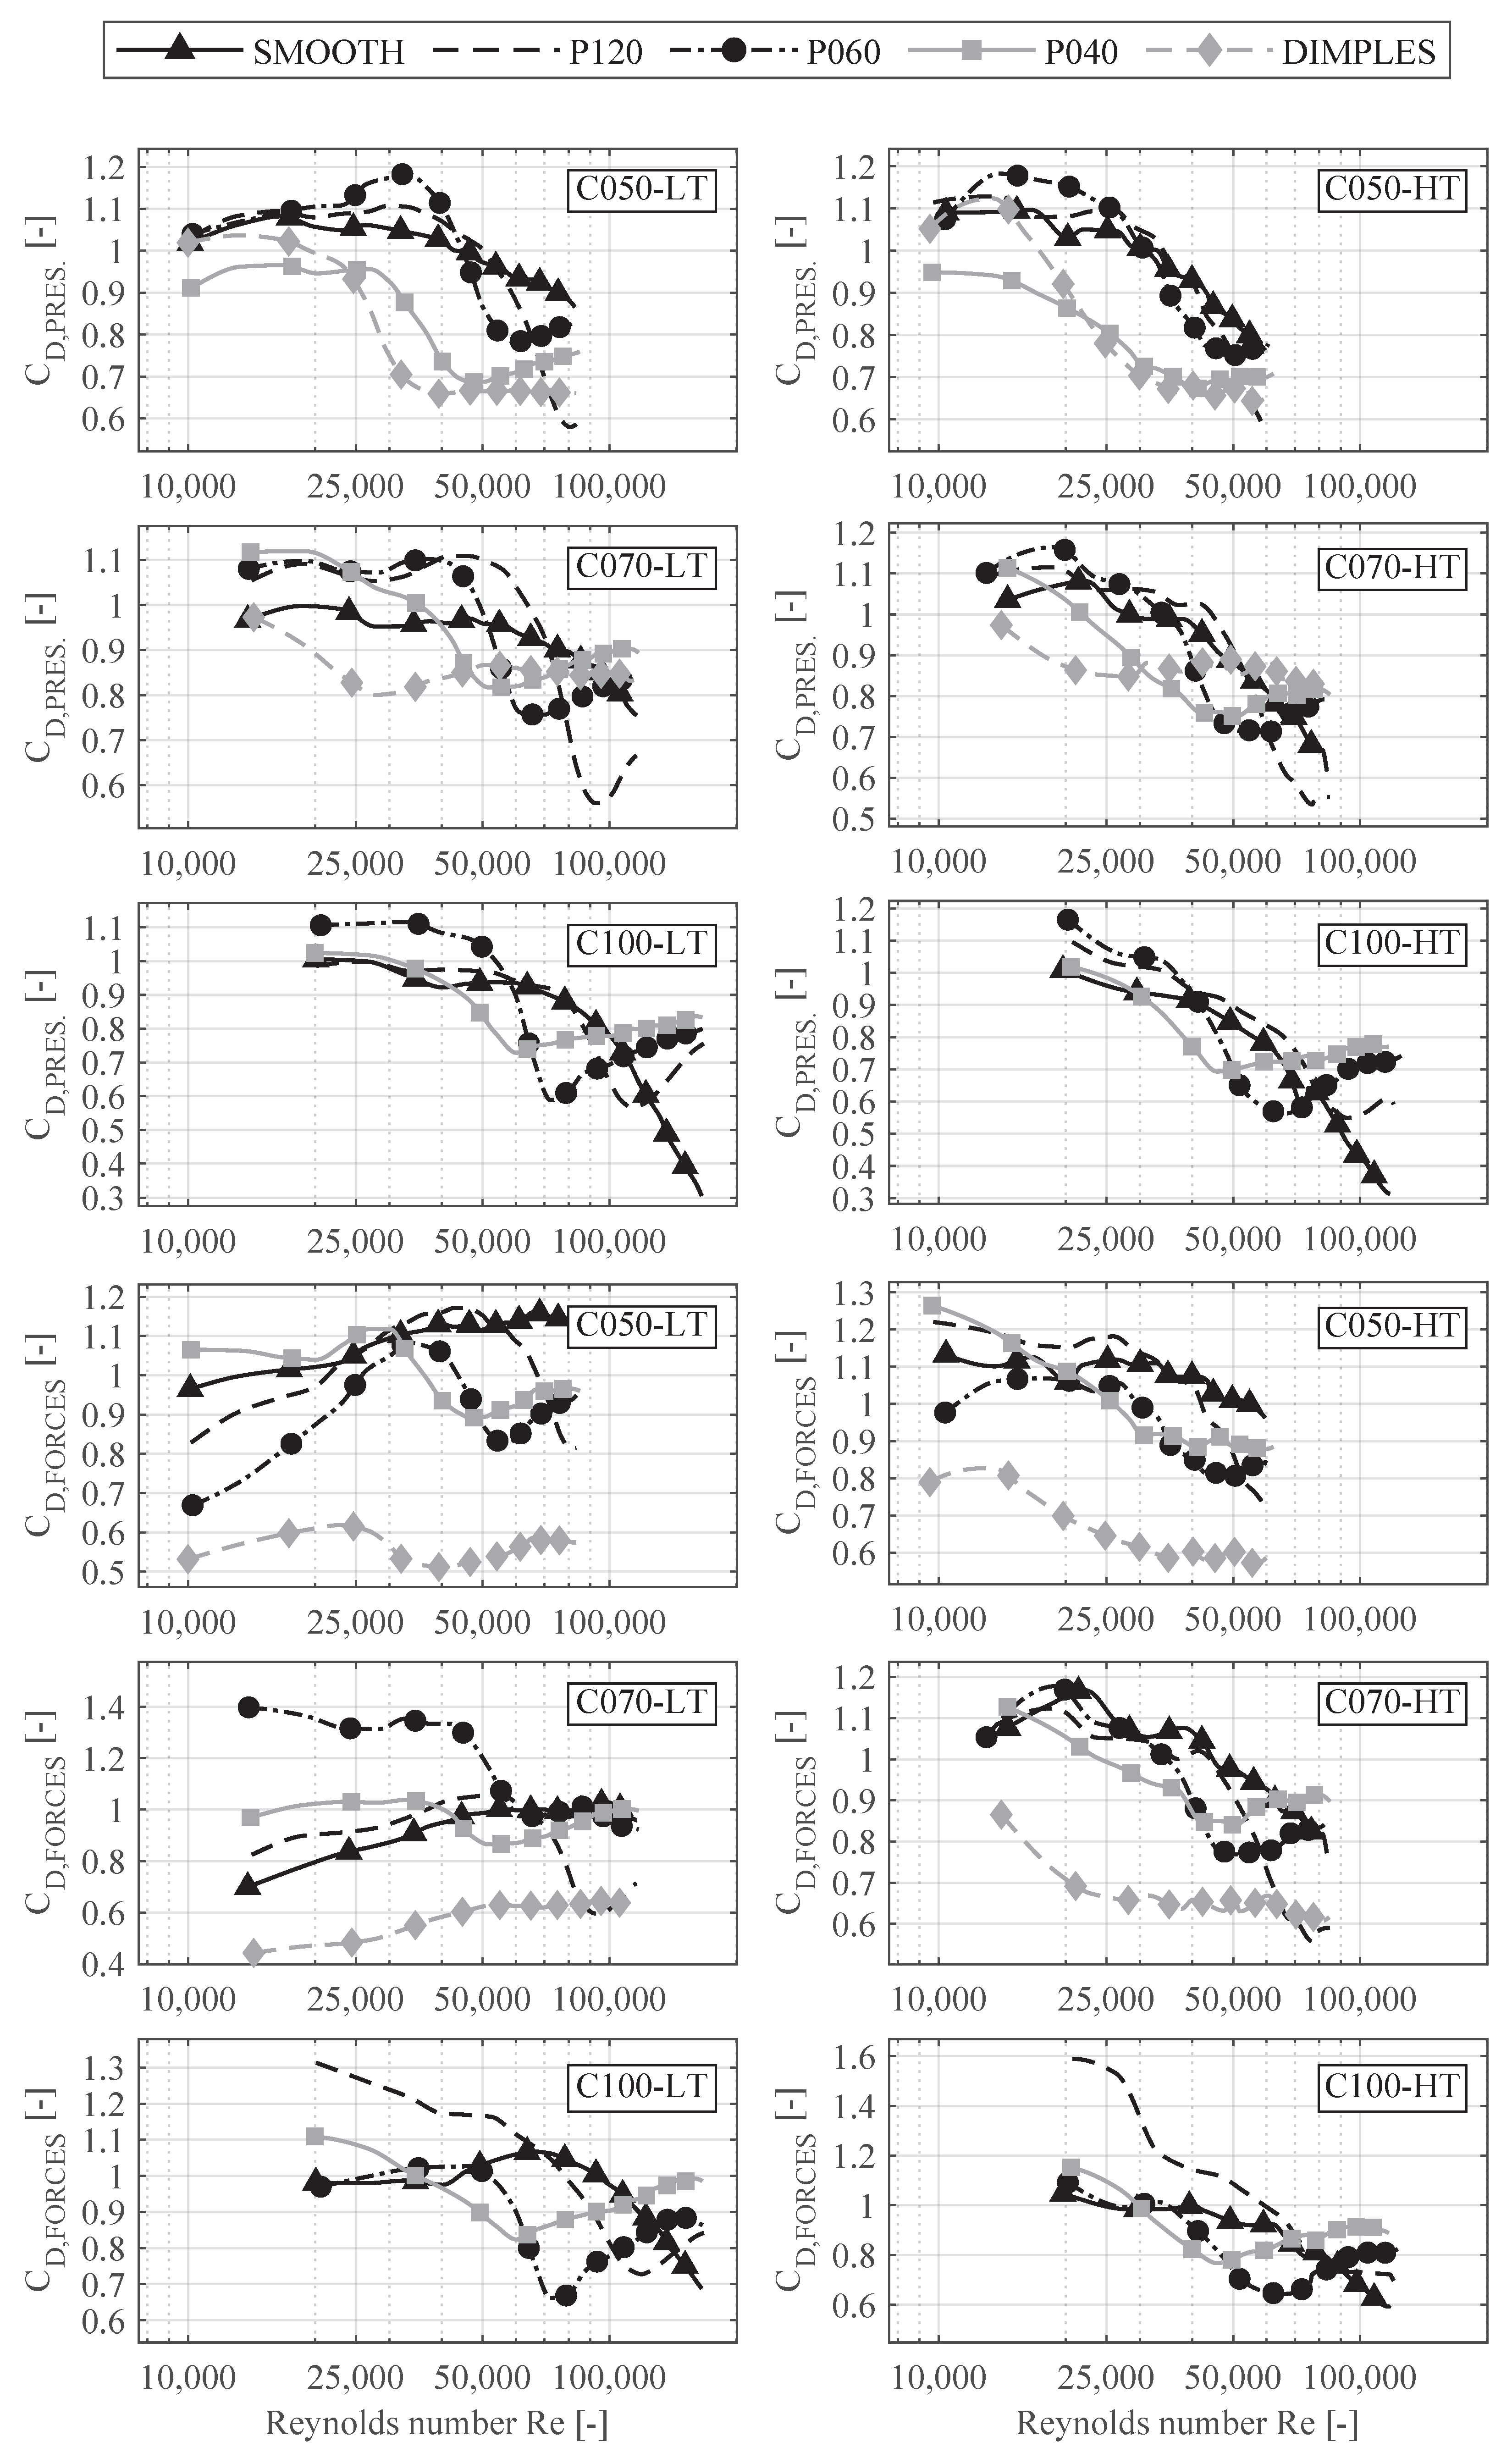
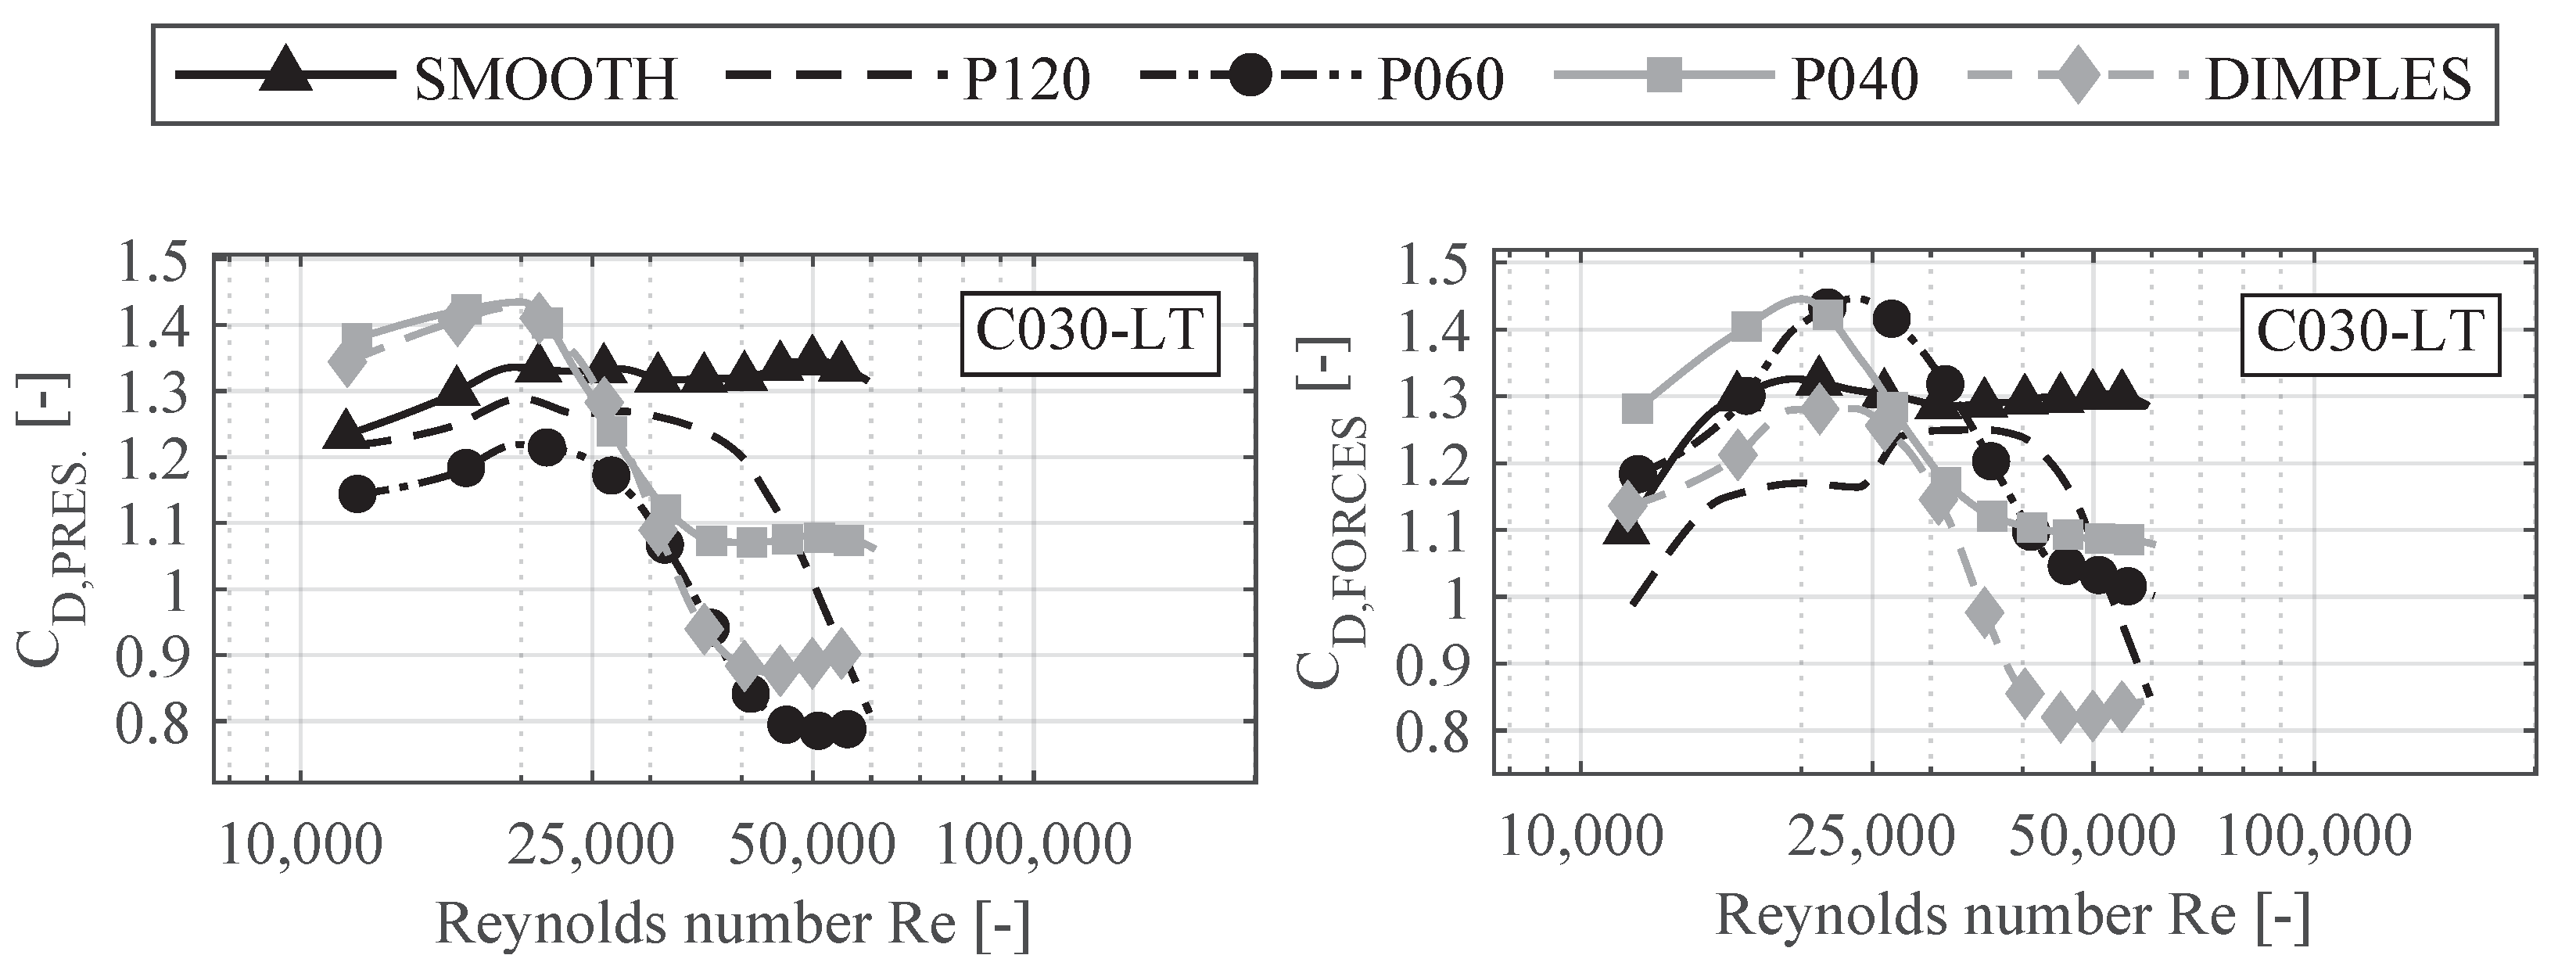
. The measurement results vary depending on flow turbulence and measuring method, i.e., depending on whether the drag coefficients were determined through cross-section pressures or support reaction forces. In general, the results agree with some trends observed in the literature [
25,
36]. Consequently, larger surface roughness results in an increase in the drag coefficient in all flow regimes and in a reduction in the critical Reynolds number
, which is described as the Reynolds number corresponding to the minimum drag coefficient. The expected effect of turbulence varies in the literature. In this study, the effect of higher flow turbulence can be summarized through an anticipation of the critical transcritical flow regime but no alteration of the drag coefficient magnitude. The obtained drag coefficient curves are shown in
Figure 3 and
Figure 4.
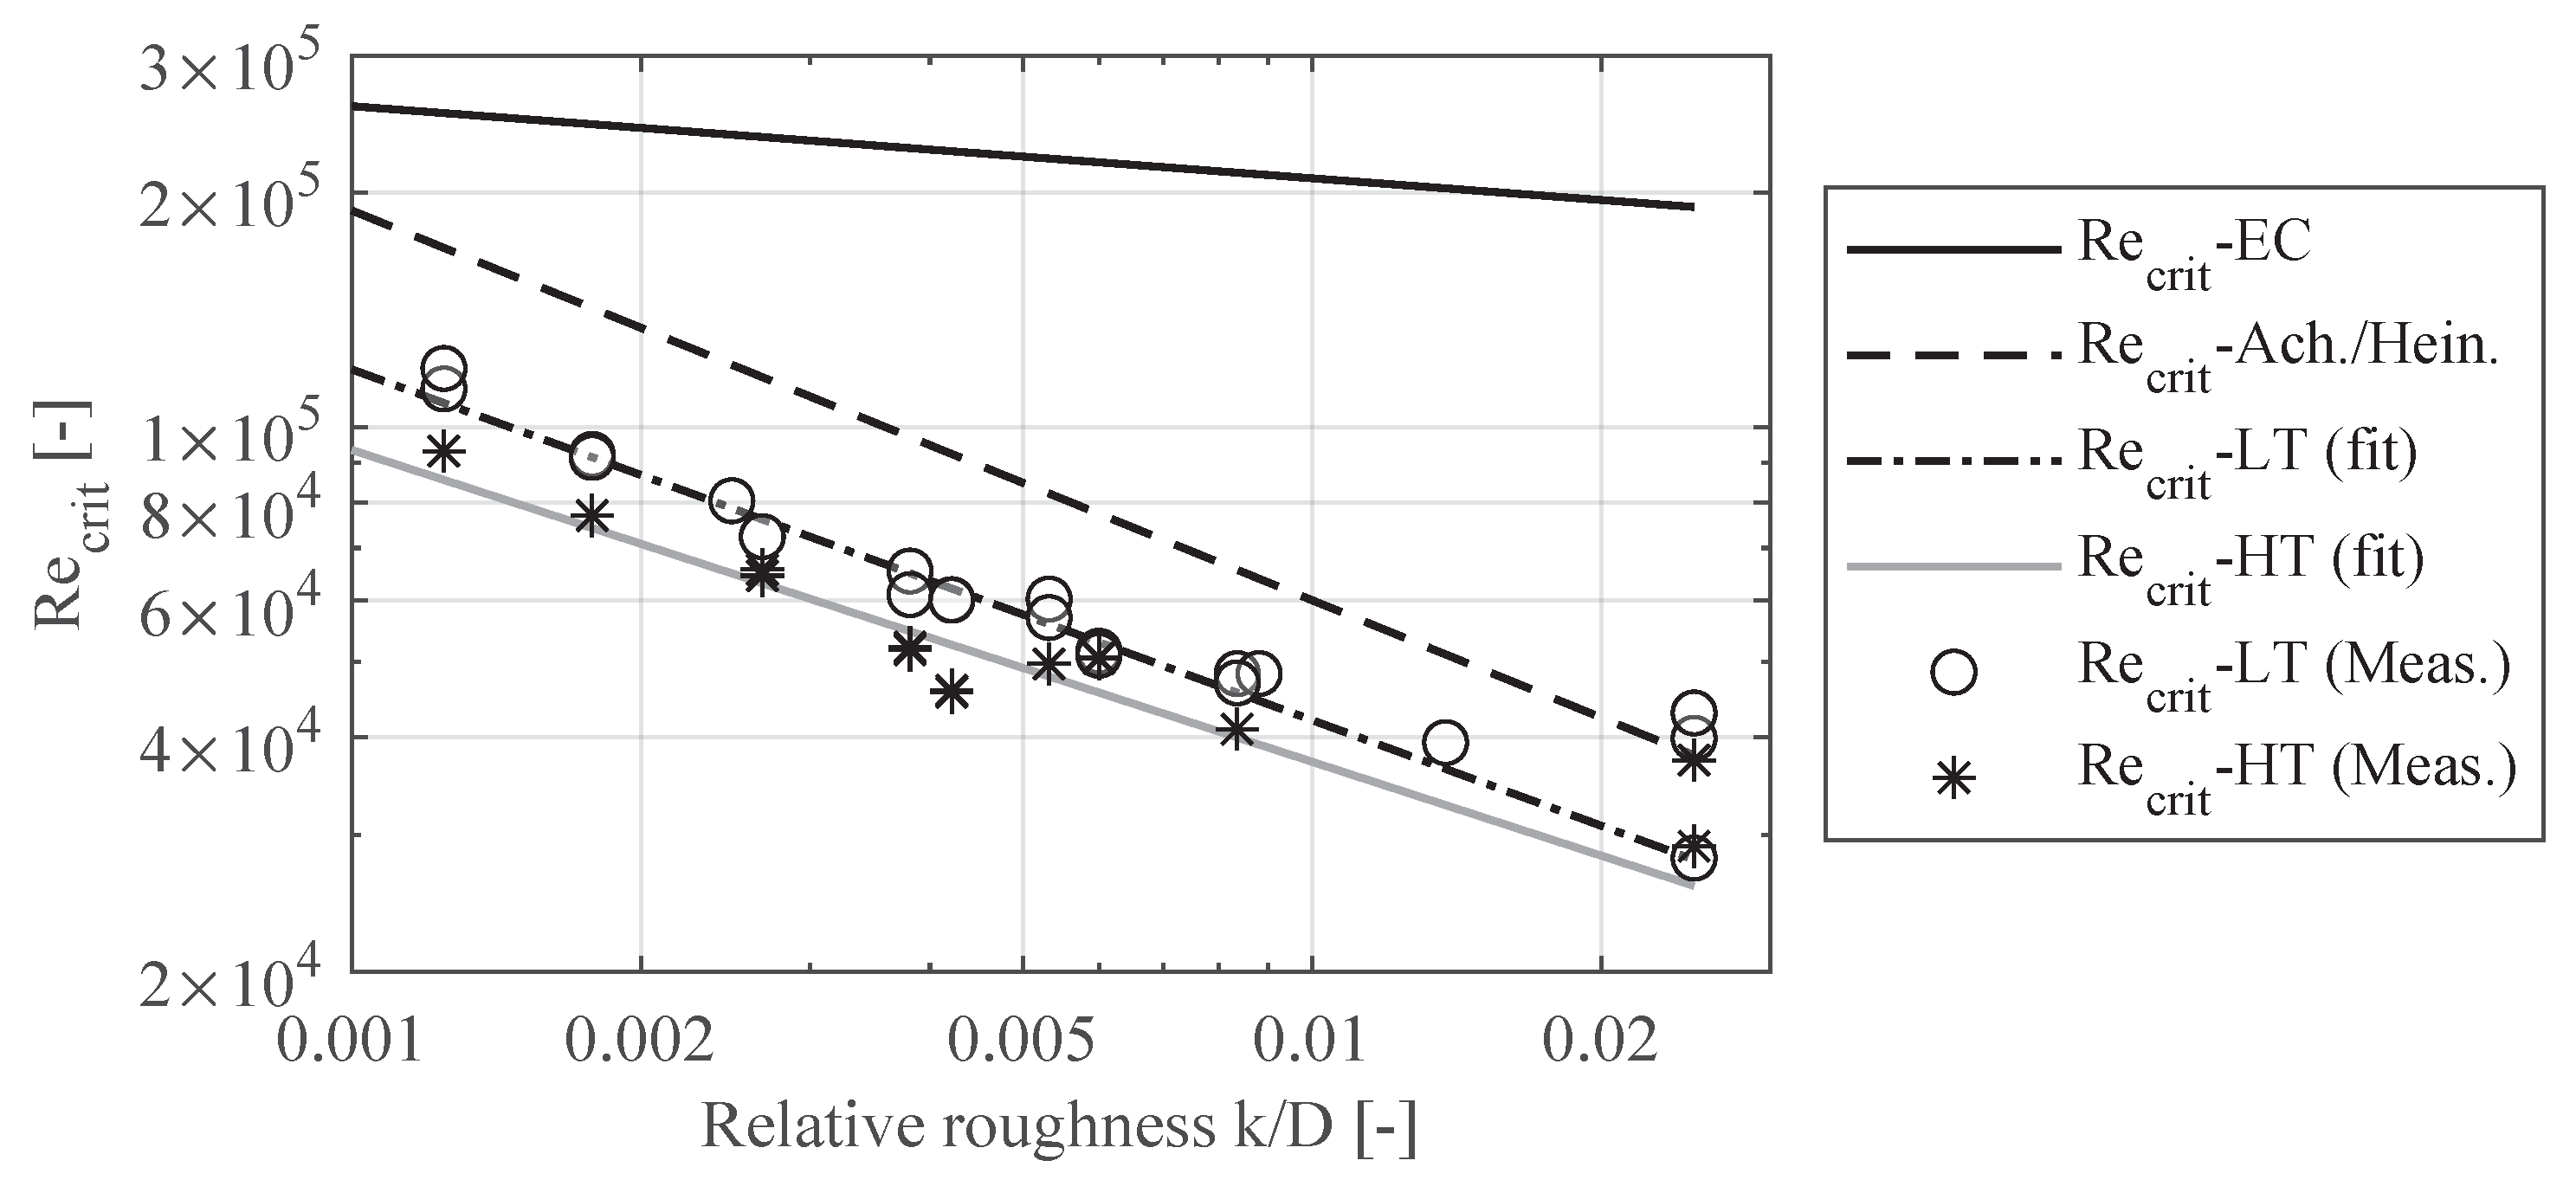
The value of
is specially important to determine the possibility of performing wind tunnel tests in the trans-critical flow regime, which is the flow regime found in full-scale wind turbine towers. To this end, the critical Reynolds number
in all measurements was related to the relative roughness
for both analysis methods (cross-section pressures and model support reactions). The results were averaged due to their similarity and are thus expressed only as a function of flow turbulence. The curves for
as a function of the relative roughness
for low- and high-turbulence conditions and the values from which they are derived are compared to equivalent curves given in Figure 7.28 of the Eurocode 1 [
38] and by Achenbach and Heinecke [
25]. Both Eurocode and Achenbach assume laminar flow conditions. Achenbach uses a turbulence intensity of
. All curves are shown in
Figure 5.
The lines in
Figure 5 can be expressed using an equation of the form given in ([
25,
36]) as follows:
The coefficients of the curves determined in this study and their counterparts in the literature are given in
Table 2.
The measured results agree with the literature. While the Eurocode shows very conservative values (a large
implies a larger wind speed range with higher drag coefficients), Achenbach [
25] obtained larger
values, probably due to the lower turbulence intensity in his experiments. As a result,
Figure 5 quantifies how surface roughness and turbulence intensity reduce
, reducing the necessary wind speeds to achieve trans-critical flow regimes.
3. Aerodynamic Damping of Wind Turbine Towers with Circular Sections
The determination of the aerodynamic damping of wind turbine towers through wind tunnel tests is based on the works of Steckley, Tschanz and Davenport [
20,
39,
40]. The High-Frequency Force Balance (HFFB) approach [
40] is extended to include force oscillation measurements [
20] and thus to determine the aerodynamic damping of slender tall structures (towers, chimneys, buildings) oscillating in the first natural bending mode. The HFFB approach consists of the use highly stiff and light models with the same shape as the studied prototype structure to define its aerodynamic admittance through a high-sensitivity balance sensor at the base of the model. In the case of structures with a first modal form similar to a linear equation of the form
, with
H being the total structure height, the modal force spectrum equals the wind force spectrum weighted with the structure height, i.e., the moment measured at the model base corresponds to the modal wind force spectrum. The structural dynamics are added analytically after the measurements using random vibration theory [
20]. A more detailed explanation and a benchmark case can be found in the literature [
39,
40,
41]. Because the HFFB method cannot reproduce motion-induced oscillations, the approach was further developed by Steckley [
20] to include forced oscillation measurements, which can be used to determine aeroelastic phenomena. In this case, the model is forced to pivot around an axis at the model’s base, simulating the first, approximately linear, modal shape of the structure. According to Steckley’s approach, the linearized wind base moment
is composed by a random moment component due to turbulence and unsteady wake effects with dimensionless instantaneous coefficient
, and a motion-induced moment component. The wind base moment on a structure with circular cross-section [
37] can then be expressed as follows:
where
q is the dynamic pressure,
D is the structure’s diameter or width,
H the structure’s height,
is the angular frequency of the first modal form,
is the air density,
and
are the aerodynamic stiffness and damping coefficients, respectively, and
y and
are the structure’s top oscillation amplitude and velocity, respectively. In wind tunnel measurements, the model is forced to oscillate in a sinusoidal manner with constant oscillation amplitude
. As a result, Equation (
4) becomes:
Equation (
5) can be used in forced oscillation tests to find the aerodynamic damping and aerodynamic stiffness. First, measurements without wind are performed to determine the mechanical damping and inertial forces of the model and test bench. Afterwards, the measurements are repeated with wind acting on the model. The aerodynamic damping is obtained by subtracting the the measurements with wind to those without wind. The measured inertial and damping aerodynamic forces are identified using the cross power spectral density between measured accelerations and base moments. The measured aerodynamic damping and stiffness base moments are then normalized according to the measurement conditions, and the factors
and
are determined. A more detailed explanation of this analysis is found elsewhere [
20,
42,
43]. The application of Steckley’s approach is performed under the assumption that blade passing and tower tip effects due to the turbine components do not affect the general action of the aerodynamic damping.
A more general approach to along-wind aerodynamic damping of structures is given by Holmes [
21]. Holmes exposes a derivation for drag forces acting on a tower, which results in the following aerodynamic damping force coefficient per unit height:
where
is the height-dependent wind profile, and
is the section-dependent aerodynamic drag coefficient. Analog to Steckley’s approach, it is assumed that the first modal form
dominates the oscillation behavior, and the generalized aerodynamic damping coefficient for the first mode is calculated, yielding:
Holmes’ approach expresses the aerodynamic damping as a function of the section’s aerodynamic drag coefficient. As a result, the expected aerodynamic damping forces can be calculated using the drag coefficients determined in
Section 2. This is performed by applying Equation (
7) to the particular conditions given in the wind tunnel. In this context, a constant diameter D, a constant drag coefficient
and a uniform wind speed along the model height are assumed. Due to the pivoting oscillations, the first modal form can be expressed as
. This yields the following expression:
expressing the wind speed as a function of the reduced velocity
(with
the first natural frequency). Replacing the excitation frequency for the angular frequency, it yields:
Equation (
9) allows a comparison with Equation (
4) of Steckley’s approach and will be used later to compare the measured aerodynamic damping with their expected values based on their drag coefficients.
3.1. Aerodynamic Damping Measurements Using the Forced Oscillations Method
Using the results of
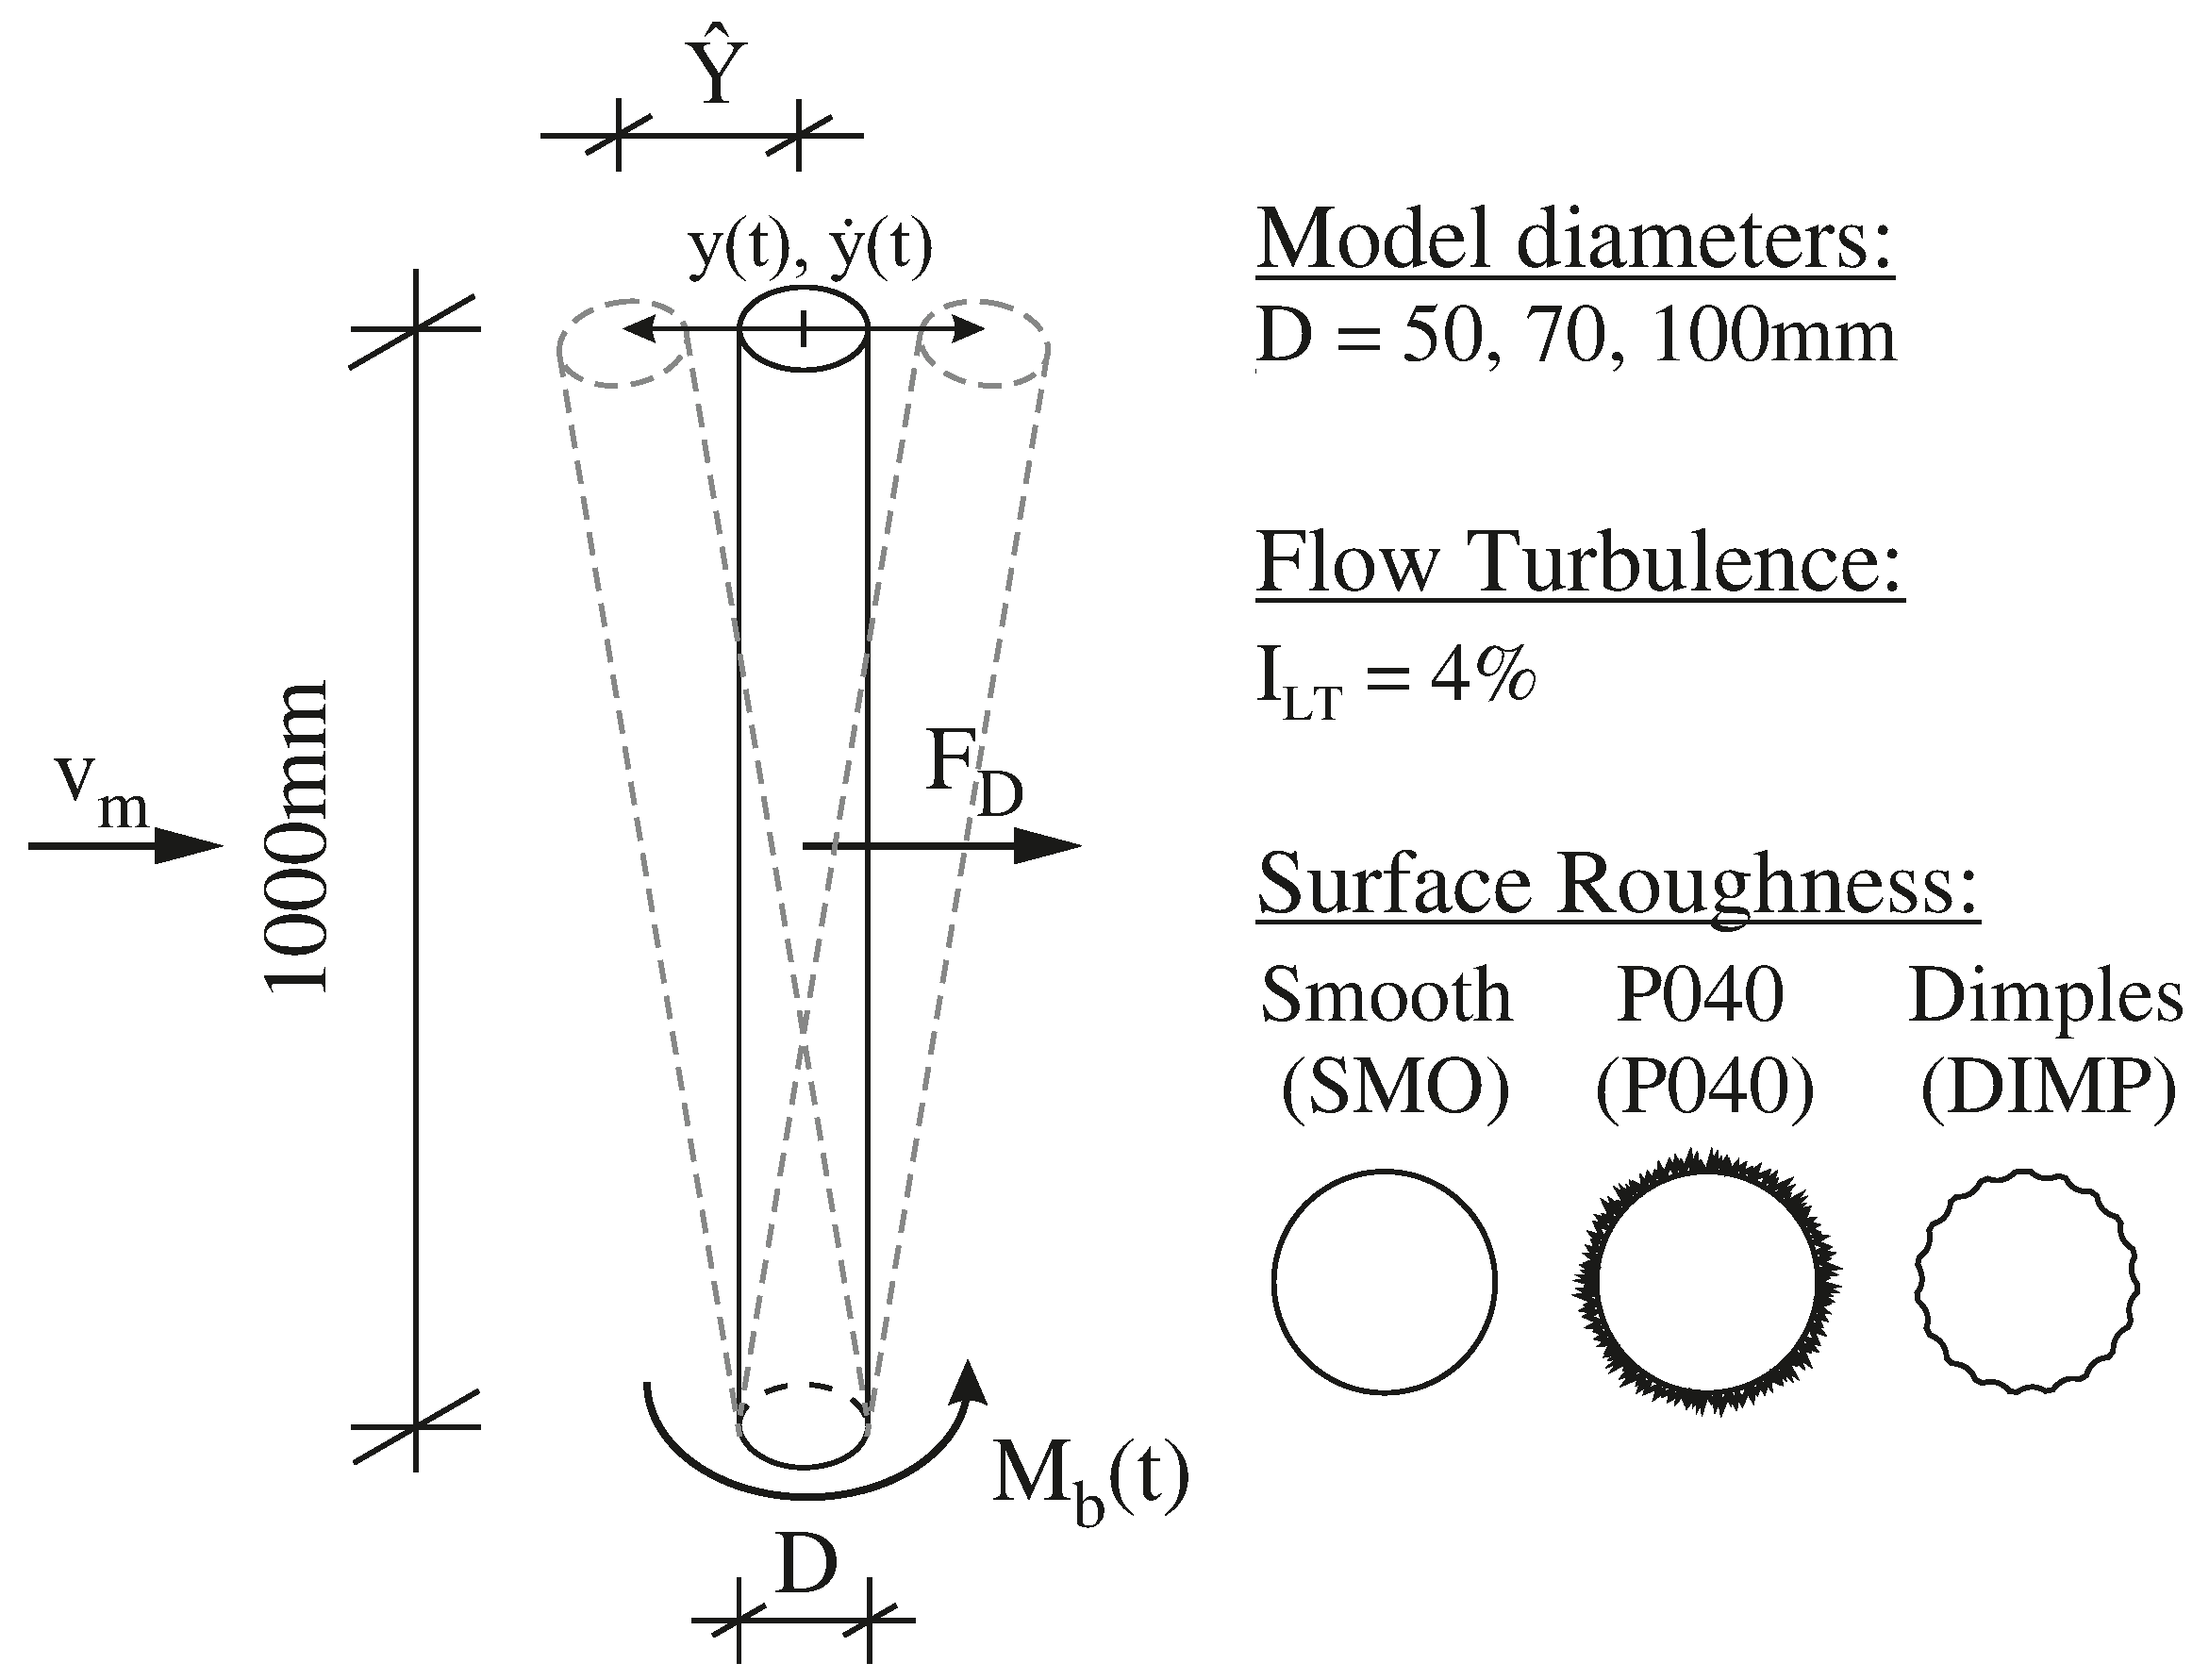
Section 2, 3 model diameters (50 mm, 70 mm and 100 mm) with 3 different surface roughnesses (Smooth surface, Sandpaper P040 and dimpled pattern) are chosen. The models were placed vertically on a six-axis force balance, and an end plate was located approximately one millimeter above the upper model extreme to minimize tip-effects. Additionally, the models were closed at their upper end.
Figure 6 summarizes the main experiment parameters.
The cylinders’ drag coefficients were measured again using this experimental setup to study the correlation between aerodynamic damping and drag coefficient values and to check the previously measured drag coefficients. The drag coefficient curves are shown in
Figure 7. The
values agree with the curves shown in
Figure 5, and the drag coefficients agree in general with previous values and values given in literature and standards for the corresponding surface roughness (for example, see [
38]). Only the values for the dimpled cylinders are considerably larger than those given in
Figure 3. This may be due to the finishing of the dimples in the aluminum cylinders being too rough and sharp, while the previously used PMA cylinders had a smoother finish. This again illustrates the sensibility of circular cross-sections against surface roughness modifications.
In the aerodynamic damping measurements, the sweep method as described by Steckley [
20] has been used, i.e., the wind tunnel wind speed is fixed and the forced oscillation frequencies is varied (i.e. “sweeping” over a range of frequencies). This allows for performing all measurements with a constant Reynolds number and therefore constant flow regime. Using the previously defined expressions in
Table 2 for the critical Reynolds number
, the parameters for the aerodynamic damping measurements are determined as shown in
Table 3. The models were measured in sub-critical (SC), critical (CC) and trans-critical (TC) flow conditions using oscillation frequencies between 4 and 11 Hz, yielding reduced speeds in the range of
approximately. As performed previously, the uncertainty of the measurements is estimated through the sensor precision. Assuming precisions around ±2.5% for the measured wind speed, ±5.0% for the measured moments and ±1.0% for the accelerometer results in a maximum error of around ±9.0% for the aerodynamic damping determination (multiplication of all errors). Because the evaluation of the results is based on the correlation between two sinusoidal signals, a measurement duration of 90 s was chosen to ensure a minimum of 450 up to 900 oscillations per measurement. This proved to yield a convergence of the results within 5% of the end result.
3.2. Results: Aerodynamic Damping of Wind Turbine Towers
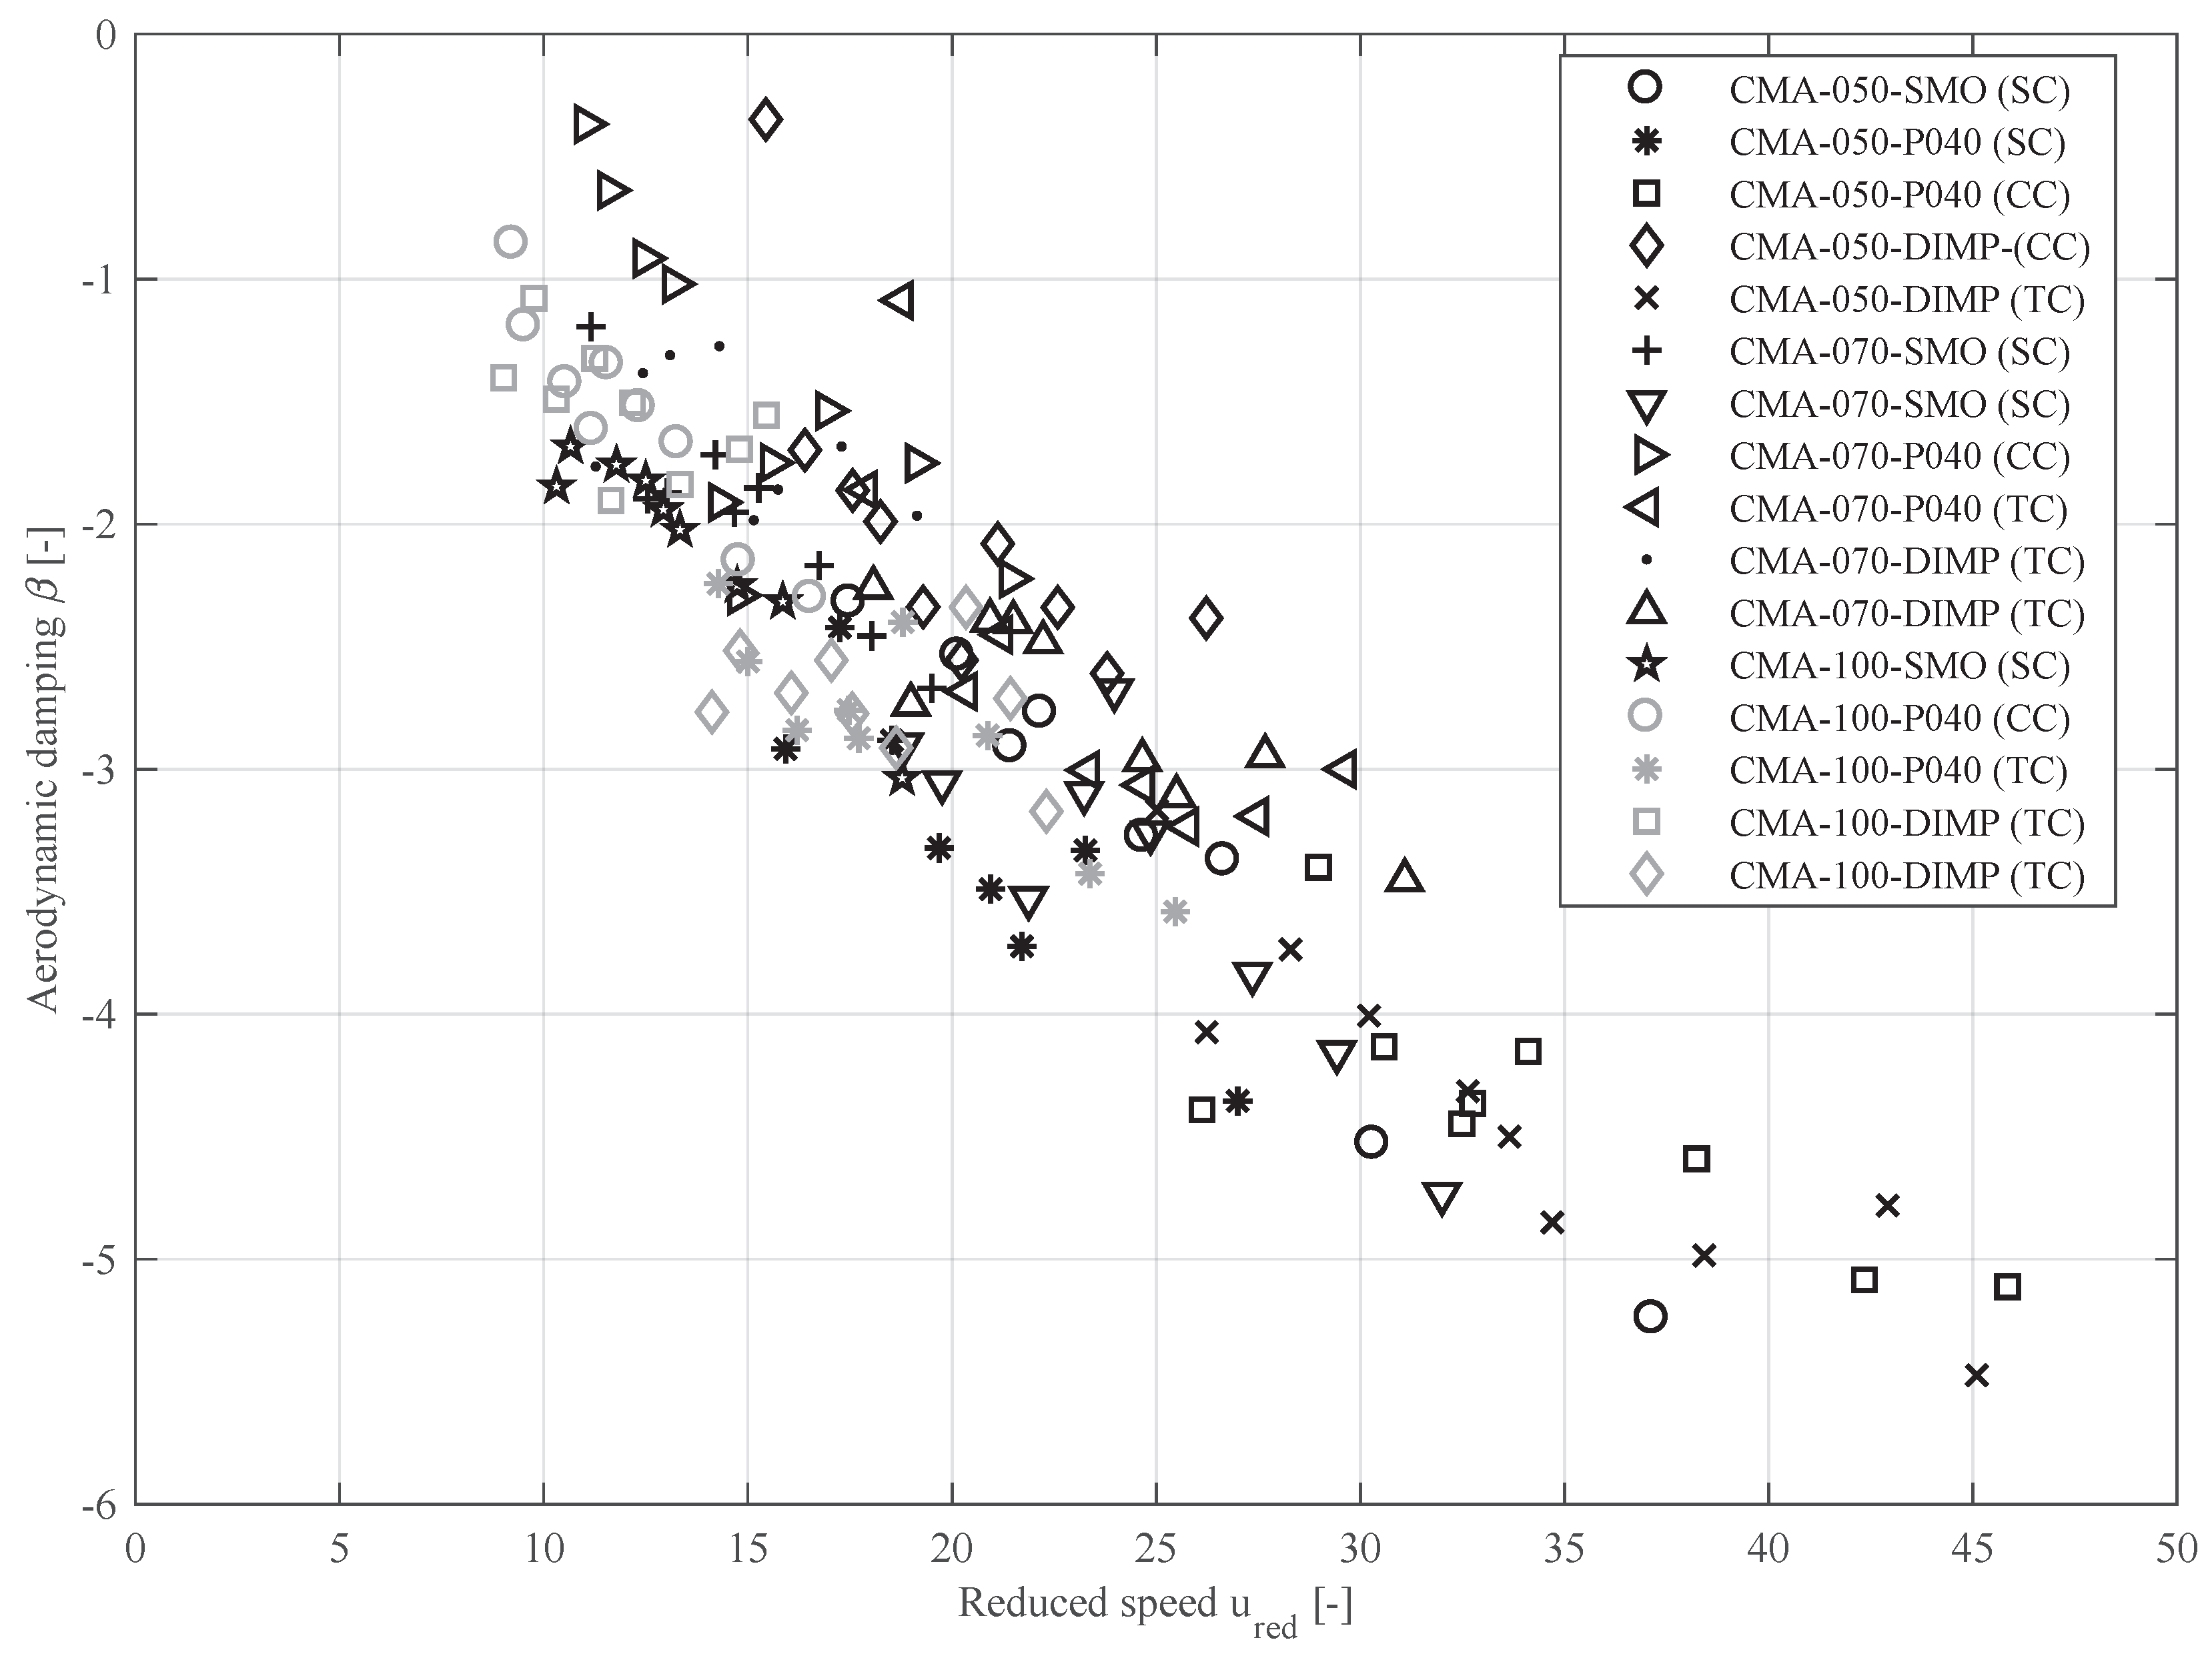
The determined aerodynamic damping coefficients
as defined in Equation (
4) are shown in
Figure 8. The results show some dispersion, but a clear tendency is recognizable: the aerodynamic damping has a damping effect on the tower oscillations, and grows with increasing reduced speed.
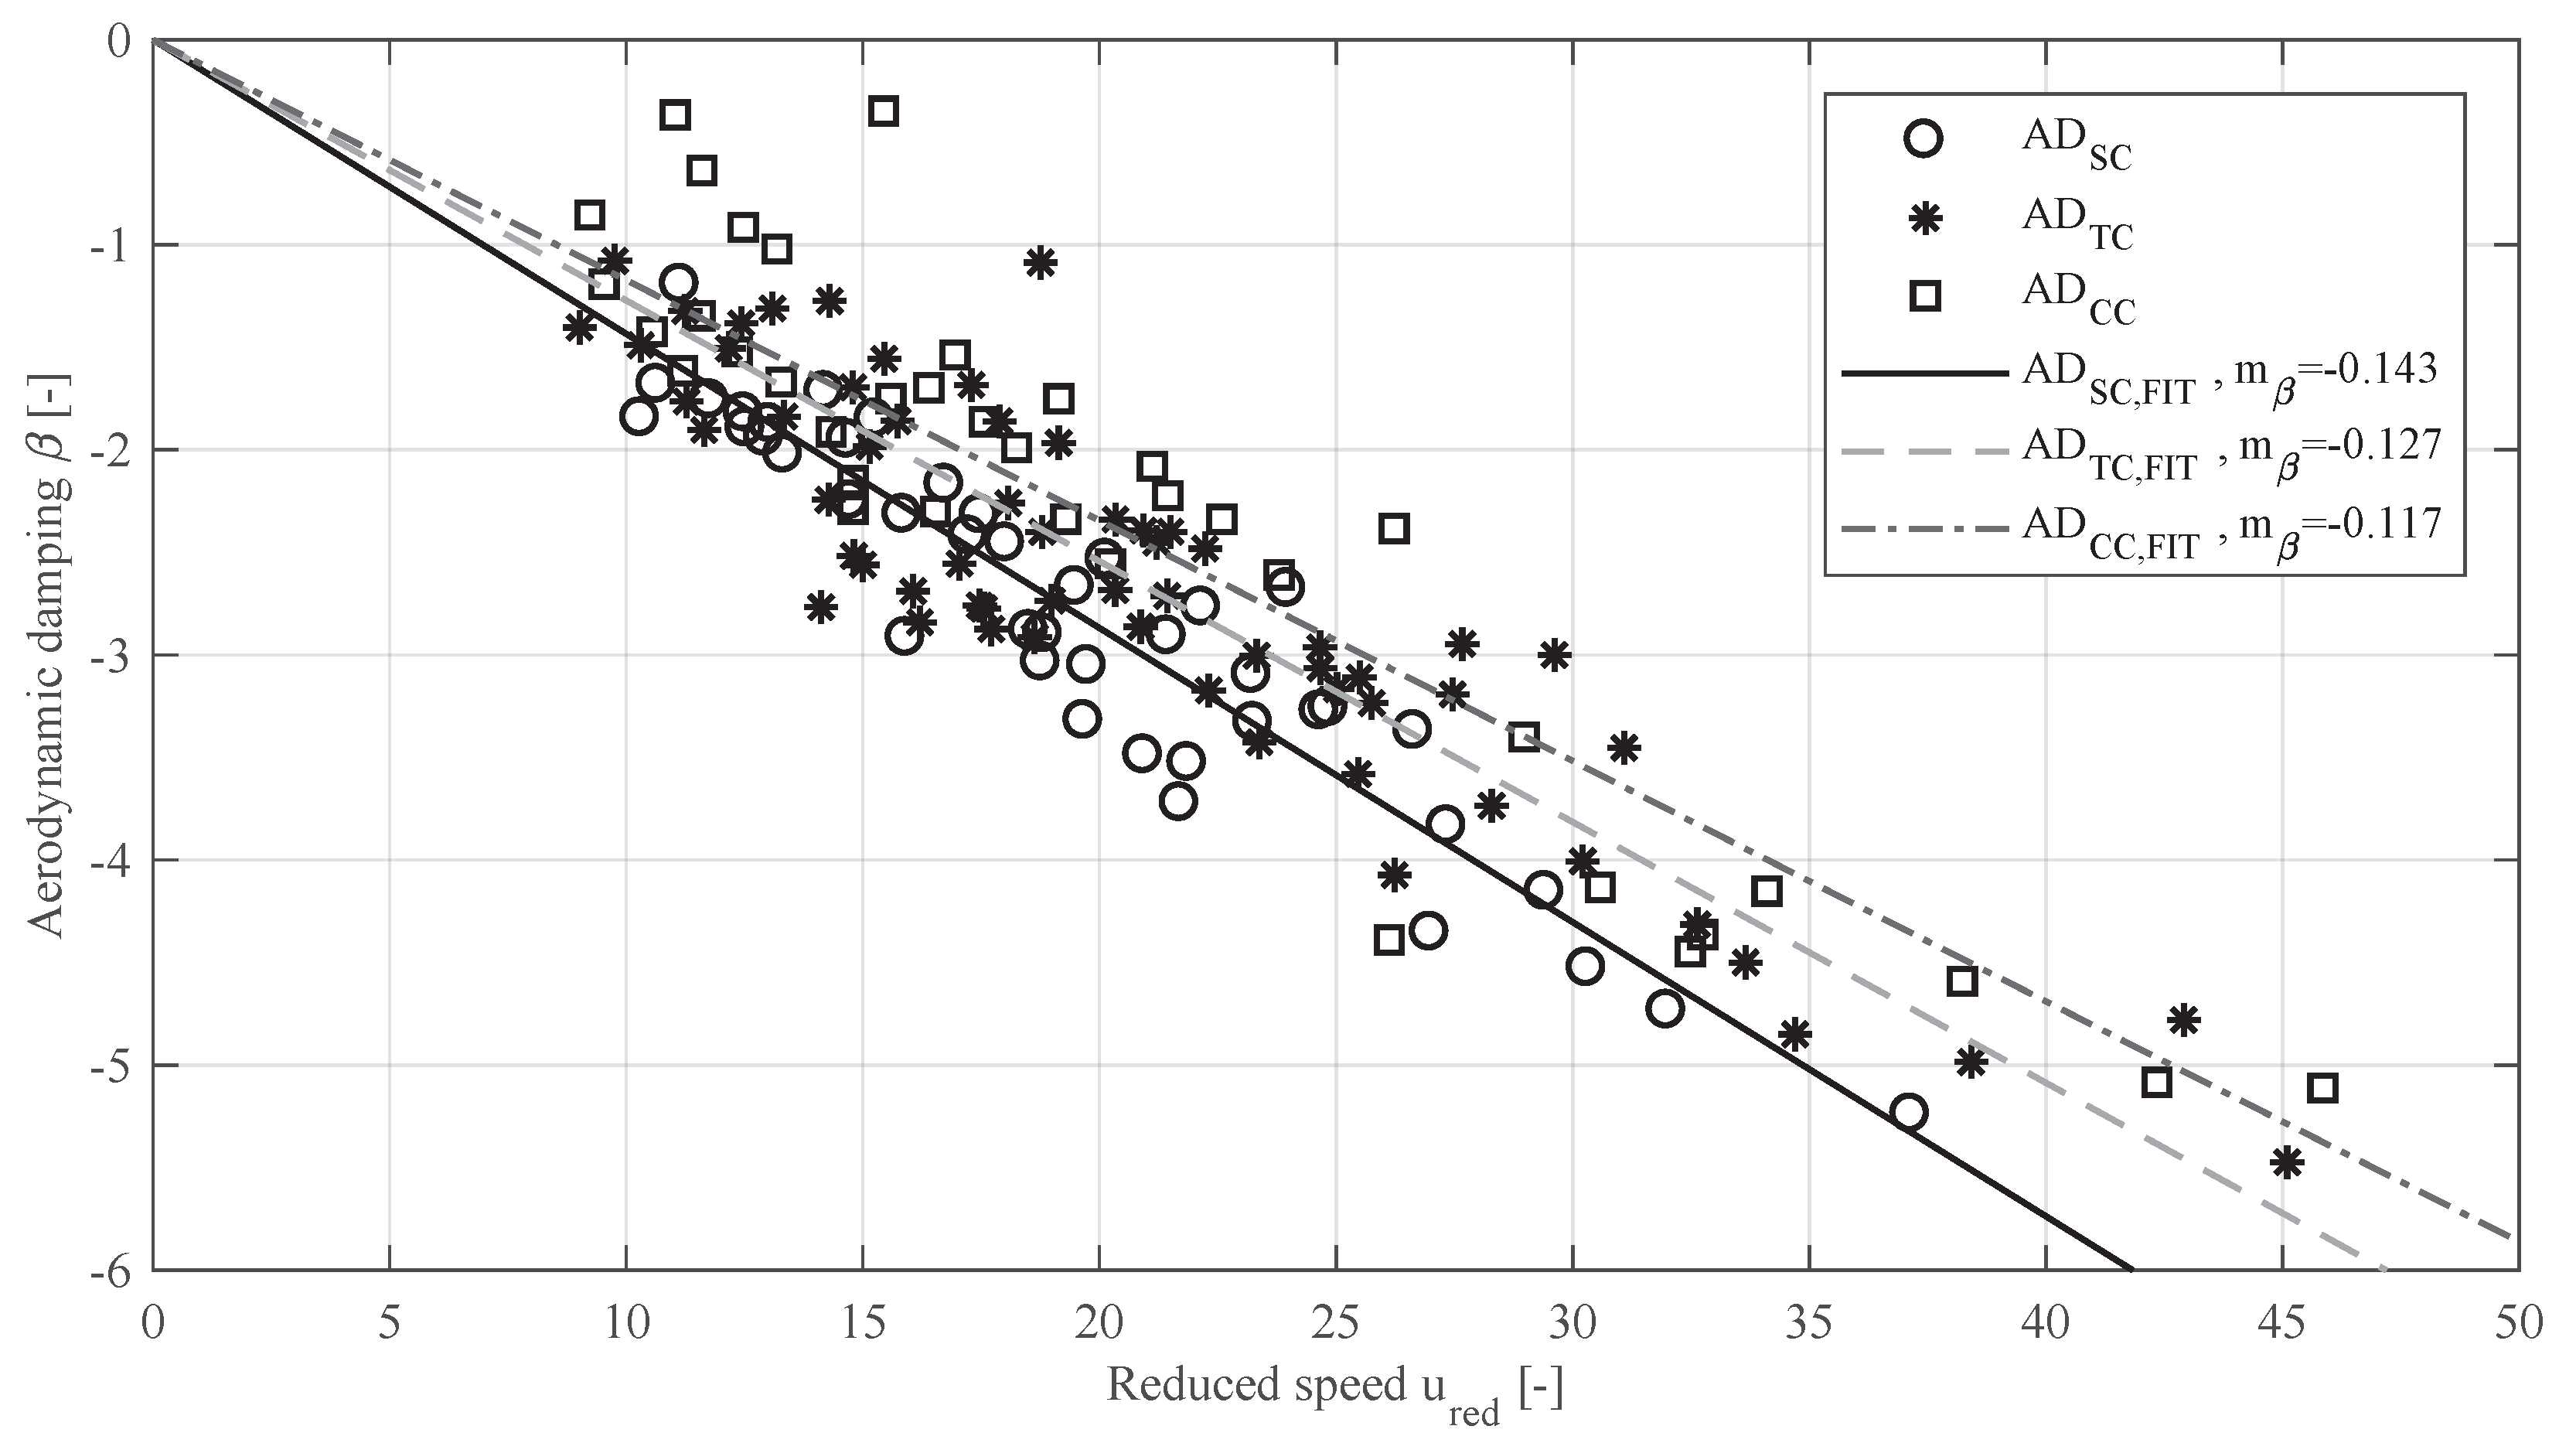
The results shown in
Figure 8 can be classified depending on their flow regimes in the SC, TC and CC regimes. A linear regression is used to fit lines to each case, which are forced to contain the origin of coordinates. The aerodynamic damping coefficient
can then be expressed as a function of the reduced speed using Equation (
10):
where
is the fitted line slope. The measurements grouped in flow regimes and their fitted lines are shown in
Figure 9.
The expression of the fitted lines for the aerodynamic damping and their goodness of fit
are given in
Table 4. An additional fit was performed considering all measured points, which is also included in the table under the name of “All regimes”. The results are compared to the average drag values of each regime through the ratio
, which is also shown in
Table 4.
The aerodynamic damping results are made dimensionless by using the normalization factor
, which is given in Equation (
11), and which is also used to upscale the aerodynamic damping to full size, as shown in
Table 5:
where
is the excitation frequency in the wind tunnel measurements or the first natural frequency of the full-scale structure, and
is the oscillation amplitude.
The relation between the drag and the aerodynamic damping coefficients
is studied using Holmes’ approach. To this end, the aerodynamic term in Expression (
4) is considered, and
is replaced using Equation (
10). Doing so, the generalized aerodynamic damping as defined by Steckley takes the following form:
As Equations (
9) and (
12) are supposed to describe the same phenomenon, both equations can be equated to find the relation between
and
. The result is a factor
, as shown in Equation (
13):
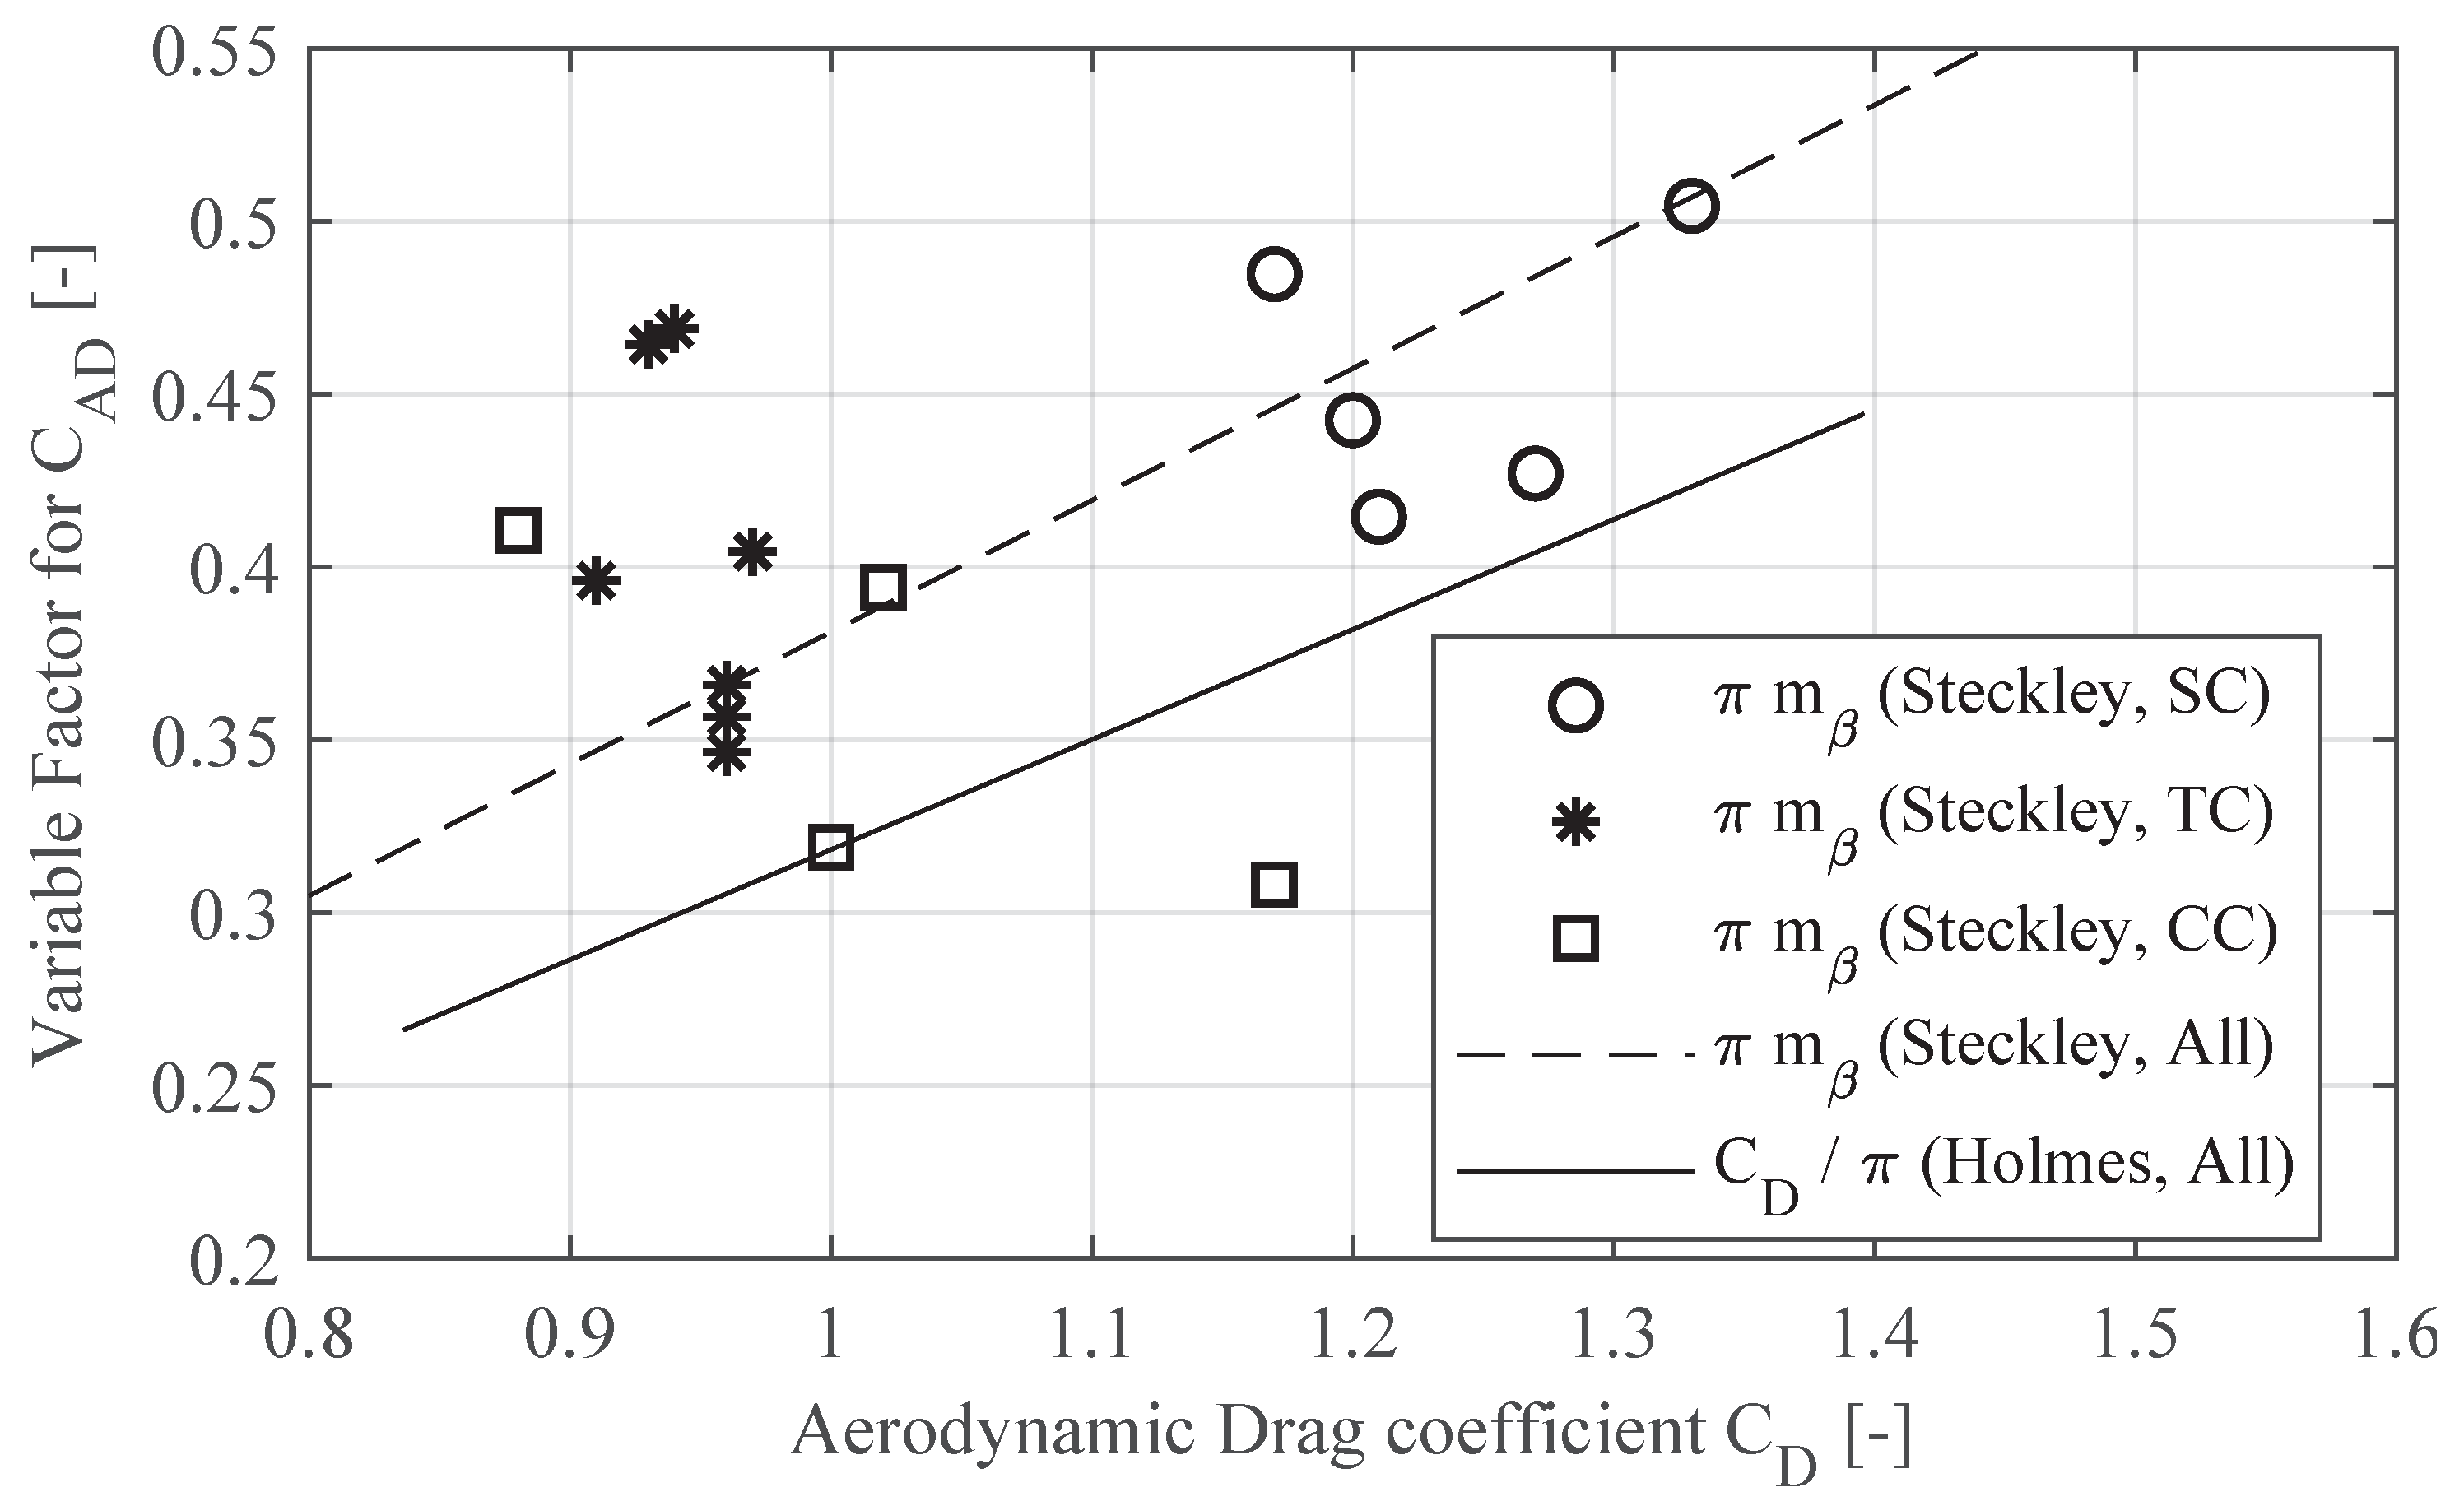
As seen in
Table 4, the calculated ratio from the experiments
is smaller than
, by approximately 15%. This indicates that the measured aerodynamic damping coefficients are higher than expected. The differing coefficients between Equations (
9) and (
12) are considered, i.e.,
in Holmes’ approach and
in Steckley’s approach, both as measured in the wind tunnel. For the aerodynamic damping measurements, a slope coefficient
is determined for each measurement and expressed according to its previously measured
. In addition, the
coefficients are grouped according to their flow regime.
Figure 10 shows the differences between both approaches, which results in aerodynamic damping values approximately 15% higher in the wind tunnel measurements according to Steckley’s approach, which can be due to fundamental differences in the approaches, or to the wind tunnel measurement set-up (end-plate, tip effects, etc.).
5. Conclusions
The aerodynamic drag coefficients of cylinders with circular cross-sections and different surface roughnesses have been determined in wind tunnel tests with low (
= 4%) and high (
= 11.5%) turbulence flows. The localization of the transition to trans-critical flow conditions (
) has been documented in
Figure 5 and
Table 2 for guidance in experimental studies where the Reynolds number effects play an important role. The reproducibility of the surface roughness and specially the consideration of high-turbulence conditions is still relatively scarce in the literature.
The aerodynamic damping of wind turbine towers has been determined through wind tunnel experiments using Steckley’s approach and the forced oscillation method. The measurements have been performed in sub-critical, critical and trans-critical regimes, and the results were compared to a general approach by Holmes [
21]. Both approaches were applied in aeroelastic multi-body simulations to study the impact of the tower’s aerodynamic damping on the tower fatigue of a 6MW reference wind turbine, obtaining a tower lifetime extension of approximately 0.4%. It can be concluded that while Steckley’s approach is useful for structures which oscillate primarily in their first modal form, its application as a generalized aerodynamic damping force is not accurate for wind turbine towers, where the second modal form and the loading on the rotor have a relevant contribution on the tower dynamic behavior.
The aerodynamic damping due to the tower may play a more important role for future turbines, as has been shown in
Section 4.3. The results of this study support a better understanding of its nature and magnitude. In particular, Equation (
16) enables a quick estimation of the tower aerodynamic damping and of its contribution to the total damping of wind turbines in operation and parked conditions, which can help in the interpretation of on-site measured responses such as the previously cited [
13,
14,
15,
16]. In addition, Equation (
16) also enhances fatigue analysis in frequency domain ([
49,
50]). Finally, the application or modeling of the tower aerodynamic damping in aeroelastic software codes is possible in the design phase, which considers the resultant higher damping already in the design of all turbine components.
Future studies should consider the effect of the passing blade on the tower wind pressure distribution, so that its effect on the aerodynamic load and damping on the tower can also be considered. The presented findings of realistic modeling for wind tunnel investigations can contribute to future research for other dynamic effects such as vortex-induced vibrations.


 ,
, 


