Abstract
To deeply understand the influence of crack inclination angle on crack propagation and coalescence in fractured limestone, uniaxial compression tests were carried out on limestone specimens with prefabricated cracks. The strain field evolution diagram of the failure process of the specimens was obtained using 3D digital image correlation technology (3D-DIC technology). This, in combination with the crack propagation diagram, was used to analyze the entire failure process of the limestone specimens. The test results show that the evolution process of the principal strain field agrees well with the process of crack initiation, propagation, and coalescence. The crack development process is the process of the high strain zones consistently propagating and also the process of micro-cracks appearing, developing, and nucleating to form macro-cracks. With the increase in the parallel crack inclination angle, the stress concentration zone of the intermediate crack transfers from both ends of the crack to the middle. Meanwhile, the coalescing crack type between the parallel crack and the intermediate crack changes from a coexisting tensile crack and tensile-shear crack to a single tensile crack. With the increase in the parallel crack inclination angle, the failure of the fractured limestone specimens changes from simple splitting or tensile failure to the coexistence of tensile-shear fracture and splitting. 3D-DIC technology provides an effective method to study crack propagation and coalescence during rock failure.
1. Introduction
Rock, as a natural nonhomogeneous material, is widely used in various projects. Due to the influence of natural or man-made factors, various kinds of defects (such as voids and fissures) can form inside or on the surface of rocks, and the consistent propagation and coalescence of these defects are one of the important factors leading to rock failure.
To study the failure process of these defective rocks, scholars from China and other countries have carried out many in-depth studies in the laboratory using high-speed photography, acoustic emission, 3D printing, CT technology, and scanning electron microscopy (SEM). These scholars [1,2,3,4,5,6,7,8] studied the crack propagation and deformation of rocks or rock-like material under compression through high-speed photography and obtained many important results. Lajtai [1] conducted a uniaxial compression test on a gypsum sample containing a single crack and found that there are two main new cracks on the surface of the sample, a wing crack (tensile crack) and a secondary crack (shear crack). Wing cracks usually appear at the ends of prefabricated cracks and will expand in the direction of maximum compressive stress during compression. The secondary cracks also originate near the end of the prefabricated cracks, but the time of the secondary cracks lags behind the time of the wing cracks. Similar research includes Petit [2] and Chen [3]. Wong and Einstein [4] found and summarized three kinds of tension cracks, three kinds of shear cracks, and one kind of tension shear composite crack through the uniaxial compression test of gypsum and marble specimens with prefabricated cracks. Lin et al. [5] found that the crack propagation and failure modes are related to the angle of the prefabricated crack. When the prefabricated crack’s inclination angle is small, the crack initiation is easier and the propagation speed is more uniform. As the inclination angle increases, the initiation of the crack is difficult and usually expands rapidly when the stress reaches the peak stress. At the same time, the failure mode of the sample will change from complex mixed failure to shear failure or split failure with the increase in the crack inclination. Yang et al. [6] conducted a uniaxial compression test on a sandstone sample containing three prefabricated cracks and found that the propagation and coalescence of the cracks generated at the end of the prefabricated crack are important factors leading to the failure of the sample. Liu et al. [7] carried out uniaxial compression on rock-like specimens with V-shaped cracks, studied the influence of V-shaped prefabricated cracks with different included angles on the mechanical properties and failure modes of the specimens, considered that the crack initiation form of the cracks was related to the stress state and stress concentration degree of the intersecting cracks, and summarized four types of failure modes. Xu et al. [8] conducted uniaxial compression tests on gypsum to investigate crack propagation and coalescence due to nonpenetrating surface flaws and their effect on material strength. Dong et al. [9] conducted acoustic emission tests on the entire failure process of granite under uniaxial compression and obtained the stage characteristics of the frequency distribution of acoustic emission energy levels and the waveform spectrum in the rock failure process; they also established a method to identify crack propagation in the plastic stage through machine learning. Sun et al. [10,11,12,13,14,15] used 3D-printed concrete and other rock-like materials to study the internal fiber fracture characteristics of concrete. Three-dimensional printing technology using enhanced methods has enhanced microwave absorption, which can greatly reduce electronic pollution. Ge et al. [16,17] and Li et al. [18,19] used CT real-time scanning technology to describe the evolution process of rock crack propagation in detail. Zhao et al. [20] conducted uniaxial compression tests on gypsum specimens with a single crack, scanned the entire specimen’s fracture section with an electron microscope, and analyzed the relationship between crack inclination angle and the tensile-shear stress weight of the entire section from a mesoscopic perspective. The fracture response may not only be dependent on the initial cracks but also the microstructural morphologies. Da et al. [21,22] proposed a phase field-based topology optimization method to study the fracture process of composite materials from damage to multi-crack propagation to failure, and proved that this method can effectively improve the fracture resistance of composite structures.
In addition to the above observation methods, some scholars have also used digital image correlation technology (DIC technology) to study rock failure processes. DIC was first proposed by Japanese scholar Yamaguchi I [23] and American scholar Ranson et al. [24]. Later, Sutton et al. [25,26,27] improved the theories related to digital image technology and applied this method to study the variation in the displacement field in the crack propagation process. Some scholars [28,29,30,31,32] have used glass fiber-reinforced polymers to replace steel to avoid performance degradation caused by steel corrosion. In order to improve the real-time monitoring effect of the structure, a conductive cement composite material was developed using artificial intelligence. Zhao et al. [33,34] used digital image correlation technology to study the entire process of crack initiation, propagation, and penetration failure of sandstone specimens, and analyzed the changes in strain field during specimen failure. Song et al. [35] calculated and analyzed the displacement evolution of the deformation localization zone and the energy evolution of a specimen’s surface deformation during the loading of rock specimens through the digital speckle correlation method. Zhao et al. [36], Zhu et al. [37], and Guo et al. [38] obtained the principal strain field of a defective rock’s surface under uniaxial action through digital image correlation technology and analyzed the entire process of crack initiation, propagation, and failure by using the linear strain theory of maximum elongation. Ma et al. [39] conducted uniaxial compression tests on slab granite specimens with prefabricated circular holes, and used 3D-DIC technology to observe and calculate the displacement field and strain field on the surface of the specimen during the failure process. The calculated results better reflect the whole process of crack generation, propagation. and coalescence on the surface of the sample. It proves that 3D-DIC technology has its unique advantages in rock and soil mechanics tests. Li et al. [40] calculated the principal strain nephogram and the shear strain nephogram on the surface of rock specimens with trigeminal cracks through digital image correlation technology and found that specimen failure was caused by tensile failure rather than shear failure. Peng et al. [41] studied the entire uniaxial compression failure process of prefabricated porous marble by using a three-dimensional digital image observation system and analyzed the evolution process of the surface displacement field and strain field of prefabricated porous marble during the failure process.
The entire process of rock failure can be observed well using digital image technology, but conventional 2D-DIC technology [33,42] cannot determine the three-dimensional spatial information of the observed target; thus, it has many limitations in practical application, and especially cannot be applied to study the deformation of cylindrical specimens. The 3D-DIC technology can be used to monitor the destruction process of cylindrical samples. Therefore, this study takes fractured limestone as the main study object, uses 3D-DIC technology as the main observation method, uses maximum elongation line strain theory as the criterion to identify crack initiation, and investigates the influence of crack inclination on crack propagation and coalescence in fractured limestone based on the principal strain nephogram and the crack propagation nephogram drawn from real-time images. It is a bold attempt to carry out the research on the crack propagation of rocks with multiple cracks by 3D-DIC technology, which provides a new idea for future research on the crack propagation of rocks with multiple cracks.
2. Materials and Methods
2.1. Establishing the Crack Model
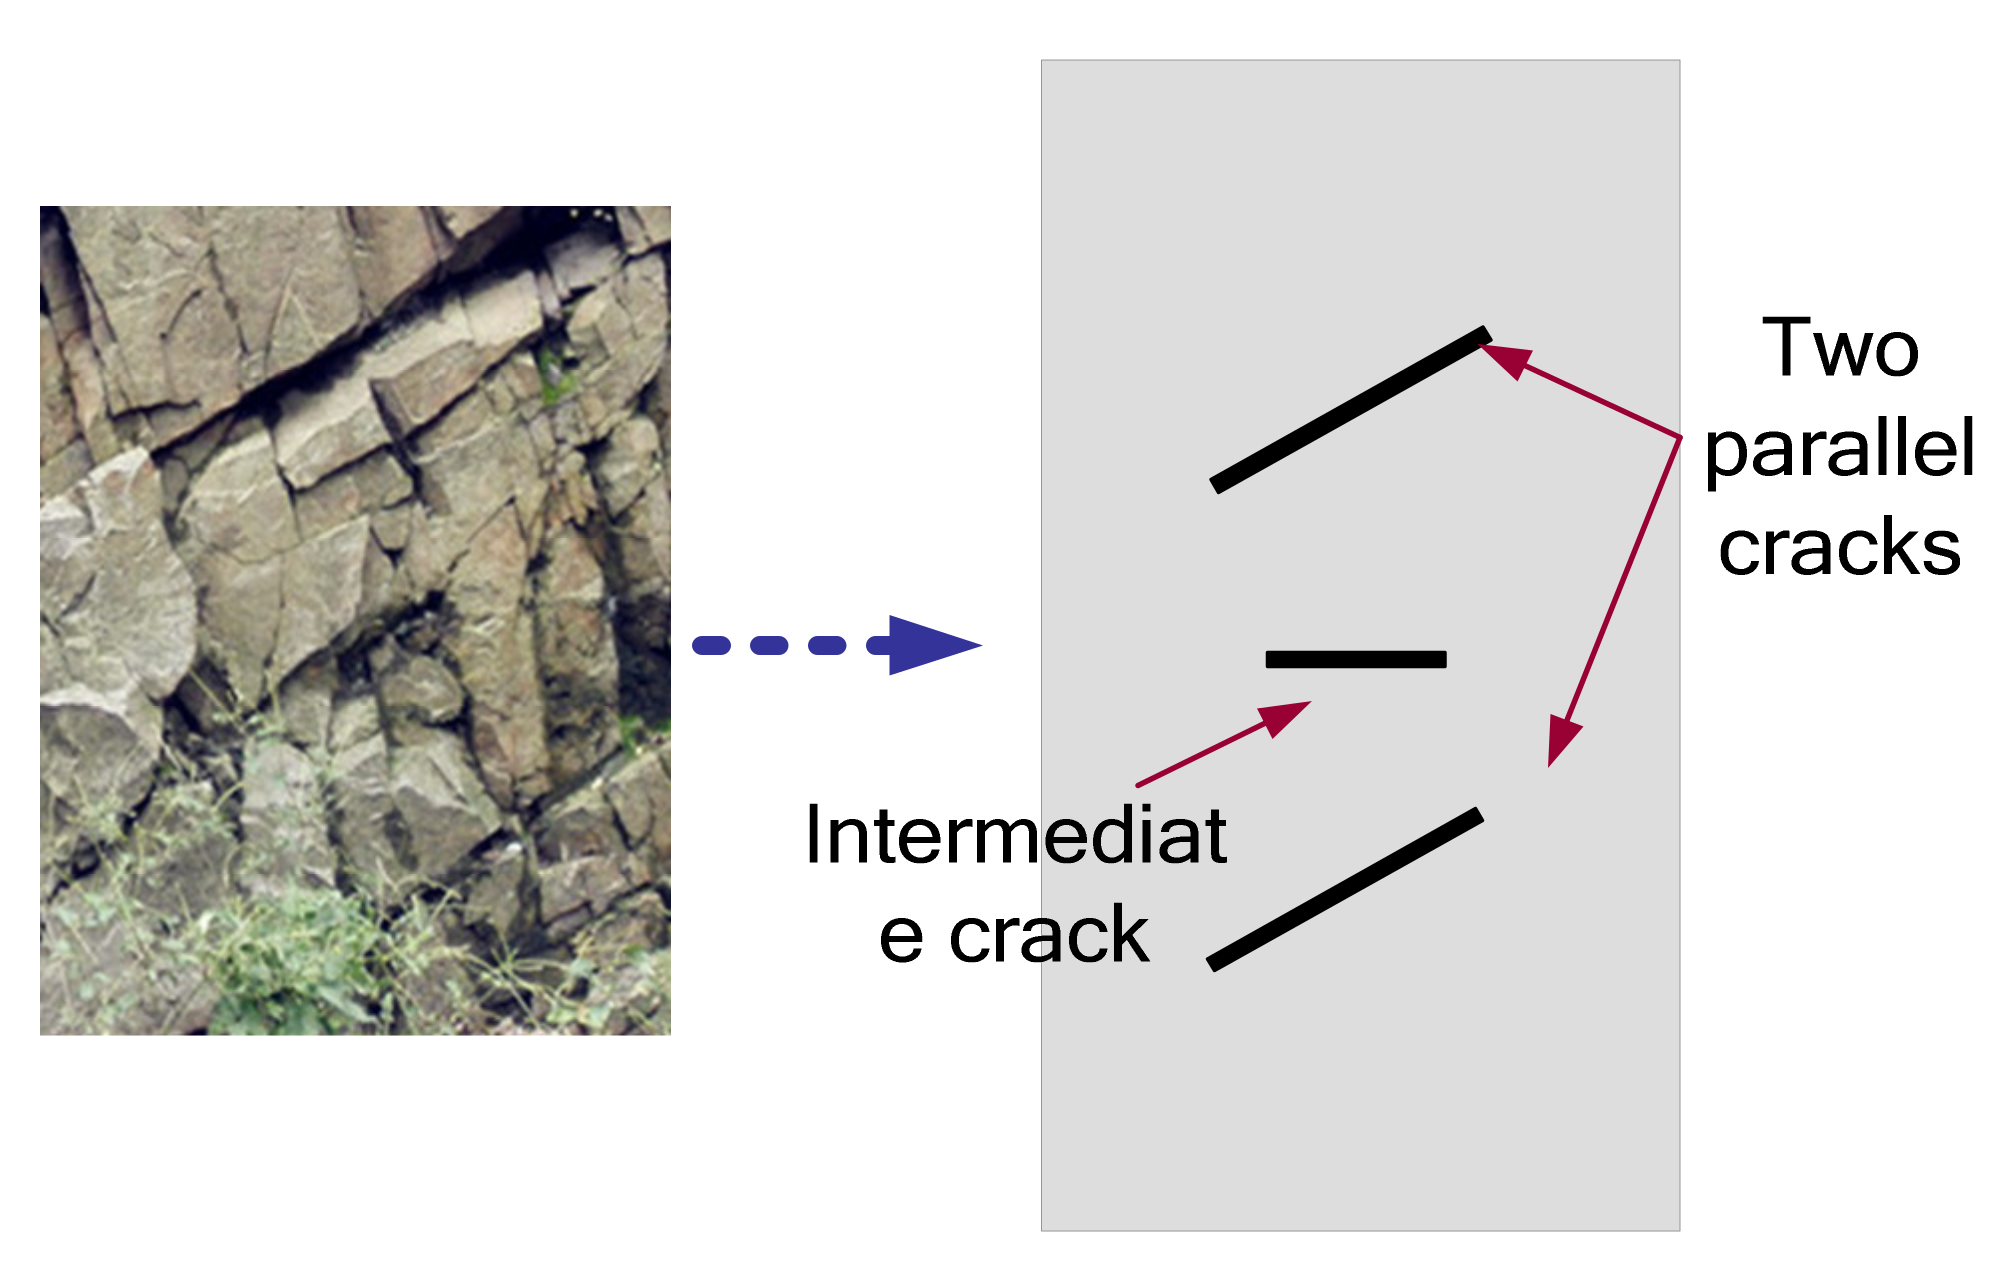
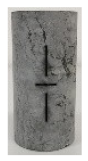
There are various distances and inclination angles between cracks in rocks with joints and cracks. Therefore, a multi-crack model was designed in this study. There are three cracks in the model, among which the upper and lower ones are of equal length and parallel to each other, and the third one is located in the middle of the two cracks and intersects with the two parallel cracks, as shown in Figure 1.
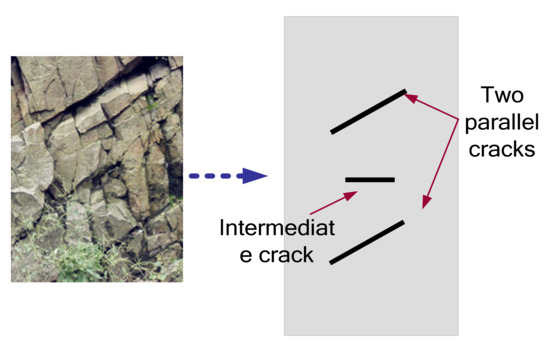
Figure 1.
Multi-crack model.
2.2. Introduction to the Test Program
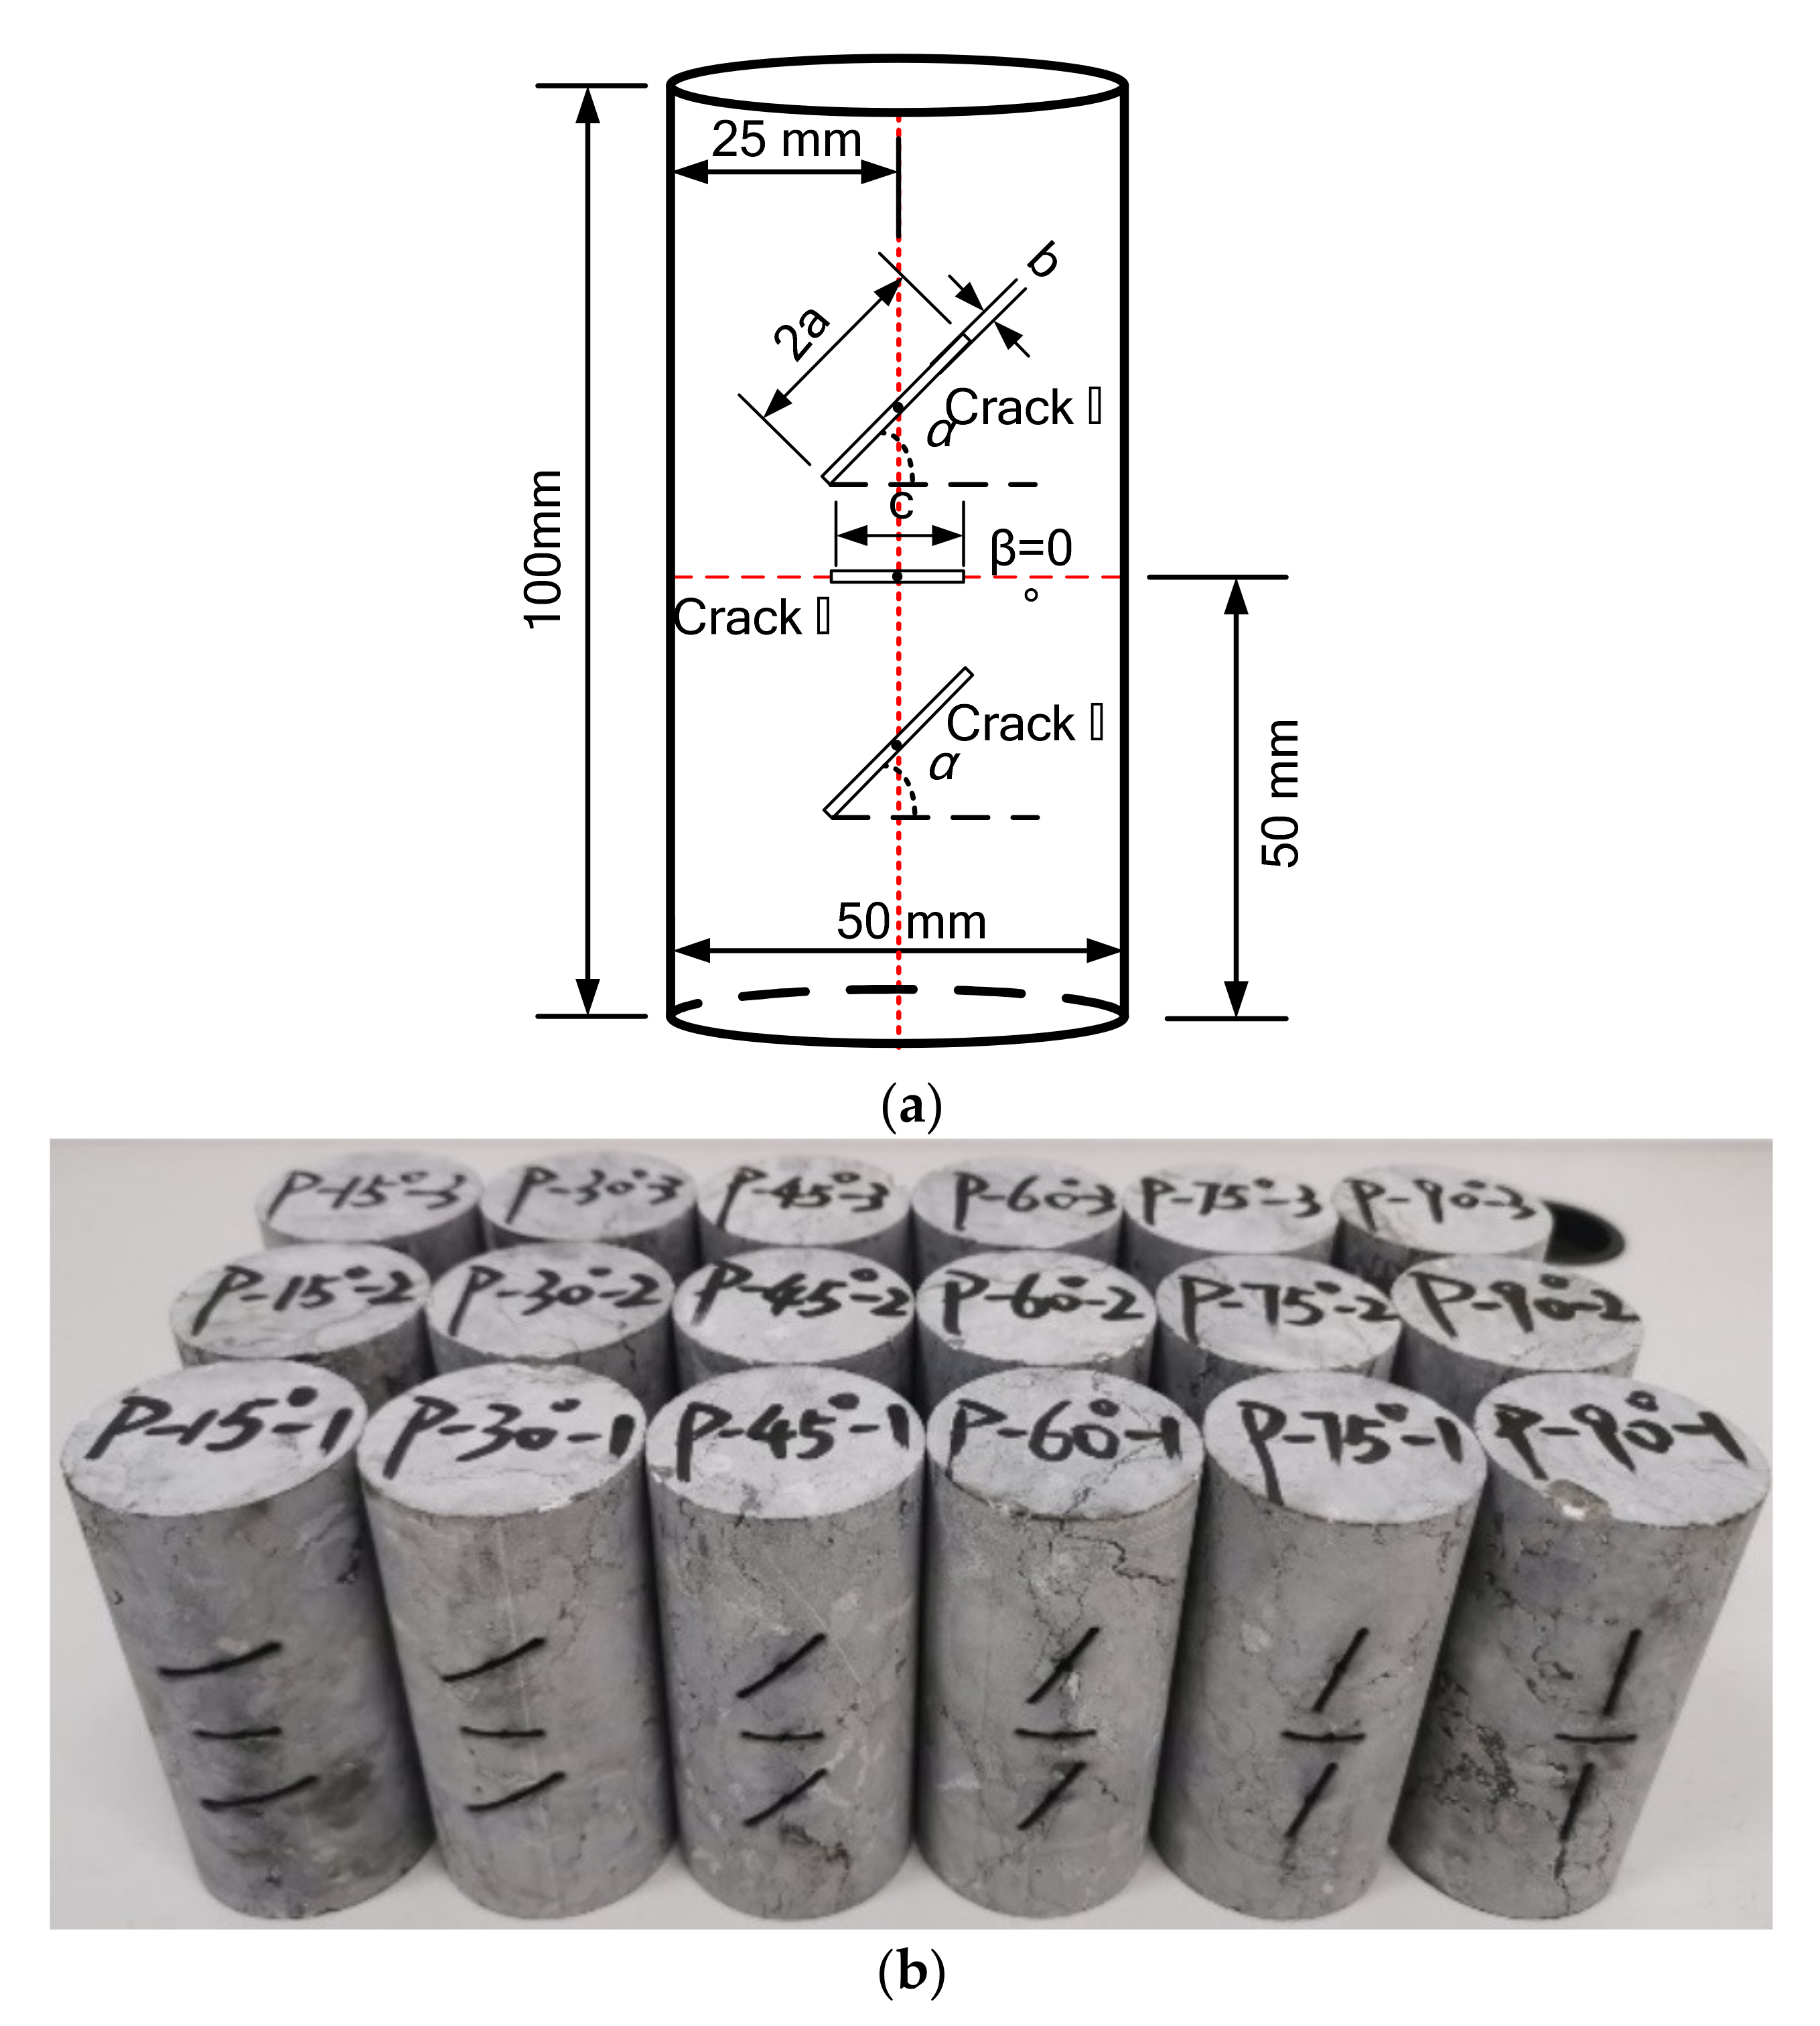
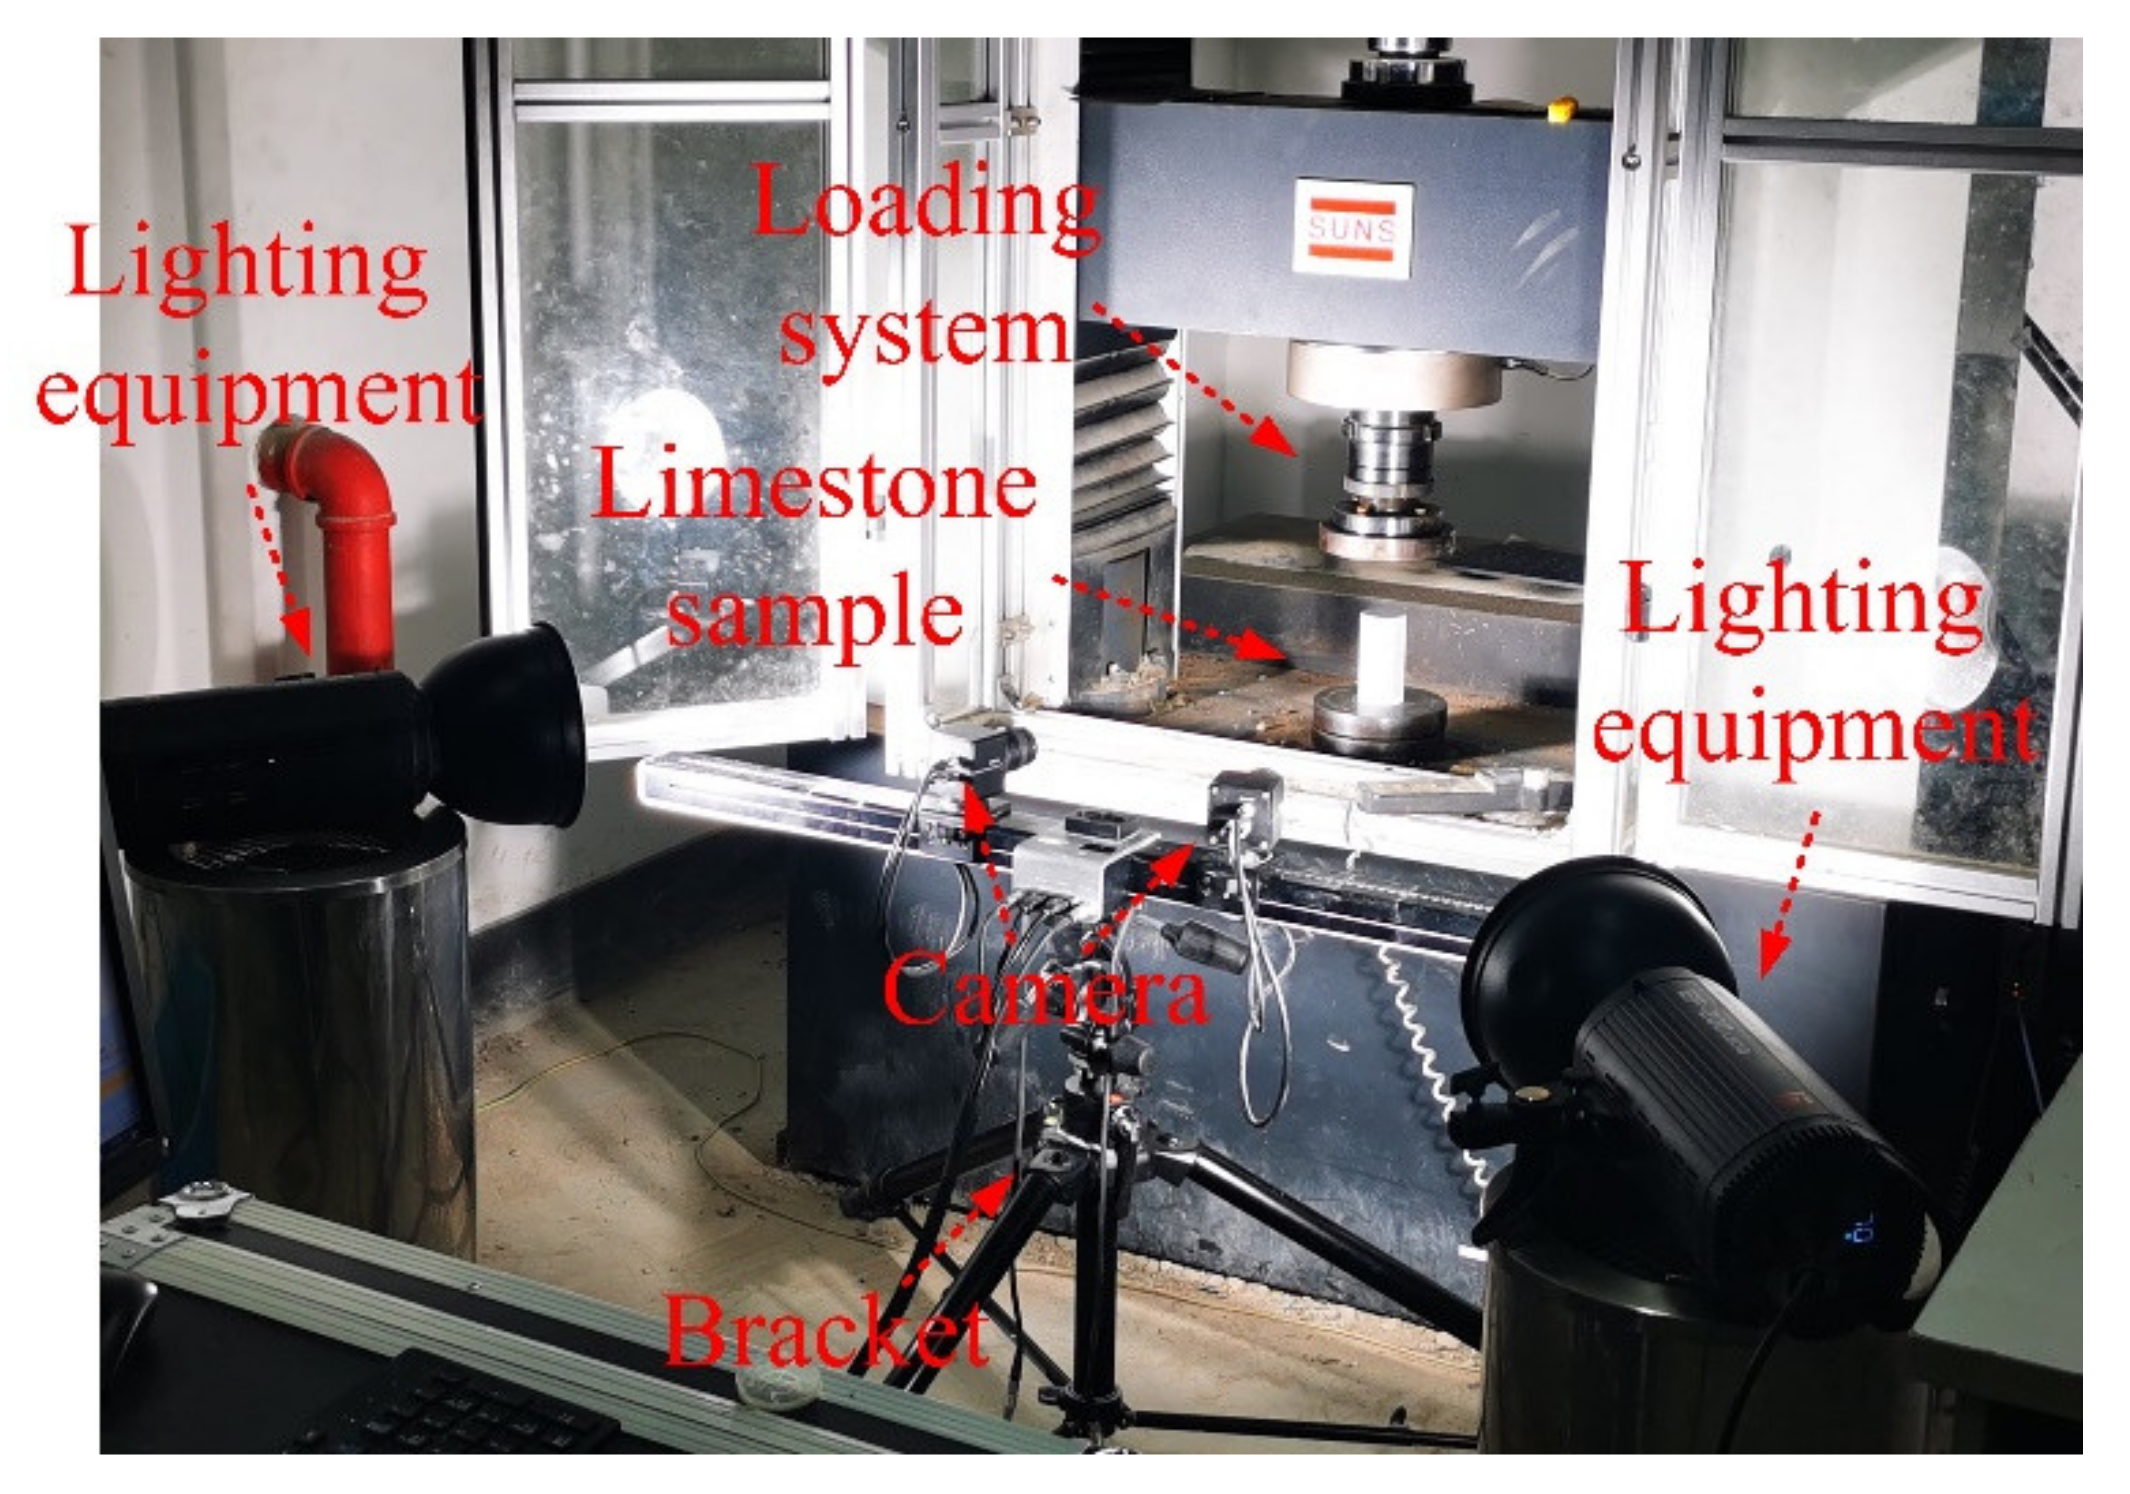
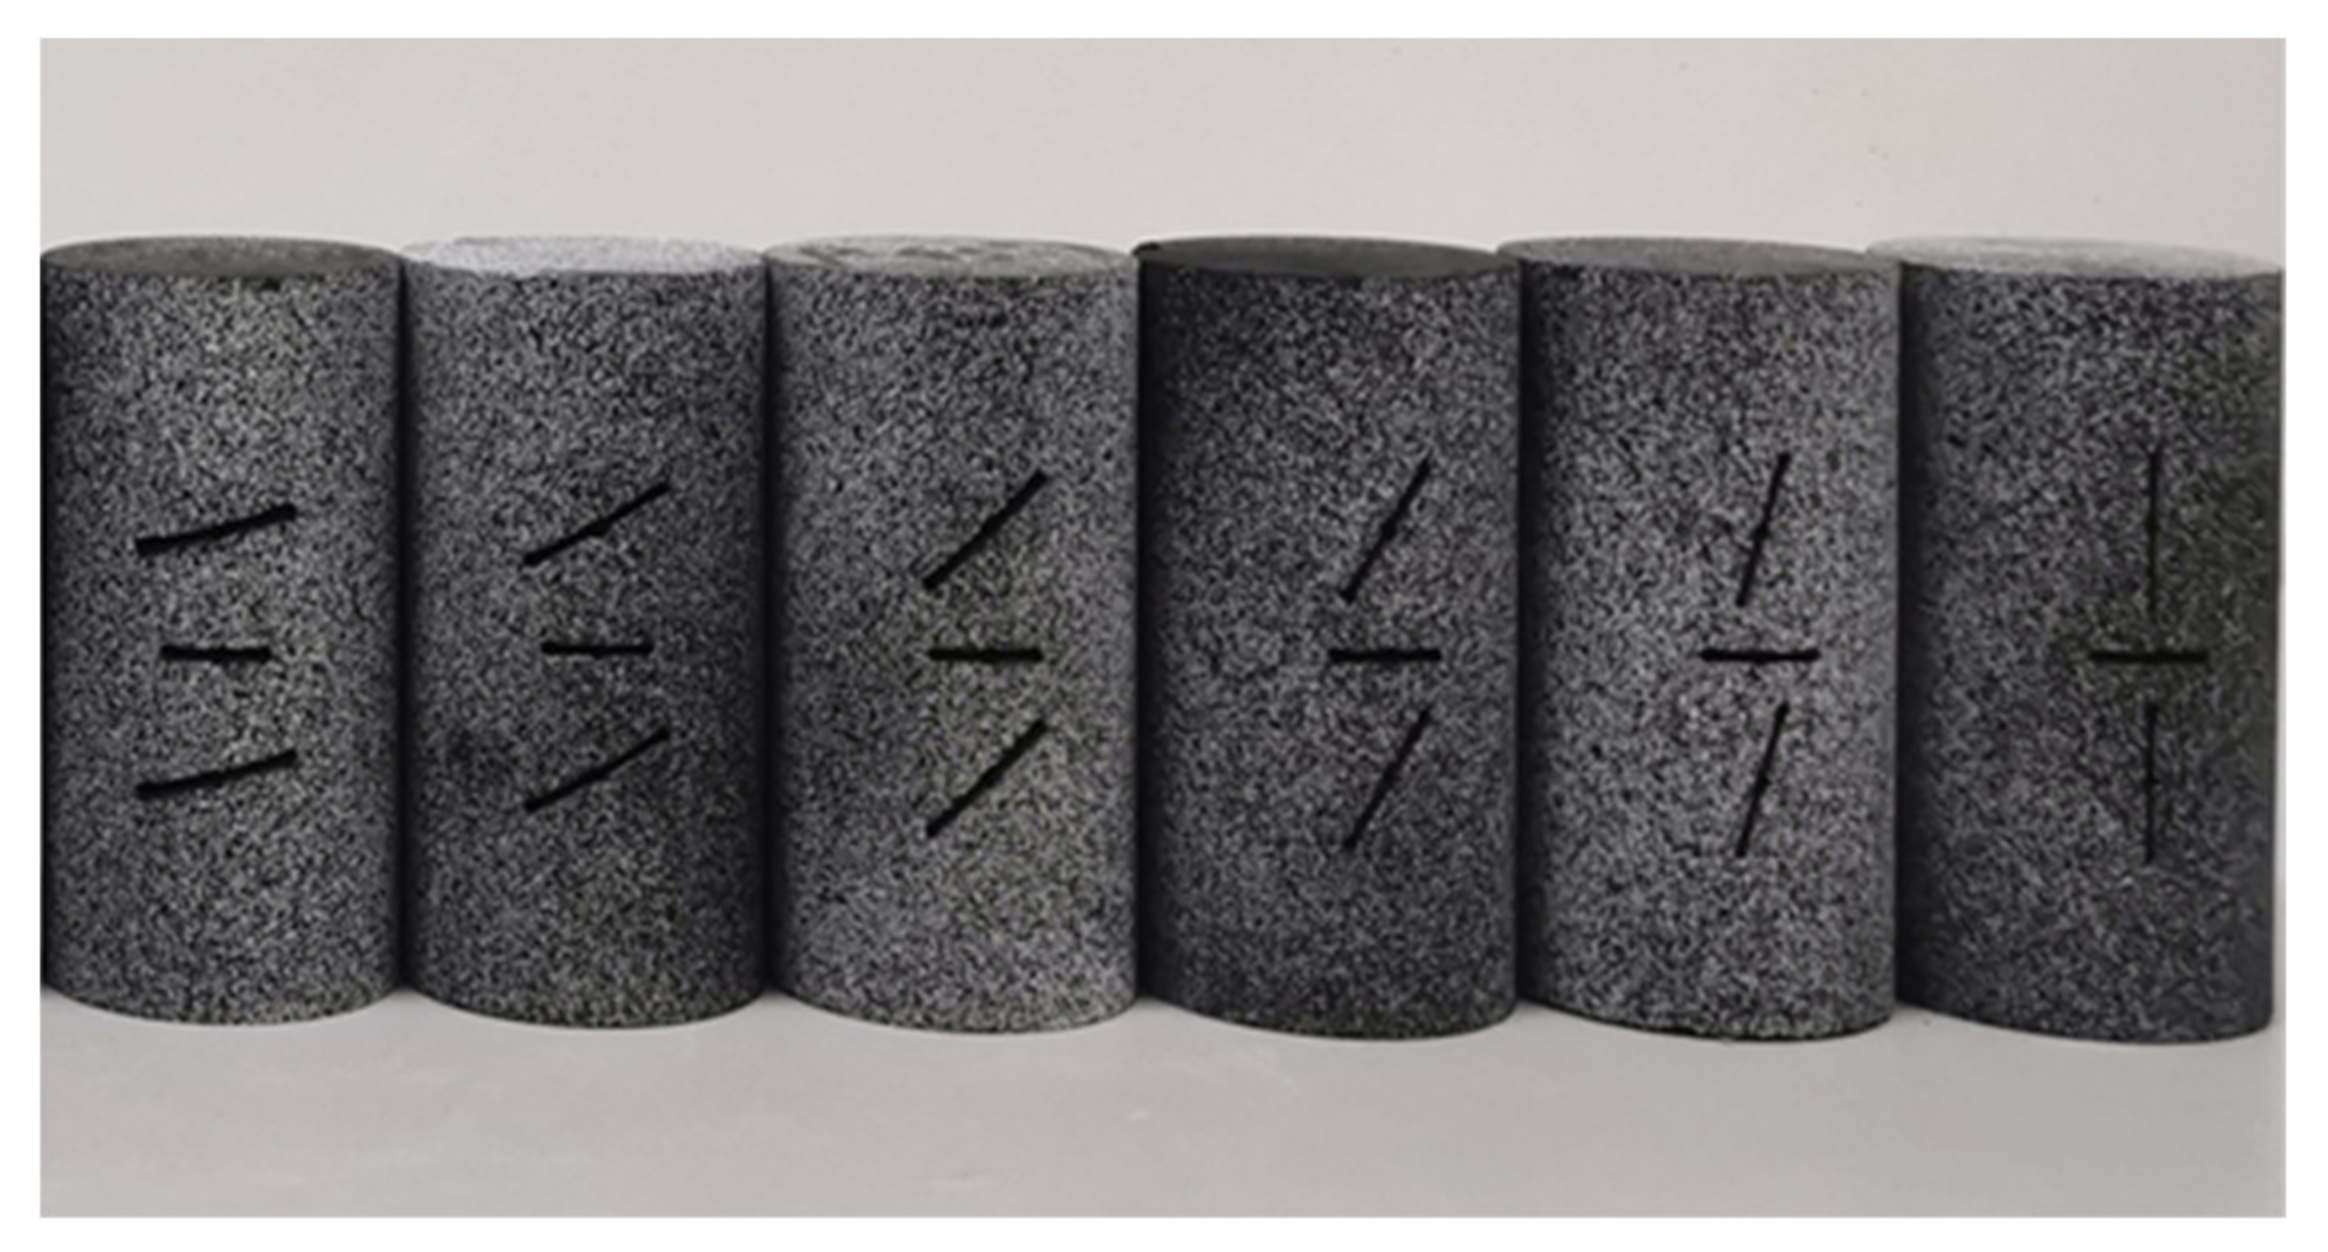
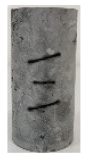
Based on the multi-crack model shown in Figure 1, limestone was selected as the test material, which was fabricated by Jingcheng Geotechnical Service Department in Liuyang, China. The limestone specimen was a cylinder with a size of 50 mm × 100 mm (diameter × height), and the nonparallelism and nonperpendicularity of the end faces were both less than 0.02 mm, which meet the basic requirements of ISRM (International Society for Rock Mechanics). Three cracks were prefabricated on the limestone specimen, including two parallel cracks and one intermediate crack, all of which were cut by water jets. In the two parallel cracks, the upper crack is crack ① and the lower crack is crack ②, both of which are 2a in length (a = 10 mm) and b in width (b = 1.2 mm). The distance D between the midpoints of cracks ① and ② is a fixed value of 33 mm, and the angles between them and the horizontal direction are both α. α changes from 15° to 90°, with an increment of 15°. The middle crack is crack ③, where the midpoint is located in the specimen center; it has a length of c (c = 13 mm) and a width of b (b = 1.2 mm). The angle between the middle crack and the horizontal direction is β, and β is always 0°. It is worth noting that the midpoints of the parallel cracks and the intermediate crack are all on the central axis of the specimens. Figure 2 shows the information of all the specimens, and Table 1 shows the specimen schemes. In the uniaxial compression test, displacement loading was selected for loading at a loading rate of 0.12 mm/min. Meanwhile, a digital speckle system was set-up to monitor the strain field on the specimens’ surface, as shown in Figure 3. To reduce the discreteness of the test, three specimens were taken for each test group.
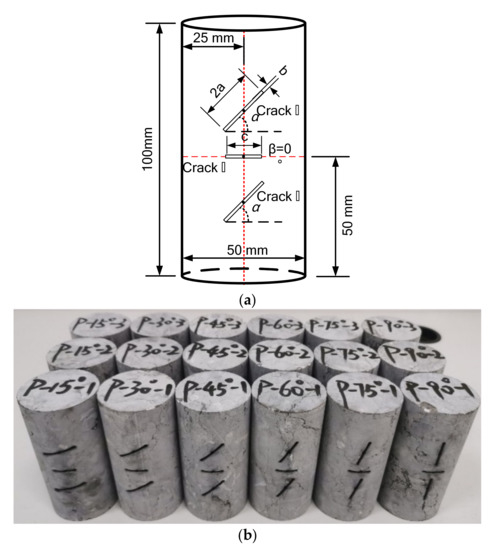
Figure 2.
Images of the fractured limestone model and the specimens: (a) schematic diagram of the fractured limestone model; (b) fractured limestone specimens.

Table 1.
Test scheme.
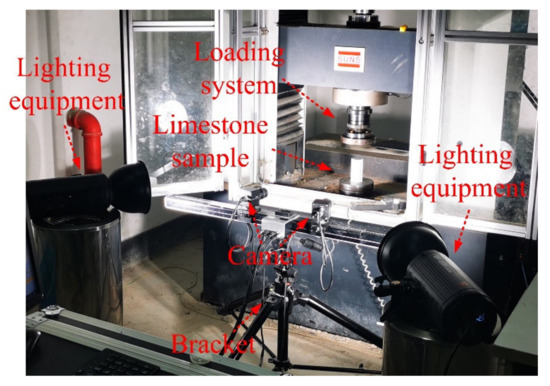
Figure 3.
Test site image.
2.3. Test Steps
(1) Spray speckle on the surface of the fractured limestone specimens, and the speckle distribution on the surface should be uniform and dense, as shown in Figure 4.
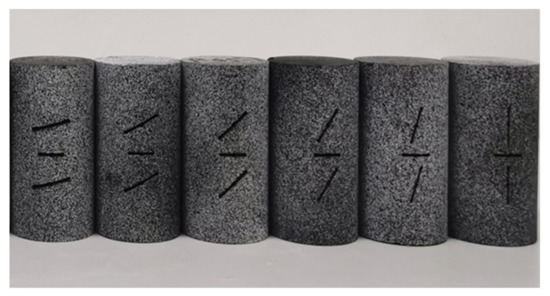
Figure 4.
Limestone specimens sprayed with speckle.
(2) Install the camera on the bracket; determine the specimen size and calculate the required measurement distance accordingly; place the bracket, adjust the camera’s focal length and spacing, and set-up the lighting equipment on both sides of the device.
(3) Select the appropriate calibration plate to calibrate the camera and ensure the calibration error is within 0.05 pixels.
(4) Load the limestone specimens in the universal testing machine at a loading rate of 0.12 mm/min.
(5) Collect data synchronously with a 3D digital speckle observation system during the uniaxial compression process, with the acquisition frequency being 10 images per second.
(6) Process the images taken with the post-processing software of the 3D digital speckle system and calculate the strain field on the surface of the fractured limestone specimens during the uniaxial compression process. Meanwhile, the real-time pictures taken by the camera is used to draw the crack propagation nephogram of the limestones’ surface.
3. Mechanical Characteristics
3.1. Stress–Strain Curve
Figure 5 shows the stress–strain curves of some limestone specimens with different parallel crack inclination angles under uniaxial compression.
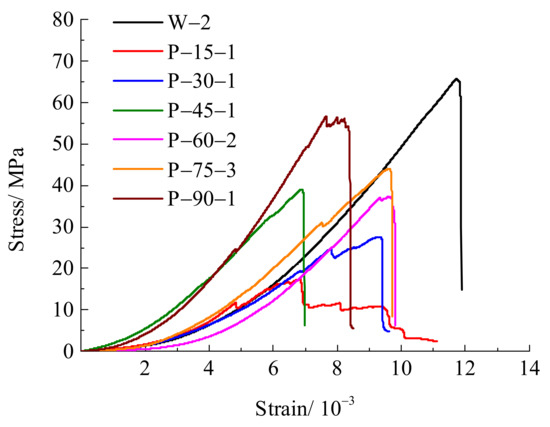
Figure 5.
Stress–strain curves of the limestone specimens with prefabricated cracks.
Under uniaxial compression, the peak strength of the limestone specimens with cracks is lower than that of the specimens without cracks (Figure 5). Specimen P−15−1 shows a “stepped” drop in stress after the peak value, which is mainly caused by unstable crack growth, and it is a typical post–peak stress softening phenomenon [43].
3.2. Peak Strength
The peak strength of the complete limestone specimens and those with parallel crack changes can be obtained by uniaxial compression tests on different limestone specimens in Table 1. The obtained peak strengths are listed in Table 2.
Table 2.
Uniaxial compressive strength of each specimen.
The peak strength of each fractured limestone specimen is significantly lower than that of the intact limestone specimen, and the average compressive strength increases with the parallel crack inclination angle (Table 2). The minimum average peak stress of the specimens is 16.41 MPa (inclination angle α of 15°), and the maximum average peak stress of the specimens is 45.4 MPa (inclination angle α of 90°), which is 176.7% higher than the minimum peak stress.
4. Failure Process of the Limestone Specimens with Three Prefabricated Cracks
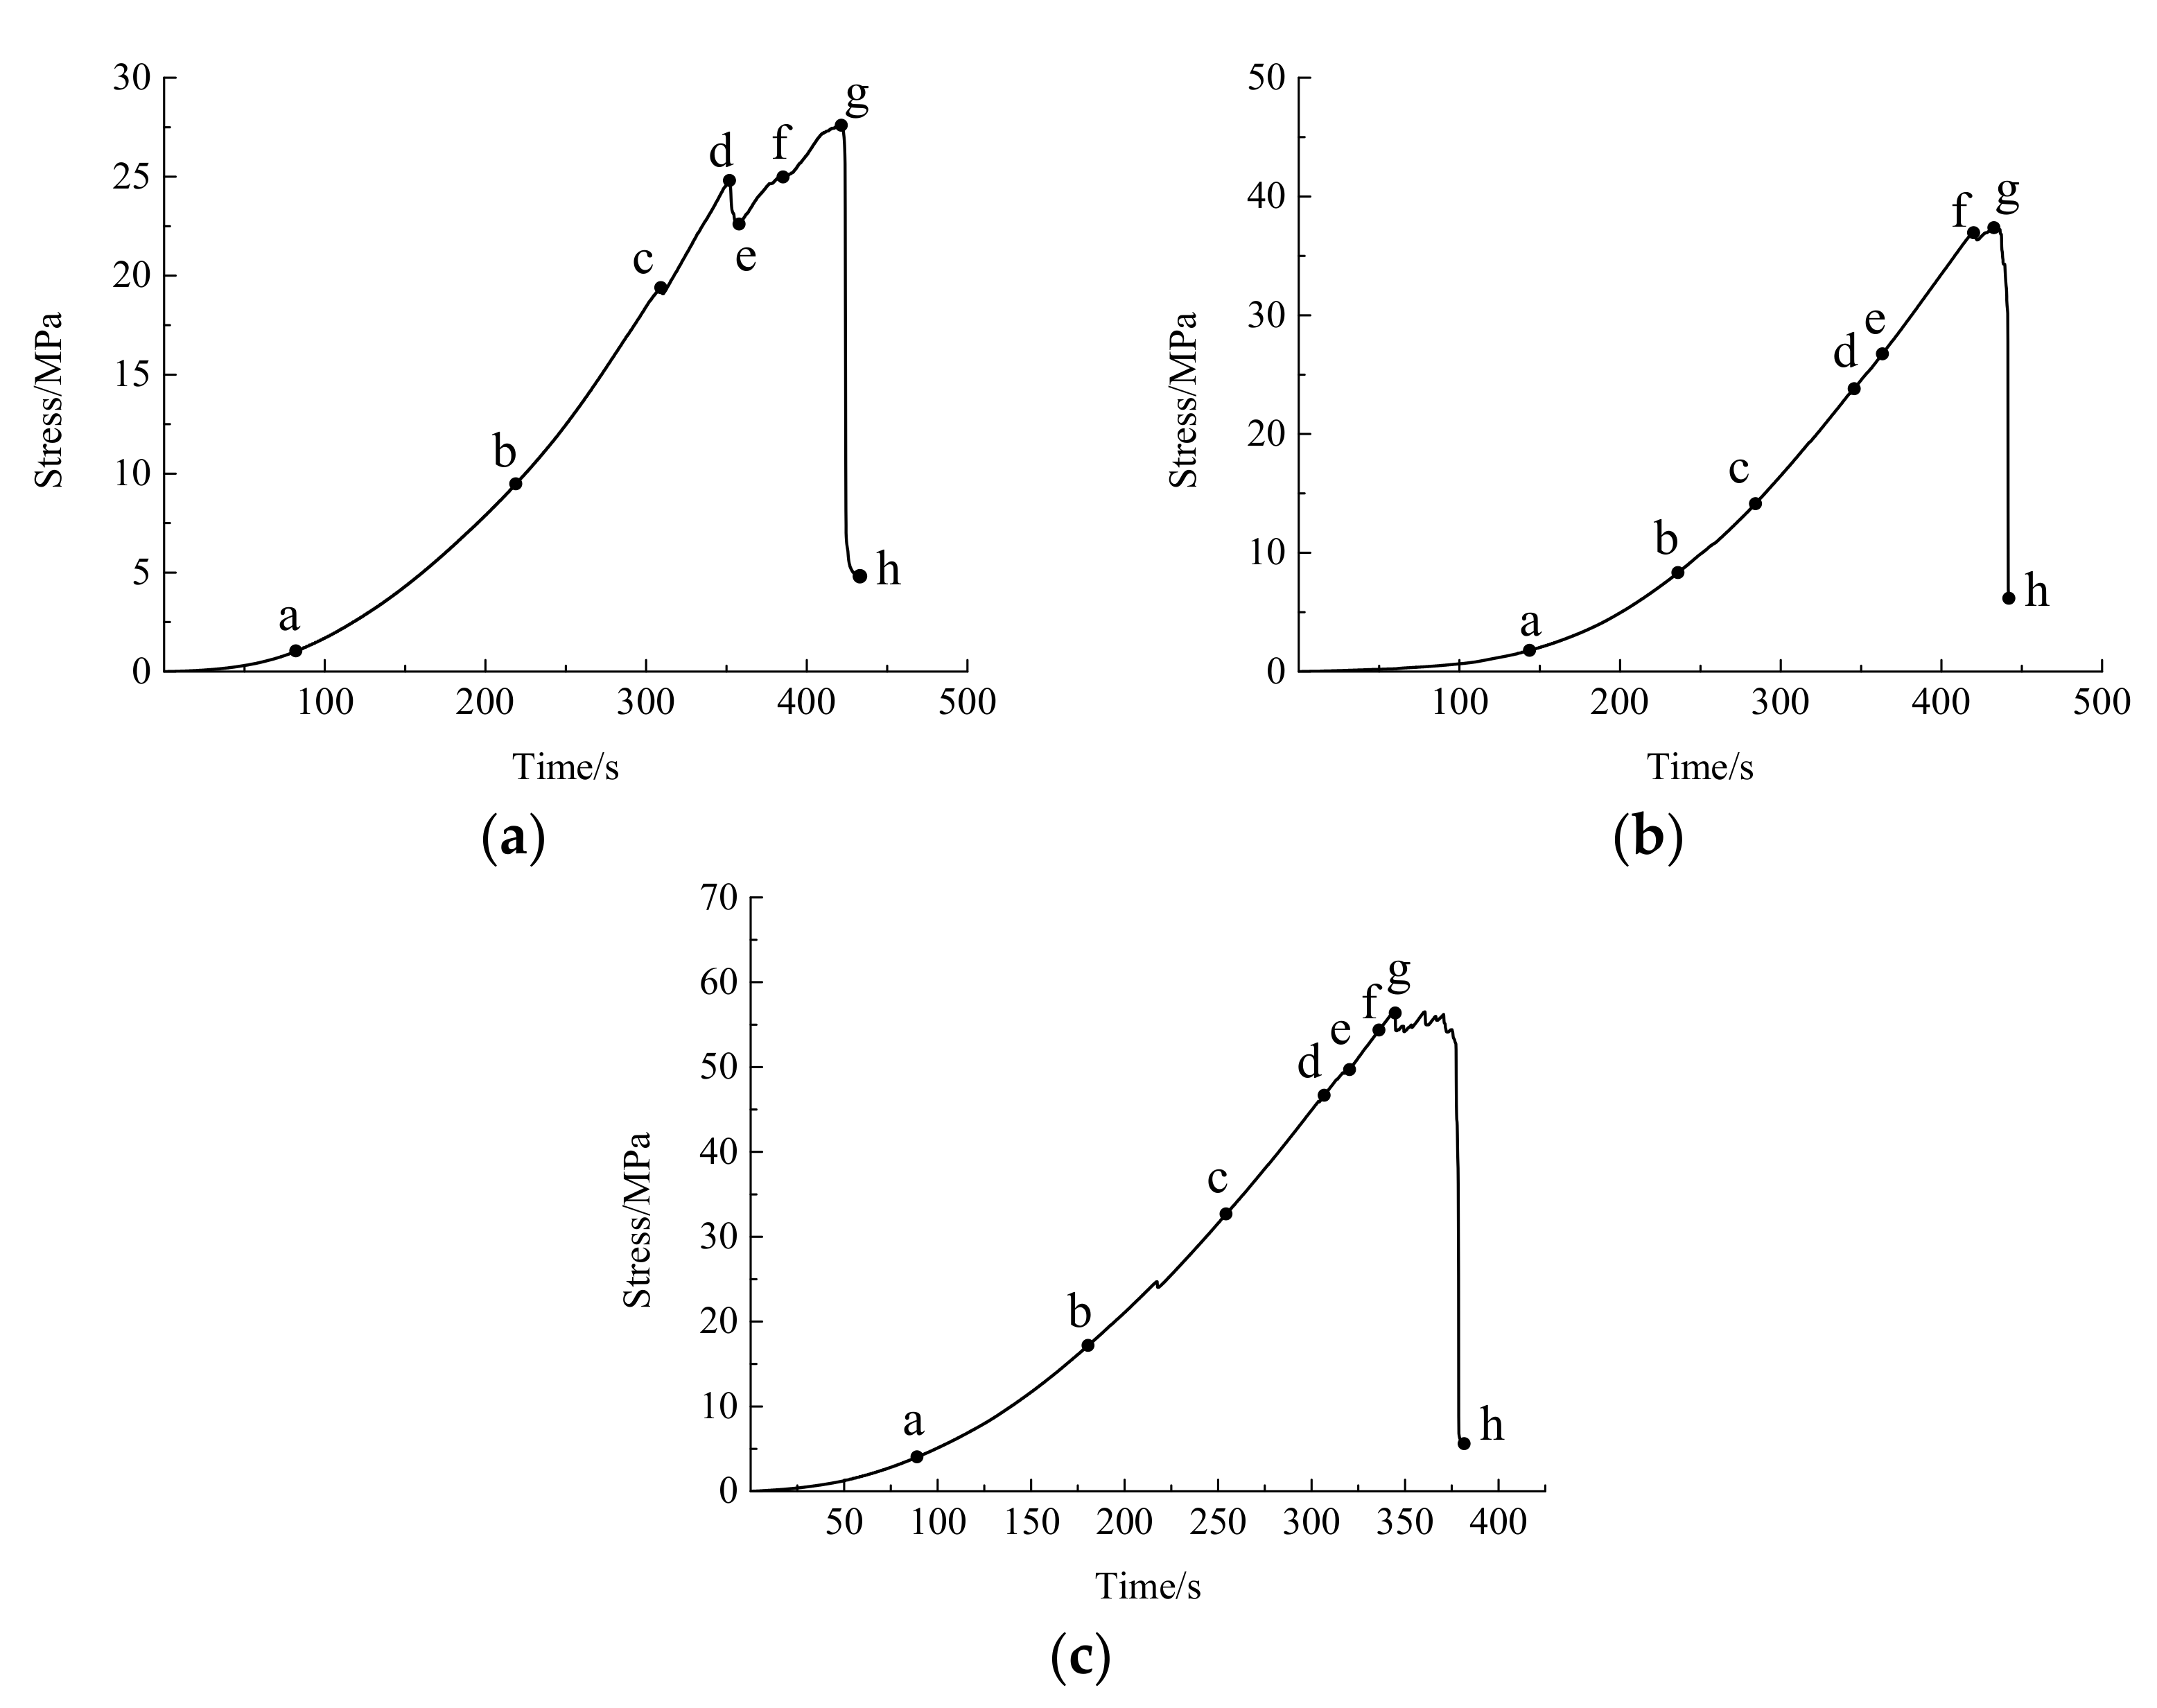
The uniaxial compression process of a rock can be divided into six stages: compaction stage, elastic stage, micro-fracture stage, unstable fracture stage, peak stage, and post–peak failure stage [44]. To facilitate the observation and study of the crack initiation, propagation, and coalescence processes, the stress–time curves for specimens P−30−1, P−60−2, and P−90−1 were plotted. Then, the characteristic points (a, b, c, d, e, f, g, h) on the stress–time curves were taken under each compression stage, in which one point each was taken at the compression stage, elastic stage, and micro-fracture stage and denoted as points a, b, and c. As there were many new cracks in the unstable fracture stage, three points were taken at this stage and recorded as point d, point e, and point f. A point each was taken at the peak and post-peak stages and denoted as point g and h, respectively, as shown in Figure 6.

Figure 6.
Stress–time curves for each specimen. (a) P−30−1; (b) P−60−2; (c) P−90−1.
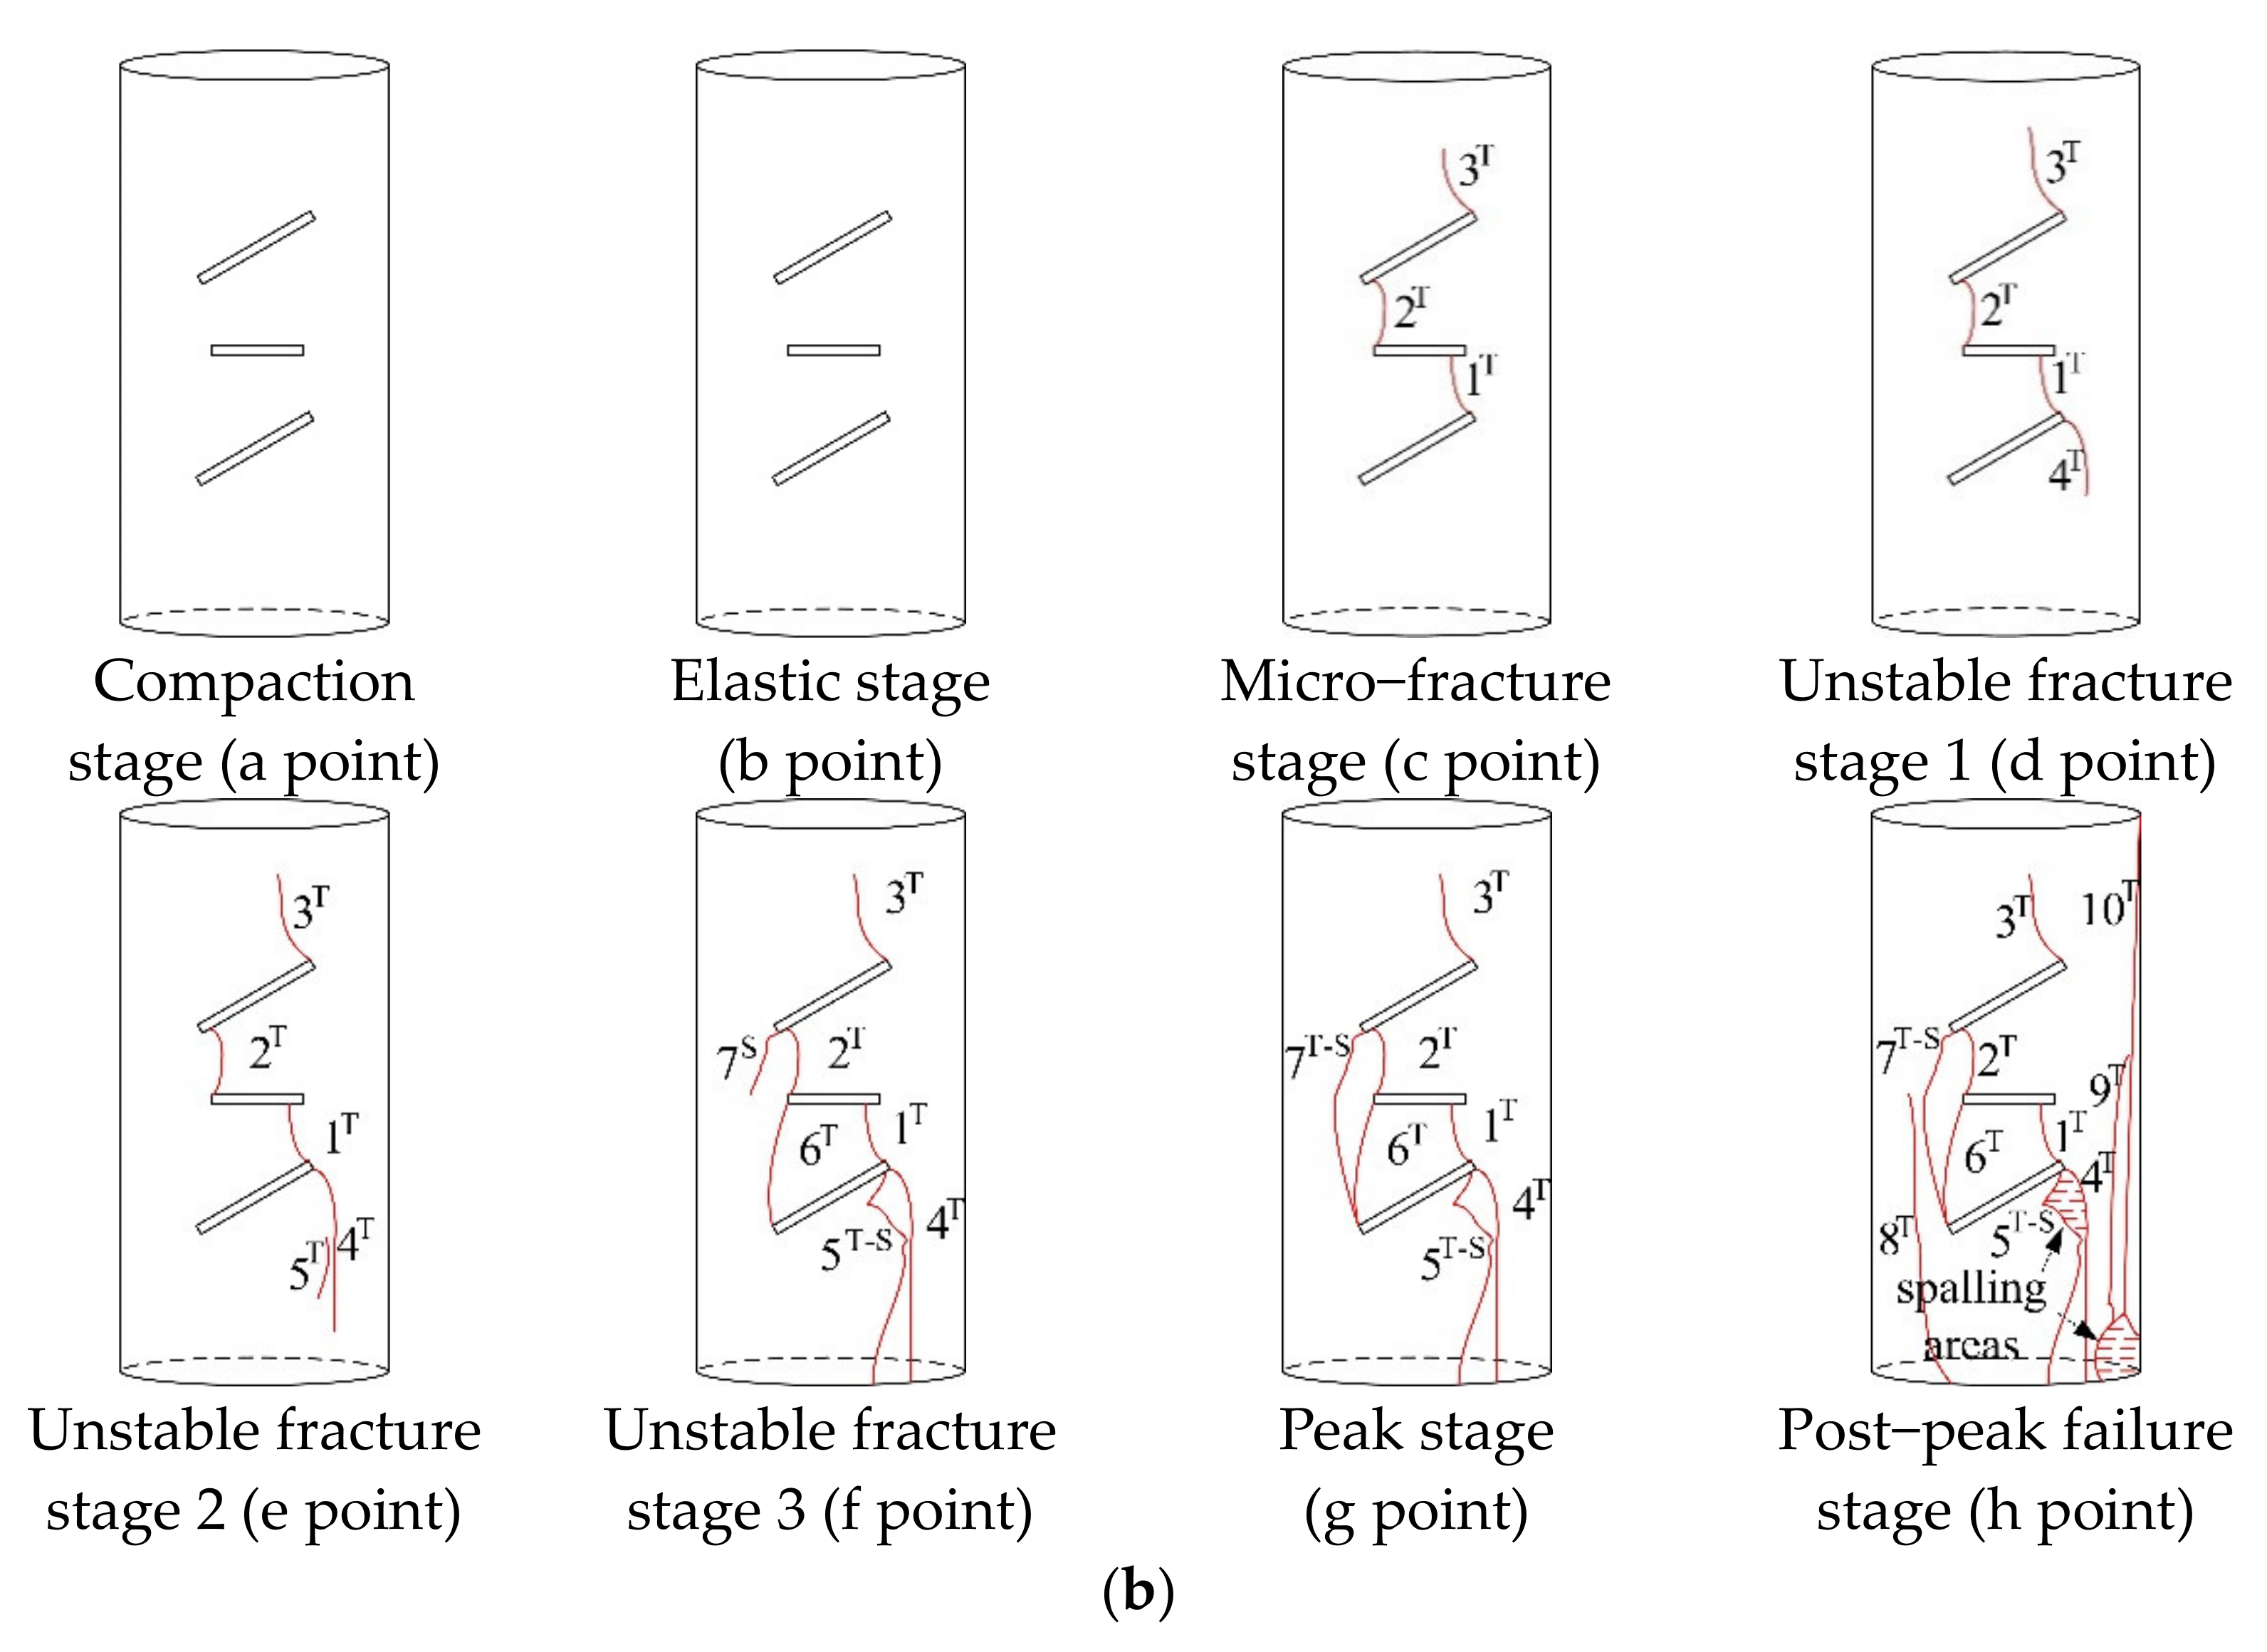
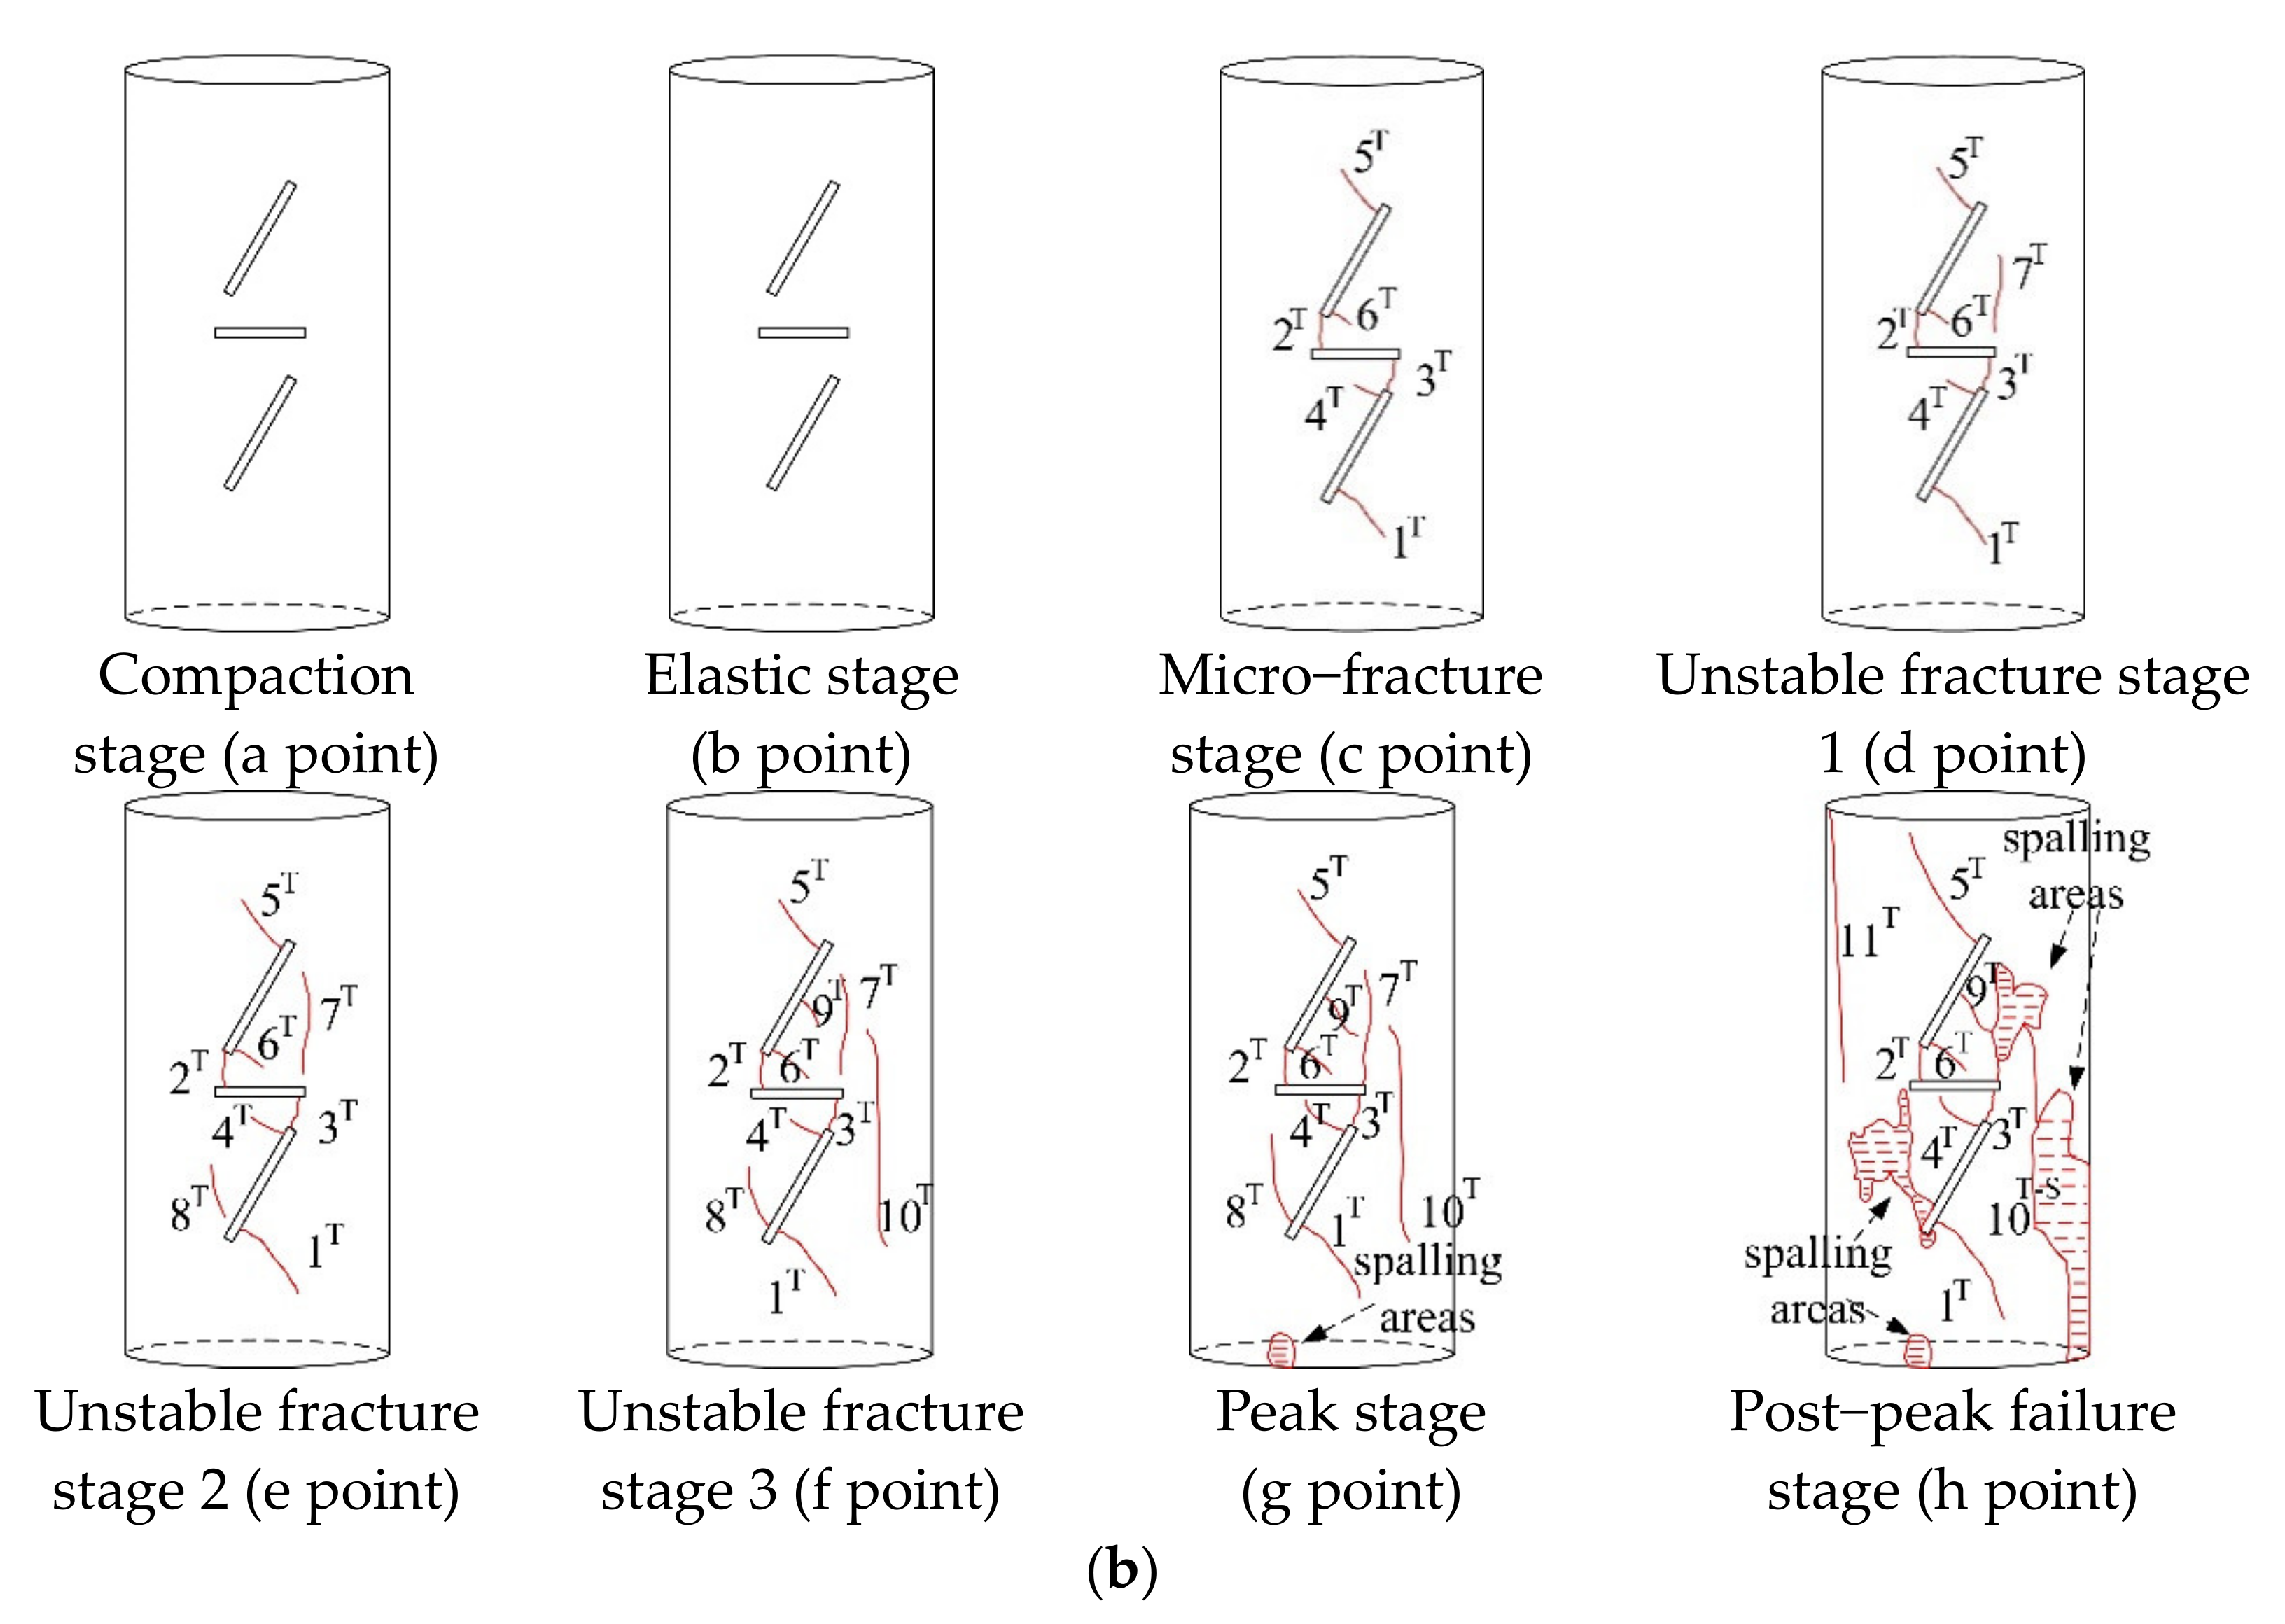
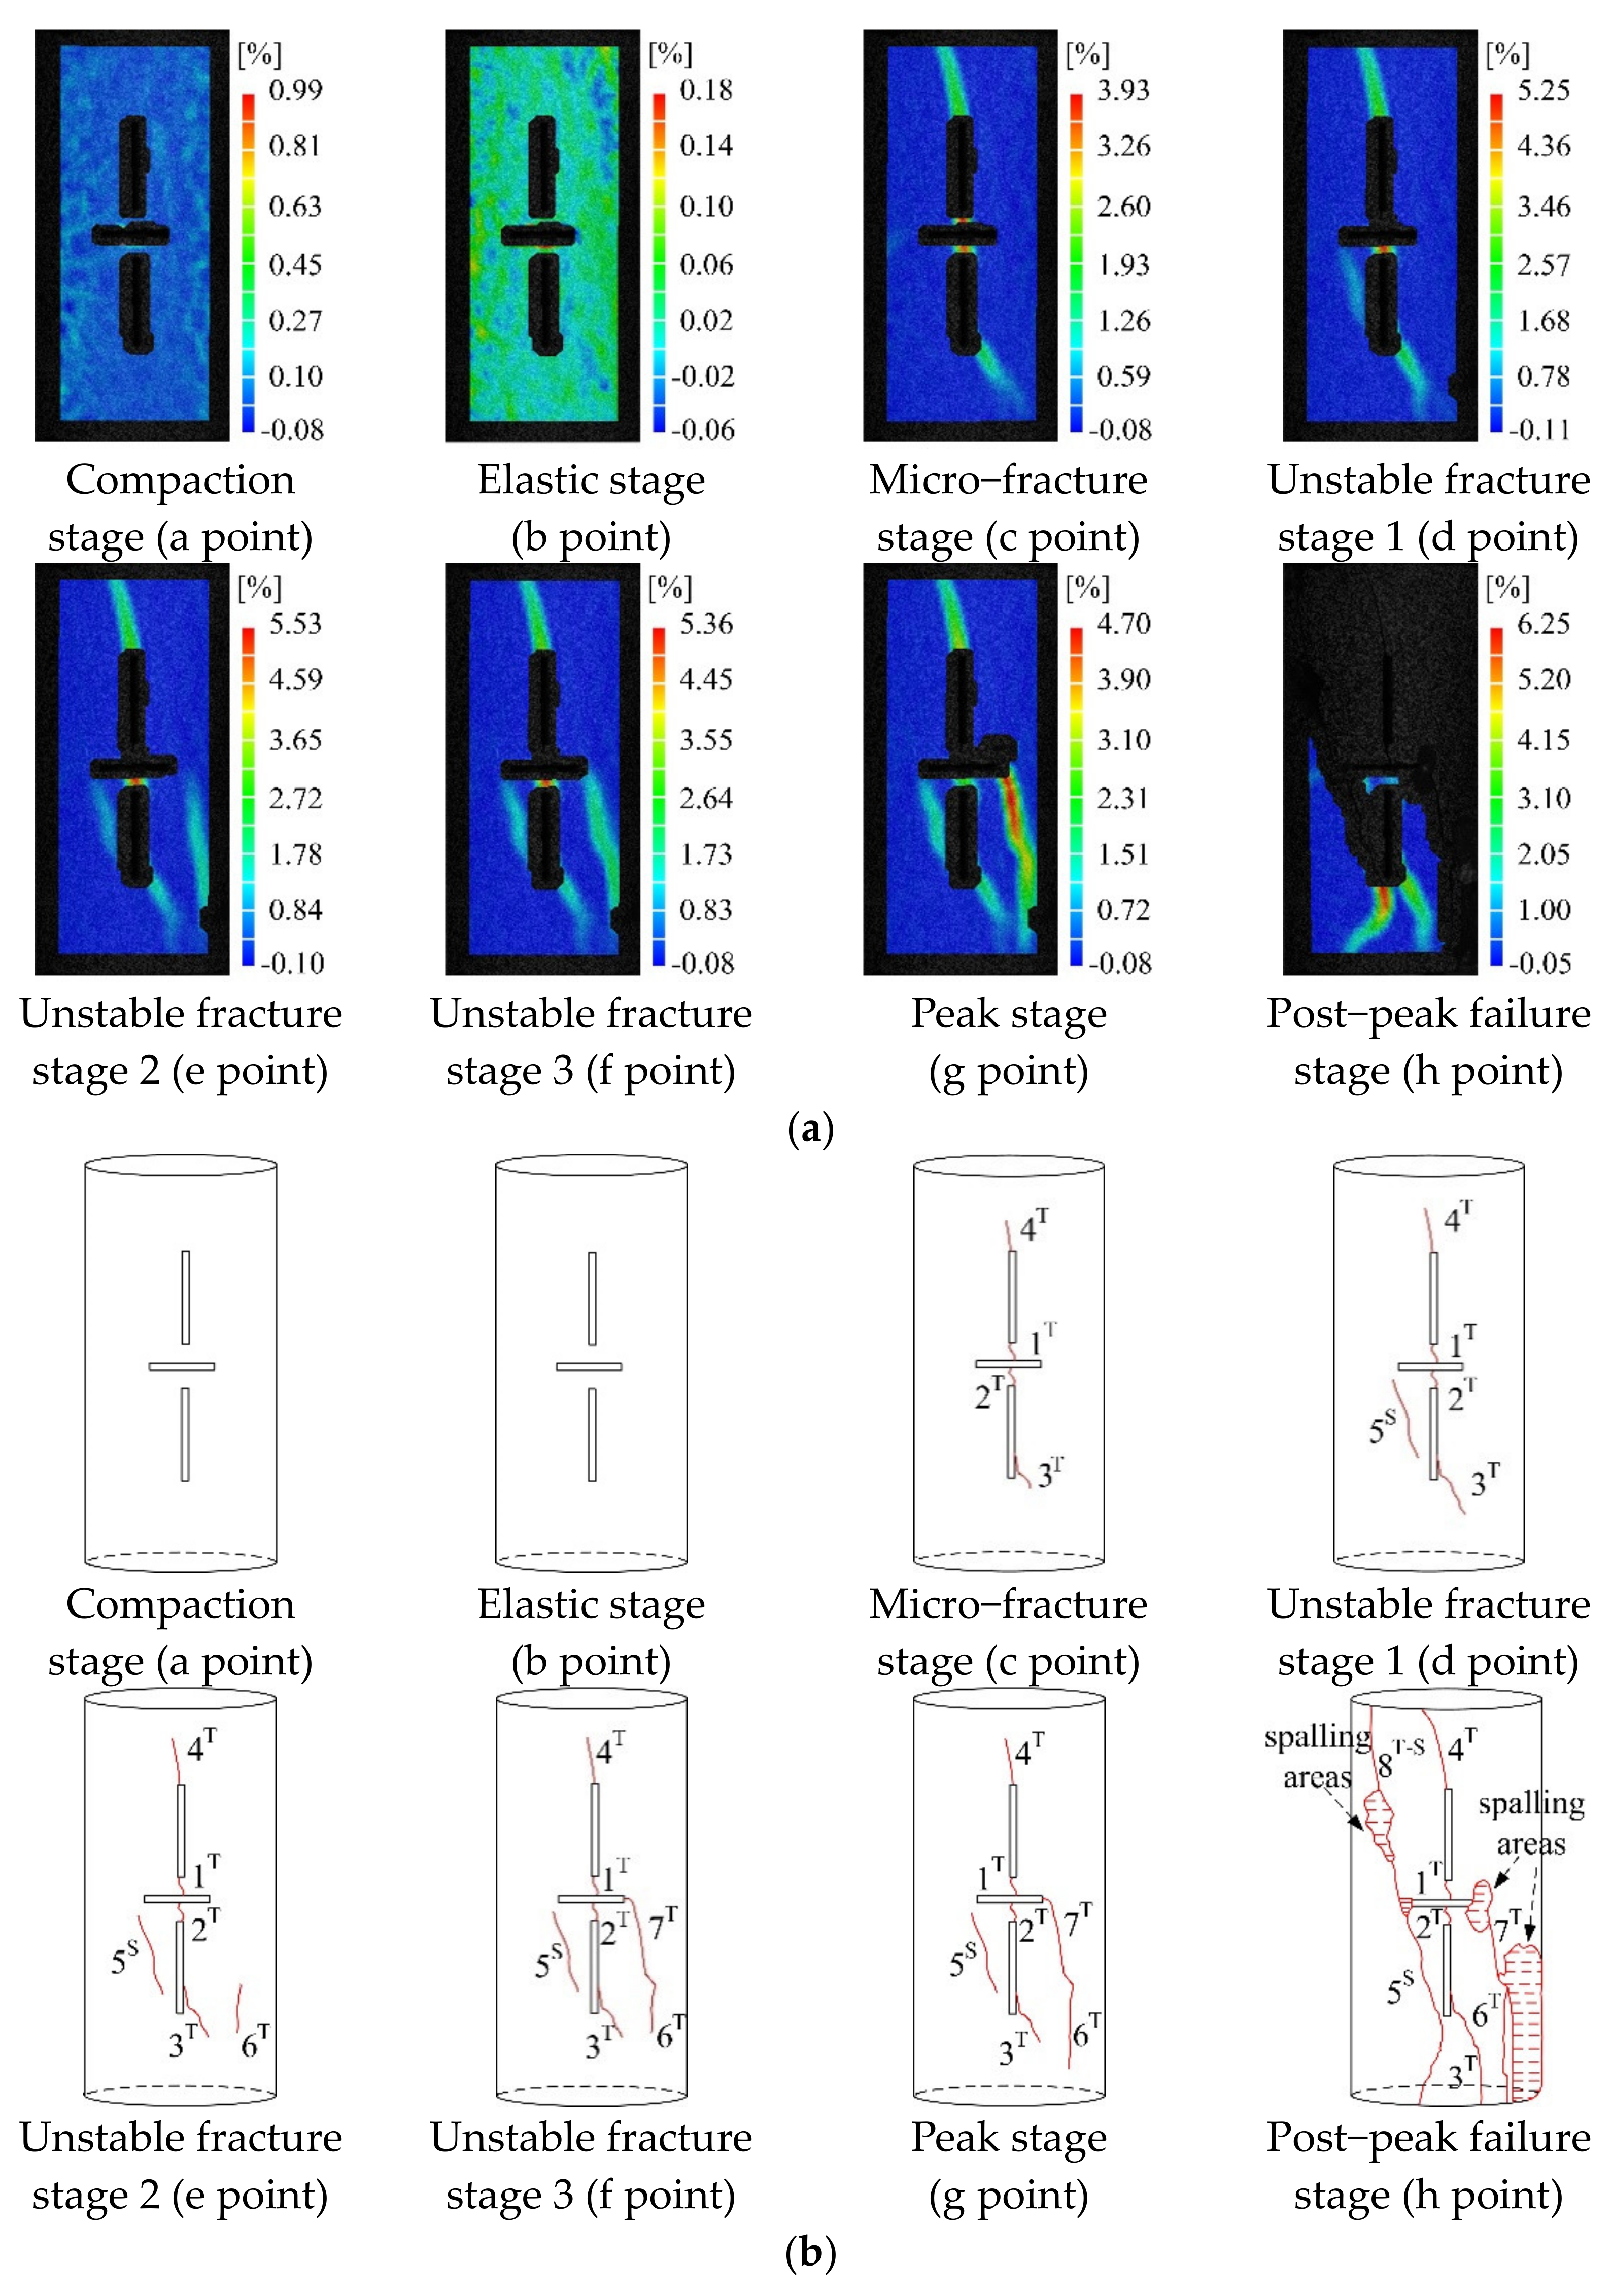
From the points provided in Figure 6, the principal strain nephograms and the schematic diagrams of the crack propagation nephogram for specimens P−30−1, P−60−2, and P−90−1 at each stage were extracted, as shown in Figure 7, Figure 8 and Figure 9. It is worth noting that the schematic diagrams of the crack propagation nephogram were drawn from real photos taken by the camera.
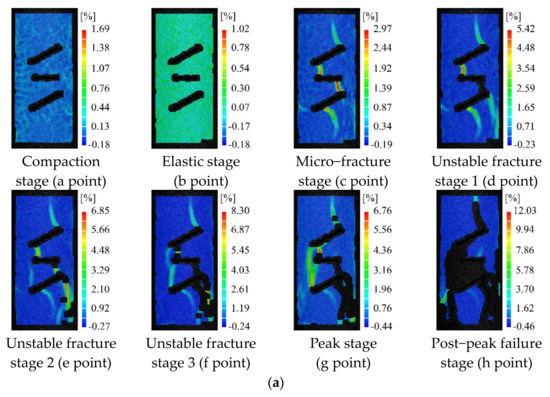

Figure 7.
Principal strain nephogram and schematic diagram of crack propagation for specimen P−30−1: (a) principal strain nephogram; (b) schematic diagrams of crack propagation on the surface.
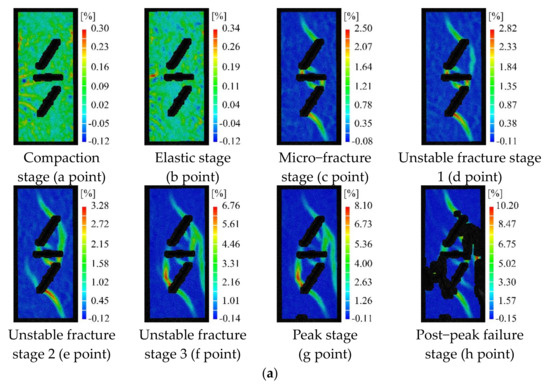
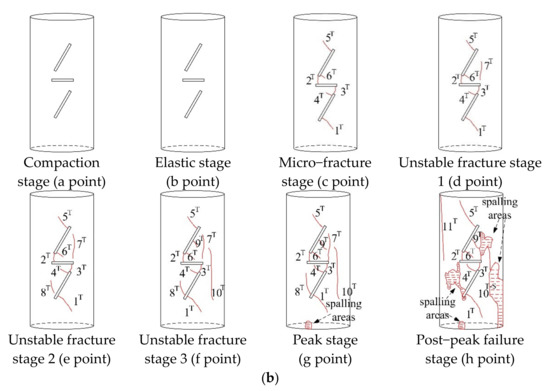
Figure 8.
Principal strain nephogram and schematic diagram of crack propagation on the surface of P−60−2: (a) principal strain nephogram; (b) schematic diagram of crack propagation on the surface.

Figure 9.
Principal strain nephogram and schematic diagram of crack propagation on the surface of P−90−1: (a) principal strain nephogram; (b) schematic diagram of crack propagation on the surface.
For the limestone specimens with parallel cracks of 30°, there is no strain concentration in the principal strain nephogram during the compression and elastic stages. The strain nephograms in these two stages are blue and green in general, and no cracks appear on the specimen surface. When the failure stage enters the micro-fracture stage, strain concentration areas appear above the right end of crack ①, below the middle of crack ②, between crack ① and crack ③, and between crack ② and crack ③. The maximum strain values of these areas are 0.009, 0.024, 0.022, and 0.03, respectively. As the material used is brittle and the tensile strength is only 3.71 MPa, the critical line strain, εlim = σ/E = 4.84 × 10⁻⁴ (E = 7661.6 MPa), can be obtained by using second strength theory, namely maximum elongation line strain theory [36,37,38,44]. In this case, the tensile principal strain values in the stress concentration area in the nephogram all exceed the critical line strain. It is considered that micro-cracks have formed in this area, that is, some points have broken up and formed micro-cracks, but the scope and density of the micro-cracks are not large, and the micro-cracks have not nucleated into macro-cracks. At this time, wing crack 1T appears at the right end of crack ② and connects to the right end of crack ③. Tensile crack 2T appears at the left end of crack ③ and connects to the left end of crack ①. Tensile crack 3T appears at the right end of crack ① and its development direction is toward the maximum compressive stress direction. Although there is a downward strain concentration area in the middle of crack ②, no crack appears. This phenomenon also appears in the literature [38]. That is, cracks will not necessarily occur in the area where strain concentration occurs. When the limestone specimens enter the unstable fracture stage under uniaxial compression, more new cracks form. One principal strain nephogram is not enough to show the emergence sequence of strain concentration areas. Therefore, the unstable fracture stage is divided into three sections for description.
In unstable fracture stage 1, the downward strain concentration area appears at the right end of crack ②, where the maximum strain value is 0.021, indicating that tensile crack 4T that is developing downward appears at the right end of crack ②. In unstable fracture stage 2, wing crack 3T and tensile crack 4T continue to develop upward and downward in the direction of maximum compressive stress, while tensile crack 5T appears on the left side of tensile crack 4T. As tensile crack 5T appears suddenly and has a certain width, there is no obvious strain concentration area in the principal strain nephogram, but a small failure area is formed. In the unstable fracture stage 3, tensile crack 5T rapidly expands to the right end of crack ② and the bottom of the specimen, and finally becomes a tensile-shear composite crack, denoted as 5T-S. Meanwhile, a strain concentration area appears between the left end of crack ② and the left end of crack ③, where the maximum strain value reaches 0.026, indicating the presence of tensile crack 6T here. There is also a strain concentration area at the left end of crack ① with a maximum strain of 0.023, where the inclined secondary crack 7S is generated. At the peak stage, the strain concentration area at the left end of crack ① is connected to the left end of crack ②. At this time, the maximum strain value reaches 0.044, representing that the inclined secondary crack 7S develops toward the left end of crack ② and finally connects with it. This 7S crack also transforms from a shear crack to a tensile-shear composite crack, denoted as 7T-S. At the post-peak failure stage, the limestone specimens suffer damage very quickly, and a large number of damage areas appear in the principal strain nephogram. At this stage, tensile cracks 8T, 9T, and 10T form, and spalling areas appear near the right end of crack ② and at the right bottom of the specimen.
As shown in Figure 8, the limestone specimen with the parallel cracks of 60° also has no strain concentration in its principal strain nephogram and no crack on its surface at the compaction and elastic stages. During the stable micro-fracture development stage, obvious strain concentration areas appear under the left end of crack ②, between the left end of crack ① and the left end of crack ③, between the right end of crack ② and the right end of crack ③, upper left of the right end of crack ②, lower right of the left end of crack ①, and above the right end of crack ①. The maximum strain values in these areas are 0.021, 0.025, 0.018, 0.016, 0.012, and 0.01, respectively, which all exceed the critical line strain. It is considered that wing cracks 1T, 2T, 3T, 4T, 5T, and 6T occur in these areas.
In unstable fracture stage 1, a strain concentration area occurs between the right end of crack ① and the right end of crack ③, with a maximum strain value of 0.009, resulting in the generation of tensile crack 7T. In unstable fracture stage 2, a strain concentration area occurs at the top left of the left end of crack ②, with a maximum strain value of 0.01, resulting in the generation of tensile crack 8T. In the unstable fracture stage 3, two strain concentration areas appear under the middle of crack ① and on the right side of the specimen, with maximum strain values of 0.022 and 0.033, respectively. Tensile cracks 9T and 10T are generated at these two locations, where tensile cracks 10T and 7T tend to intersect. At the peak stage, no new cracks appear on the specimen’s surface, with only a small spalling area appearing at the specimen’s bottom. During the post-peak failure stage, the cracks that previously appeared rapidly propagate toward the upper and lower ends of the specimen, and tensile crack 10T becomes a tensile-shear composite crack when it propagates downward. The principal strain nephogram shows extensive damage due to the spalling areas on the specimen’s surface.
As shown in Figure 9, the principal strain nephogram for the limestone specimen with parallel cracks of 90° in the compaction and elastic stages is consistent with those of the above two groups of specimens; there is no strain concentration and no crack appears on the specimen’s surface. Under uniaxial compression, strain concentration areas appear between crack ① and crack ③, between crack ② and crack ③, at the lower right of the lower end of crack ②, and above the upper end of crack ① when the specimen enters the micro-fracture stage. The maximum strain values in these areas are 0.039, 0.033, 0.019, and 0.022, respectively, which all exceed the critical line strain. It is considered that wing cracks 1T, 2T, 3T, and 4T occur in these areas. When the specimen enters the unstable fracture stage 1 under uniaxial compression, a sloping strain concentration area appears on the left side of crack ②, with a maximum strain value of 0.012, where the generated crack is shear crack 5S. In the unstable fracture stage 2, a strain concentration area appears on the right side of crack ②, with a maximum strain value of 0.018, where tensile crack 6T forms. In the unstable fracture stage 3, the strain concentration area where tensile crack 6T is located extends toward the left end of crack ③ and the maximum strain value changes from 0.019 to 0.023. Tensile crack 7T appears here and is connected with the upper end of the previously generated tensile crack 6T and the left end of crack ③. At the peak stage, no new cracks occur, but the previously generated cracks all propagate slightly. In the post-peak failure stage, the cracks on the specimen propagate relatively rapidly and a lot of spalling areas appear. Wing cracks 3T and 4T and shear crack 5S rapidly penetrate through both ends of the specimen along their respective propagation directions. At the same time, a tensile-shear composite crack 8T-S is produced, which connects the left end of crack ③ to the specimen’s top.
In conclusion, using maximum elongation line strain theory as the criterion to identify crack initiation shows that the evolution process of the principal strain field agrees well with the crack initiation, propagation, coalescence, and penetration processes. The strain concentration area on the limestone specimens’ surface occurs first in the micro-fracture stage. Most of these first strain concentration areas are concentrated at the end of the prefabricated crack and all the cracks generated at this stage are wing cracks. As loading proceeds, the strain concentration areas increase when the specimen enters the unstable fracture stage, which indicates that there are more micro-cracks generated in this stage. In addition to tensile cracks, more shear cracks may also occur in this stage as compared with the micro-fracture stage. At the peak stage, the specimen is at the edge of failure and there is basically no new crack on the specimen’s surface. During the post-peak failure stage, with the stress dropping suddenly, more new cracks and a large number of spalling areas rapidly appear on the specimen’s surface, while the previously generated cracks rapidly penetrate the entire specimen and finally lead to the failure of the specimen. It is also not difficult to see that the crack development process is the continuous propagation process of high strain areas and also the process of the continuous initiation, development, and centralized nucleation of micro-cracks to form macro-cracks. It is worth noting that in this experiment, there are cases where there is a strain concentration area and no cracks appear in this area. This is due to the fact that during uniaxial compression, this region does not reach the maximum strain value at which cracks can occur, and during subsequent loading, this region achieves an internal structural stability that makes it difficult for new cracks to appear. This should be related to the degree of homogeneity inside the material. This phenomenon does not affect the above conclusions.
5. Crack Coalescence Characteristics of Limestone Specimens with Three Prefabricated Cracks
Analyzing the failure process of the limestone specimens with different parallel cracks, as presented in Section 3, it can be found that the coalescence characteristics between the three prefabricated cracks change with the change in the parallel crack inclination angle, α, as shown in Figure 10.
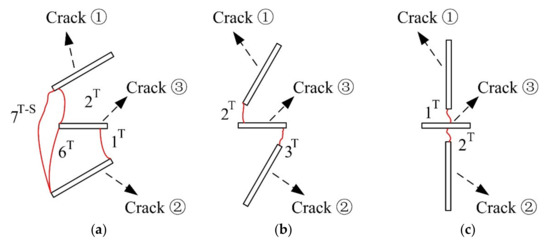
Figure 10.
Schematic diagram of crack coalescence on the limestones’ surface with different parallel cracks: (a) P−30−1; (b) P−60−2; (c) P−90−1.
When the parallel crack inclination angle is 30°, a coalescence occurs between the left end of crack ① and the left end of crack ②, and the coalescing crack is a tensile-shear crack called 7T-S. There is coalescence between the left end of crack ① and the left end of crack ③, and the coalescing crack is wing crack (tensile crack) 2T. There are two coalescences between the two ends of crack ② and crack ③, and the coalescing cracks are tensile cracks 1T and 6T, respectively (Figure 10). When the parallel crack inclination angle is 60°, a coalescence occurs between the left end of crack ① and the left end of crack ③, and the coalescing crack is wing crack 2T. There is coalescence between the right end of crack ② and the right end of crack ③, and the coalescing crack is wing crack 3T. When the parallel crack inclination angle is 90°, the lower end of crack ① and the upper end of crack ② coalesce with the middle part of crack ③ at two respective locations, and the coalescing cracks are wing cracks 1T and 2T, respectively.
In conclusion, when the parallel crack inclination angle is smaller, the coalescence between the parallel crack and the intermediate crack is mostly a coalescence between the crack tips, and the coalescence cracks not only include tensile cracks but also tensile-shear composite cracks. As the inclination angle increases, coalescence occurs between the end of the parallel crack and the middle of the intermediate crack, and the coalescing crack is a tensile crack. This means that with the increase in the inclination angle of the parallel crack, the stress concentration area on the intermediate crack will transfer from both ends to the middle of the crack. Meanwhile, the coalescing crack type between the parallel crack and the intermediate crack changes from the coexistence of a tensile crack and a tensile-shear crack to a single tensile crack.
6. Failure Modes of the Limestone Specimens with Three Prefabricated Cracks
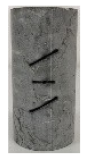
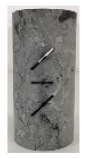
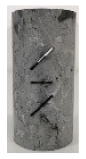
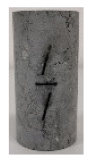
The final failure pictures of limestone specimens P−30−1, P−60−2, and P−90−2 were selected to analyze the failure mode of the limestone with different parallel cracks, as shown in Figure 11.
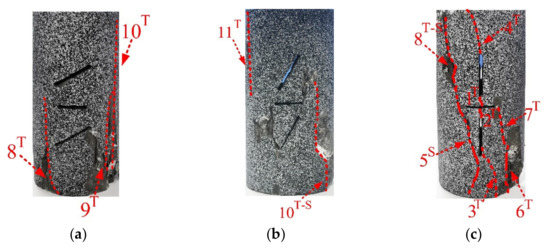
Figure 11.
Final failure image of the three groups of specimens with different parallel crack inclination angles: (a) P−30−1; (b) P−60−2; (c) P−90−1.
When the parallel crack inclination angle α is 30°, the final failure of specimens is mainly affected by three cracks: tensile cracks 8T, 9T, and 10T. Tensile crack 10T penetrates through the upper and lower ends of the specimens and the overall failure is split failure. When the parallel crack inclination angle α is 60°, the final failure of the specimens is mainly affected by two cracks: tensile-shear composite crack 10T-S and tensile crack 11T. A tensile crack occurs on the left side of the specimen and a tensile-shear crack occurs on the right side. When the parallel crack inclination angle α is 90°, the final failure of the specimens is mainly affected by eight cracks: tensile cracks 1T, 2T, 3T. 4T, 6T, and 7T, shear crack 5S, and tensile-shear composite crack 8T-S. Among them, shear crack 5S and tensile-shear composite crack 8T-S coalesce together and penetrate through the upper and lower ends of the specimen, and the left half of the specimen suffers from tensile-shear fracture, while tensile cracks 1T, 2T, 3T, and 4T coalesce with cracks ① and ②, and splitting failure occurs in the middle part of the specimen. It can be seen that with the increase in the parallel crack inclination angle, the failure of the fractured limestone specimens changes from simple splitting failure to the coexistence of tension-shear failure and splitting failure.
7. Conclusions
The 3D-DIC technology was used to observe the uniaxial compression process of fractured limestone, and the entire process of crack initiation, propagation, coalescence, and penetration was analyzed using the obtained principal strain nephogram, which provided an effective method to study the process of rock failure. It was found that:
(1) The peak strength of each fractured limestone specimen is significantly lower than that of the intact limestone specimen, and the average compressive strength tends to increase with the parallel crack inclination angle. The minimum average peak stress of the specimen is 16.41 MPa (inclination angle α of 15°), and the maximum average peak stress of the specimen is 45.4 MPa (inclination angle α of 90°), which is 176.7% higher than the minimum peak stress.
(2) The maximum elongation line strain theory is used as the criterion to identify crack initiation. It is found that the evolution process of the principal strain field agrees well with the crack initiation, propagation, coalescence, and penetration processes. The crack development process is the continuous propagation process of high strain areas and also the process of the continuous initiation, development, and centralized nucleation of micro-cracks to form macro-cracks.
(3) With the increase in the parallel crack inclination angle, the stress concentration area on the intermediate crack transfers from both ends of the crack to the middle. Meanwhile, the coalescing crack type between the parallel crack and the intermediate crack changes from a mixed tensile crack and tensile-shear crack to a single tensile crack.
(4) With the increase in the parallel crack inclination angle, the failure of the limestone specimens with cracks changes from simple splitting failure or tensile failure to the coexistence of tensile-shear fracture and splitting.
In this paper, 3D-DIC technology was used to carry out research on rock crack propagation. This technology can better record the crack propagation process. However, in this experiment, it was found that when the limestone sample entered the unstable fracture stage, in the strain-concentrated area of the sample surface, a partial rupture band appeared due to the expansion of the crack, so the 3D-DIC technique could not obtain the maximum principal strain value in this area. It is hoped that in future experiments, the measurement accuracy of 3D-DIC technology can be improved to achieve more precise research results. At the same time, it is hoped that other new technologies, such as infrared thermal imaging technology, can be used to jointly study rock crack propagation.
Author Contributions
Conceptualization, M.H.; methodology, Y.P. and X.C.; software, N.S.; validation, X.Z.; investigation, X.C.; resources, Y.P.; data curation, Q.Q.; writing—original draft preparation, X.C. All authors have read and agreed to the published version of the manuscript.
Funding
This research was funded by Zhejiang Public Welfare Technology Research Program/Social Development (No. LGF20D020002) and was funded by National Natural Science Foundation of China (No. 41702381).
Data Availability Statement
The data are available and explained in this article; readers can access the data supporting the conclusions of this study.
Acknowledgments
The authors of this paper would like to express our sincerest gratitude to Editor of this journal, and the anonymous reviewer for their valuable editorial and modification suggestions on the significant improvement of this article.
Conflicts of Interest
Authors declare no conflict of interest. The manuscript is approved by all authors for publication. I would like to declare on behalf of my coauthors that the work described is original and has not been previously published.
References
- Lajtai, E.Z. Brittle fracture in compression. Int. J. Fract. 1974, 10, 525–536. [Google Scholar] [CrossRef]
- Petit, J.; Barquins, M. Can natural faults propagate under Mode II conditions. Tectonics 1988, 7, 1243–1256. [Google Scholar] [CrossRef]
- Che, G.; Kemeny, J.; Harpalani, S. Fracture Propagation and Coalescence in Marble Plates with Pre-Cut Notches under Compression; Symposium on Fractured and Jointed Rock Mass: Lake Tahoe, CA, USA, 1992; pp. 443–448. [Google Scholar]
- Wong, L.N.Y.; Einstein, H.H. Systematic evaluation of cracking behavior in specimens containing single flaws under uniaxial compression. Int. J. Rock Mech. Min. Sci. 2009, 46, 239–249. [Google Scholar] [CrossRef]
- Lin, P.; Wong, R.H.C.; Wong, R.; Zhou, W. Crack growth mechanism and failure behavior of specimen containing single flaw with different angles. Chin. J. Rock Mech. Eng. 2005, 24, 5652–5657. [Google Scholar]
- Shengqi, Y.A.N.G. Study of strength failure and crack coalescence behavior of sandstone containing three pre-existing fissures. Rock Soil Mech. 2013, 34, 31–39. [Google Scholar]
- Liu, X.; Yin, Z.; Wang, Y. Mechanical properties and failure mode of rock mass containing V-type intersecting fissures. J. China Coal Soc. 2020, 45, 651–659. [Google Scholar]
- Xu, J.; Li, Z. Crack propagation and coalescence of Step-Path Failure in rock. Rock Mech. Rock Eng. 2019, 52, 965–979. [Google Scholar] [CrossRef]
- Dong, L.; Zhang, Y.; Sun, D.; Chen, Y.; Tang, Z. Stage characteristics of acoustic emission and identification of unstable crack state for granite fracture. Chin. J. Rock Mech. Eng. 2022, 41, 120–131. [Google Scholar]
- Sun, J.; Huang, Y.; Aslani, F.; Wang, X.; Ma, G. Mechanical enhancement for EMW-absorbing cementitious material using 3D concrete printing. J. Build. Eng. 2021, 41, 102763. [Google Scholar] [CrossRef]
- Sun, J.; Aslani, F.; Wei, J.; Wang, X. Electromagnetic absorption of copper fiber oriented composite using 3D printing. Constr. Build. Mater. 2021, 300, 124026. [Google Scholar] [CrossRef]
- Sun, J.; Aslani, F.; Lu, J.; Wang, L.; Huang, F. Fresh and mechanical behaviour of developed fibre-reinforced lightweight engineered cementitious composites for 3D concrete printing containing hollow glass microspheres. Ceram. Int. 2021, 47, 27107–27121. [Google Scholar] [CrossRef]
- Sun, J.; Huang, Y.; Aslani, F.; Ma, G. Properties of a double-layer EMW-absorbing structure containing a graded nano-sized absorbent combing extruded and sprayed 3D printing. Constr. Build. Mater. 2020, 261, 120031. [Google Scholar] [CrossRef]
- Sun, J.; Huang, Y.; Aslani, F.; Ma, G. Electromagnetic wave absorbing performance of 3D printed wave-shape copper solid cementitious element. Cem. Concr. Compos. 2020, 114, 103789. [Google Scholar] [CrossRef]
- Ma, G.; Sun, J.; Aslani, F.; Huang, Y.; Jiao, F. Review on electromagnetic wave absorbing capacity improvement of cementitious material. Constr. Build. Mater. 2020, 262, 120907. [Google Scholar] [CrossRef]
- Ge, X.R.; Ren, J.X.; Pu, Y.; Ma, W.; Zhu, Y. A real-in-time CT triaxial testing study of meso-damage evolution law of coal. Chin. J. Rock Mech. Eng. 1999, 18, 497–502. [Google Scholar]
- Ge, X.; Ren, J.; Pu, Y.; Ma, W.; Zhu, Y. CT real-time test of rock mesoscopic damage propagation law. Sci. China 2000, 23, 104–111. [Google Scholar]
- Li, S.; Li, T.; Wang, G.; Bai, S.W. CT real-time scanning tests on rock specimens with artificial initial crack under uniaxial conditions. Chin. J. Rock Mech. Eng. 2007, 26, 484–492. [Google Scholar]
- Li, T.C.; Lv, H.B.; Wang, H. CT real-time scanning tests on double cracks propagation under uniaxial compression. Rock Soil Mech. 2010, 31, 9–14. [Google Scholar]
- Zhao, C.; Yu, Z.M.; Wang, W.D.; Matsuda, H.; Morita, C. Meso-experimental study of failure mechanism of rock based on uniaxial compression test. Chin. J. Rock Mech. Eng. 2016, 35, 2490–2498. [Google Scholar]
- Da, D.; Yvonnet, J.; Xia, L.; Li, G. Topology optimization of particle-matrix composites for optimal fracture resistance taking into account interfacial damage. Int. J. Numer. Methods Eng. 2018, 115, 604–626. [Google Scholar] [CrossRef]
- Da, D.; Qian, X. Fracture resistance design through biomimicry and topology optimization. Extrem. Mech. Lett. 2020, 40, 100890. [Google Scholar] [CrossRef]
- Yamaguchi, I. A Iaser-speklestrain gage. J. Phys. E Sci. Instrum. 1981, 14, 1270–1273. [Google Scholar] [CrossRef]
- Peters, W.H.; Ranson, W.F. Digital image techniques in experimental stress analysis. Opt. Eng. 1982, 21, 427–431. [Google Scholar] [CrossRef]
- Sutton, M.A.; Wolters, W.J.; Peters, W.H.; Ranson, W.F.; McNeill, S.R. Determination of displacements using an improved digital correlation method. Elsevier 1983, 1, 133–139. [Google Scholar] [CrossRef]
- Sutton, M.A.; Mcneill, S.R.; Jang, J.; Babai, M. Effects of subpixel image restoration on digital correlation error estimates. Opt. Eng. 1988, 27, 870–877. [Google Scholar] [CrossRef]
- Russel, S.R.; Sutton, M.A. Image correlation quantitative NDE of impact and fabrication damage in a glass fiber reinforced composite system. J. Mater. Eval. 1989, 47, 550–561. [Google Scholar]
- Zhang, G.; Chen, C.; Li, K.; Xiao, F.; Sun, J.; Wang, Y.; Wang, X. Multi-objective optimisation design for GFRP tendon reinforced cemented soil. Constr. Build. Mater. 2022, 320, 126297. [Google Scholar] [CrossRef]
- Feng, W.; Wang, Y.; Sun, J.; Tang, Y.; Wu, D.; Jiang, Z.; Wang, J.; Wang, X. Prediction of thermo-mechanical properties of rubber-modified recycled aggregate concrete. Constr. Build. Mater. 2022, 318, 125970. [Google Scholar] [CrossRef]
- Sun, J.; Wang, X.; Zhang, J.; Xiao, F.; Sun, Y.; Ren, Z.; Zhang, G.; Liu, S.; Wang, Y. Multi-objective optimisation of a graphite-slag conductive composite applying a BAS-SVR based model. J. Build. Eng. 2021, 44, 103223. [Google Scholar] [CrossRef]
- Sun, J.; Ma, Y.; Li, J.; Zhang, J.; Ren, Z.; Wang, X. Machine learning-aided design and prediction of cementitious composites containing graphite and slag powder. J. Build. Eng. 2021, 43, 102544. [Google Scholar] [CrossRef]
- Zhang, J.; Sun, Y.; Li, G.; Wang, Y.; Sun, J.; Li, J. Machine-learning-assisted shear strength prediction of reinforced concrete beams with and without stirrups. Eng. Comput. 2020, 5, 1–15. [Google Scholar] [CrossRef]
- Zhao, Y.; Liang, H.; Xiong, C.; Fang, J. Deformation analysis of rock damage using digital image correlation technology. Chin. J. Rock Mech. Eng. 2002, 21, 73–76. [Google Scholar]
- Zhao, Y.; Ling, Y. Fracture development and strain field around the stress induced crack area in sandstone. Rock Soil Mech. 2004, 25, 865–870. [Google Scholar]
- Song, Y.; Jiang, Y.; Ma, S. Evolution of deformation fields and energy in whole process of rock failure. Rock Soil Mech. 2012, 33, 1352–1356. [Google Scholar]
- Zhao, C.; Bao, C.; Matsuda, H.; Zhao, C.F.; Tian, J.S. Application of digital image correlation method in experimental research on crack propagation of brittle rock. Chin. J. Geotech. Eng. 2015, 37, 944–951. [Google Scholar]
- Zhu, Q.; Li, D.; Li, X. Experimental study on failure and mechanical characteristics of marble containing a prefabricated elliptical hole. Chin. J. Rock Mech. Eng. 2019, 38, 2724–2733. [Google Scholar]
- Guo, Q.F.; Wu, X.; Cai, M.F.; Ren, F.; Pan, J. Crack initiation mechanism of pre-existing cracked granite. J. China Coal Soc. 2019, 44, 476–483. [Google Scholar]
- Ma, Y.; Chen, W.; Yang, D.; Yang, J.; Gong, Z. Experimental study of brittle rock failure based on three-dimensional digital image correlation technique. Rock Soil Mech. 2017, 38, 117–123. [Google Scholar]
- Li, L.L.; Gao, Y.T.; Zhou, Y. Meso-scale modelling mechanical properties of rock-like material containing trident cracks under uniaxial compression. Rock Soil Mech. 2018, 39, 3668–3676. [Google Scholar]
- Peng, Y.; Lin, Q.; Deng, H.; Fan, X. Study on failure process of marble with prefabricated holes based on 3D-DIC Technology. Yangtze River 2021, 52, 202–209. [Google Scholar]
- Liu, D.M.; Cai, M.F.; Zhou, Y.B.; Chen, Z.Y. Dynamic monitoring on developing process of rock cracks. Chin. J. Rock Mech. Eng. 2006, 25, 467–472. [Google Scholar]
- Xu, J. Study on Fracture Process and Criterion of Rocks Induced by Non-Penetrating Flaw; Southeast University: Nanjing, China, 2018. [Google Scholar]
- Liu, Y.; Tang, H. Rock and Soil Mechanics; Chemical Industry Pre.: Beijing, China, 2008; pp. 1–254. [Google Scholar]


Publisher’s Note: MDPI stays neutral with regard to jurisdictional claims in published maps and institutional affiliations. |
© 2022 by the authors. Licensee MDPI, Basel, Switzerland. This article is an open access article distributed under the terms and conditions of the Creative Commons Attribution (CC BY) license (https://creativecommons.org/licenses/by/4.0/).