Article

Pure Alloy Additive or Preliminary Alloy: A Comparative Study on Obtaining High-Strength Copper Magnesium Alloys Designed for Electrical Power Systems

by
Paweł Strzępek
* and
Małgorzata Zasadzińska
Faculty of Non-Ferrous Metals, AGH University of Science and Technology, 30-059 Krakow, Poland
*
Author to whom correspondence should be addressed.
Energies 2022, 15(6), 2093; https://doi.org/10.3390/en15062093
Submission received: 17 February 2022 / Revised: 7 March 2022 / Accepted: 11 March 2022 / Published: 13 March 2022
(This article belongs to the Section D1: Advanced Energy Materials)

Abstract

:
Due to the increasing demand for electrical energy in modern society, there is a huge requirement for conducting materials and, due to the development of electromobility, this demand is forecasted to grow each year. This is one of the reasons why copper and copper alloys manufacturing and processing industries tend to evolve and improve. One of the improvement paths is the design of new conducting materials for electrical power systems, electrical energy transmission, and energy storage systems. This paper presents a comparative study on obtaining high-strength copper magnesium alloys in terms of the alloy additive used during the metallurgical synthesis process, because this is a crucial, initial element in obtaining the final conducting product, such as wires. The obtained ingots were tested in terms of their chemical composition, and mechanical and physical properties. The provided results prove that there is a significant increase in the materials’ hardness (and thus the ultimate tensile strength), and a slight decrease in density, impact resistance, and electrical conductivity, as the Mg content increases. Scanning electron microscopy (SEM) and phase analysis were additionally conducted in order to determine the distribution and origin of Mg precipitations. Collectively, the results show that the CuMg alloys may successfully replace other alloys, such as CuNiSi or CuZn, as carrying and conducting materials because their properties are superior to those of the aforementioned materials.

1. Introduction

Modern society requires a huge amount of energy to be supplied every day and night. In addition, because there is a global trend towards green energy, technology will increasingly rely on the electrical energy generated from wind, water, sun, etc., instead of internal combustion engines or coal power plants. Therefore, in line with the expected fall in carbon fuel consumption, the sales of electric and hybrid vehicles, not only in the United States, but also Europe and China, have increased in each of the past 10 years [1]. Bearing in mind that copper is an excellent electrical and thermal conductor [2,3], and is thus used in a large number of electrical applications, the development of copper manufacturing and processing industries is necessary for the modern power industry to improve [4]. Regarding the aforementioned vehicles, the production of an electric vehicle requires over two times more copper than a hybrid electric vehicle and over four times more copper than an internal combustion engine vehicle [5]. As presented in [6,7,8], copper demand is expected to increase further in the coming years, being forecast to increase between 3 and 21 times by the end of the century. Moreover, even with the current growing trend towards the recycling of metals, the demand for copper will surpass its supply long before the year 2100. Thus, the decarbonization of transportation and energy supply is strongly connected with the search by scientists for new material solutions. Due to the depletion of copper resources, and the expectation of higher mechanical properties of metals, the focus has turned to new alloys and their manufacturing and processing [9,10,11]. Usually, the designed alloys consist of the matrix (copper) and one alloy additive, such as Al [12], Ag [13,14,15], and Zn [16]. However, many applications require two or more alloy additives in order to maintain the balance between the desired properties. These alloys include CuCrZr [17,18], CuMgCa [19], and CuNiSi [20,21,22], and even more complex materials such as CuNiCoSiMg [23] and CuNiSiCoCr [24]. All the above-mentioned materials have two things in common, according to the authors of these papers: they are materials having high strength and high electrical conductivity, and are therefore the most-desired materials in electric power systems and energy storage systems. However, the alloy additives, such as Ag, Cr, Zr, Ni, and Co, have a very high value and limited availability, which is a disadvantage in terms of mass production [25]. As a result, the search for the optimum alloy additive for copper alloys designed for electrical power systems has focused on, for instance, Mg. The prospective use of CuMg alloys for electrical systems, as in the case of any other copper alloy, is limited by atmospheric corrosion. Therefore, a specific electrolytic or galvanic coating is required to separate CuMg alloys from the atmosphere. Many research papers have been devoted to the topic of corrosion, its mechanisms of formation, and means of protection using the mentioned coatings applied to both copper alloys [26,27,28,29] and magnesium alloys [30,31,32,33]. However, only one paper concerning CuMg alloys and their corrosion resistance has been published, which presents the results of alloys with a magnesium content below 0.4 wt.% [34]. Ignoring the influence of the atmosphere, which may be prevented with the above-mentioned coatings, CuMg alloys seem to be a promising material in terms of electrical conductivity and good mechanical properties, and result in a reasonably priced final conductor. Most published research papers are devoted to single-phase CuMg alloys, such as commonly used commercial alloys having 0.2 wt.% and 0.5 wt.% of Mg, and their strain hardening [35,36]. However, a few papers have discussed single-phase alloys having a slightly higher Mg content of 1–2 wt.% [37,38], and examined precipitation hardening and strain hardening. There is also one paper on two-phase alloys with Mg content of above 4.5 wt.% [39], in which the influence of the continuous casting parameters on the properties of the material is investigated. The authors of these papers claim that copper alloys with a specific Mg content and proper strengthening may obtain an ultimate tensile strength (UTS) value of between 600 and 800 MPa while maintaining a satisfactory level of electrical properties. CuMg alloys are promising because, according to Wang et al., micro-additions of Ce and Y of approximately 0.15 wt.% to CuMg single-phase alloys further improved mechanical properties, even when the material was subjected to hot deformation ranging from 500 to 850 °C [40]. Although many aspects have been tested in terms of obtaining high-strength CuMg alloys and their properties, there are still some knowledge gaps. In particular, metallurgical synthesis of the alloys in terms of the alloy additive used and its influence on the complex set of properties has been neglected. Thus, the proposed comparative study is necessary to fill the existing void in terms of these materials designed for electrical power systems, energy storage systems, and electrical energy transfer, which may be substitutes for pure copper or other, more expensive alloys.

2. Materials and Methods

2.1. Metallurgical Synthesis and Chemical Composition

The main part of this experimental study was focused on metallurgical synthesis and, thus, the acquisition of the selected alloys, which were single-phase (below 3 wt.%) and two-phase alloys (above 3 wt.%). In order to determine the influence of the alloy additive used on the final properties, all selected alloys were obtained in two ways, i.e., using oxygen free (OF) granulated copper (99.99% of Cu) as the matrix for both types, and pure magnesium (99.9% of Mg) or preliminary alloy (CuMg50) as the alloy additive. The composition of the preliminary alloy was selected to be 50/50 in order to clearly determine any difference in terms of the final alloy properties in the as-cast state. The melting and synthesis process was conducted in graphite crucibles using a resistance furnace (Czylok, Jastrzębie-Zdrój, Poland) set to 1200 °C. A precisely weighed alloy additive was covered with a thin copper sheet in order to prevent magnesium from burning because its boiling point is 1091 °C and, therefore, lower than the process temperature. The additive was placed in the crucible with liquid copper covered with fine graphite powder to further limit the oxidation and burning processes. The crucible was repeatedly placed in the furnace three times for 5 min each; each time, the liquid material was thoroughly stirred in order to provide a homogenous cross-section structure of the material. In order to complete the solidification process, the liquid alloy was poured into a new preheated crucible and left to cool at the ambient temperature. The process was analogically repeated for all of the selected nominal alloy compositions using both alloy additives. The chemical composition analysis of the obtained ingots was conducted using a mobile arc spark spectrometer Spectrotest (SPECTRO Analytical Instruments GmbH, Kleve, Germany). Five measurements were conducted on the cross-section and 5 measurements were conducted on the longitudinal section for each of the ingots and the average values were calculated. After verifying that the obtained alloys were within the assumed range (±0.02 wt.% of Mg) of the nominal values, ingots were further subjected to a series of tests in order to determine their mechanical and physical properties. Additionally, all materials were subjected to scanning electron microscope (SEM) and X-ray phase analysis using X-ray diffraction patterns (XRD).

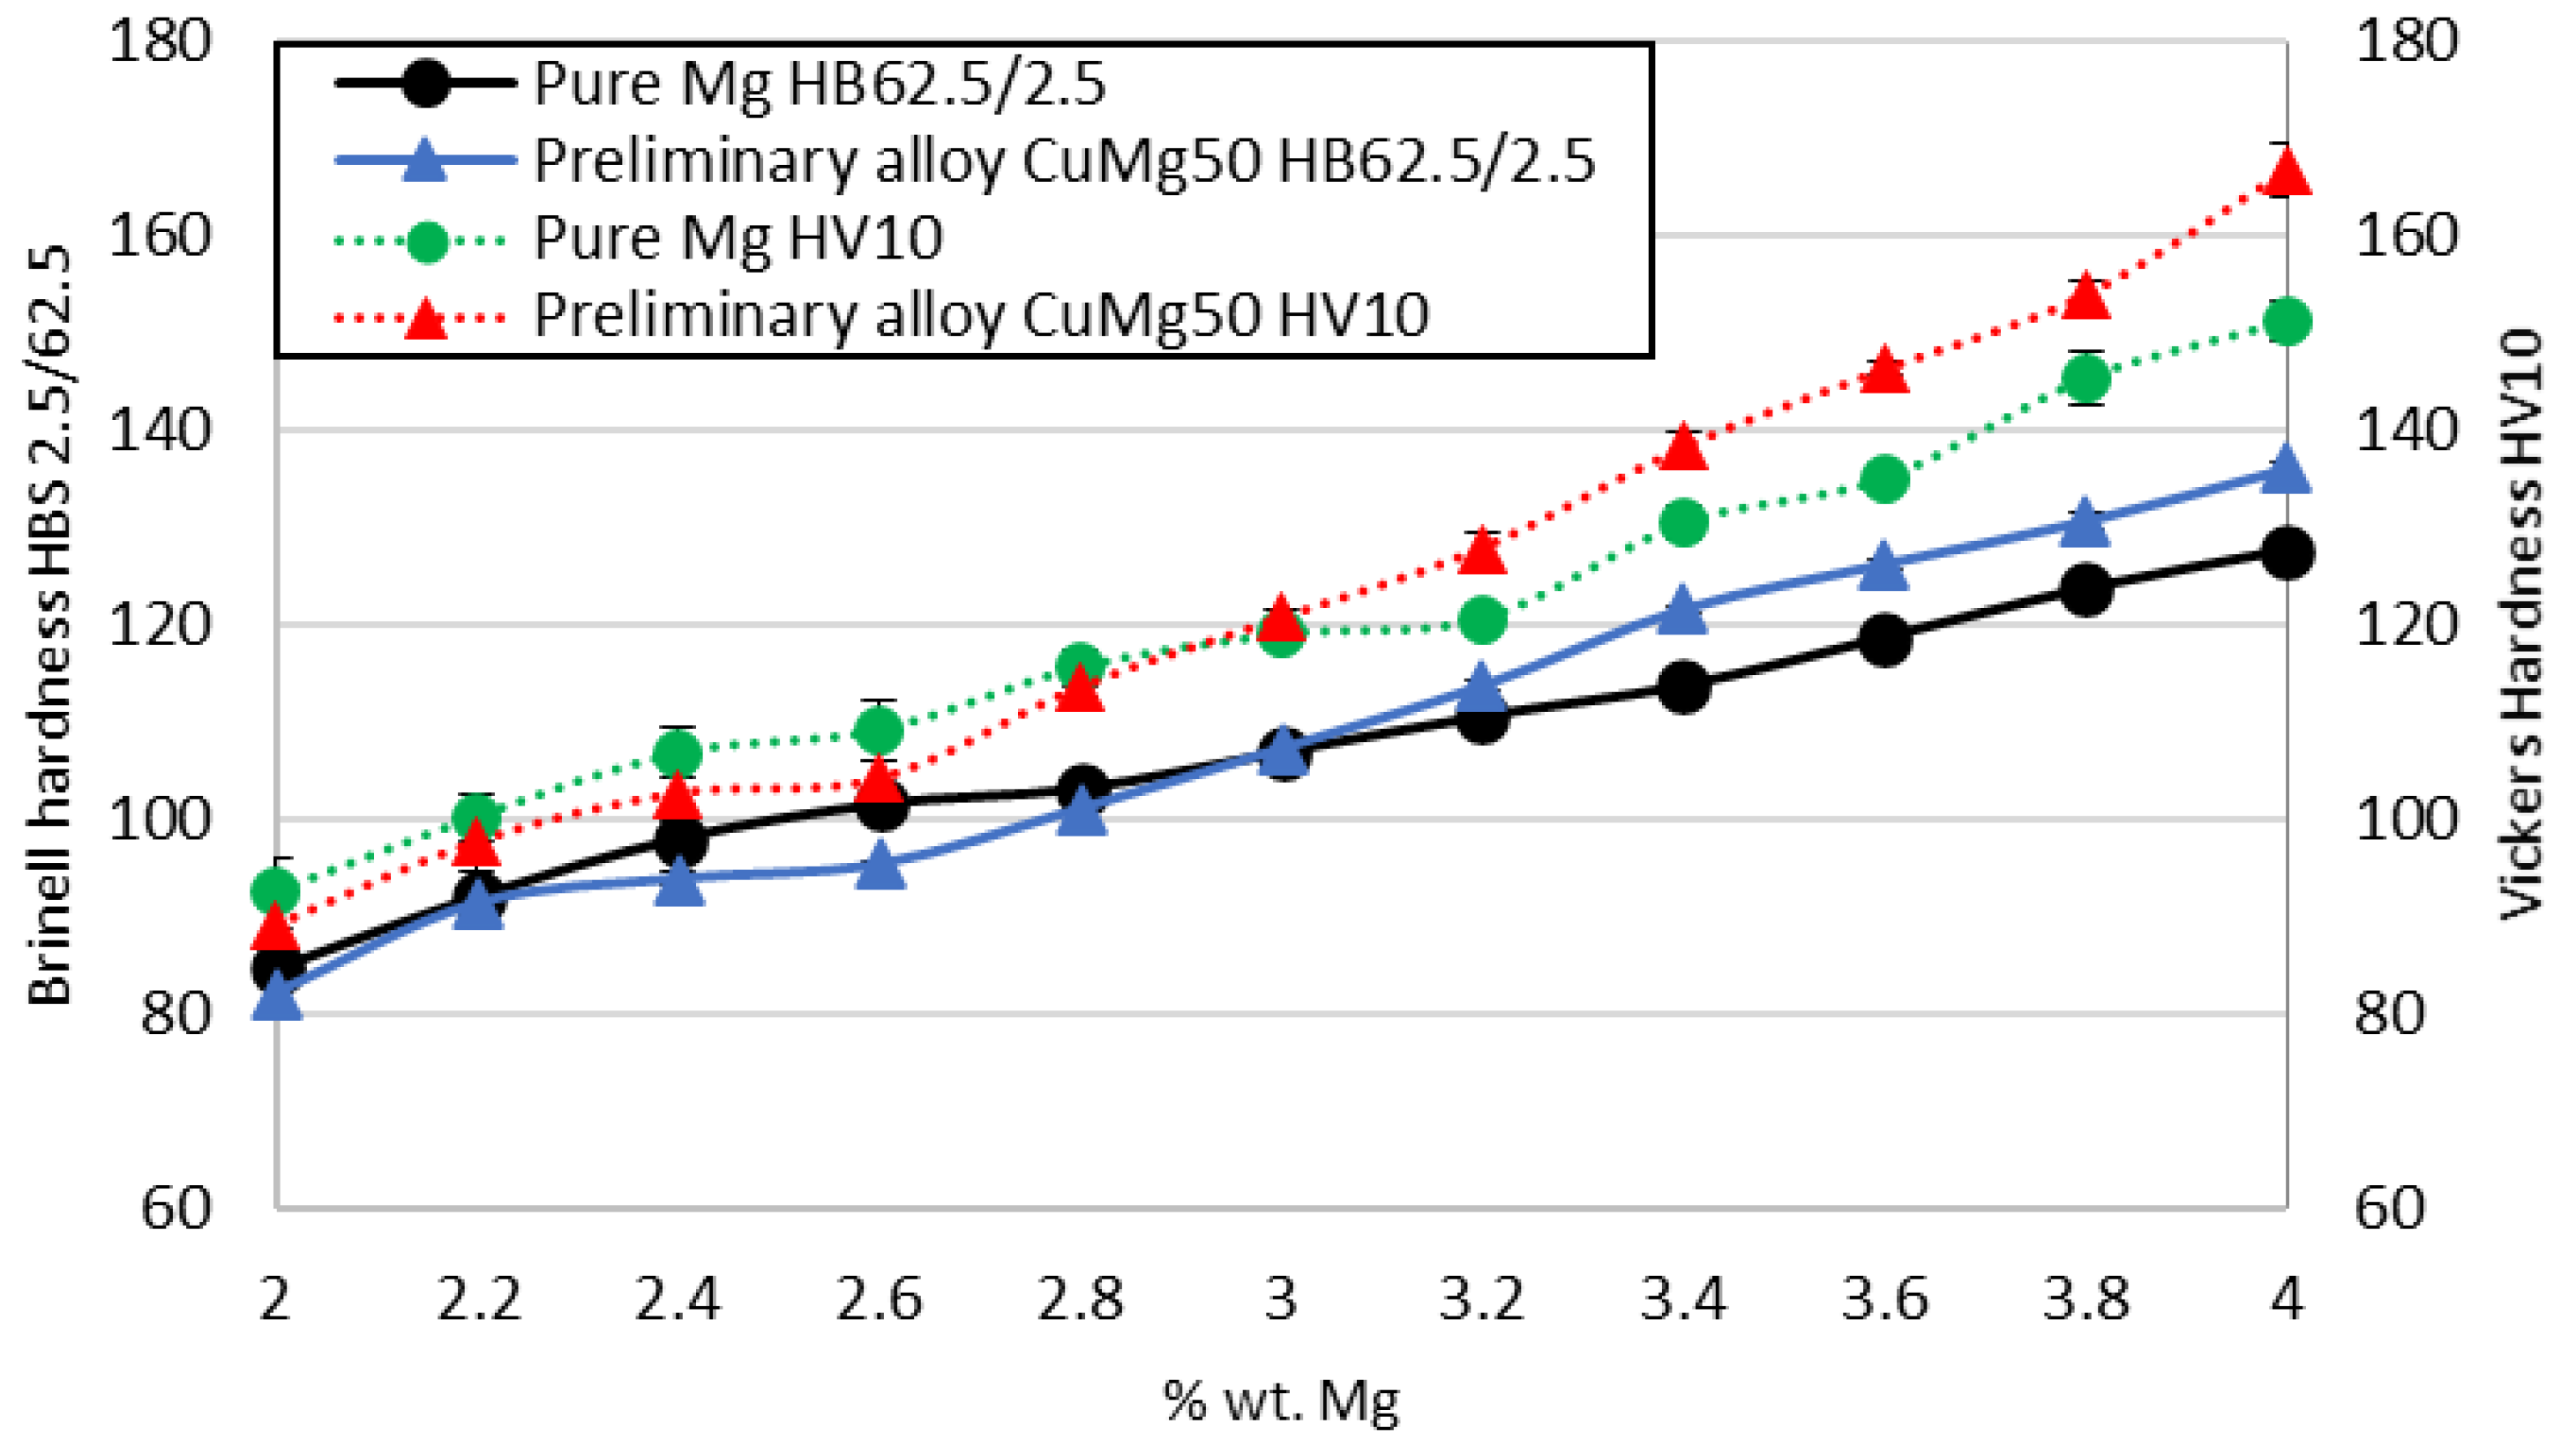
2.2. Mechanical Properties

The obtained ingots were subjected to hardness tests typical for metals, using Vickers micro-hardness and Brinell’s macro-hardness methods, in order to determine their fundamental mechanical properties. The former was conducted using a TUKON 2500 hardness tester (Buehler, Lake Bluff, IL, USA) having a test load accuracy of ±1% and an accuracy of the indent’s diameter measurement of 0.02 mm. Ten measurements were performed on each side of the bisected ingots with a test load of 10 kgf and an indentation time of 10 s. The latter method was conducted with a Nexus3001 testing machine (Innovatest Europe BV, Maastricht, The Netherlands) having a test load accuracy of ±1% and an accuracy of the indent’s diameter measurement of 0.1 µm. Analogically, 10 measurements were performed on each side of the bisected ingots, again with an indentation time of 10 s but with a test load of 62.5 kgf. As the tested materials were in the as-cast state, it can be stated that their structure may be porous and not 100% homogenous prior to heat treatment; hence, uniaxial tensile tests were been conducted. However, UTS was calculated from the hardness measurements using the relation proposed by Tabor [41,42] and improved by Cahoon [43]. Additionally, the designed materials may not only be responsible for electrical conductivity, but also for transferring high values of mechanical loads/stresses, thus explaining their high strength. Some of the applied stresses may be of dynamic origin; hence, the impact resistance of the CuMg alloys was tested using Charpy’s impact testing machine (ZwickRoell GmbH & Co. KG, Ulm, Germany) with a pendulum having an initial energy of 300 J. The samples prior to testing were prepared according to the ISO 148-1:2016 standard.

2.3. Physical Properties

In order to successfully be used in electrical power systems for electrical energy transfer, the CuMg alloys were tested in terms of their physical properties. The aim was to provide a material having a density lower than that of copper, and reasonable electrical conductivity, in conjunction with defined mechanical properties. Thus, the electrical conductivity of the ingots was tested using a SigmaTest 2.069 apparatus (Forester Instruments Inc., Pittsburgh, PA, USA), which is an eddy current instrument that measures the electrical conductivity of nonferrous metals, in MS/m. The tests were conducted after placing the samples for 24 h at ambient temperature in order to stabilize their thermal state, thus preventing temperature from influencing the measurements. Ten measurements were performed on each half of the ingot with a frequency of 60 kHz, and the average values were calculated. The density of the samples was defined using Archimedes’ principle; 10 mm × 10 mm × 10 mm cubes cut from each of the ingot halves were precisely weighed, before being submerged in water, using a RADWAG AS.R2 laboratory scale (Radwag Wagi Elektroniczne, Radom, Poland). The density was calculated as the average value of the samples cut from two separate halves.

2.4. SEM Analysis and XRD Observations

Additionally, microstructure analysis was conducted of the prepared samples of the CuMg ingots with the use of an SEM microscope (Hitachi Ltd., Tokyo, Japan) using backscatter electrons with various magnifications (200× and 2000×) in order to visualize the quantity of CuMg precipitations. In order to define the kind of precipitations visible in the microscope images, XRD phase analyses were conducted at ambient temperature using a Rigaku MiniFlex II apparatus (Rigaku Corporation, Tokyo, Japan). The diffraction spectra were obtained at the 2Θ angle of between 40° and 80° with a sampling velocity of 2 °/min every 0.05°. Copper and CuMg intermetallic phases were defined based on the International Centre for Diffraction Data (ICDD).

3. Results and Discussion

3.1. Metallurgical Synthesis and Chemical Composition

The obtained CuMg ingots were subjected to chemical composition analysis, the results of which are presented collectively as average values in Table 1 in comparison with the nominal chemical compositions of the obtained alloys. The nominal alloys were supposed to range from 2 wt.% of Mg to 4 wt.% of Mg every 0.2 wt.% of Mg, thus creating a whole spectrum of both single-phase (below 3 wt.%) and two-phase CuMg alloys (above 3 wt.%). Based on the Mg content, it was determined whether the alloy fulfilled the assumed nominal chemical composition (±0.02 wt.% of Mg), regardless of the content of Cu and other elements (impurities). Table 1 shows that all of the ingots subjected to further research were successfully obtained, therefore proving that the assumed metallurgical synthesis method was accurate, and that the implemented precautionary measures were sufficient to prevent the magnesium from evaporating.

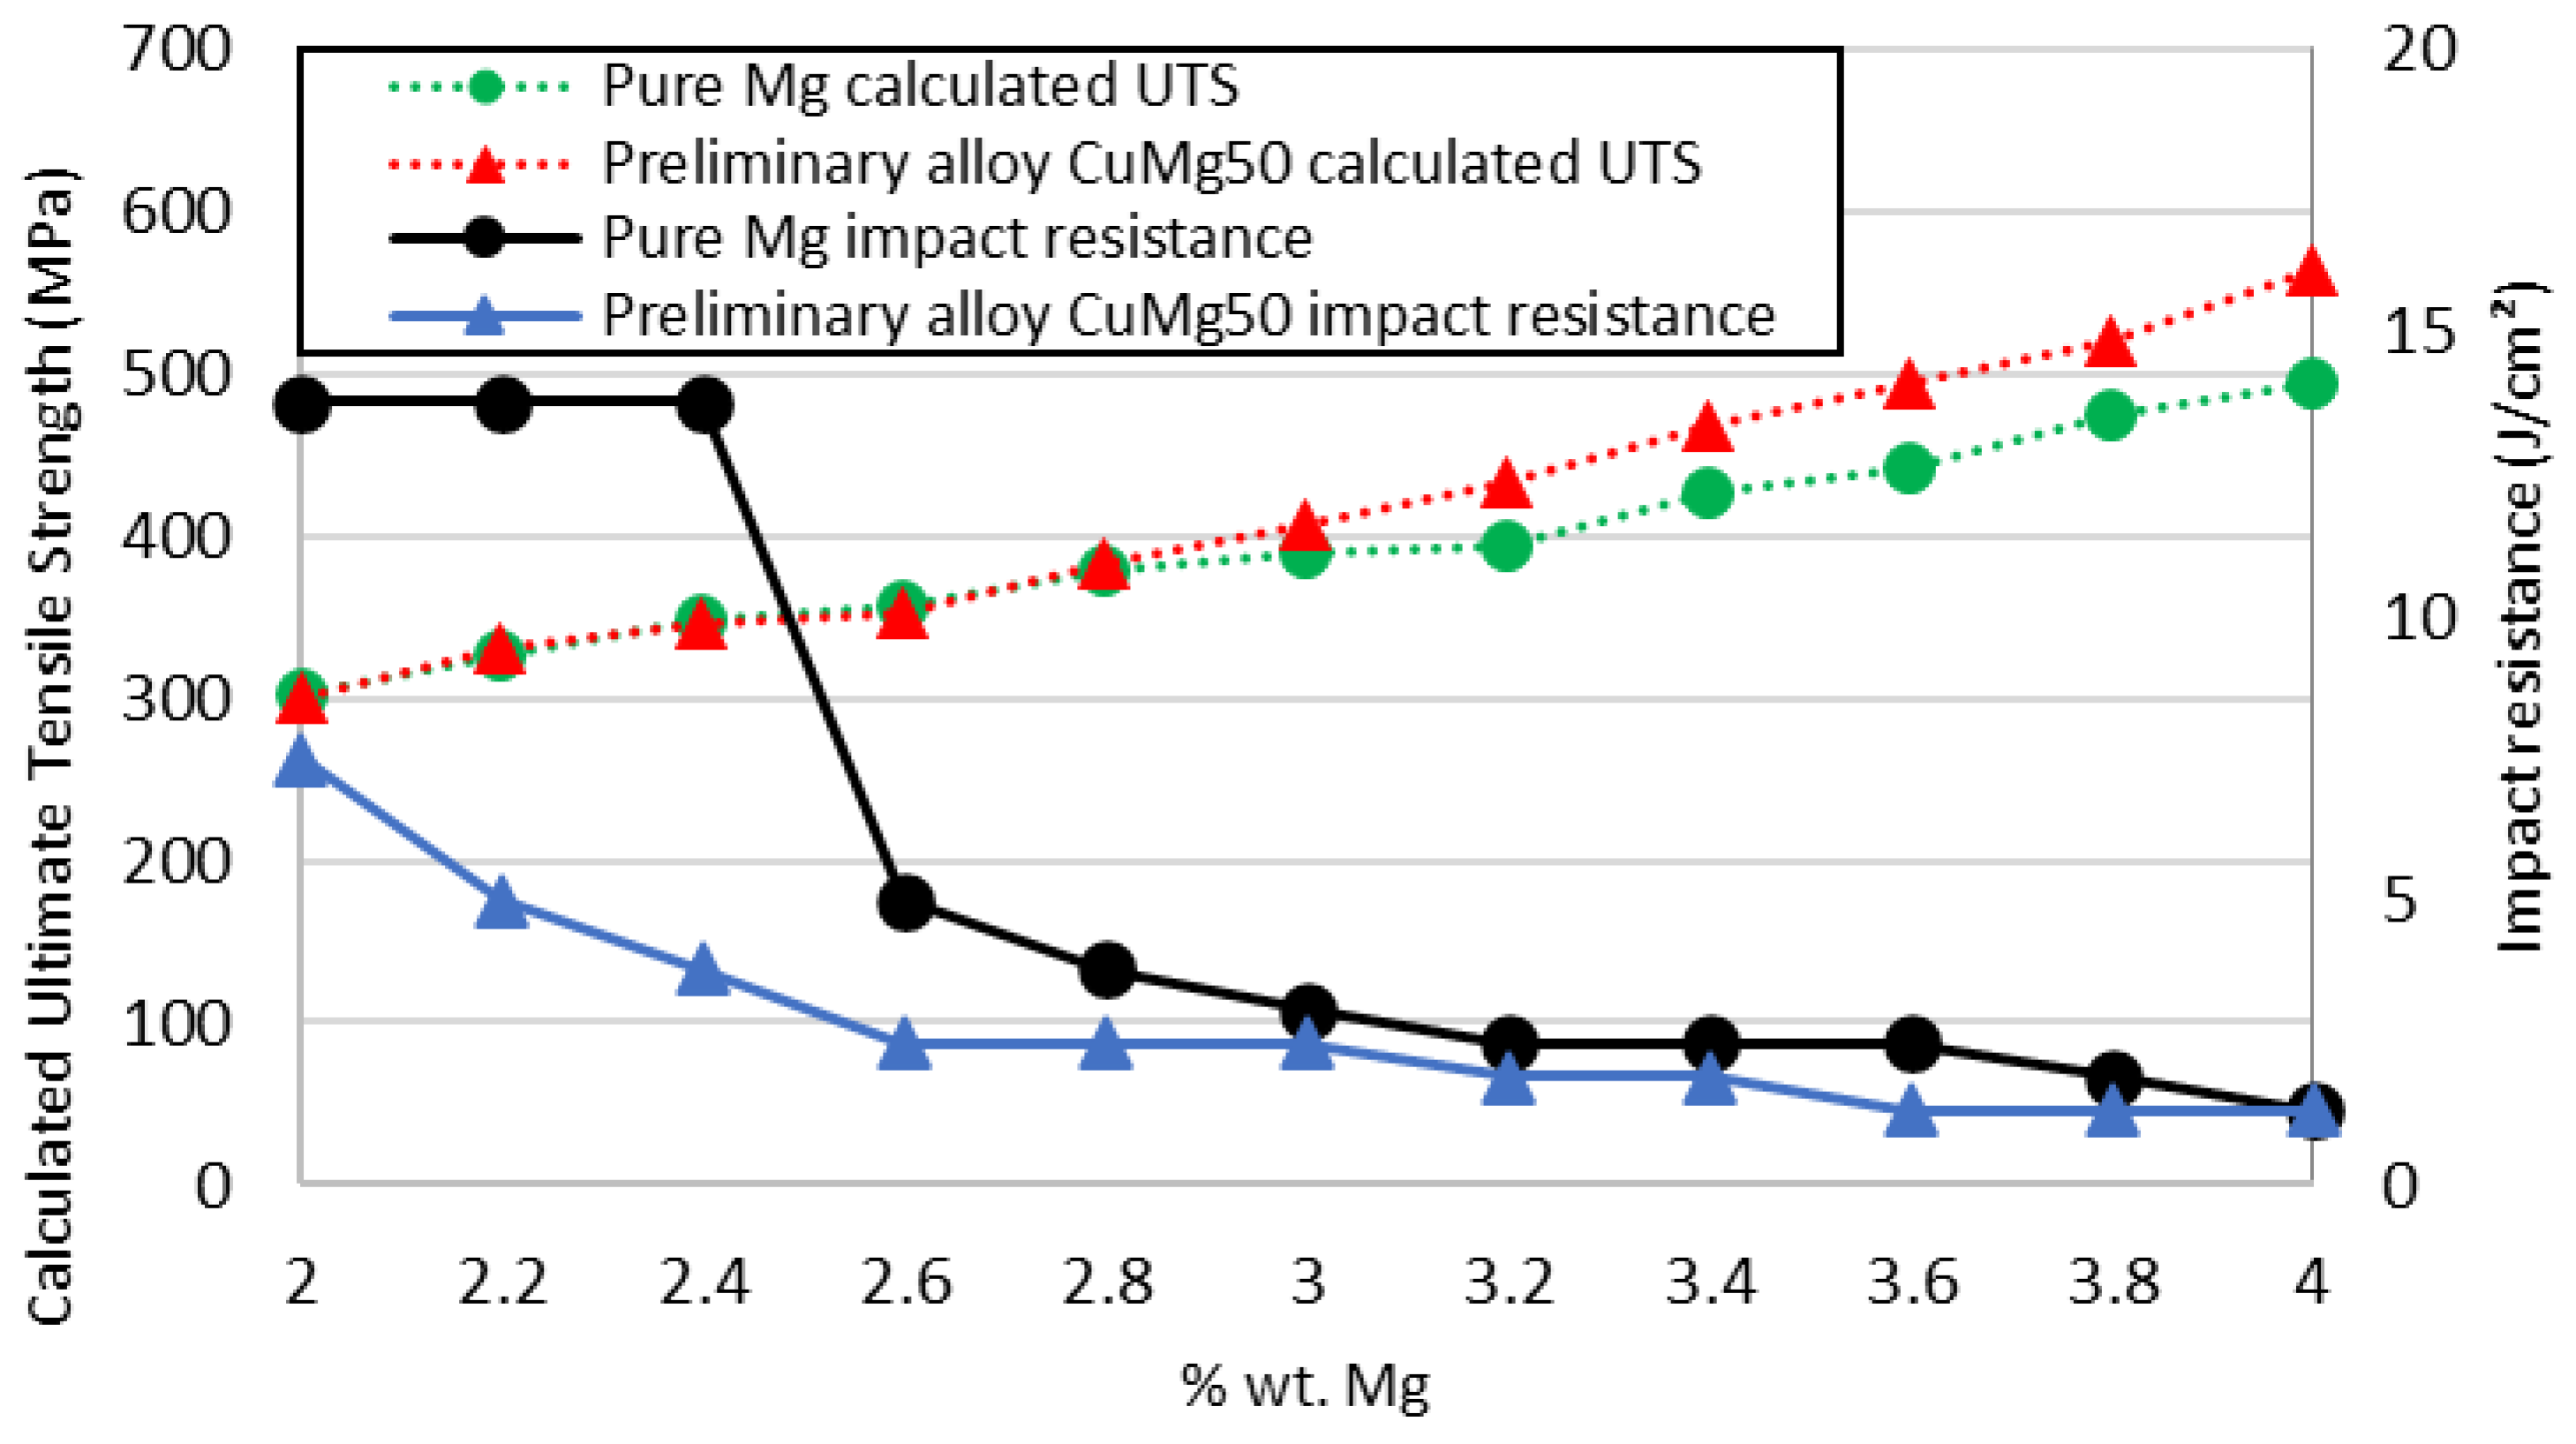
3.2. Mechanical Properties

Mechanical properties of the obtained ingots were determined using two methods of hardness testing, i.e., Vickers and Brinell’s methods. For each, 10 indentations were made in the two halves of each ingot, the average values of which represented an accurate image of the materials’ mechanical properties. The obtained values and their standard deviations are presented in Figure 1. Brinell’s method is marked with a full line and the Vickers method is marked with a dotted line. In terms of alloy additives, pure Mg is marked with circles and preliminary alloy CuMg50 is marked with triangles. Concerning the repeatability of the measurements, it may be stated that the obtained values do not differ much, as the standard deviations presented by error bars are barely visible; the standard deviation was calculated to be between 0.3 and 0.8 for Brinell’s method and between 1.1 and 3.7 for the Vickers method.
Regarding the obtained results, it was proven that, as the Mg content increases, so does the hardness of the alloy, both in terms of micro- and macro-hardness, and the increase is quasi-linear. Using Brinell’s method for macro-hardness testing, the values increased from approximately 80 HB to approximately 130–135 HB, and using Vickers micro-hardness, these values increased from approximately 95 HV10 to approximately 155–175 HV10. The remarkable phenomenon is that at 3 wt.% of Mg (the point at which the alloy changes from a single-phase to a two-phase material), there is a change in the hardness trend. Materials having up to 3 wt.% of Mg obtained with pure Mg as the alloy additive show slightly better mechanical properties. In contrast, above this amount of Mg, the opposite is seen, as the alloys obtained with the preliminary alloy CuMg50 exhibit higher values of hardness measured with both methods, and this trend is increasingly visible as the Mg content increases.
Using the equation proposed by Cahoon [43], the obtained Vickers hardness values, after converting from kgf/mm2 to Si units, were recalculated to obtain the anticipated UTS values (dotted lines). These are presented in Figure 2 with the obtained impact resistance values (full lines) of the CuMg alloys.
The results of the calculations predict that the UTS of the obtained materials in the as-cast state should range between 300 and 500–550 MPa depending on the Mg content. Thus, at the peak, the values are higher than the UTS values of pure copper wires after strain hardening, with a true strain of approximately 5–6 (elongation factor λ = 256) [2]. These values should reflect the promise of the CuMg alloys in terms of prospective processing for wires and other equipment responsible not only for electrical conductivity, but also for transferring high values of mechanical loads/stresses. The calculated values are a function of Vickers hardness, which analogically shows a quasi-linear increase in the obtained values. When considering the results of the impact resistance of the materials, it must be noted that all of the tested samples exhibited brittle fractures, regardless of the Mg content. Regarding the presented results, the materials obtained with pure Mg show much higher impact resistance values than those obtained with the preliminary alloy CuMg50 having less than 3 wt.% of Mg, i.e., when the materials were single-phase alloys. Two-phase materials do not differ much in terms of their impact resistance; however, it must be acknowledged that, when the Mg content is equal to 2 wt.%, the impact resistance is 10 times higher (pure Mg) and 5 times higher (preliminary alloy CuMg50) than when the alloy consists of 4 wt.% of Mg.

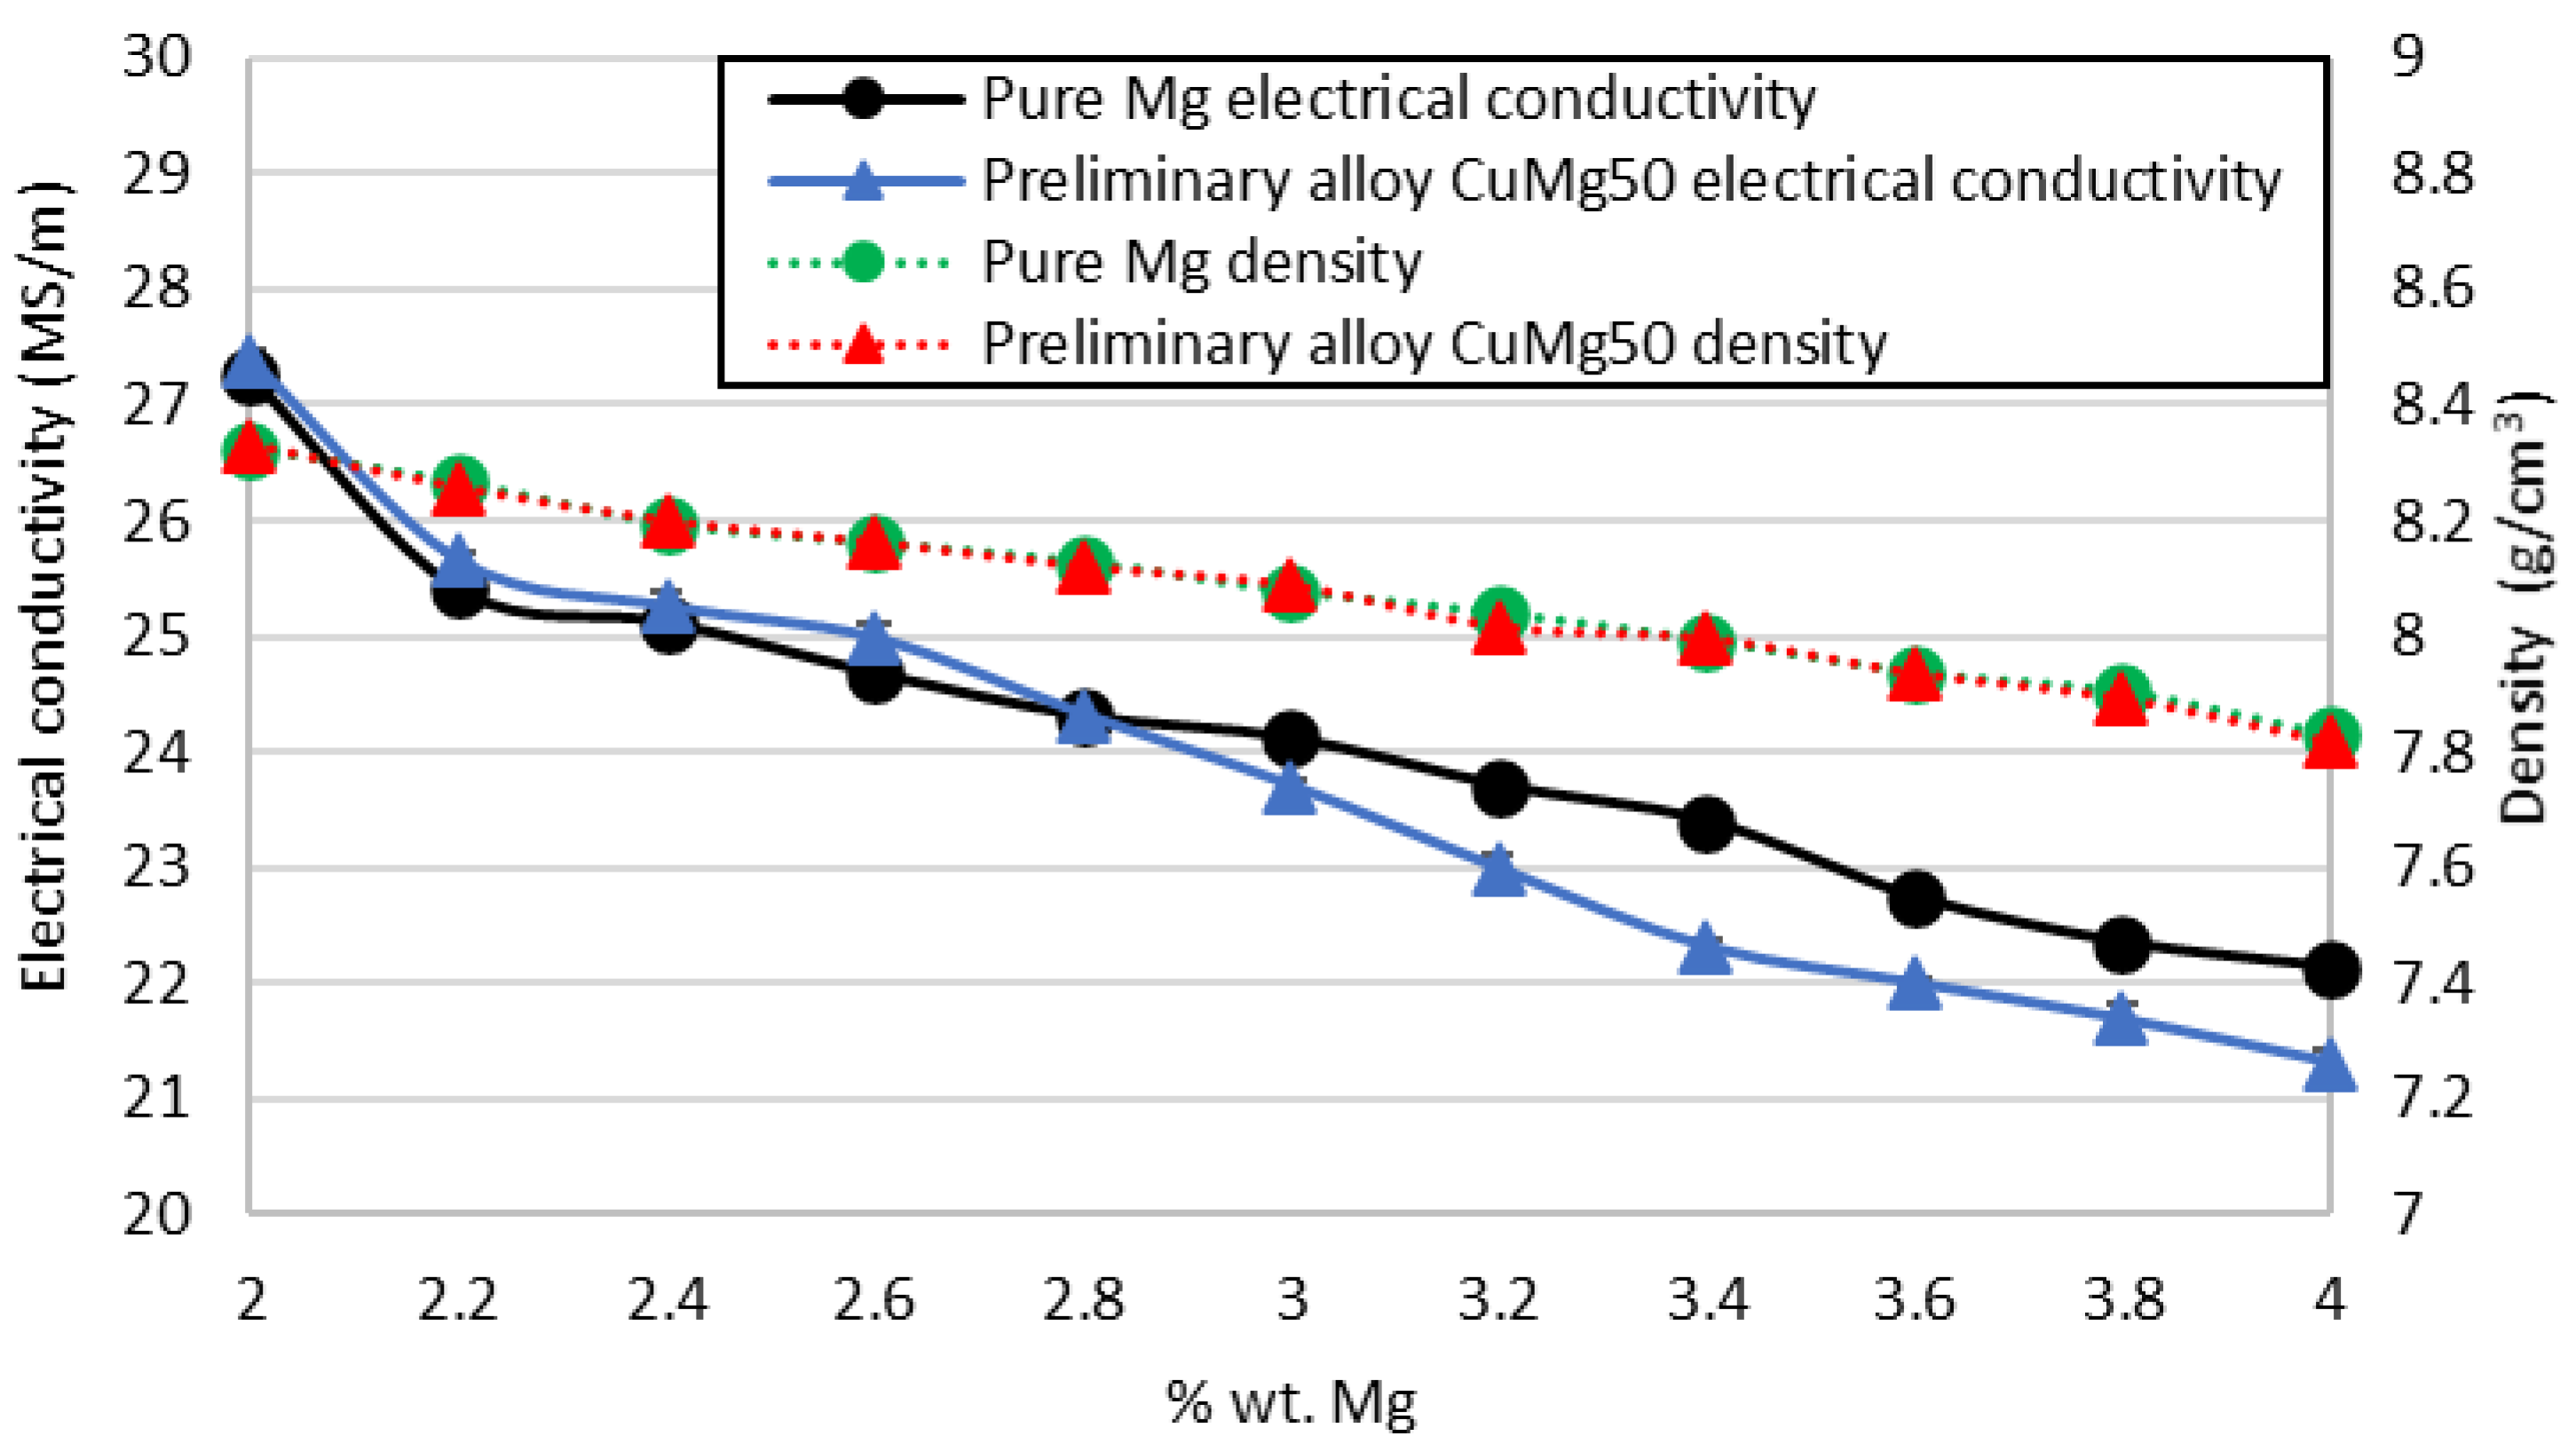
3.3. Physical Properties

The electrical conductivity and density of the materials are crucial in terms of their prospective use in electrical power systems. Thus, both of these physical properties were tested and the results are presented at Figure 3. The standard deviations were calculated and are marked with error bars; however, the values are so low (below 0.4) that they are barely visible in the diagram. Electrical conductivity (full lines), expressed in MS/m, ranges between 27 and 21 MS/m, and shows that there is a significant decrease between 2 wt.% of Mg and 2.2 wt.% of Mg. Above this value, further decreases in electrical properties are rather linear and, up to 3 wt.% of Mg, there is no significant difference noted between the two kinds of tested alloy additives. However, above 3 wt.% of Mg, the difference is more than 1 MS/m. This is almost 2% of the pure copper electrical conductivity, which, when annealed, is equal to approximately 58 MS/m [3]. According to Nordheim’s rule [44], when an alloy additive having atoms with a different diameter is introduced into the metallic matrix, the electrical conductivity must decrease. Thus, the electrical conductivity is approximately half that of pure copper; however, it is at the same level as that of CuNiSi alloy, and Mg has a much lower cost than Ni [20,21,22] and a much higher cost than CuZn37 alloy (typical brass) [16]. Taking into consideration the density results, there is no difference in terms of the alloy additive used, and the density decreases linearly from 8.32 to 7.82 g/cm3 as the Mg content increases. In comparison, the density of the CuNiSi alloy is 8.8 g/cm3 [20,21,22], the density of the CuZn37 alloy (typical brass) is 8.44 g/cm3 [16], and the density of pure copper is 8.96 g/cm3 [2,3]. This shows that the CuMg alloys may function as a much lighter conducting material than commercially used alloys.

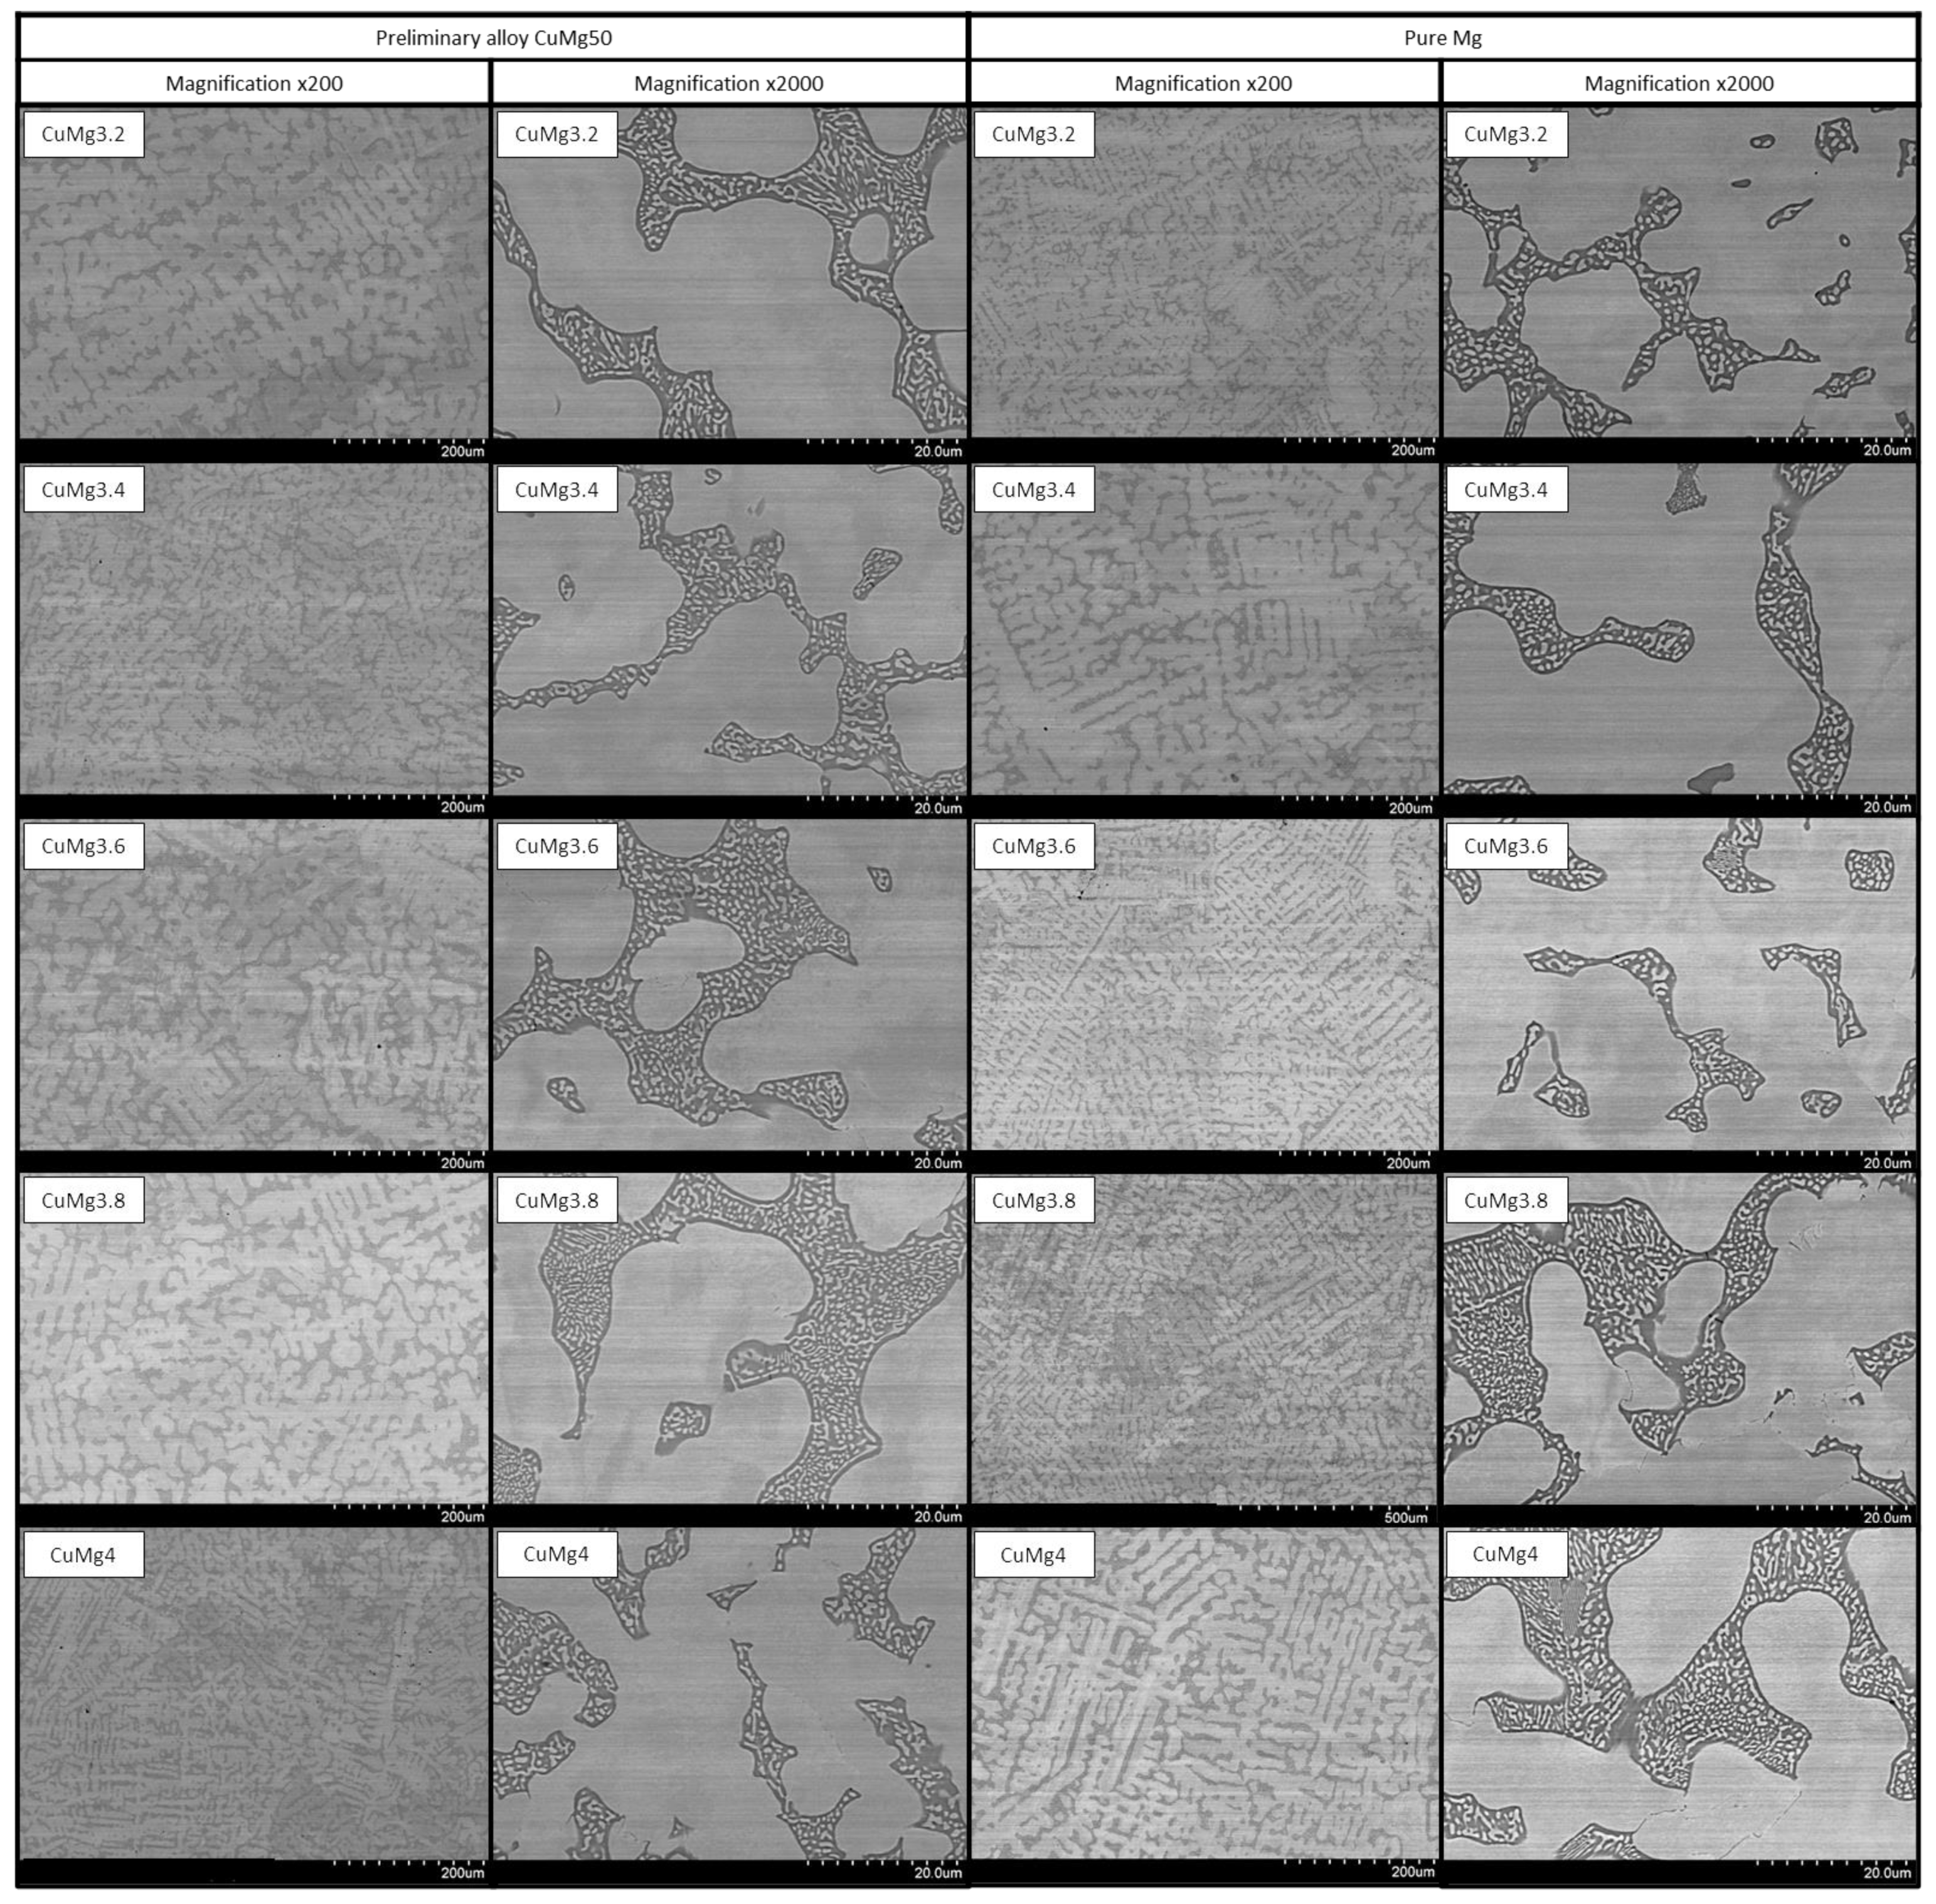
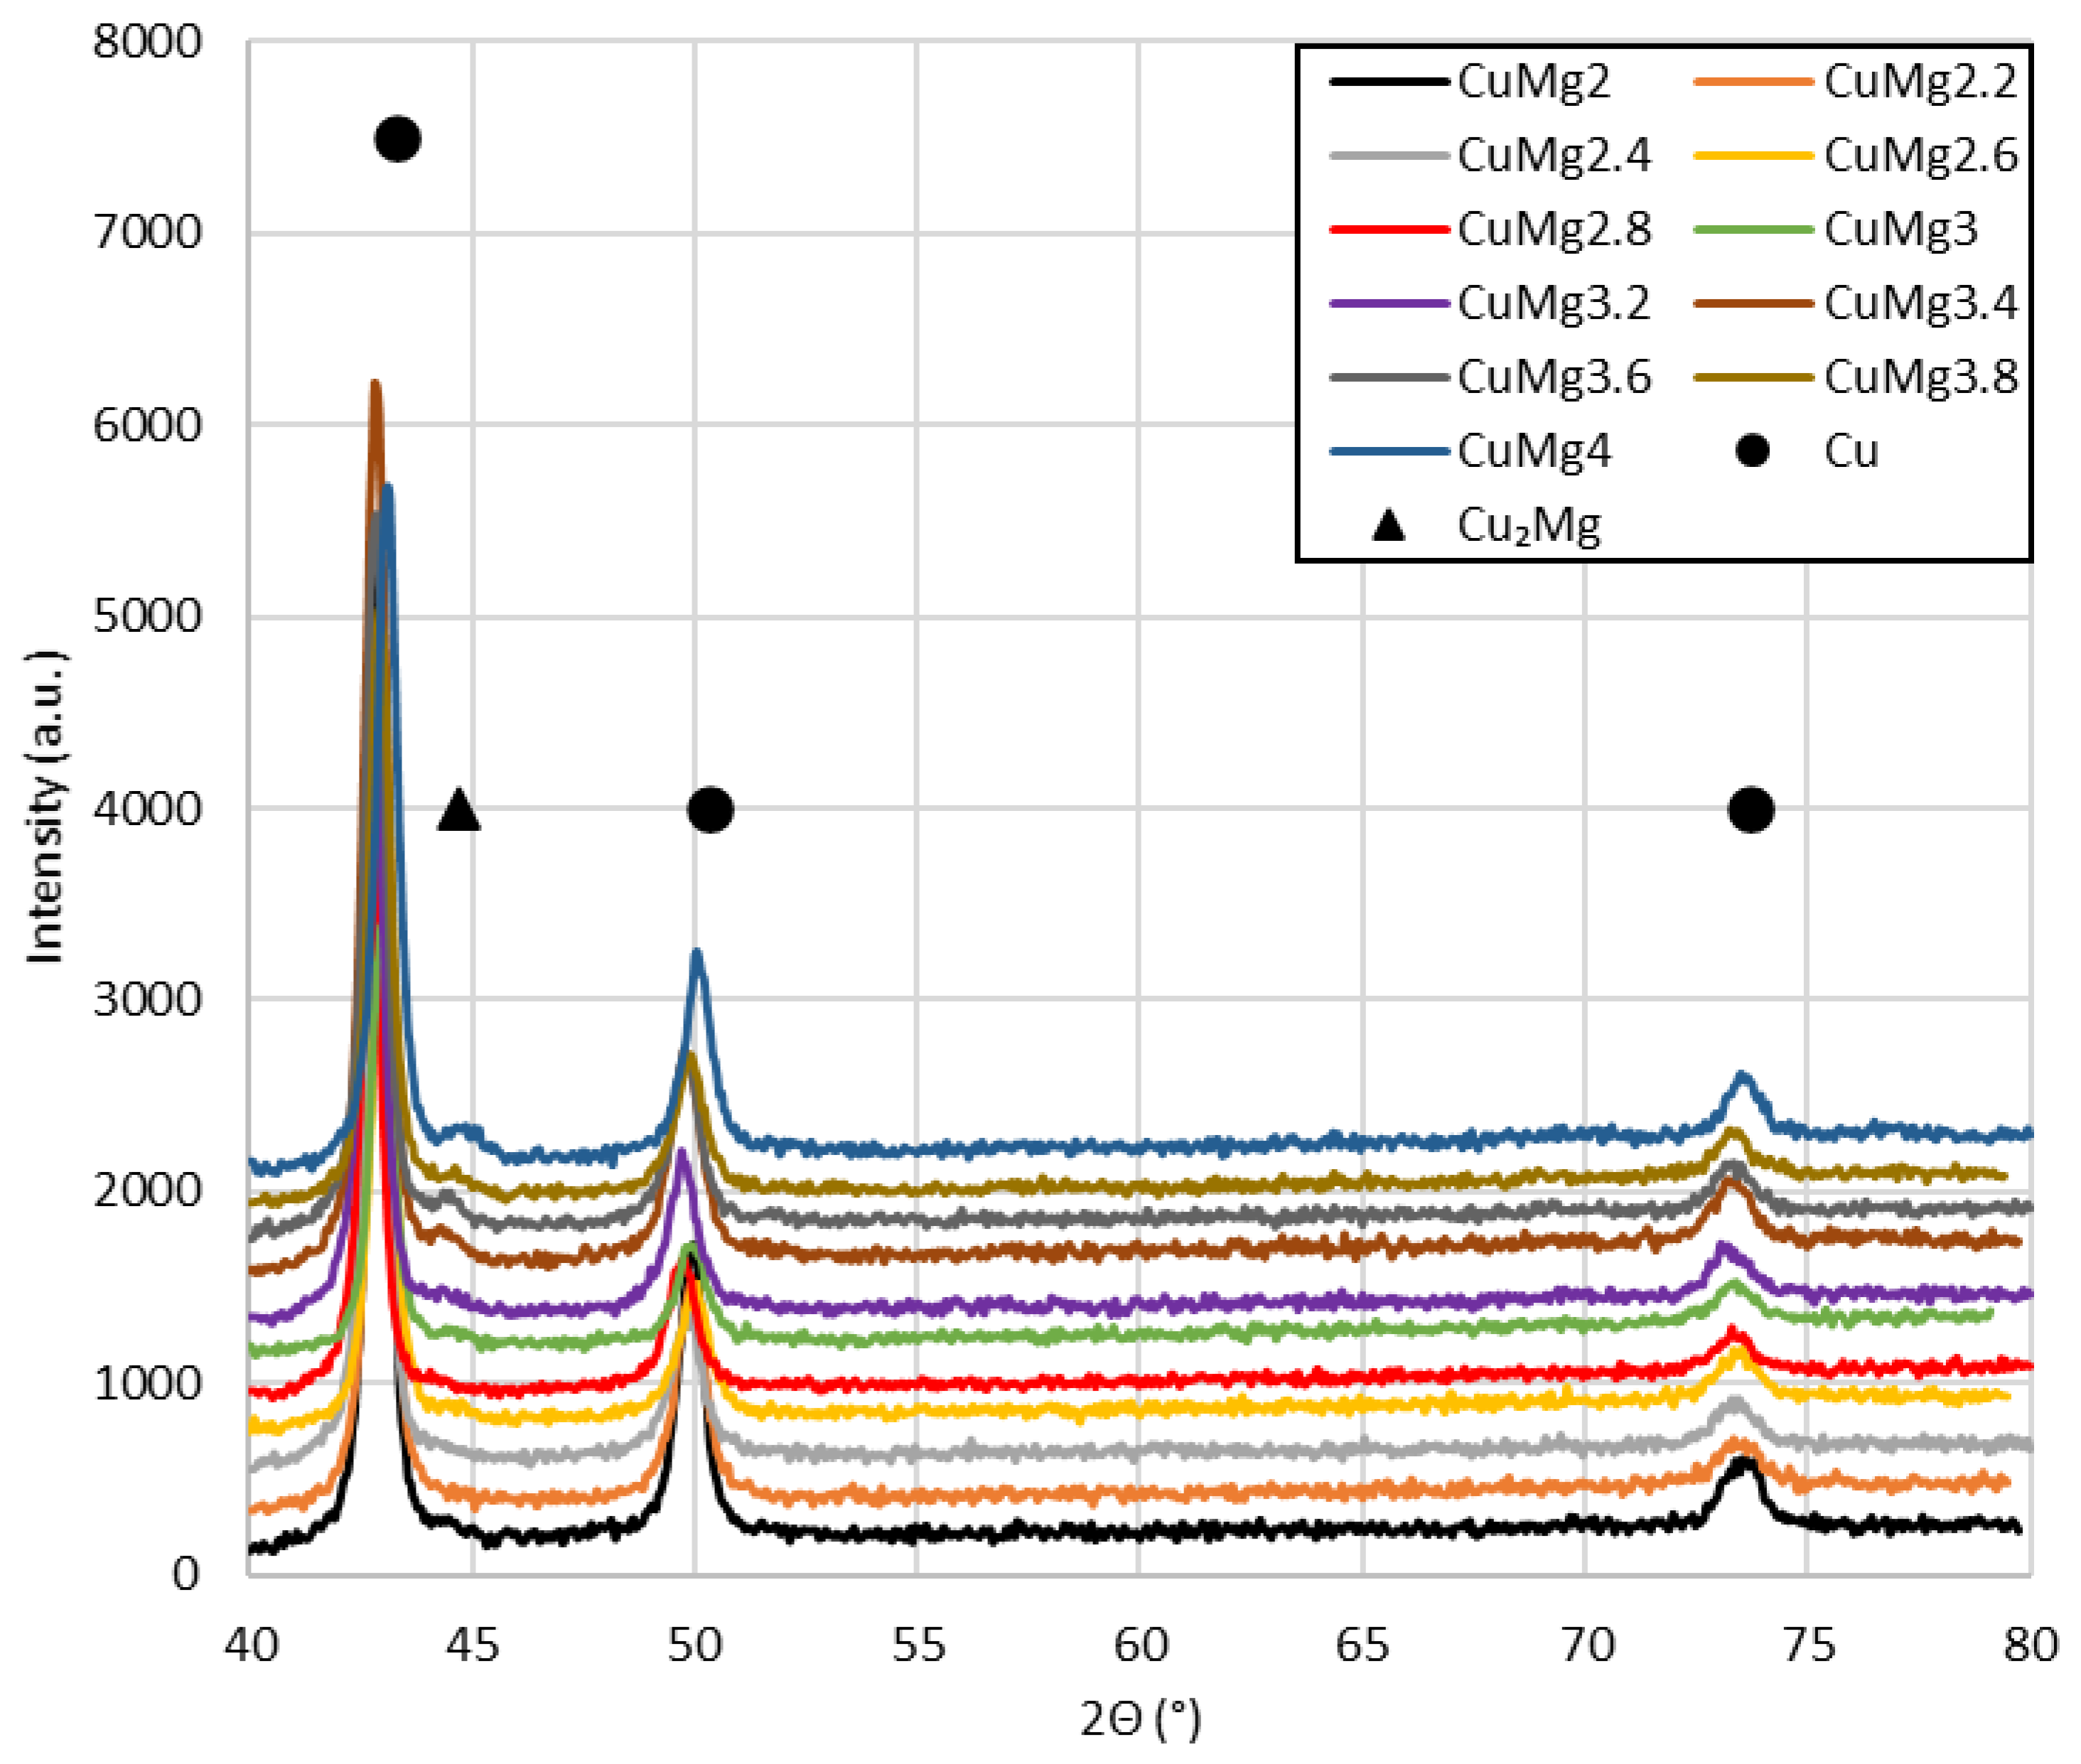
3.4. SEM Analysis and XRD Observations

Images obtained during SEM analysis of all the tested alloys in the as-cast state obtained with preliminary alloy CuMg50 (on the left) and pure Mg (on the right), with two magnifications (200× on the left and 2000× on the right), are presented at Figure 4 and Figure 5. Regardless of the Mg content and the alloy additive used, all of the observed microstructures are rich in copper dendrites surrounded by alternately existing Cu phases (light area) and Mg phases (dark area), which were evenly distributed across the volume of the materials. The observations prove that, with the increase in Mg content, the quantity of CuMg phase also increases with both alloy additives. In order to determine the intermetallic phase, additional phase analysis using XRD patterns was conducted, and the results are presented at Figure 6 and Figure 7. The peaks marked in the diagrams clearly show the presence of Cu α phase and Cu2Mg β phase in accordance with ICDD 00-004-0836 and ICDD 00-058-0360 card numbers. The quantity of β phase increases with the increase in Mg content and is only visible above 3 wt.% of Mg (two-phase alloys). No other phases were identified during the conducted tests.

4. Conclusions

Overall, the presented analysis of the chemical composition of the obtained alloys proved that the manufacture of CuMg alloys is possible. Regardless of the Mg content and the alloy additive used, it was determined that the proposed metallurgical synthesis method was correct, as the Mg wt.% did not differ more than 0.02 wt.% from that of the nominal composition. The hardness of the materials and its calculated UTS (being a function of Vickers hardness) increased quasi-linearly from approximately 80 HB to approximately 130–135 HB (Brinell), and from approximately 95 HV10 to approximately 155–175 HV10 (Vickers), as the Mg content increased. The calculated UTS of the materials in the as-cast state ranged from 300 to 500–550 MPa depending on the Mg content and the alloy additive used. The impact resistance decreased significantly as the Mg content increased up to 3 wt.% of Mg, and above this value there was little to no difference in terms of the alloy additive used. All of the obtained samples exhibited brittle fractures. Electrical conductivity decreased from 27 to 21 MS/m as the Mg content increased, and the density decreased almost linearly from 8.32 to 7.82 g/cm3. The obtained SEM images proved the existence of precipitations in the copper matrix and phase analysis determined that they were Cu2Mg β phase. Collectively, the results show that the designed CuMg alloys may successfully replace other commercially used alloys as carrying and conducting materials because many aspects of their properties are superior. These materials may be used in future electrical power systems.

Author Contributions

Conceptualization, P.S. methodology, P.S. and M.Z.; validation, P.S. and M.Z.; formal analysis, P.S.; investigation, P.S. and M.Z.; data curation, M.Z.; writing—original draft preparation, P.S.; writing—review and editing, P.S.; visualization, M.Z.; supervision, P.S.; project administration, P.S.; funding acquisition, P.S. All authors have read and agreed to the published version of the manuscript.

Funding

This research was funded by The National Centre for Research and Development—Research Project No. LIDER/33/0121/L-11/19/NCBR/2020.

Institutional Review Board Statement

Not applicable.

Informed Consent Statement

Not applicable.

Data Availability Statement

Not applicable.

Acknowledgments

Authors are grateful for the financial support of this research provided by The National Centre for Research and Development—Research Project No. LIDER/33/0121/L-11/19/NCBR/2020.

Conflicts of Interest

The authors declare no conflict of interest.

References

  1. Martins, L.S.; Guimarães, L.F.; Botelho Junior, A.B.; Tenório, J.A.S.; Espinosa, D.C.R. Electric car battery: An overview on global demand, recycling and future approaches towards sustainability. J. Environ. Manag. 2021, 295, 113091. [Google Scholar] [CrossRef] [PubMed]
  2. Zasadzińska, M.; Knych, T.; Strzępek, P.; Jurkiewicz, B.; Franczak, K. Analysis of the strengthening and recrystallization of electrolytic copper (Cu-ETP) and oxygen free copper (Cu-OF). Arch. Civ. Mech. Eng. 2019, 19, 186–193. [Google Scholar] [CrossRef]
  3. Zasadzińska, M.; Knych, T.; Smyrak, B.; Strzępek, P. Investigation of the dendritic structure influence on the electrical and mechanical properties diversification of the continuously casted copper strand. Materials 2020, 13, 5513. [Google Scholar] [CrossRef] [PubMed]
  4. Mao, Q.; Zhang, Y.; Guo, Y.; Zhao, Y. Enhanced electrical conductivity and mechanical properties in thermally stable fine-grained copper wire. Commun. Mater. 2021, 2, 46. [Google Scholar] [CrossRef]
  5. Huang, C.-L.; Xu, M.; Cui, S.; Li, Z.; Fang, H.; Wang, P. Copper-induced ripple effects by the expanding electric vehicle fleet: A crisis or an opportunity. Resour. Conserv. Recycl. 2020, 161, 104861. [Google Scholar] [CrossRef]
  6. Henckens, M.; Driessen, P.P.J.; Worrel, E. Metal scarcity and sustainability, analyzing the necessity to reduce the extraction of scarce metals. Resour. Conserv. Recycl. 2014, 93, 1–8. [Google Scholar] [CrossRef]
  7. Elshkaki, A.; Graedel, T.E.; Ciacci, L.; Reck, B.K. Copper demand, supply, and associated energy use to 2050. Glob 2016, 39, 305–315. [Google Scholar] [CrossRef] [Green Version]
  8. Schipper, B.W.; Lin, H.C.; Meloni, M.A.; Wansleeben, K.; Heijungs, R.; van der Voet, E. Estimating global copper demand until 2100 with regression and stock Dynamics. Resour. Conserv. Recycl. 2018, 132, 28–36. [Google Scholar] [CrossRef]
  9. Maki, K.; Ito, Y.; Matsunaga, H.; Mori, H. Solid-solution copper alloys with high strength and high electrical conductivity. Scr. Mater. 2013, 68, 777–780. [Google Scholar] [CrossRef] [Green Version]
  10. Ružić, J.; Stašić, J.; Rajković, V.; Božić, D. Strengthening effects in precipitation and dispersion hardened powder metallurgy copper alloys. Mater. Des. 2013, 49, 746–754. [Google Scholar] [CrossRef]
  11. Gorsse, S.; Ouvrad, B.; Goune, M.; Poulon-Quintin, A. Microstructural design of new high conductivity—High strength Cu-based alloy. J. Alloys Compd. 2015, 633, 42–47. [Google Scholar] [CrossRef] [Green Version]
  12. Lee, S.; Im, Y.-D.; Matsumoto, R.; Utsunomiya, H. Strength and electrical conductivity of Cu-Al alloy sheets by cryogenic high-speed rolling. Mater. Sci. Eng. A 2020, 799, 139815. [Google Scholar] [CrossRef]
  13. Prashanth, M.; Satish, N.; Ajay kumar, B.S. Effect of Brass and Silver on Mechanical Properties of Copper. Mater. Today Proc. 2018, 5, 25404–25411. [Google Scholar] [CrossRef]
  14. Tardieua, S.; Mesguich, D.; Lonjon, A.; Lecouturier, F.; Ferreira, N.; Chevalliera, G.; Proietti, A.; Estournèsa, C.; Laurent, C. Nanostructured 1% silver-copper composite wires with a high tensile strength and a high electrical conductivity. Mater. Sci. Eng. A 2019, 761, 138048. [Google Scholar] [CrossRef] [Green Version]
  15. Zhang, B.B.; Tao, N.R.; Lu, K. A high strength and high electrical conductivity bulk Cu-Ag alloy strengthened with nanotwin. Scr. Mater. 2017, 129, 39–43. [Google Scholar] [CrossRef]
  16. Strzępek, P.; Mamala, A.; Zasadzińska, M.; Franczak, K.; Jurkiewicz, B. Research on the drawing process of Cu and CuZn wires obtained in the cryogenic conditions. Cryogenics 2019, 100, 11–17. [Google Scholar] [CrossRef]
  17. Li, R.; Guo, E.; Chen, Z.; Kang, H.; Wang, W.; Zou, C.; Li, T.; Wang, T. Optimization of the balance between high strength and high electrical conductivity in CuCrZr alloys through two-step cryorolling and aging. J. Alloys Compd. 2019, 771, 1044–1051. [Google Scholar] [CrossRef]
  18. Zhang, Z.Y.; Sun, L.X.; Tao, N.R. Nanostructures and nanoprecipitates induce high strength and high electrical conductivity in a CuCrZr alloy. J. Mater. Sci. Technol. 2020, 48, 18–22. [Google Scholar] [CrossRef]
  19. Li, Y.; Xiao, Z.; Li, Z.; Zhou, Z.; Yang, Z.; Lei, Q. Microstructure and properties of a novel Cu-Mg-Ca alloy with high strength and high electrical conductivity. J. Alloys Compd. 2017, 723, 1162–1170. [Google Scholar] [CrossRef]
  20. Cao, Y.; Han, S.Z.; Choi, E.-A.; Ahn, J.H.; Mi, X.; Lee, S.; Shin, H.; Kim, S.; Lee, J. Effect of inclusion on strength and conductivity of CuNiSi alloys with discontinuous precipitation. J. Alloys Compd. 2020, 843, 156006. [Google Scholar] [CrossRef]
  21. Geng, G.; Wang, D.; Zhang, W.; Liu, L.; Laptev, A.M. Fabrication of Cu-Ni-Si alloy by melt spinning and its mechanical and electrical properties. Mater. Sci. Eng. A 2020, 776, 138979. [Google Scholar] [CrossRef]
  22. Zhang, R.; Li, Z.; Sheng, X.; Gao, Y.; Lei, Q. Grain refinement and mechanical properties improvements in a high strength Cu-Ni-Si alloy during multidirectional forging. Fusion Eng. Des. 2020, 159, 111766. [Google Scholar] [CrossRef]
  23. Huang, J.; Xiao, Z.; Dai, J.; Li, Z.; Jiang, H.; Wang, W.; Zhang, X. Microstructure and properties of a novel CuNiCoSiMg alloys with super high strength and conductivity. Mater. Sci. Eng. A 2019, 744, 754–763. [Google Scholar] [CrossRef]
  24. Zhao, Z.; Xiao, Z.; Li, Z.; Qiu, W.; Jiang, H.; Lei, Q.; Liu, Z.; Jiang, Y.; Zhang, S. Microstructure and properties of a CuNiSiCoCr alloy with high strength and high conductivity. Mater. Sci. Eng. A 2019, 759, 396–403. [Google Scholar] [CrossRef]
  25. Yu, X.; Hou, Y.; Ren, X.; Sun, C.; Wang, M. Research progress on the removal, recovery and direct high-value materialization of valuable metal elements in electroplating/electroless plating waste solution. J. Water Process. Eng. 2022, 46, 102577. [Google Scholar] [CrossRef]
  26. Fateh, A.; Aliofkhazraei, M.; Rezvanian, A. Review of corrosive environments for copper and its corrosion inhibitors. Arab. J. Chem. 2020, 13, 481–544. [Google Scholar] [CrossRef]
  27. Yu, X.; Wang, Z.; Lu, Z. In situ investigation of atmospheric corrosion behavior of copper under thin electrolyte layer and static magnetic field. Microelectron. Reliab. 2020, 108, 113630. [Google Scholar] [CrossRef]
  28. Yu, X.; Wang, Z.; Lu, Z. Atmospheric corrosion behavior of copper under static magnetic field environment. Mater. Lett. 2020, 266, 127472. [Google Scholar] [CrossRef]
  29. Zhang, X.; Qian, Q.; Qiang, L.; Zhang, B.; Zhang, J. Comparison study of gold coatings prepared by traditional and modified galvanic replacement deposition for corrosion prevention of copper. Microelectron. Reliab. 2020, 110, 113695. [Google Scholar] [CrossRef]
  30. Mashtalyar, D.; Gnedenkov, S.; Sinebryukhov, S.; Imshinetskiy, I.; Gnedenkov, A.; Bouznik, V. Composite coatings formed using plasma electrolytic oxidation and fluoroparaffin materials. J. Alloy. Compd. 2018, 767, 353–360. [Google Scholar] [CrossRef]
  31. Sun, M.; Yerokhin, A.; Bychkova, M.; Shtansky, D.V.; Levashov, E.; Matthews, A. Self-healing plasma electrolytic oxidation coatings doped with benzotriazole loaded halloysite nanotubes on AM50 magnesium alloy. Corros. Sci. 2016, 111, 753–769. [Google Scholar] [CrossRef]
  32. Gnedenkov, S.; Sinebryukhov, S.; Egorkin, V.; Mashtalyar, D.; Vyaliy, I.; Nadaraia, K.; Imshinetskiy, I.; Nikitin, A.; Subbotin, E.; Gnedenkov, A. Magnesium fabricated using additive technology: Specificity of corrosion and protection. J. Alloy. Compd. 2019, 808, 151629. [Google Scholar] [CrossRef]
  33. Karavai, O.; Bastos, A.; Zheludkevich, M.; Taryba, M.; Lamaka, S.V.; Ferreira, M.G.S. Localized electrochemical study of corrosion inhibition in microdefects on coated AZ31 magnesium alloy. Electrochimica Acta 2010, 55, 5401–5406. [Google Scholar] [CrossRef]
  34. Liu, G.; Jia, S.; Hong, S.; Lim, J.; Zhu, Y.; Mimura, K.; Isshiki, M. Corrosion resistance of dilute CuMg alloys at elevated temperature. Corros. Sci. 2009, 51, 463–468. [Google Scholar] [CrossRef]
  35. Rodriguez-Calvillo, P.; Ferrer, N.; Cabrera-Marrero, J.-M. Analysis of microstructure and strengthening in CuMg alloys deformed by equal channel angular pressing. J. Alloy. Compd. 2015, 626, 340–348. [Google Scholar] [CrossRef]
  36. Tong, Y.-X.; Li, S.-Y.; Zhang, D.-T.; Li, L.; Zheng, Y.-F. High strength and high electrical conductivity CuMg alloy prepared by cryorolling. Trans. Nonferrous Met. Soc. China 2019, 29, 595–600. [Google Scholar] [CrossRef]
  37. Ito, Y.; Matsunaga, H.; Mori, H.; Maki, K. Effect of Plastic Deformation on the Proof Strength and Electrical Conductivity of Copper-Magnesium Supersaturated Solid-Solution Alloys. Mater. Trans. 2014, 55, 1738–1741. [Google Scholar] [CrossRef] [Green Version]
  38. Nishikawa, K.I.; Semboshi, S.; Konno, T.J. Transmission Electron Microscopy Observations on Cu-Mg Alloy Systems. SSP 2007, 127, 103–108. [Google Scholar] [CrossRef]
  39. Strzępek, P.; Mamala, A.; Zasadzińska, M.; Noga, P.; Sadzikowski, M. The influence of the continuous casting conditions on the properties of high-strength two-phase CuMg alloys. Materials 2020, 13, 4805. [Google Scholar] [CrossRef] [PubMed]
  40. Wang, B.; Zhang, Y.; Tian, B.; Yakubov, V.; An, J.; Volinsky, A.A.; Liu, Y.; Song, K.; Li, L.; Fu, M. Effects of Ce and Y addition on microstructure evolution and precipitation of Cu-Mg alloy hot deformation. J. Alloy. Compd. 2019, 781, 118–130. [Google Scholar] [CrossRef]
  41. Tabor, D. The hardness and strength of metals. J. Inst. Met. 1951, 79, 1–18. [Google Scholar]
  42. Tabor, D. The hardness of solids. Rev. Phys. Technol. 1970, 1, 145–179. [Google Scholar] [CrossRef]
  43. Cahoon, J.R. An improved equation relating hardness to ultimate strength. Metall. Mater. Trans. B 1972, 3, 3040. [Google Scholar] [CrossRef] [Green Version]
  44. Nordheim, L. Zur Elektronentheorie der Metalle. I. Ann. Phys. 1931, 401, 607–640. [Google Scholar] [CrossRef]
Figure 1. Average values of hardness of the tested materials; Brinell’s method marked with a full line; Vickers method marked with a dotted line; pure Mg marked with circles; preliminary alloy CuMg50 marked with triangles.
Energies 15 02093 g001
Figure 2. Average values of the calculated UTS and impact resistance of the tested materials; impact resistance marked with a full line; UTS marked with a dotted line; pure Mg marked with circles; preliminary alloy CuMg50 marked with triangles.
Energies 15 02093 g002
Figure 3. Average values of electrical conductivity and density of the tested materials; electrical conductivity marked with a full line; density marked with a dotted line; pure Mg marked with circles; preliminary alloy CuMg50 marked with triangles.
Energies 15 02093 g003
Figure 4. Backscatter electron SEM analysis of CuMg alloys in the as-cast state obtained with preliminary alloy CuMg50 (on the left) and pure Mg (on the right) with two magnifications (200× on the left and 2000× on the right); the analyzed chemical composition of the alloy is marked on each of the images.
Energies 15 02093 g004
Figure 5. Backscatter electron SEM analysis of CuMg alloys in the as-cast state obtained with preliminary alloy CuMg50 (on the left) and pure Mg (on the right) with two magnifications (200× on the left and 2000× on the right); the analyzed chemical composition of the alloy is marked on each of the images.
Energies 15 02093 g005
Figure 6. The X-ray diffraction patterns for the CuMg ingots obtained with preliminary alloy CuMg50 in the as-cast state with the marked peaks.
Energies 15 02093 g006
Figure 7. The X-ray diffraction patterns for the CuMg ingots obtained with pure Mg in the as-cast state with the marked peaks.
Energies 15 02093 g007
Table 1. Chemical compositions of the obtained alloys.
Alloy AdditivePreliminary Alloy CuMg50Pure Mg
Nominal Chemical CompositionCuMgOtherCuMgOther
wt.%
CuMg297.922.010.0797.9520.05
CuMg2.297.702.210.0997.712.180.11
CuMg2.497.512.410.0897.52.390.11
CuMg2.697.312.600.0997.312.60.09
CuMg2.897.102.810.0997.122.80.08
CuMg396.903.000.1096.913.010.08
CuMg3.296.723.210.0796.723.20.08
CuMg3.496.503.420.0896.53.460.04
CuMg3.696.313.600.0996.313.60.09
CuMg3.896.103.810.0996.143.790.07
CuMg495.904.010.0995.94.010.09
Publisher’s Note: MDPI stays neutral with regard to jurisdictional claims in published maps and institutional affiliations.

