Abstract
In this paper, the influence of the number of ground motions on fragility analysis of 5 MW wind turbines under the excitation of aerodynamic and seismic loads is investigated to acquire the sufficient number of records for reasonable fragility estimation. Two scenarios, parked and normal operation, were simulated with the number of actual recorded ground motions ranging from 2 to 48. The fragility function parameters are estimated by utilizing the method of multiple stripe analysis (MSA), and the relationship between the number of ground motions and estimated parameters for each scenario is discussed. In addition, the influence of the number of ground motions on the range of estimated parameters with a 95% confidence interval is also discussed. The simulation results show that there are significant differences between the two scenarios in terms of fragility analysis for 5 MW wind turbines with the interaction of wind and seismic loads, and the lesser number of earthquakes is needed for a normal operation scenario compared to the parked scenario when obtaining the same accuracy fragility estimation. Furthermore, the appropriate number of ground motions to accurately estimate the fragility parameters of 5 MW wind turbines for the two scenarios is presented herein, which is almost unaffected by different wind spectra.
1. Introduction
The continuing exhaustion of fossil fuels and the increasing demand for energy have promoted the research of renewable energy. Sustainable, renewable, and clean energy, wind energy, is a good choice. Consequently, wind turbines have grown greatly in the past several decades, and the trend is to continue, which will cause the global wind power to reach 2000 GW by 2030 [1]. The developments and improvements made in the field of wind turbines have meant that more and more wind turbines are installed in seismically active areas, such as China, Japan and North America [2]. In seismic active areas, wind turbines with a large slenderness ratio and flexibility are vulnerable to damage caused by the combined action of environmental wind and seismic load. Although the wind turbine structure was not damaged after an MW8.2 earthquake in Mexico [3], the safety of the structure under seismic load is very important because of its destructiveness and uncertainty. According to Industry code DNV-OS-J101 [4] and the International Electrotechnical Commission (IEC) 61400-1 [5], the large-scale wind turbine structures should be designed to resist ground motions when installed in seismically active areas. Many researchers have studied the safety and reliability of large-scale wind turbines subjected to complex external excitation through seismic fragility analysis [6,7,8,9]. In order to develop fragility functions for large-scale wind turbine structural models, it is essential to obtain the dynamic responses from a large number of nonlinear dynamic analyses. Chen et al. [10] used a dynamic finite element method (FEM) to analyze wind-induced response characteristics of a wind turbine tower considering the blade-tower coupling. Asareh et al. [11] used a developed finite element model to obtain the nonlinear dynamic behavior of a 5-MW wind turbine. Tran et al. [12] used the specialized software program SACS (Structural Analysis Computer System) to study the directional bending performance of a 4-leg jacket substructure, supporting a 3 MW offshore wind turbine. Sharmin et al. [13] compared nonlinear and linear dynamic analysis and found that the nonlinear structure produces the highest estimated uncertainty compared to the linear structure. Sharmin et al. [14] studied the seismic responses of offshore wind turbines considering the earthquake incident angle. We all know that it is computationally expensive to perform many analyses on complex structural systems. Therefore, it is necessary to study the possibility of using a smaller number of nonlinear motion history analyses to obtain the same type of response distribution.
As the main component of risk assessment, seismic fragility analysis can provide a reference for the safety margin of a selected structure. In the past several decades, plenty of works have been undertaken to research the seismic fragility of structures in civil engineering, and these works have mainly focused on the fields of frame buildings and bridges [15,16,17,18,19,20,21,22]. In recent years, more and more researchers have investigated the seismic fragility of large-scale wind turbines. Nuta [23] evaluated the seismic risk of a 1.65 MW wind turbine in parked condition by using the method of incremental dynamic analysis (IDA) with 20 ground motion records. For a 5 MW offshore wind turbine, Kim et al. [24] studied the seismic fragility considering the interaction of pile and soil, and the condition of the wind turbines they studied was parked and the number of earthquake records was only three. Patil et al. [25] studied the seismic fragility of a wind turbine tower under the excitation of 15 near-fault and 17 far-fault ground motions. Mo et al. [26] performed the seismic fragility analysis of a monopile offshore wind turbine considering different operational conditions with 24 earthquake records. Hemmati et al. [27] performed the seismic fragility analysis of wind turbines controlled by tuned liquid column dampers (TLCD), and found the number of ground motions to be 30. Ali et al. [28] considered that the seismic input for nonlinear dynamic analysis of wind turbines should represent anticipated earthquake scenarios and must be compatibly selected, and used a total of 1243 earthquake records to study the seismic vulnerability of offshore wind turbines. Chaudhari and Somala [29] derived the fragility curves of wind turbines based on the responses by computing with the IDA method. We can find that in these studies, wind load was not considered during the analysis. Del Campo and Pozos-Estrada [30] studied the multi-hazard fragility of a wind turbine support structure under the simultaneous action of wind and earthquake for different intensities. Mardfekri and Gardoni [31] estimated the fragility of an offshore wind turbine subjected to environmental and operational loadings by developing probabilistic models. Mo et al. [32] studied the influence of the directionality of an earthquake on the fragility of a 5 MW wind turbine. Asareh et al. [11] studied the fragility of a 5 MW wind turbine designed by the NREL (National Renewable Energy Laboratory) [33] under the coupling excitation of aerodynamic and seismic loads based on a finite element model with 22 ground motion records. However, it can be found that the number of earthquake records in these studies is different, and further analyses are needed to evaluate that the number of ground motions is enough to warrant the best estimation of parameters in fragility function.
In order to improve the accuracy of estimated probabilities of exceeding specific limit states for ground motion intensity measures (IMs), several researchers have studied the related scheme. The method of IDA and multiple stripe analysis (MSA) [34] are commonly used by researchers. Through investigating the method of selecting earthquake records, Baker and Allin [35] concluded that the bias and variance of structural dynamic responses can be reduced by choosing ground motions based on spectral shape, and found that the estimation of parameters in fragility function produced by MSA is more efficient than IDA with a given number of structural dynamic analyses. Hancock et al. [36] pointed out that using spectrally matched ground motions can obtain a robust estimation of structural responses and reduce the number of ground motions. Banerjee et al. [37] proposed a method by spectrally matching ground motions to the spectrum of specified periods, which is statistically efficient relative to conventional approaches. Actually estimating structural responses is the basis of fragility analysis. Shome [38] stated that 20 ground motion records can ensure accurate estimates for structural responses. Based on a single degree of freedom (SDOF) model, Gehl et al. [39] studied the accuracy of structural response estimates with a different number of dynamic responses. Cimellaro et al. [40] researched the sensitivity of the number of earthquake records using an MDOF inelastic shear-type building and concluded that using 23 ground motions can obtain the accurate estimation of parameters in fragility functions when PGA is IM. Jin and Chi [41] analyzed the effect of the number of earthquake records on the seismic fragility analysis of high earth-rockfill dams. Mo et al. [32] selected 28 near-field and 22 far-field ground motions as a suite. For wind turbines when only considering seismic loads, the influence of the number of records on accurate fragility estimation will be similar to the normal building structures. However, the influence may be different for modern wind turbines under the coupled excitation of aerodynamic and seismic loads. Furthermore, the aerodynamic loads are the common external loads for the wind turbines. Therefore, it is significant to investigate the influence of the number of earthquake records on the fragility of large-scale wind turbines subjected to the coupled excitation of aerodynamic and seismic loads.
In this study, the objective was to investigate the influence of the number of ground motions on the seismic fragility of large-scale wind turbines subjected to the coupling of aerodynamic and seismic loads. In this paper, a 5 MW NREL wind turbine model [33] was used, and two scenarios, parked and normal operation, were considered and the analysis results were compared. Real ground motions were intensified by spectrally matching them to the target spectrum and the FAST (Fatigue, Aerodynamics, Structures, and Turbulence) [42] was utilized to obtain the dynamic responses of wind turbines subjected to aerodynamic and seismic loads. We then used MSA to estimate the parameters of fragility functions. The influence of the number of earthquake records on the dynamic responses and estimated fragility parameters for the two scenarios was studied. The relationship between the range of confidence interval of the estimated parameters with 95% confidence coefficient and the number of earthquake records were obtained, and the sufficient number of earthquake records for each scenario was presented. The influence of wind spectra on the sufficient number of earthquake records was also investigated.
2. Coupled Excitation of Aerodynamic and Seismic Loads
For modern wind turbines constructed in seismically active regions where have rich wind resources, they will be subjected to coupled excitation of aerodynamic and seismic loads. In this paper, the configuration of the wind turbine is based on the 5 MW NREL wind turbine [33]. For the research of modern onshore and offshore wind turbines, the 5 MW NREL wind turbine is always intended to serve as a standard model. More details about the structural properties of the wind turbine are shown in Table 1. Two different scenarios were considered. The first scenario is a parked condition with zero rpm of rotor speed and 90 of pitch angle, and the second scenario is the normal operation condition with rotor speed and pitch angle changing according to the baseline control system (BCS) [6]. This research intends to investigate the influence of the number of ground motions on the fragility estimation of a 5 MW wind turbine in the two scenarios and to determine the sufficient number of earthquake records. The dynamic responses of wind turbines subjected to coupled excitation are simulated using the FAST [42] code and the flowchart of simulation is shown in Figure 1.

Table 1.
Properties of the 5 MW NREL wind turbine [33].
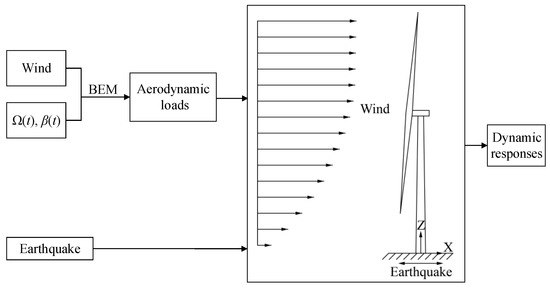
Figure 1.
Flowchart of a wind turbine subjected to coupled excitation of aerodynamic and seismic loads.
2.1. Aerodynamic Load
According to the theory of blade element momentum (BEM) [43,44], the aerodynamic load acting on the blades can be obtained. In the BEM, the blades are assumed to be discretized into small elements which are independent of adjacent elements. The transversal section of one element with its chord length and the aerodynamic forces on it are shown in Figure 2.
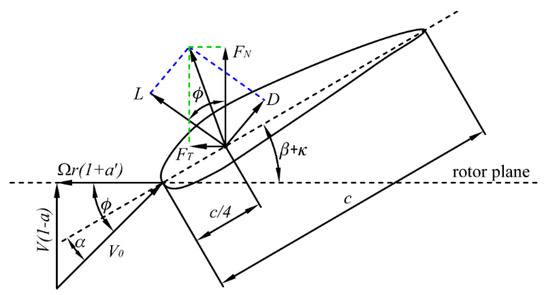
Figure 2.
Forces at the blade element [44].
The blade-pitch angle is the degree between the airfoil zero line and the plane of disc [45]. The lift and drag forces , and the aerodynamic forces in flapwise and edgewise direction are computed as follows [44]:
where, is the distance from the hub to the element, is the drag coefficient, is the lift coefficient, is the instantaneous wind speed, is the relative wind speed, is the rotational speed, is the axial induction factor, is the tangential induction factor, is the instantaneous local angle of attack, is the flow angle, is the pitch angle, and is the local pre-twist of the blade.
The effective area A, density of air and wind velocity determine the wind force acting on the tower [32,46]. Located at a vertical distance y, the wind load calculation formula of can be expressed as:
In this paper, both the and are zero in the parked scenario, and the and are changing along time according to the wind speed based on the power control system in normal operation scenario [6,7].
2.2. Seismic Model
By using a multi-body dynamic formulation, FAST solves the equation of motions for horizontal axis wind turbines (HAWT) in the time domain. Sixth order polynomial formulations are used to describe the tower and blades mode shapes given in the input files. The motions equation can be written as follow [42,47]:
where, is the mass matrix; is the nonlinear forcing function; is the vector of control inputs; is the vector of wind inputs; is time; , and are the vectors of DOF states, velocities and accelerations, respectively.
An updated model written in FORTRAN was proposed by Asareh and Prowell [48] to simulate the seismic responses for FAST. Through experimental studies, the model was verified with good consistency between module predictions and experiments [49]. Many researchers have used the updated FAST code [50,51,52,53,54]. In the improved model, the ground motion excitation is applied as a force fe for each translational direction at the tower base of a modeled wind turbine through a damped actuator [48]. The coupling of aerodynamic and seismic loads can be considered based on the improved FAST source codes. According to Equation (9), through expanding as a Taylor series approximation [6], the second-order linearized representation of the equation [42] about the operating point (op) can be obtained:
where, is the mass matrix; is the damping matrix; is the stiffness matrix; is the control input matrix; is the wind input matrix; and is the vector of seismic load formed according to fe.
In this paper, when calculating the dynamic responses of modern wind turbines subjected to aerodynamic and seismic load interactions, it is necessary to obtain the executable program file in advance. The BCS was implemented as an external dynamic link library (DLL) [33], and the source code for DLL can be found in the OpenFAST website of NREL [55]. Based on the seismic source codes [55] and the flowchart of the overall integrated control system calculations and the properties of BCS [7,33], the executable program file can be obtained by using the Visual Fortran Compiler [42,48]. The two conditions of normal operation and parked operation can be realized by setting the input files. Combined with earthquake records, the dynamic analysis of wind turbines for two conditions can be carried out. More details about compiling source codes can be seen in references [42,48].
3. Fragility Analysis
3.1. Fragility Function
For fragility curves, the convenient IMs are always spectral acceleration (Sa) at the structural fundamental period and PGA. It is a common assumption that the variation of IM values of earthquake records related to a damage state of a selected structure follows a lognormal distribution [56]. An appropriate IM is important for fragility analysis, and Ali et al. [28] studied alternative IMs. PGA was selected as the IM in references [26,27,29,30] and our previous studies [6,7]. The aim of this paper is to study the influence of the number of ground motions on fragility analysis of 5 MW wind turbines. Therefore, the PGA is selected as IM in this paper. It should be pointed out that all the analyses in this paper considered the same wind conditions and for that reason the wind speed was not included as IM. A lognormal cumulative distribution function can be used as the fragility function. as the probability of structure to reach a certain damage state caused by an earthquake with can be shown in Equation (11) [6]:
where, is the standard normal cumulative distribution function; and are the median and standard deviation of , respectively.
According to the study in [57], the fragility parameters are estimated by the approach of MSA herein. To obtain the fragility parameters, the likelihood function [57] is defined as:
where, is a product over all levels, is the number of levels, is the number of ground motions with , is the number of exceeding the damage state.
The and are obtained by minimizing the summation of squared errors between the predicted probabilities of damage and the observed fractions of damage shown in Equation (13) [57]:
3.2. Damage State
In order to obtain the fragility curves of the 5 MW wind turbine considering aerodynamic and seismic loads interaction, it is significant to define the damage state of the turbine. As an inverted cantilever structure, the wind turbine responds mostly in a cantilever mode with maximum contributions from the fundamental mode. Therefore, a static pushover analysis can be used to define the damage state, which had been utilized by Kim et al. [24], who found that the maximum displacement of the nacelle and maximum stress have a one-to-one relationship. According to Asareh et al. [11], the position of maximum tower stress for an NREL 5 MW wind turbine subjected to earthquake excitation is the tower base.
The employed 5 MW wind turbine is illustrated in Figure 1. According to Jonkman et al. [33], the Young’s modulus, shear modulus, yield strength, and effective density of a steel tower are 210 GPa, 80.8 GPa, 408 MPa and 8500 kg/m3 respectively. Although the maximum stress of structural material can be the direct indicator for damage, the available displacement according to criterion is more convenient. Therefore, the static pushover analysis by applying a horizontal displacement load in the FA direction to the rigid nacelle was implemented to obtain the critical displacement. It should be noted that the buckling limit state condition is not explicitly taken into account for the tower model in this paper. The tower base stress to nacelle displacement is shown in Figure 3. The nacelle displacement for the stress at the tower base first exceeding the yield stress is defined as the damage criteria, and the obvious yield level is pointed out in Figure 3. The critical nacelle displacement is 2.418 m. According to [6] and [7], the number of damage criteria is four. In this paper, the purpose is to study the influence of the number of earthquakes on the fragility of modern wind turbines subjected to the coupled excitation of aerodynamic and seismic loads, so only the critical nacelle displacement is chosen as damage criteria.
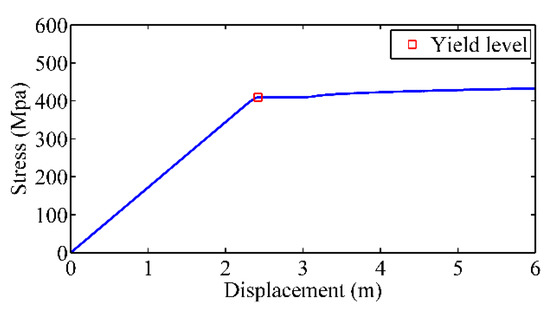
Figure 3.
Relation between tower base stress and the nacelle displacement.
4. Simulation Results and Discussion
The Taiwan Strait between Fujian and Taiwan has the strongest wind speeds in China [58]. In this area, the site class is II [59], which means that if modern wind turbines are constructed here, they are likely to withstand the coupled excitation of aerodynamic and seismic loads. For the seismic fragility analysis of wind turbines, the actual ground motion records selected from the database were used as loads excitation [6,7,26,27,28,29,30]. The actual ground motion records were used in this paper. For earthquake records, there are many uncertainties such as in magnitude and distance, so selecting the ground motions within appropriate ranges is needed. According to the guideline proposed by Elnashai and Sarno [60], the reasonable ranges of magnitude unit and distance are ±0.3 and ±20–40 km, respectively. The general consensus is to select ground motions so their magnitude and distance are within a close range of the target scenarios. Based on the design response spectrum of the Fujian area [59] (Figure 4), with the calculated magnitude range of 6.0–6.6 and a distance range between 30 and 80 km, 50 earthquake records were selected in strong-motion database of the Pacific Earthquake Engineering Research Center (PEER) [61]. The characteristics of selected records can be found in Table A1.
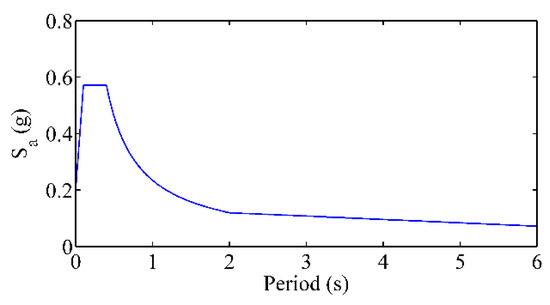
Figure 4.
The design response spectrum of the Fujian area.
The scope of the simulations considered in this study is organized into two scenarios, the parked condition and normal operation condition. The rated wind speed time histories with 600 s used in both the two scenarios and generated using the program TurbSim [62]. Figure 5 gives the wind speed time histories with the average wind speed rated speed at the hub height (Vhub = 11.4 m/s). For the rated wind speed, the turbulence characteristic is Class A and the turbulent model is the Kaimal spectra [5].
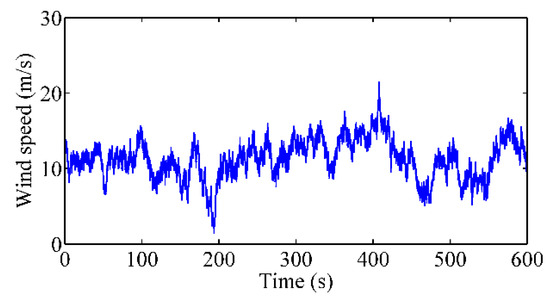
Figure 5.
The time histories of Vhub = 11.4 m/s.
During the simulation, each ground motion was applied at 400 s. Jalayer [34] pointed out that the statistical information can be provided by the results of MSA through scattering the multiple stripes with constant IM (PGA). Next, the fragility curves of the 5 MW wind turbine subjected to coupled excitation of aerodynamic and seismic loads for the two scenarios were obtained based on the Equations (11) and (13), and shown in Figure 6. There is a great difference between the two scenarios for the fragility curve in Figure 6. In a normal operation condition, the probability of exceeding the damage state is significantly less than that in the parked condition with the same PGA. The loads on the structure in the normal operation condition with a power control system working may be reduced compared with the parked condition. According to Asareh et al. [53,54] and Valamanesh and Myers [63], the coupling of aerodynamic and seismic loads will encounter the aerodynamic damping, which will reduce the dynamic response of wind turbines. This is because the aerodynamic damping is affected by the rotor speed , the instantaneous local angle of attack , the drag coefficient , the lift coefficient , and the derivatives of and with respect to [63]. Therefore, the aerodynamic damping in the normal operation condition is larger than that in the parked condition caused by the changing rotor speeds and pitch angles in normal operation condition [6,7], which causes the probability of exceeding the damage state in normal operation condition is less than that in parked condition with the same PGA. Through comparing the fragility curves between the two scenarios, it can be concluded that the coupled excitation has a great influence on the fragility of modern wind turbines. Therefore, the influence of the number of earthquake records on the fragility of modern wind turbines subjected to the coupled excitation of aerodynamic and seismic loads may be different with building structures, and it is necessary to study the number of ground motions to obtain an accurate fragility estimation of modern wind turbines under coupled excitation.
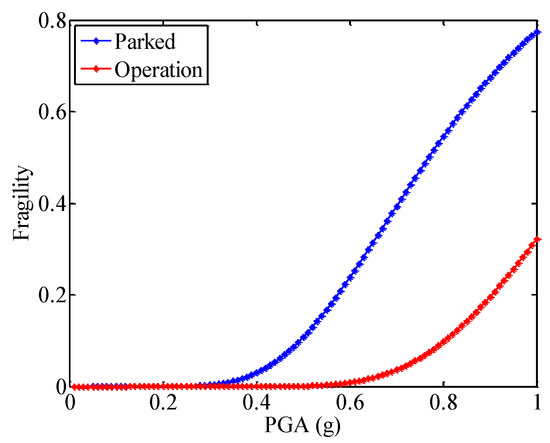
Figure 6.
The fragility curves for different critical states.
4.1. The Influence of the Number of Ground Motions on Dynamic Response
When developing the fragility function, it is essential to collect the maximum FA tower top displacement from many dynamic analyses with different IMs. From the set of 50 ground motions, it is possible to randomly select two earthquake records and then obtain the standard deviation (STD) and mean values of maximum FA displacements. In this case, the choice of the two records will affect the values of STD and mean, so we randomly selected 1000 groups without repetition and could obtain 1000 mean and STD values for the two records. Then the coefficient of variation (COV) of STD and mean values can be calculated for the two records. In the same way, the COV of STD and mean values can be obtained for more than two records. For the two scenarios, the relationship between the number of earthquake records and the COV of the mean value of maximum FA displacement is calculated by repeating the same way for up to 48, spaced at two records. And the comparison of the COV of the STD of maximum FA displacement with a different number of earthquake records between the two scenarios is shown in Figure 7. The COV of the mean decreases tends to be stable with the number of ground motions increased for both the two scenarios in Figure 8. However, the value of COV in the parked condition is larger than that in the normal operation condition when the number of records is the same, which means that it needs a greater number of records in the parked condition than that in normal operation condition to reach the same COV. In Figure 7, the trend of the number of records with the COV of STD is the same as the COV of the mean, which tends to be constant as the number of records increases. It is also noted from Figure 7 that there is a slight difference between the two scenarios for the COV of STD.
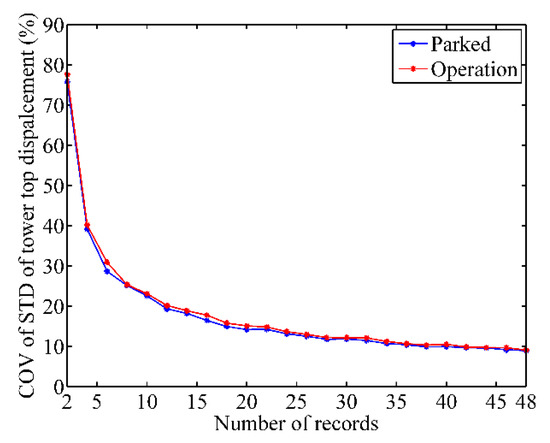
Figure 7.
COV of the STD of maximum FA displacement with a different number of records.
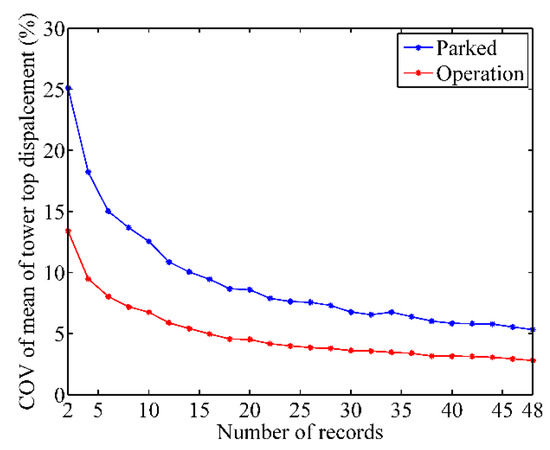
Figure 8.
COV of the mean of maximum FA displacement with a different number of records.
4.2. The Influence of the Number of Ground Motions on Fragility Function Parameters Estimation
In this section, the influence of the number of ground motions on the fragility function parameters estimation, and , for the two scenarios is studied. Each number of earthquake records also has randomly 1000 groups without repetition, in each group the members of records are the same as in Section 4.1. Then and for each group can be estimated according to the Equations (11) and (13). So there are 1000 groups estimated and for each number of ground motions and the related mean values can also be calculated. The two estimated fragility function parameters with different number of ground motions for the two scenarios are shown in Figure 9. Figure 9a,c show that the value of estimated decreases as the number of ground motions increases, and tends to be constant when the number of ground motions exceeds 15 for both scenarios, while the effect of the number of earthquake records on the estimated for normal operation condition seems to be more sensitive than that for the parked condition when the number of ground motions is less than 15. Figure 9b,d show that the value of estimated increases with the increase in the number of ground motions, and tends to be constant when the number of ground motions exceeds 12 for the parked condition, while the estimated tends to be constant when the number of ground motions exceeds only eight for the normal operation condition. By comparing the estimated parameters in different conditions between the two scenarios, it is found that when the number of ground motions exceeds 15, the estimated parameters of the fragility function are stable. It should be noted that the estimated stability parameters in different numbers of ground motions might have different confidence intervals. Therefore, a deeper investigation should be done to obtain the sufficient number of ground motions for accurate parameter estimation.
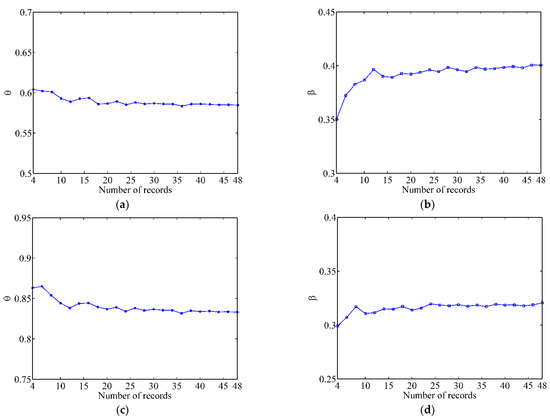
Figure 9.
The estimated and versus number of records: (a,b) for parked condition, and (c,d) for normal operation condition.
4.3. The Influence of the Number of Ground Motions on 95% Confidence Interval for Estimated Parameters
The influence of the number of ground motions on the 95% confidence interval for estimated parameters and is studied to obtain a sufficient number of ground motions for accurate fragility estimation. For each number of ground motions from 2 to 48, the 1000 random different groups of records same within Section 4.1 and Section 4.2 were selected and the confidence interval of the estimated parameters with the same 95% probability for each group was developed. The lower and upper value corresponding to a 95% confidence interval for the estimated values of and in each group can be calculated by utilizing Equations (14) and (15) [64] based on distribution and distribution.
where, and are the estimations for th group with ground motions.
Therefore, in a constant number of ground motions, each parameter has 1000 upper and lower 95% confidence interval values, and the relevant average value can be obtained. Figure 10 shows the relationship between the number of different ground motions and the average of the upper and lower 95% confidence intervals in two scenarios. It needs to be pointed out that the values in Figure 10a,c were the exponential of for the related lower and upper values. Figure 9 also shows that the difference between upper and lower of 95% confidence interval decreases and tends to remain constant as the number of ground motions increase. However, the current illustration in Figure 10 can’t give out a sufficient number of ground motions. The specific scopes of the 95% confidence interval with a different number of earthquake records for each parameter are presented and shown in Figure 11. We believed that the corresponding number of ground motions could accurately estimate the fragility of a 5 MW wind turbine subjected to coupled excitations of aerodynamic and seismic loads when the scope of the 95% confidence interval both for estimated and are less than 0.2. From Figure 11a,b, we can find that the sufficient number of ground motions in the parked condition are 26 and 36, respectively. And the sufficient number of ground motions in the normal operation condition are 32 and 26 in Figure 11c,d, respectively. Therefore, it can be concluded that the sufficient number of ground motions for accurate fragility estimation of a 5 MW wind turbine subjected to coupled excitations in the normal operation condition and the parked condition are 32 and 36, respectively.
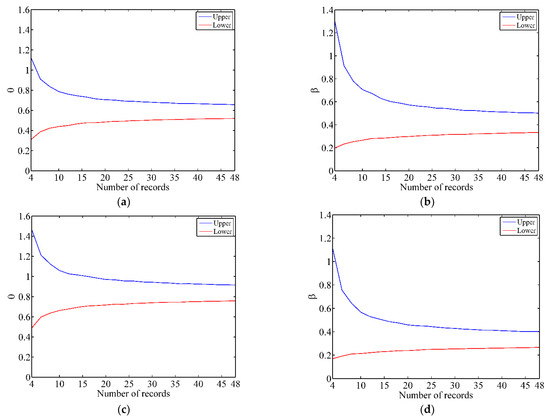
Figure 10.
The lower and upper 95% confidence interval for estimated and with different number of records: (a,b) for parked condition, and (c,d) for normal operation condition.
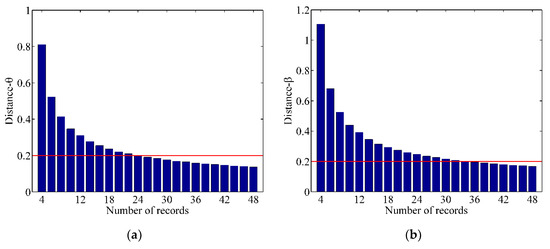
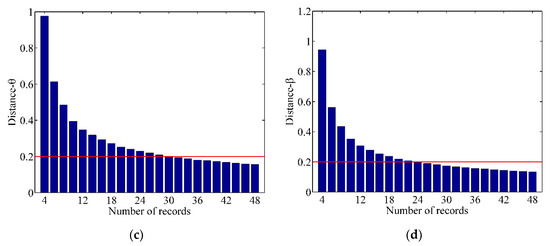
Figure 11.
The scope of lower and upper 95% confidence interval for estimated and with different number of records: (a,b) for parked condition, and (c,d) for normal operation condition.
4.4. The Influence of Different Wind Spectra on the Sufficient Number of Ground Motions
The energy distribution of turbulent wind is described by the wind spectrum. There are many wind spectra widely used by researchers, including the von Karman, Kaimal, Davenport spectra, and so on. The wind speed time histories generated by different wind spectra will be different. Hence, it is also necessary to investigate whether the sufficient number of earthquake records will be influenced by the wind spectra.
Four spectral models, Kaimal model [5], NREL National Wind Technology Center (NWTCUP) Model [62], Risø smooth-terrain (SMOOTH) model [65], and Von Karman model [5], were used to study the influence of the wind spectrum on the sufficient number of ground motions. Using the same approach as in Section 4.3, the average of the lower and upper 95% confidence interval with a different number of ground motions for the other three wind spectra (the Kaimal model was used in Section 4.3) and the comparisons between the four wind spectra for estimated and are shown in Figure 12. Figure 12a,b show that the related curves for the four wind spectra are completely consistent, which means that the wind spectrum has no influence on the sufficient number of earthquake records for a 5 MW wind turbine subjected to the coupled excitation of aerodynamic and seismic loads in the parked condition. Figure 12c,d show that the related curves for the four wind spectra are slightly different, which means that the wind spectrum has a slight effect on the sufficient number of earthquake records for a 5 MW wind turbine to coupled excitation of aerodynamic and seismic loads in the normal operation condition. The reason for this phenomenon is that the aerodynamic loads are very small in the parked condition and the coupling effect is obvious in the normal operation condition. The effect of the wind spectrum on the sufficient number of earthquake records was also presented by giving the specific number of earthquake records obtained in the same way with Section 4.3 in Table 2 where the decisive number for each spectrum are marked in bold.
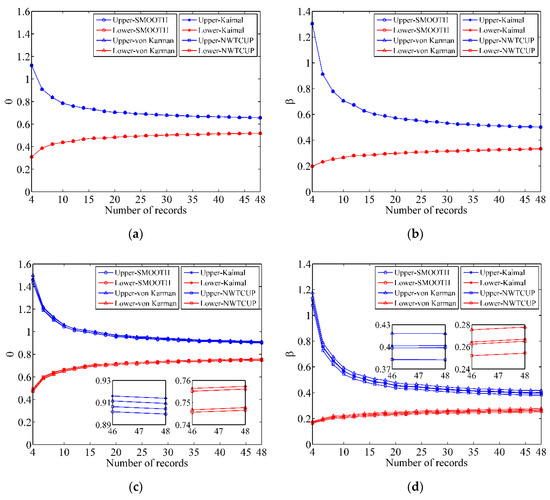
Figure 12.
The comparison of the lower and upper 95% confidence interval for estimated and between four wind spectra with a different number of records: (a,b) for the parked condition, and (c,d) for the normal operation condition.
Table 2.
Sufficient number with different wind spectrum for estimated and .
5. Conclusions
In this paper, the influence of the number of ground motions on seismic fragility analysis of 5 MW wind turbines subjected to coupled excitation of aerodynamic and seismic loads was investigated. The simulation code FAST was used to get the dynamic responses of the 5 MW wind turbine subjected to the coupled excitation. Two scenarios with the rated wind speed, in a parked and normal operation, were simulated with the number of actually recorded ground motions ranging from 2 to 48. The fragility function parameters were estimated by using the method of MSA.
By comparing and analyzing the fragility curves of the two scenarios, it was found that the coupled excitation has a great influence on the fragility of large-scale wind turbines. The influence of the number of ground motions on dynamic responses, fragility function estimated parameters, and the related 95% confidence interval were then studied. The analysis results indicate that the COV of the mean and STD of maximum FA nacelle displacements decrease and tend to be stable with the increase in the number of ground motions for the two scenarios. The estimated values of and tend to be constant when the number of ground motions exceeds a certain number for parked and normal operation conditions. The sufficient number of ground motions for accurately estimating fragility function parameters was determined by analyzing the 95% confidence interval, which indicated that there should be 32 and 36 records for the normal operation and the parked conditions, respectively. Furthermore, the sufficient number of earthquake records with different wind spectra for both scenarios was also investigated. The results showed that the wind spectrum does not influence the sufficient number of earthquake records in the parked condition and that the wind spectrum has a slight influence on the sufficient number of earthquake records for large-scale wind turbines in the normal operation condition. As the reliability evaluation of modern wind turbines subjected to environmental loads becomes more and more important, and the fragility analysis involves many aspects, future research efforts can be focused on a more precise assessment of reliability, such as by defining the rotation at the tower top or stress as potential EDPs, considering the vertical component of earthquakes, the influence of different IMs on fragility analysis, and fragility functions depending on IM and wind speed.
Author Contributions
Conceptualization, C.Y.; methodology, C.Y., W.B. and H.L.; software, C.Y.; validation, C.Y.; formal analysis, C.Y.; investigation, C.Y.; data curation, C.Y.; supervision, Y.X., J.L. and W.B.; writing original draft, C.Y.; writing-review and editing, Y.X. and J.L. All authors have read and agreed to the published version of the manuscript.
Funding
This research was funded by the Key Research and Development and Promotion Project in Henan Province (Grant No. 212102310269), National Natural Science Foundation of China (Grant No. 51679092), Scientific Research Project of North China University of Water Resources and Electric Power (Grant No. 201811007) and Key Science and Technology Project of China National Tobacco Corporation Henan Branch (2020410000270020).
Data Availability Statement
Data underlying the results presented in this paper are not publicly available at this time but may be obtained from the authors upon reasonable request.
Acknowledgments
We are grateful for the support and the help of Jason Jonkman for providing FAST code.
Conflicts of Interest
The authors declare that they have no conflict of interest.
Appendix A
Table A1.
Selected record characteristics.
Table A1.
Selected record characteristics.
| No. | Event | Year | Station | Magnitude | R 1 (km) | Vs30 2 (m/s) |
|---|---|---|---|---|---|---|
| 1 | San Fernando | 1971 | Wheeler Ridge-Ground | 6.6 | 70.23 | 347.67 |
| 2 | San Fernando | 1971 | Whittier Narrows Dam | 6.6 | 39.45 | 298.68 |
| 3 | Imperial Valley-06 | 1979 | Coachella Canal #4 | 6.5 | 50.10 | 336.49 |
| 4 | Irpinia_ Italy-02 | 1980 | Bovino | 6.2 | 43.50 | 356.39 |
| 5 | Coalinga-01 | 1983 | Parkfield-Cholame 12W | 6.4 | 55.77 | 359.03 |
| 6 | Coalinga-01 | 1983 | Parkfield-Cholame 1E | 6.4 | 43.68 | 326.64 |
| 7 | Coalinga-01 | 1983 | Parkfield-Cholame 4AW | 6.4 | 47.57 | 283.38 |
| 8 | Coalinga-01 | 1983 | Parkfield-Cholame 4W | 6.4 | 46.35 | 410.40 |
| 9 | Coalinga-01 | 1983 | Parkfield-Cholame 6W | 6.4 | 50.20 | 251.57 |
| 10 | Coalinga-01 | 1983 | Parkfield-Cholame 8W | 6.4 | 51.75 | 256.82 |
| 11 | Coalinga-01 | 1983 | Parkfield-Fault Zone 10 | 6.4 | 31.62 | 372.73 |
| 12 | Coalinga-01 | 1983 | Parkfield-Fault Zone 2 | 6.4 | 38.95 | 294.26 |
| 13 | Coalinga-01 | 1983 | Parkfield-Fault Zone 6 | 6.4 | 32.87 | 266.65 |
| 14 | Coalinga-01 | 1983 | Parkfield-Fault Zone 9 | 6.4 | 31.71 | 372.26 |
| 15 | Coalinga-01 | 1983 | Parkfield-Gold Hill 2E | 6.4 | 33.07 | 360.92 |
| 16 | Coalinga-01 | 1983 | Parkfield-Gold Hill 2W | 6.4 | 37.02 | 290.50 |
| 17 | Coalinga-01 | 1983 | Parkfield-Gold Hill 4W | 6.4 | 41.10 | 421.20 |
| 18 | Coalinga-01 | 1983 | Parkfield-Vineyard Cany 3W | 6.4 | 32.17 | 308.87 |
| 19 | Morgan Hill | 1984 | Capitola | 6.2 | 39.08 | 288.62 |
| 20 | Morgan Hill | 1984 | Fremont-Mission San Jose | 6.2 | 31.34 | 367.57 |
| 21 | Morgan Hill | 1984 | Los Banos | 6.2 | 63.16 | 262.05 |
| 22 | Taiwan SMART1(40) | 1986 | SMART1 O01 | 6.3 | 61.97 | 267.67 |
| 23 | N. Palm Springs | 1986 | Hemet Fire Station | 6.1 | 34.71 | 328.09 |
| 24 | N. Palm Springs | 1986 | Indio | 6.1 | 35.57 | 307.54 |
| 25 | N. Palm Springs | 1986 | Indio-Coachella Canal | 6.1 | 41.93 | 339.02 |
| 26 | N. Palm Springs | 1986 | Landers Fire Station | 6.1 | 35.36 | 331.02 |
| 27 | N. Palm Springs | 1986 | San Jacinto-Valley Cemetery | 6.1 | 30.97 | 330.74 |
| 28 | N. Palm Springs | 1986 | Winchester Page Bros R | 6.1 | 38.22 | 287.87 |
| 29 | Whittier Narrows-01 | 1987 | Arleta-Nordhoff Fire Sta | 6.0 | 36.97 | 297.71 |
| 30 | Whittier Narrows-01 | 1987 | Canoga Park-Topanga Can | 6.0 | 48.96 | 267.49 |
| 31 | Whittier Narrows-01 | 1987 | Canyon Country-W Lost Cany | 6.0 | 48.18 | 325.60 |
| 32 | Whittier Narrows-01 | 1987 | Featherly Park-Maint | 6.0 | 37.92 | 367.54 |
| 33 | Whittier Narrows-01 | 1987 | Fountain Valley-Euclid | 6.0 | 39.45 | 270.54 |
| 34 | Whittier Narrows-01 | 1987 | Huntington Beach-Lake St | 6.0 | 44.58 | 315.52 |
| 35 | Whittier Narrows-01 | 1987 | LB-Recreation Park | 6.0 | 33.68 | 282.00 |
| 36 | Whittier Narrows-01 | 1987 | Lancaster-Med Off FF | 6.0 | 67.62 | 339.14 |
| 37 | Whittier Narrows-01 | 1987 | Leona Valley #6 | 6.0 | 59.60 | 327.44 |
| 38 | Whittier Narrows-01 | 1987 | Malibu-Point Dume Sch | 6.0 | 63.23 | 349.54 |
| 39 | Whittier Narrows-01 | 1987 | Newhall-Fire Sta | 6.0 | 52.20 | 269.14 |
| 40 | Whittier Narrows-01 | 1987 | Newhall-W Pico Canyon Rd. | 6.0 | 58.61 | 285.93 |
| 41 | Whittier Narrows-01 | 1987 | Pacoima Kagel Canyon USC | 6.0 | 36.29 | 323.76 |
| 42 | Whittier Narrows-01 | 1987 | Panorama City-Roscoe | 6.0 | 36.55 | 318.16 |
| 43 | Whittier Narrows-01 | 1987 | Sun Valley-Roscoe Blvd | 6.0 | 34.99 | 320.93 |
| 44 | Whittier Narrows-01 | 1987 | Sylmar-Sayre St | 6.0 | 40.61 | 348.87 |
| 45 | Whittier Narrows-01 | 1987 | Terminal Island-S Seaside | 6.0 | 40.36 | 260.60 |
| 46 | Whittier Narrows-01 | 1987 | Torrance-W 226th St | 6.0 | 36.11 | 289.04 |
| 47 | Big Bear-01 | 1992 | Hesperia-4th & Palm | 6.5 | 44.65 | 358.36 |
| 48 | Big Bear-01 | 1992 | Indio-Riverside Co Fair Grnds | 6.5 | 78.21 | 282.14 |
| 49 | Big Bear-01 | 1992 | San Bernardino-2nd & Arrowhead | 6.5 | 33.79 | 325.83 |
| 50 | Big Bear-01 | 1992 | San Bernardino-E & Hospitality | 6.5 | 35.20 | 296.97 |
1 Closest site-to-fault-rupture distance. 2 Shear wave velocity.
References
- Lee, J.; Zhao, F. Global Wind Report 2021; Global Wind Energy Council (GWEC): Brussels, Belgium, 2021. [Google Scholar]
- Mo, R.; Cao, R.; Liu, M.; Li, M. Effect of ground motion directionality on seismic dynamic responses of monopile offshore wind turbines. Renew. Energy 2021, 175, 179–199. [Google Scholar] [CrossRef]
- Pozos-Estrada, A.; Chávez, M.M.; Jaimes, M.; Arnau, O.; Guerrero, H. Damages observed in locations of Oaxaca due to the Tehuantepec Mw8.2 earthquake, Mexico. Nat. Hazards 2019, 97, 623–641. [Google Scholar] [CrossRef]
- DNV. Design of Offshore Wind Turbine Structures; DNV-OS-J101; Det Norske Veritas (DNV): Oslo, Norway, 2014. [Google Scholar]
- IEC. IEC 61400-1 Ed, 3: Wind Turbines-Part 1: Design Requirements; International Electrotechnical Commission: Geneva, Switzerland, 2005. [Google Scholar]
- Yuan, C.; Chen, J.; Li, J.; Xu, Q. Fragility analysis of large-scale wind turbines under the combination of seismic and aerody-namic loads. Renew. Energy 2017, 113, 1122–1134. [Google Scholar] [CrossRef]
- Yuan, C.; Li, J.; Chen, J.; Xu, Q.; Xie, Y. Study on the Influence of Baseline Control System on the Fragility of Large-Scale Wind Turbine considering Seismic-Aerodynamic Combination. Adv. Civ. Eng. 2020, 2020, 1–15. [Google Scholar] [CrossRef]
- Zuo, H.; Bi, K.; Hao, H.; Xin, Y.; Li, J.; Li, C. Fragility analyses of offshore wind turbines subjected to aerodynamic and sea wave loadings. Renew. Energy 2020, 160, 1269–1282. [Google Scholar] [CrossRef]
- Sheng, C.; Hong, H. Reliability and fragility assessment of offshore floating wind turbine subjected to tropical cyclone hazard. Struct. Saf. 2021, 93, 102138. [Google Scholar] [CrossRef]
- Chen, X.-B.; Li, J.; Chen, J.-Y. Wind-induced response analysis of a wind turbine tower including the blade-tower coupling effect. J. Zhejiang Univ. A 2009, 10, 1573–1580. [Google Scholar] [CrossRef]
- Asareh, M.-A.; Schonberg, W.; Volz, J. Fragility analysis of a 5-MW NREL wind turbine considering aero-elastic and seismic interaction using finite element method. Finite Elements Anal. Des. 2016, 120, 57–67. [Google Scholar] [CrossRef]
- Tran, T.-T.; Kang, S.; Lee, J.-H.; Lee, D. Directional Bending Performance of 4-Leg Jacket Substructure Supporting a 3 MW Offshore Wind Turbine. Energies 2021, 14, 2725. [Google Scholar] [CrossRef]
- Sharmin, F.; Hussan, M.; Kim, D. Effect of structural nonlinearity on probabilistic risk assessment of offshore wind turbine including inelastic soil medium. Civ. Eng. Environ. Syst. 2017, 34, 221–237. [Google Scholar] [CrossRef]
- Sharmin, F.; Hussan, M.; Kim, D.; Cho, S.G. Influence of soil-structure interaction on seismic responses of offshore wind turbine considering earthquake incident angle. Earthq. Struct. 2017, 13, 39–50. [Google Scholar]
- Dimova, S.L.; Hirata, K. Simplified seismic fragility analysis of structures with two types of friction devices. Earthq. Eng. Struct. Dyn. 2000, 29, 1153–1175. [Google Scholar] [CrossRef]
- Hwang, H.; Liu, J.B.; Chiun, Y.H. Seismic Fragility Analysis of Highway Bridges. Available online: https://core.ac.uk/download/pdf/4818619.pdf (accessed on 21 October 2020).
- Choi, E.; DesRoches, R.; Nielson, B. Seismic fragility of typical bridges in moderate seismic zones. Eng. Struct. 2004, 26, 187–199. [Google Scholar] [CrossRef]
- Ellingwood, B.R.; Celik, O.C.; Kinali, K. Fragility assessment of building structural systems in Mid-America. Earthq. Eng. Struct. Dyn. 2007, 36, 1935–1952. [Google Scholar] [CrossRef]
- Zhang, J.; Huo, Y. Evaluating effectiveness and optimum design of isolation devices for highway bridges using the fragility function method. Eng. Struct. 2009, 31, 1648–1660. [Google Scholar] [CrossRef]
- Mitropoulou, C.C.; Papadrakakis, M. Developing fragility curves based on neural network IDA predictions. Eng. Struct. 2011, 33, 3409–3421. [Google Scholar] [CrossRef]
- Ramanathan, K.; Padgett, J.E.; DesRoches, R. Temporal evolution of seismic fragility curves for concrete box-girder bridges in California. Eng. Struct. 2015, 97, 29–46. [Google Scholar] [CrossRef]
- Cha, Y.J.; Bai, J.W. Seismic fragility estimates of a moment-resisting frame building controlled by MR dampers using perfor-mance-based design. Eng. Struct. 2016, 116, 192–202. [Google Scholar] [CrossRef]
- Nuta, E. Seismic Analysis of Steel Wind Turbine Towers in the Canadian Environment; University of Toronto: Toronto, ON, Canada, 2010. [Google Scholar]
- Kim, D.H.; Lee, S.G.; Lee, I.K. Seismic fragility analysis of 5 MW offshore wind turbine. Renew. Energy 2014, 65, 250–256. [Google Scholar] [CrossRef]
- Patil, A.; Jung, S.; Kwon, O.-S. Structural performance of a parked wind turbine tower subjected to strong ground motions. Eng. Struct. 2016, 120, 92–102. [Google Scholar] [CrossRef]
- Mo, R.; Kang, H.; Li, M.; Zhao, X. Seismic Fragility Analysis of Monopile Offshore Wind Turbines under Different Operational Conditions. Energies 2017, 10, 1037. [Google Scholar] [CrossRef]
- Hemmati, A.; Oterkus, E.; Barltrop, N. Fragility reduction of offshore wind turbines using tuned liquid column dampers. Soil Dyn. Earthq. Eng. 2019, 125, 105705. [Google Scholar] [CrossRef]
- Ali, A.; De Risi, R.; Sextos, A.; Goda, K.; Chang, Z. Seismic vulnerability of offshore wind turbines to pulse and non-pulse records. Earthq. Eng. Struct. Dyn. 2019, 49, 24–50. [Google Scholar] [CrossRef]
- Chaudhari, V.; Somala, S.N. Seismic performance of offshore wind turbine in the vicinity of seamount subduction zone. Structures 2021, 34, 423–432. [Google Scholar] [CrossRef]
- Del Campo, J.O.M.; Pozos-Estrada, A. Multi-hazard fragility analysis for a wind turbine support structure: An application to the Southwest of Mexico. Eng. Struct. 2020, 209, 109929. [Google Scholar] [CrossRef]
- Mardfekri, M.; Gardoni, P. Probabilistic demand models and fragility estimates for offshore wind turbine support structures. Eng. Struct. 2013, 52, 478–487. [Google Scholar] [CrossRef]
- Mo, R.; Cao, R.; Liu, M.; Li, M.; Huang, Y. Seismic fragility analysis of monopile offshore wind turbines considering ground motion directionality. Ocean Eng. 2021, 235, 109414. [Google Scholar] [CrossRef]
- Jonkman, J.M.; Butterfield, S.; Musial, W.; Scott, G. Definition of a 5-MW Reference Wind Turbine for Offshore System Devel-Opment; National Renewable Energy Lab (NREL): Golden, CO, USA, 2009. [Google Scholar]
- Jalayer, F. Direct Probabilistic Seismic Analysis: Implementing Non-Linear Dynamic Assessments; Stanford University: Stanford, CA, USA, 2003. [Google Scholar]
- Baker, J.W.; Allin, C.C. Spectral shape, epsilon and record selection. Earthq. Eng. Struct. Dyn. 2006, 35, 1077–1095. [Google Scholar] [CrossRef]
- Hancock, J.; Bommer, J.J.; Stafford, P.J. Numbers of scaled and matched accelerograms required for inelastic dynamic analyses. Earthq. Eng. Struct. Dyn. 2008, 37, 1585–1607. [Google Scholar] [CrossRef]
- Banerjee, A.K.; Pramanik, D.; Roy, R. Seismic structural fragilities: Proposals for improved methodology per spectral matching of accelerogram. Eng. Struct. 2016, 111, 538–551. [Google Scholar] [CrossRef]
- Shome, N. Probabilistic Seismic Demand Analysis of Nonlinear Structures; Stanford University: Stanford, CA, USA, 1999. [Google Scholar]
- Gehl, P.; Douglas, J.; Seyedi, D.M. Influence of the Number of Dynamic Analyses on the Accuracy of Structural Response Estimates. Earthq. Spectra 2015, 31, 97–113. [Google Scholar] [CrossRef]
- Cimellaro, G.P.; Reinhorn, A.M.; D’Ambrisi, A.; De Stefano, M. Fragility Analysis and Seismic Record Selection. J. Struct. Eng. 2011, 137, 379–390. [Google Scholar] [CrossRef]
- Jin, C.; Chi, S. Seismic fragility analysis of high earth-rockfill dams considering the number of ground motion records. Math. Probl. Eng. 2019, 2019, 1–12. [Google Scholar] [CrossRef]
- Jonkman, J.M.; Buhl, J.M.L. FAST User’s Guide; National Renewable Energy Laboratory: Golden, CO, USA, 2005; Volume 365, p. 366. [Google Scholar]
- Martin, O.L.H. Aerodynamics of Wind Turbines, 3rd ed.; Earthscan: London, UK, 2015. [Google Scholar]
- Chen, J.; Yuan, C.; Li, J.; Xu, Q. Semi-active fuzzy control of edgewise vibrations in wind turbine blades under extreme wind. J. Wind Eng. Ind. Aerodyn. 2015, 147, 251–261. [Google Scholar] [CrossRef]
- Burton, T.; Jenkins, N.; Sharpe, D.; Bossanyi, E. Wind Energy Handbook; John Wiley & Sons: Hoboken, NJ, USA, 2011. [Google Scholar]
- Munson, B.R.; Okiishi, T.H.; Huebsch, W.W.; Rothmayer, A.P. Fluid Mechanics; Wiley: Singapore, 2013. [Google Scholar]
- Jonkman, J.M.; Buhl, J.M.L. New Developments for the NWTC’s FAST Aeroelastic HAWT Simulator; National Renewable Energy Lab: Golden, CO, USA, 2003. [Google Scholar]
- Asareh, M.A.; Prowell, I. Seismic Loading for FAST. Contract 2012, 303, 275–300. [Google Scholar] [CrossRef][Green Version]
- Prowell, I.; Elgamal, A.; Romanowitz, H.; Duggan, J.E.; Jonkman, J. Earthquake Response Modeling for a Parked and Operating Megawatt-Scale Wind Turbine; National Renewable Energy Lab: Golden, CO, USA, 2010. [Google Scholar] [CrossRef]
- Prowell, I.; Elgamal, A.W.M.; Jonkman, J.M. FAST Simulation of Wind Turbine Seismic Response; National Renewable Energy Laboratory: Golden, CO, USA, 2010. [Google Scholar]
- Prowell, I.; Elgamal, A.; Uang, C.; Jonkman, J. Estimation of Seismic Load Demand for a Wind Turbine in the Time Domain: Preprint; National Renewable Energy Lab: Golden, CO, USA, 2010. [Google Scholar] [CrossRef]
- Asareh, M.A.; Prowell, I. A Simplified Approach for Implicitly Considering Aerodynamics in the Seismic Response of Utility Scale Wind Turbines. In Proceedings of the 53rd AIAA/ASME/ASCE/AHS/ASC Structures, Structural Dynamics and Materials Conference, Palm Springs, CA, USA, 23–26 April 2012. [Google Scholar] [CrossRef]
- Asareh, M.-A.; Prowell, I.; Volz, J.; Schonberg, W. A computational platform for considering the effects of aerodynamic and seismic load combination for utility scale horizontal axis wind turbines. Earthq. Eng. Eng. Vib. 2016, 15, 91–102. [Google Scholar] [CrossRef]
- Asareh, M.-A.; Schonberg, W.; Volz, J. Effects of seismic and aerodynamic load interaction on structural dynamic response of multi-megawatt utility scale horizontal axis wind turbines. Renew. Energy 2016, 86, 49–58. [Google Scholar] [CrossRef]
- National Renewable Energy Laboratory (NREL). FAST. Available online: https://www.nrel.gov/wind/nwtc/fast.html (accessed on 23 February 2016).
- Eads, L.; Miranda, E.; Krawinkler, H.; Lignos, D.G. An efficient method for estimating the collapse risk of structures in seismic regions. Earthq. Eng. Struct. Dyn. 2012, 42, 25–41. [Google Scholar] [CrossRef]
- Baker, J. Efficient Analytical Fragility Function Fitting Using Dynamic Structural Analysis. Earthq. Spectra 2015, 31, 579–599. [Google Scholar] [CrossRef]
- Qin, H.; Liu, M.; Wang, Y.; Zhao, J.; Zeng, X. China: An Emerging Offshore Wind Development Hotspot with A New Assessment of China’s Offshore Wind Potential; WWF, CWEA and Sun-Yet-Sen University: Beijing, China, 2010; p. 64. [Google Scholar]
- China, P.R. Code for Seismic Design Of Buildings; China Architecture & Building Press: Beijing, China, 2010. [Google Scholar]
- Elnashai, A.S.; Sarno, L.D. Fundamentals of Earthquake Engineering, Appendix A: Structural Configurations and Systems For Effective Earthquake Resistance; Wiley: New York, NY, USA, 2008. [Google Scholar]
- University of California, Berkeley. Pacific Earthquake Engineering Research Center. Available online: http://peer.berkeley.edu (accessed on 6 May 2016).
- Jonkman, B.J.; Kilcher, L. TurbSim User’s Guide: Version 1.06. 00; National Renewable Energy Laboratory: Golden, CO, USA, 2012. [Google Scholar]
- Valamanesh, V.; Myers, A.T. Aerodynamic Damping and Seismic Response of Horizontal Axis Wind Turbine Towers. J. Struct. Eng. 2014, 140, 04014090. [Google Scholar] [CrossRef]
- Spiegel, M.R.; Schiller, J.J.; Srinivasan, R.A.; Le, V.M. Probability and Statistics; Mcgraw-Hill: New York, NY, USA, 2009. [Google Scholar]
- Højstrup, J. Velocity Spectra in the Unstable Planetary Boundary Layer. J. Atmospheric Sci. 1982, 39, 2239–2248. [Google Scholar] [CrossRef]


Publisher’s Note: MDPI stays neutral with regard to jurisdictional claims in published maps and institutional affiliations. |
© 2022 by the authors. Licensee MDPI, Basel, Switzerland. This article is an open access article distributed under the terms and conditions of the Creative Commons Attribution (CC BY) license (https://creativecommons.org/licenses/by/4.0/).