Abstract
The COVID-19 pandemic exacerbated the use of medical protective equipment, including face masks, to protect the individual from the virus. This work studies the feasibility of using these materials as fuel for thermochemical processes for the production of syngas. A preliminary physic-chemical characterization was made by means of moisture and ash determination, thermogravimetric analysis, X-ray fluorescence. Afterward, pyrolysis and gasification tests were executed in a laboratory-scale fluidized bed reactor with chirurgical and FFP2 masks investigating four temperature levels and three different operating conditions (fluidizing agents and dry/wet sample). A qualitative and quantitative analysis of condensable aromatic hydrocarbons in the produced gas, collected during the test campaign, was performed employing a gas chromatograph-mass spectrometer. The experimental data from the tests were used to propose a hybrid approach to simulate the gasification process, based on experimental laws for the devolatilization step and a thermodynamic equilibrium approach for char gasification. The resulting data were compared with a thermodynamic equilibrium model, showing that the new approach captures non-equilibrium effects always present in real gasifiers operation.
1. Introduction
In modern society, the demands of higher consumption of goods, waste management, and energy supply are among the most significant challenges humans must deal with. Sustainable development has become part of EU legislation and policies: in 2015, the Commission launched the ambitious “Closing the Loop–An EU Action Plan for the Circular Economy”. According to the Agenda 2030 goals, the EU requires the transformation of waste management into sustainable material management. This one embeds the principles of the circular economy, enhances the diffusion of renewable energy and provides economic opportunities and moreover reduces the dependence of UE on imported resources [1].
In this framework, Waste-to-Energy (WtE) technologies play a significant role: thanks to WtE, waste sources produce energy in the form of power, heat, high-value chemicals, or transport fuels. Incineration (combustion) is the most established and widespread WtE technology: it is used to remedy a broad variety of trashes [2]. However, in the 1980s dissent emerged among the population due to its contribution to pollutant emissions, especially the toxic furans/dioxins. This shifted the interest towards advanced thermal conversion processes like gasification and pyrolysis, which are perceived to have the potential of being more efficient in the energy recovery from solid waste and in reducing pollutant emissions, especially the toxic ones.
Regarding the latter issue, the situation has worsened since 2020 because of the magnitude of the COVID-19 emergency. In this context, the demand for Personal Protect Equipment (PPEs), especially face masks, face shields, and gloves, increased between medical care workers and the general public; however, no clear instructions of their disposing mechanisms were provided [3]. It was estimated that about 129 billion face masks are being used globally every month (3 million/min) [4]. Every day, China manufactures around 240 tons of pharmaceutical trash. Similarly, cities like Manila, Bangkok, Kuala Lumpur and Hanoi manufacture about 154–280 tons/day of additional medical rubbish as the outbreak compared to the previous period. In another town, throughout the lockdown, medical waste generation increased from 550 to 600 kg/day to around 1000 kg/day [2,5].
The use of personal protective equipment and single-use plastics has increased the amount of contagious medical waste that needs additional careful handling. There is an immediate threat that the unsafe disposal of medical waste will add to the environmental pollution crisis [6]. As stated by the WHO’s health guidelines, used face masks and soiled tissues must be thrown only into lidded litter bins; on the other hand, any medical gear used by affected patients and hospital staff must be burnt in dedicated incinerators. Like common biomedical wastes, the COVID refuse is incinerated at a temperature above 1100 °C. However, as already mentioned, incineration is famous for being a dirty disposal method as it creates harmful dioxins and other emissions [7].
Despite different approaches to pyrolytic studies of polypropylene and polyethylene recovery into liquid products and condensable products [8,9] and catalytic degradation of waste plastic [10], gasification and high-temperature pyrolysis are mature processes that convert solid fuels (coal, waste materials, petroleum coke, or biomasses) to usable synthesis gas, or syngas (i.e., a mix of CO, H2, CH4, and CO2 in variable proportions) [11,12]. The gasification process is fundamentally different from combustion: instead of producing only heat and electricity, the syngas produced can be converted into higher-value commercial products such as chemicals, transportation fuels, fertilizers, and substitute natural gas [13]. The gasification process takes place in reactors that may utilize oxygen, steam, CO2, or a blend of these being gasification agents [2].
Due to the high complexity of the residual biomass/waste gasifier, mathematical models can be a useful tool to provide a better understanding of the thermochemical processes. Moreover, gasification models enable the study of the influences of several input variables (biomass moisture content, air/biomass ratio, etc.) on the key output variables (syngas composition, calorific value, etc.) [14,15]. Simulating accurately the performance of a biomass gasifier additionally allows optimizing the gasifier integration in complex energy systems [16,17].
In general, mathematical models of gasification are divided into thermodynamic-equilibrium and kinetic models. The former predicts the thermodynamic limits of the gasification reaction without accounting for the reactor design. This approach assumes that the residence time in the reactor is long enough to reach thermodynamic equilibrium, namely the state minimizing the Gibbs free energy. In non-stoichiometric equilibrium models, the biomass elemental composition, readily available from ultimate analysis, is the only input needed for the calculation [18,19,20,21,22]. Despite the simplicity of this approach, equilibrium is never reached under normal gasifier operations [23], and phenomena under a kinetic regime, such as tar formation and char residual, cannot be considered [24]. The advantage of this approach is the ease of integration into complex process models and optimization routines [25]. Kinetic models [26,27], on the other hand, take detailed information on the reaction rates, diffusivity phenomena, and reactor geometry into account. The rate of reactions is usually estimated by experimental data specific for a certain feedstock and reactor design, making the results not easily extrapolated to different conditions. Moreover, kinetic models require higher efforts in modeling as well as higher computational time.
Today, syngas produced by coal gasification stands at around 70% of the production, followed by a 15% of syngas production from natural gas and petroleum. On the other hand, syngas deriving from biomass or waste gasification constitutes only a few percentages of the worldwide syngas production [4,24]. However, four billion tons of waste are produced yearly worldwide [27].
In this scenario, the present work aims at evaluating the possibility of recovering these waste materials through thermochemical processes to convert them into useful and value-added fuel (syngas), overcoming one of the main bottlenecks of thermochemical processes that consist of the lack of information for the proper design of “unconventional” materials through process simulation tools. It is often necessary to resort to extensive and costly experimentation to obtain process data. Here is a quick approach to gather this information and translate it into a simulation model useful as a design tool. Furthermore, this approach allows investigating the ashes behavior in the bed, one of the major drawbacks that occur in real waste gasification processes.
The activities carried out to study the potential use of this kind of waste for gasification purposes are presented. The activities included:
- Physicochemical characterization of selected materials.
- Devolatilization tests of the characterized materials at semi-batch lab-scale apparatus that allows a fast determination of gas-phase composition in terms of permanent gas (H2, CO, CO2, CH4).
Implementation of a novel approach to simulate the gasification process, based on experimental results, developed using the commercial software Aspen Plus ®version 12.0 [28]. The novel approach is based on deriving experimental correlations using the devolatilization data obtained during the experimental campaign to simulate the devolatilization step. The objective of the work is to demonstrate a simplified methodology to obtain an improved thermodynamic model accounting for experimental data of devolatilization tests, and thus a useful tool to simulate fluidized bed gasifiers.
2. Materials and Methods
2.1. Materials for Devolatilization Tests
The materials selected and characterized in this work consist of chirurgical and FFP2 masks commonly used to help slow the diffusion of COVID-19. Typically, common facial masks are composed of three layers: the outer layer is a non-absorbent material (e.g., polyester), the middle layer is non-woven fabrics (e.g., polystyrene and polypropylene) and the inner layer is usually realized with an absorbent material, like cotton [29]. This composition varies according to the type of mask (FFP2 masks usually have four filter layers, while chirurgical masks only three). Overall, the major constitutes are PP (73.33 wt%) and PE (13.77 wt%), which are used to produce mask filters [30].
It is therefore essential to carry out a preliminary sterilization operation to avoid contagion. Exposure to high temperatures can kill Coronaviruses: to estimate the temperature that could kill SARS-CoV-2, a group of researchers investigated the effect of temperature on other coronaviruses [31]. One of these viruses was SARS-CoV, which causes SARS and is closely related to SARS-CoV-2. Based on the data, the researchers state that most coronaviruses would be almost completely killed after exposure to temperatures of 65 °C (149 °F) or higher for longer than 3 min.
In this work, the sterilization operation takes place simultaneously with the material characterization during the moisture determination due to the temperature reached in the oven.
To load the reactor with the samples, a preliminary pelletizing operation is necessary. This facilitates the reactor loading with the pellets and allows compacting a large quantity of materials in a small volume. For this purpose, masks are deprived of their nose metallic wire and are shredded with the help of a blender and then put into 13-mm pellet dies. The cylindrical dies are then placed in a Specac manual hydraulic press, producing pellets.
2.2. Materials Characterization
Physicochemical characterization of materials selected was conducted by means of appropriate instrumental techniques such as tests in the oven and muffle furnace, X-ray fluorescence (XRF), thermo-gravimetric analyzer (TGA), and CHNS elemental analyzer.
Moisture fractions of the coarsely ground disposable masks were quantified by measuring the samples’ mass variation through a drying treatment using an oven (model MPIM factory Oven SL, MPIM srl, Sambuceto, Italy), keeping the temperature at 105 °C overnight according to EN 15414-3:2011 [32] standard indications, as shown in Figure 1. Due to the temperature reached in the oven, the sterilization operation took place simultaneously with this first analysis.
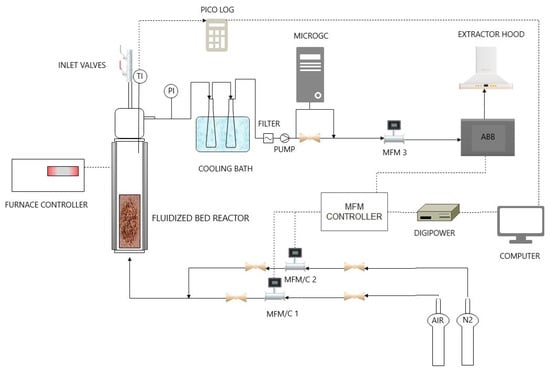
Figure 1.
Schematic view of the laboratory-scale experimental apparatus for devolatilization tests.
Ash content was determined using a LENTON type ECF 12/10 equipment, setting the thermal program defined in ISO 1171-2010 [33] standard: (i) 8 °C min−1 heating ramp- up from room temperature to 500 °C, followed by 1 h dwell at 500 °C; (ii) 8 °C min−1 heating ramp-up from 500 °C to 815 °C and 2 h dwell at 500 °C. To carry out the measurements, disposable masks were coarsely ground into porcelain crucibles.
Thermophysical properties of samples were determined through TGA; the device used for this purpose is a Linseis STA PT 1000; the operating conditions used are defined by the proximate and compositional analysis. Since small quantities of samples are required for TGA analysis, fragments of masks were placed in the crucibles with an average weight of 0.15 g of material. Three tests were performed for each kind of disposable mask.
Proximate analysis was adapted from the standard test method, ASTM E1131-20 (used for coal, lubricant, polymers, etc.) [34]. It led to the determination of medium volatile, highly volatile, combustible material and ash and contents setting the first treatment in nitrogen atmosphere (3 Nl h−1): (i) 10 °C min−1 heating ramp-up from room temperature to 150 °C; (ii) 10 °C min−1 heating ramp-up from 150 °C to 600 °C (iii) 10 °C min−1 heating ramp-up from 600 °C to 750 °C; followed by treatment in air flux (3 Nl h−1): (iv) 10 °C min−1 heating ramp-up from 750 °C to 800 °C, respectively.
The elemental analyzer CHNS (PerkinElmer 2400 Series-II) operated to perform the ultimate analysis of FPP2 and chirurgical masks, measuring their carbon (C), hydrogen (H), nitrogen (N), and sulfur (S) mass percentages on a dry basis. On average, 10 mg of fragmented masks was used and two repetitions were carried out for each type of mask. The instrument error is the order of 0.3%.
Ash from the above-mentioned muffle treatment at 815 °C was analyzed by XRF to determine FFP2 and chirurgical masks’ semi-quantitative elemental composition. The device used was a Spectro Xepos I instrument, with wavelength dispersion method, equipped with a detector. This one does not allow to detect elements with an atomic mass lower than that of magnesium (Mg); however, it can lead to the determination of the presence of mineral elements (e.g., Si, K, Ca, Al, Mg), which are responsible for the ash-melting behavior [35].
2.3. Devolatilization Tests: Experimental Plan and Layout
Devolatilization tests were carried out on dry and wet samples of chirurgical and FFP2 masks by means of semi-batch tests, in a quartz fluidized bed reactor, that investigated four temperature levels (from 500 °C to 800 °C, with 100 °C steps), using two fluidizing agents (N2, or air diluted by N2 to have 1.3–2.3 vol% of O2 at the bed inlet).
Tests in an inert environment simulated the devolatilization process, whereas those with diluted air have the same role regarding pyrolysis; by wetting the samples and blowing nitrogen and air in the reactor, a pseudo-steam gasification process was emulated.
The layout of the lab-scale plant is depicted in Figure 1. There was a quartz fluidized bed reactor, placed in a cylindrical electric furnace, fed upward by nitrogen or a mixture of nitrogen and air. Inlet gas flowrate is set manually or by PC, using the Bronkorst El-Flow control unit.
As the reaction took place, gaseous products left the reactor from the top and passed through two impinger bottles in a cooling bath to collect condensable gases: 25 mL of isopropyl alcohol (most ideal no-toxic solvent as ascribed by the Standard UNI CEN/TS 15439 [36]) was poured the first of two flasks in series, settled in an ice-water mixture bath. Isopropyl alcohol sampling was performed at the end of the three tests conducted for each operating condition.
The dry gas was sent to the ABB online analysis system that allowed to measure the volume concentration of CO, CO2, CH4, and H2; and a micro gas-chromatograph (μGC AGILENT 490, Agilent Technologies Italia S.p.A., Milan, Italy).
To load the reactor with the samples, a preliminary pelletizing operation facilitated the reactor loading and allowed compacting a large amount of material in a small volume. Masks were deprived of their nose metallic wire, shredded with the help of a blender and then put into 13 mm pellet dies.
The pellets were fed in the reactor individually by hand, thanks to a vertical system composed of two consecutive valves at the top of the reactor, to minimize the air entering the reactor while feeding the pellet.
For each set “material/fluidizing agent/bed temperature”, three pellets were devolatilized to obtain three repetitions of a specific test condition; the process is in an unsteady state as tests conducted on each sample were carried out until completion, before loading the following sample.
The collected samples of condensable gasses, composed of aromatic hydrocarbons (HCs), were analyzed in a gas chromatograph with a mass spectrometer (GC–MS), Agilent GC7890A with an MSD-Triple Axis Detector 5975C, for the identification and quantification of the compounds produced during the devolatilization tests.
2.4. Devolatilization Tests: Reaction Section
The reactor used was made of quartz, able to withstand temperatures up to 1000 °C. It was one meter high and had a 5-cm inner diameter. A packed bed made of silicon carbide (SiC) particles was placed in the windbox of the reactor to work as a preheater for the inlet gas flow. The sand was loaded into the reactor to have a bed height equal to 1.5 times its diameter.
To determine the minimum gas flow rate to achieve bed fluidization, the minimum fluidization velocity must be determined. The reactor bed consists of sand particles having the following characteristics, as summarized in Table 1.

Table 1.
Bed material physical properties of fluid-dynamic interest and minimum fluidization velocity (umf) as a function of temperature at devolatilization conditions are described in Section 2.3.
In the light of the sand bed characteristics reported in Table 1, the sand group according to the Geldart powder classification [37] was identified as group B; in this case, the minimum fluidization velocity (umf) and the bubbling fluidization velocity coincide. Values of umf (Table 1), used as references to set devolatilization experimental conditions in this work (see Section 2.3), were determined according to the simplified Ergun equation (Equation (1)) [38], assuming the correlation constants C1 = 27.2 and C2 = 0.0408, as suggested by Grace [38].
Equations (2) and (3) define the Reynolds number at minimum fluidization conditions (Remf) and the Archimedes number (Ar), both dimensionless: N2 density ( and dynamic viscosity ( were properly evaluated as a function of temperature, g is the gravity acceleration, is the particle density, experimentally determined.
2.5. Devolatilization Tests: Data Processing
From the ABB measurements, outlet molar flow rates (Fi,out, where i = CO2, H2, CH4, CO) as functions of time (t) were determined assuming that N2 inlet flow rate was the internal standard and that, during the tests with diluted air, O2 reacted completely.
The outlet gas component flow rate (Fi,out) (NL/min), individual pellets weight (wp), and masks composition allowed for the calculation of the integral-average values of:
- gas yield (ηav, Equation (4)) (mol/100 g sample);
- carbon conversion (χav,C, Equation (5)) (g/g);
- outlet H2/CO ratio (, Equation (6)) (mol/mol);
- percentage of i on dry and dilution free basis (Yav,i, Equation (7)) (mol/mol).
The quantities defined in Equations (4)–(7) average out of the three repetitions were calculated for each set “material kind/fluidizing agent/bed temperature”, provided with related standard deviations [39].
With i = H2, CO, CO2, CH4
With j = CO, CO2, CH4.
where:
wC,in = wp·
wp and are the weight of the pellet (g) and the weight percentage of carbon;
With i = H2, CO, CO2, CH4
2.6. Modeling Approach
The core simulation model was developed using Aspen Plus ®, which is a process simulation software often used to model chemical processes involving solid, liquid, and gaseous streams using mass and energy conservations equations and phase equilibrium databases [28]. The following assumptions were made: (i) steady-state and no kinetic reactions; (ii) autothermal system; (iii) the sulfur converts entirely to H2S; (iv) the nitrogen converts entirely to NH3 [20,40].
A simple schematic of the fluidized bed reactor is reported in Figure 2 (LHS). As stated in previous literature [41,42], in fluidized bed gasifiers, the devolatilization step occurs at the top of the reactor as soon as the feedstock enters the chamber. The remaining feedstock, namely the char, falls into the bed where the oxygen (air) is fed from the bottom and reacts with it. Given the sub-stoichiometric conditions, one can assume that most of the oxygen is consumed by the char transported by the bed. The modeling approach chosen to represent these physics is shown in Figure 2 (RHS).
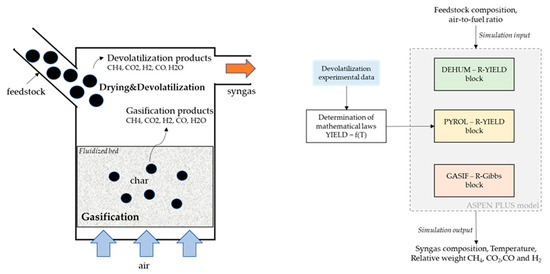
Figure 2.
Schematics of the gasifier reactions main steps, on the left hand-side (LHS); overview of model implementation, on the right hand-side (RHS).
The devolatilization step was modeled using mathematical laws derived using the data from the experimental campaign (pure N2), while the char gasification was modeled using a thermodynamic equilibrium reactor. The feedstock composition and the air-to-fuel ratio were used as input to the model. The syngas composition, temperature, and relative weights between the four components CH4, CO2, CO, and H2 were obtained as the output of the model.
The inlet stream of feedstock is first sent to a dehumidification block (R-YIELD) named “DEHUM”, where water (humidity) is separated from the feedstock. As the next step, the feedstock is sent to an R-YIELD block named “PYROL”. This block is used to model the fast pyrolysis step using the devolatilization data obtained during the experimental campaign. The remaining material is sent to two subsequent reactor blocks: an R-YIELD block named “PREC”, and an R-GIBBS block named “GASIF”. In the former, the elemental composition of the remaining feedstock (after the completion of the devolatilization step) is determined. In the latter, based on the elemental composition obtained in the previous reactor, the gasification step is modeled using a non-stoichiometric equilibrium approach, thus finding the gas composition minimizing the Gibbs free energy. The gasification temperature is calculated by the ASPEN model as an output.
As stated above, the R-GIBBS equilibrium reactor is modeled as an autothermal system: from the energy balances of all the heat streams released/consumed by the reactions, the equilibrium temperature is calculated. This approach represents the physics of fluidized bed reactors, where the partial combustion of the feedstock supplies the heat for the endothermic reactions occurring during gasification and making, therefore, the system autothermal. The resulting model is thus able to represent an autothermal reactor. As the last step, the gas obtained in the GASIF block is merged with the gas obtained from the devolatilization step and the water vapor from the dehumidification block. The resulting gas thus represents the syngas obtained from the gasification process.
As already mentioned, data from devolatilization tests at different temperatures were used to obtain the dependence of the production of the main gases from the temperature. Based on the analysis of the data, a polynomial equation of the form of (Equation (8)) was used to model the CH4 productivity, and an exponential equation of the form of (Equation (9)) was used to model the H2, CO, and CO2 productivity. In the equations, T is the gasification temperature, while represents the productivity of the generic gas X, expressed as moles of X for 100 g of sample. and represent the parameters for the exponential model (fitted based on the data), while , and are the parameters for the polynomial model.
The details of the derivations of the productivity laws are reported in Appendix A.
The results of the model were compared against the results of a simple thermodynamic-equilibrium model, based on the same assumptions, and developed in Aspen Plus ®. The thermodynamic model was based on an approach widely used in the literature [40] where pyrolysis and gasification are combined in a single step after decomposing the feedstock based on its elemental composition. The syngas composition is found as the one minimizing the Gibbs free energy. The comparison was carried out by fixing the feedstock composition and varying the equivalence ratio (ER) between air and fuel. The simulations were carried out with air with a lower oxygen content than normal air (10 %wt. O2, 90 %wt. N2), to keep the gasification temperature within the range 500–800 °C, which is the range of validity of the obtained devolatilization laws.
The comparison between the two models allowed estimating the difference between a pure thermodynamic model and the novel hybrid approach, where the kinetics effects related to the pyrolysis steps are considered. It must be stressed that both models are based on an R-GIBBS reactor to simulate the char gasification step. Therefore, in both cases, results represent a thermodynamic equilibrium limit and benchmark for the process; nevertheless, the results are significantly different, and the innovative algorithm of the model can better catch the real behavior in a fluidized bed fed with nonconventional feedstock.
3. Results and Discussion
3.1. Results of Physic-Chemical Characterization of FFP2 and Chirurgical Masks
Table 2, Table 3 and Table 4 report numerical results of proximate, compositional, and ultimate analyses performed through oven tests, muffle tests, TGA, and CHNS/O analyzer (see Section 2.2).
Table 2.
Moisture and ash determination of FFP2 and chirurgical masks as received (EN 15414-3:2011).
Table 3.
Proximate and compositional analyses of FFP2 and chirurgical masks as received (ASTM E1131-20: average value of three tests ± standard deviation) [34].
Table 4.
Ultimate analysis of FFP2 and chirurgical masks on a dry basis.
Results obtained from moisture and ash determination tests are shown in Table 2.
The moisture content of the masks is low; this turns out to be advantageous for pyrolysis processes, which are more efficient using a material with reduced moisture content: it’s commonly known that moisture increases energy consumption as it affects both the solid internal temperature history (due to endothermic evaporation) and the total energy required to bring the charge to the pyrolysis temperature [43].
Table 2 also shows low values of ash content. Its presence can determine possible problems in the plant, such as corrosion, deterioration of the heat exchange surfaces, obstruction, and equipment malfunction. In Table 3, the results of the proximate analysis are reported: it emerges a volatile matter (highly and medium volatile matter) content much relevant (>97%) against a very low fixed carbon (<1.4%). We cannot be confident of the ash determination via the technical standard E1131-20, because of a too high standard deviation compared to the corresponding average value.
Data obtained from CHNS elemental analyses conducted on the filter layers are summarized in Table 4. Oxygen content is the complement to 100 of the sum of the concentrations of other elements (C, H, N, S). From the literature analysis [30], it was deduced that chirurgical masks are mainly made with polypropylene and polyethylene, consisting of hydrocarbon chains. However, these are not the exclusive materials used for single-use disposable masks production [44] and the samples examined are not identical. This is the reason why that from CHNS analysis, further elements, including sulfur and oxygen, are contained in the filter layers. In particular, the estimated oxygen content in FFP2 masks (9.42%) is not negligible, but the presence of other possible oxidate compounds, such as cotton, nylon, etc. as reported in Medical Expo [29], and the experimental procedure allows justifying the abundant presence of oxidate species in the gas phase.
The following table (Table 5) summarizes the semi-quantitative elemental composition for FFP2 and chirurgical masks measured through XRF (see Section 2.2).
Table 5.
Semi-quantitative elemental composition for FFP2 and chirurgical masks ashes via XRF.
From Table 5 emerges that magnesium, silicon, calcium, phosphorous, sulphur, potassium, calcium, titanium, iron, copper, and antimony are the most abundant in both types of masks; in chirurgical masks, it is also possible to find traces of aluminum and barium. The other elements detectable by the instrument are not reported as their concentration was lower than 0.200 wt%.
3.2. Results of Devolatilization Tests
Figure 3, Figure 4 and Figure 5 show six examples of devolatilization tests at 700 °C, for each combination of material kind and fluidizing agent. As already noted by Di Giuliano et al. [45], for similar experiments on biomass pellets, gaseous products (H2, CO, CO2, and CH4) released by the unsteady state process determined the characteristic asymmetric shape of Fi,out (t) peak.
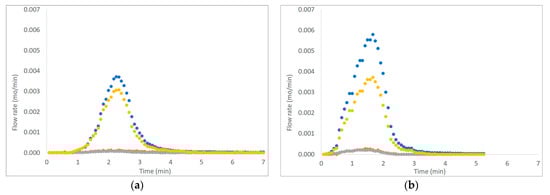
Figure 3.
Example of H2, CO, CO2, and CH4 outlet molar flow rates (Fi,out) as functions of time (t), produced by devolatilization tests of (a) chirurgical masks and (b) FFP2 mask, in a fluidized bed reactor at 700 °C, in a nitrogen atmosphere (● H2, ● CO, ● CO2; ● CH4).
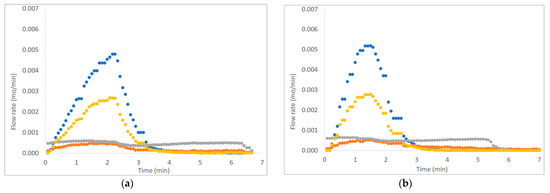
Figure 4.
Example of H2, CO, CO2, and CH4 outlet molar flow rates (Fi,out) as functions of time (t), produced by devolatilization tests of (a) chirurgical masks and (b) FFP2 mask, in a fluidized bed reactor at 700 °C, in nitrogen and air atmosphere. (● H2, ● CO, ● CO2; ● CH4).
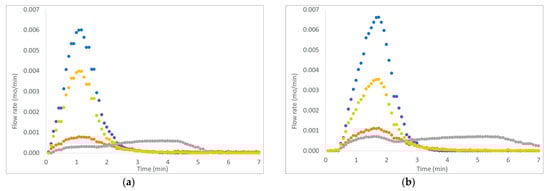
Figure 5.
Example of H2, CO, CO2, and CH4 outlet molar flow rates (Fi,out) as functions of time (t), produced by devolatilization tests of (a) wet chirurgical masks and (b) wet FFP2 mask, in a fluidized bed reactor at 700 °C, in nitrogen and air atmosphere. (● H2, ● CO, ● CO2; ● CH4).
Pyrolysis tests were carried out with two fluidizing agents: N2 or N2 plus air. To mime pseudo-steam gasification processes, pellets were immersed in distilled water before the devolatilization tests, flowing N2 and air in the reactor, in order to take into account the presence of steam in the gasifier.
The outgoing gas molar flow rates calculated are plotted as a function of time: by way of example, results presented regard one of the three pellets examined at 700 °C under each operating condition as reported from Figure 3 to Figure 5. During pyrolysis/devolatilization, line charts representing the molar flow rate as a function of time are in the form of bell-shaped curves because the described process is not continuous but a semi-batch configuration.
In particular, it can be seen that:
- In a nitrogen atmosphere, there is a small number of oxidized compounds compared to CH4 and H2. This is justified by the fact that, as discussed for the characterization test, disposable face masks contain mainly polypropylene and polyethylene consisting of long chains of hydrocarbons (HCs). On the other hand, the small amount of oxygen developed is mainly attributable to the presence of other unidentified components constituting the filter layers and the small amount (corresponding to the volume between the two feeding valves) of air that inevitably enters the reactor during sample loading.
- When air is added to the inlet gas mixture, there is a greater development of oxidized compounds (CO and CO2) that increase with the increasing of temperature. A slow development of a CO2 bell-shaped curve can be observed, in particular, at high temperatures when more gas is produced. The CO2 curve takes more time than the others to return to zero.
- For each operating condition, as the temperature increases, syngas composition changes: CH4 develops mainly at low temperatures, whereas H2 at high temperatures; this is due to the higher decomposition that takes place at a higher temperature.
The average values of the fundamental parameters in pyrolysis processes are reported using bar charts in which colored bars represent average values out of the three repetitions for each set “material kind/fluidizing agent/bed temperature”; errors bars refer to the related standard deviations. The gas yield ηav (Equation (4)) is reported in Figure 6a,b for chirurgical and FFP2 masks, respectively. H2/CO ratio values are reported in Figure 7a–c for dry masks, N2 and N2+air of a fluidizing agent, wet masks with N2+air flow. Carbon conversion χav,C (Equation (5)) is reported in Figure 8a,b while syngas composition Yavi,out (Equation (7)) is reported in Figure 9a–h. Numerical data are detailed in Appendix B of this work.
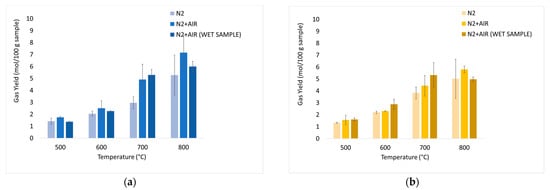
Figure 6.
Experimental results of devolatilization tests as a function of temperature: integral-average gas yield (η av, Equation (4)) of chirurgical (a) and FFP2 (b) masks.
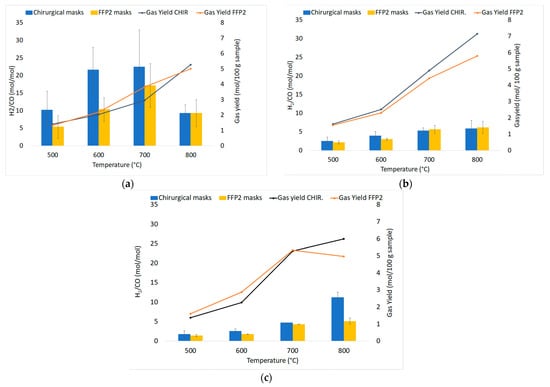
Figure 7.
Experimental results of devolatilization tests as a function of temperature: H2/CO ratio values in nitrogen (a), diluted air (b), and diluted air using wet pellets (c).
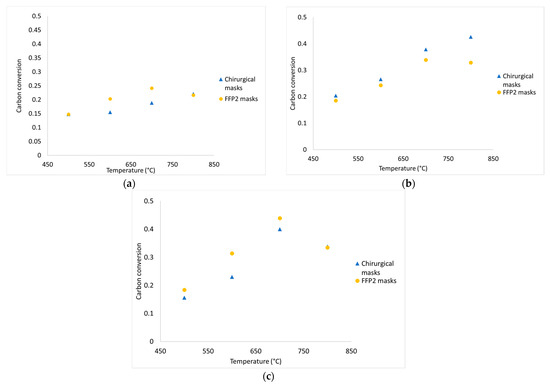
Figure 8.
Experimental data of carbon conversion obtained from devolatilization tests in nitrogen atmosphere (a), diluted air (b), and diluted air using wet pellets (c).
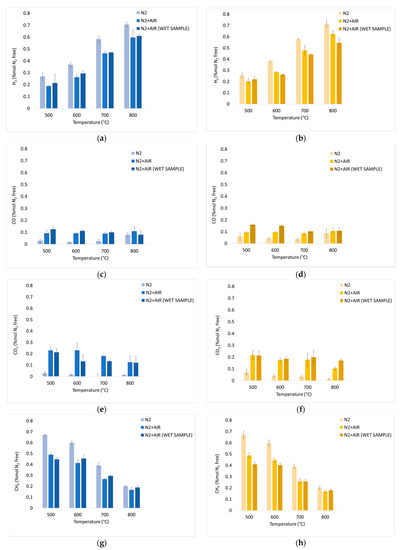
Figure 9.
Experimental results of devolatilization tests in a nitrogen atmosphere, in a fluidized sand bed, as functions of temperature: integral average H2 mol% dry, dilution-free Yav,i (Equation (7)) of chirurgical (a) and FFP2 (b) masks; CO mol% dry, dilution-free Yav,i (Equation (7)) of chirurgical (c) and FFP2 (d) masks; CO2 mol% dry, dilution-free Yav,i (Equation (7)) of chirurgical (e) and FFP2 (f) masks; CH4 mol% dry, dilution-free Yav,i (Equation (7)) of chirurgical (g) and FFP2 (h) masks. Figure 11 shows the aromatic hydrocarbon compounds detected and quantified in the liquid phase condensed downstream the devolatilization tests.
In Figure 6, it is possible to notice high productivity values: this is due to the high content of volatile compounds, as already highlighted by TGA. Bar charts show an increase in gas productivity as the temperature rises for each operating condition; there are no significant differences between the two types of masks. The addition of air leads to an increase in productivity: the highest values are recorded for dry masks at 800 °C and are equal to 7.16 mol/100 gsample for chirurgical masks, and 5.80 mol/100 gsample for FFP2 masks. At 700°C there is an increase in gas productivity of about 7.6% for wet chirurgical masks and 20.3% for wet FFP2 masks compared to dry masks.
Product distributions (H2/CO ratio and tar compounds) are influenced by the initial H/C ratio, temperature, gas feeding, residence time in the reactor. For this experimental campaign, Figure 7 reports that the H2/CO ratio increases as temperature rises in each operating condition, except in the nitrogen atmosphere. At 800 °C, an unexpected result was obtained due to the presence of air that entered during the test run and led to the increase of CO molar productivity. So, in the N2 atmosphere, the highest values are recorded at 700 °C (22.46 mol/mol for chirurgical masks, while FFP2 has a 23% lower value, which can be explained by the lower content of hydrogen in its elemental composition). The addition of air leads to an increase in the production of oxidized compounds, resulting in a reduction of H2/CO values, especially for chirurgical masks. It is possible to notice how at 700 °C there is a reduction of the previously mentioned values of 76% for chirurgical masks and 67% for FFP2 masks.
The H2/CO ratio defines the use of syngas: it can be used to produce hydrogen for values H2/CO ≥ 50, methanol for H2/CO ~2, ethanol for H2/CO ≤ 1 and Fischer–Tropsch synthesis (FTS) for H2/CO ≥ 2. The high values obtained for chirurgical and FPP2 masks may suggest their use in renewable fuels production.
From Figure 8a–c, it emerges that carbon conversion is always increasing for chirurgical and FFP2 masks from 500 °C to 700 °C. From the graphs, there is a greater carbon conversion when air is blown in; in particular, at 700 °C, there is an increase of 102% when air is added in the reactor and 123% when masks are wetted.
At 800 °C, the obtained conversion values are out of trend, this is justified by the inaccuracies that characterized the tests high temperatures: at high temperatures, the slow development of the CO2 bell-shaped curves caused an overlap of the curves between each test which led to an underestimation of the quantity of gas produced. Moreover, conversion percentage does not exceed 45%; this happens because:
- Some of the carbon is collected during the condensable capture process.
- During the testing campaign, the rapid condensation of gaseous products, which are exposed to room temperature both on the reactor head and in the piping before the condensation zone, results in a very viscous residue in pipes, like TAR, which causes blackening and obstruction.
The presence of water determines an increase in productivity at 800 °C for chirurgical masks that show the highest average value equal to 7.65 mol/mol.
Figure 9 illustrates the percentage of each component on a nitrogen-free basis; Figure 9a,b show a growing trend which is related to the greater quantity of hydrocarbons that are decomposed at higher temperatures. In a nitrogen atmosphere, there is a high hydrogen content in syngas composition: at 800 °C, both chirurgical and FFP2 masks record a value of 71% for YH2 in N2 atmosphere. This high hydrogen content is linked to the composition of the masks, which are mainly made of plastic material. Compared to inert atmosphere, values obtained at 800 °C are 15% and 14% lower for dry and wet chirurgical masks, while they are 13% and 23% lower for dry and wet FFP2 masks.
It is possible to say that for each temperature, the presence of oxygen in the incoming gas mixture leads to an increase in oxidized compounds in syngas. A demonstration of that is given by Figure 9c,d, which shows that air caused an increase in the CO produced. However, it is not possible to define a clear trend with regard to YCO. Complete oxidation reactions are not favored at high temperatures; as a consequence, there is a decrease in YCO2 at high temperatures. This trend is verifiable in Figure 9e,f, where the introduction of oxygen into the mixture increased the production of oxidized compounds.
In addition, Figure 9g,h YCH4 shows a decreasing trend as the temperature rises, and there are no differences between the two types of masks.
Based on the obtained results, it is possible to assert that the inert environment favors the production of hydrogen, allowing to obtain higher H2/CO. There are no substantial differences between the introductions of dry or wet masks; this is because the masks are made of water-repellent material that does not absorb a well-defined amount of water directly involved in reactions such as methane and TAR reforming or water gas shift that would determine a different composition of the downstream syngas.
To the data exposed so far are added those of the μ-GC Agilent 490 that allows the identification of the components present in the syngas stream after passing the cooling bath section (see Section 2.3), also including gases that are detected by the ABB analyzers system. The data obtained show the presence of n-butane (C4H10) as air is introduced in the gas mixture, both for dry and wet disposable masks.
After the pseudo-pyro-gasification tests were carried out, sand contained in the reactor was extracted and visually examined. Figure 10 shows ash residues and bits of unburned masks: the char residue. No relevant agglomeration phenomena of bed particles are detected.
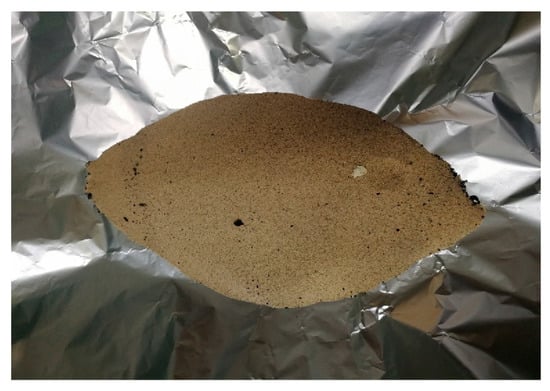
Figure 10.
Post-test sand.
3.3. Results from GC-MS
Figure 11 shows the results of the analysis on the liquid solvent samples containing the condensable gases generated during the devolatilization tests, i.e., aromatic hydrocarbons. The compounds identified and quantified are acenaphthylene, fluorene, phenanthrene, anthracene, pyrene, phenol, naphthalene, styrene xylene, toluene, and benzene.
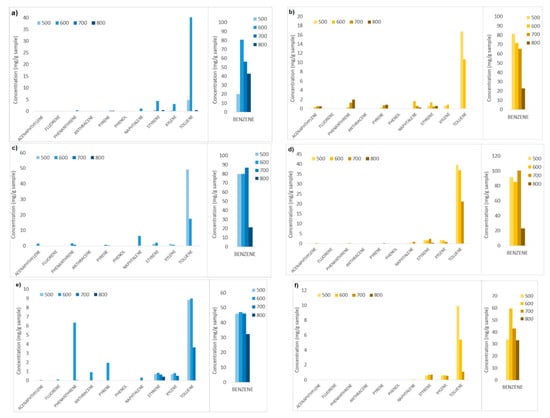
Figure 11.
Aromatic hydrocarbon compounds and relative contents obtained in devolatilization tests carried out at different temperatures (500, 600, 700, 800 °C) and fluidizing agents (N2, N2+air, N2+air-wet sample). (a,b) Tests with N2, chirurgical and FFP2 masks respectively; (c,d) tests with N2+air, chirurgical and FFP2 masks respectively; (e,f) tests of wet samples with N2+air, chirurgical and FFP2 masks, respectively.
Figure 11 shows clearly that for all the test conditions and feedstocks, benzene has the highest content compared to the other aromatic hydrocarbons (HCs) detected, ranging between 50 and 100 mg/gsample. Toluene is the second-most abundant hydrocarbon compound, up to 50 mg/gsample. Light hydrocarbons (one-ring compounds: styrene, xylene, toluene, and benzene) in general are more abundant in all the tests (30–130 mg/gsample), while heavy hydrocarbons are present in very low quantities, <10 mg/gsample.
Comparing the contents of the aromatic HCs produced for tests carried out at different operating conditions, it is possible to observe that in general, increasing the devolatilization temperature from 500 °C to 800 °C, the HCs contents decrease, for almost all the tests, the temperature of 800 °C corresponds to the lowest HCs content.
Furthermore, wet samples treated with N2+air (Figure 11e,f) gave in general considerably lower contents of HCs for almost all the temperatures and feedstocks, compared to dry samples treated with N2 and with N2+air. The moisture included in the wet samples turns into steam at the operating temperature and probably enhances steam reforming reactions that convert the HCs.
It is therefore observed that the lowest content of aromatic hydrocarbons in the set of devolatilization tests here reported are obtained for wet samples treated with N2+air, at the highest operating temperature, 800 °C. In particular, for these conditions, both FFP2 and chirurgical masks samples gave a total HC content of approximately 33 mg/gsample composed exclusively of light one-ring compounds.
In Figure 12a, a comparison between the total aromatic HCs is shown for different feedstocks, temperatures, and fluidizing agents.
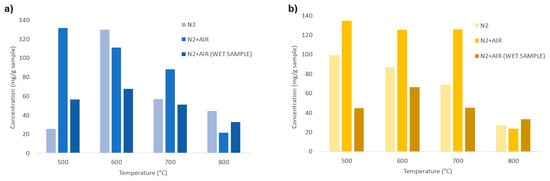
Figure 12.
Total aromatic hydrocarbons for different temperatures (500, 600, 700, 800 °C) and fluidizing agent (N2, N2+air, N2+air-wet sample); (a) chirurgical masks; (b) FFP2 masks.
Figure 12a shows the influence of temperature and fluidizing agents for the devolatilization of the chirurgical masks. It is shown that the higher quantities of HCs are produced at 500 and 600 °C, while for higher temperatures, their thermal decomposition is enhanced. From 600 °C to 700 °C, a reduction of tar is observed for all the fluidizing agents, which is further enhanced at 800 °C, for which the total HC content is the lowest. For the samples treated with N2 and wet samples treated with N2+air an increase of the HC content from 500 to 600 °C is observed; this phenomenon could be related to the formation of volatile compounds that occurs at temperatures not lower than 600 °C.
For the FFP2 masks instead (Figure 12b), the total HC contents are similar at 500, 600, and 700 °C, for an equal fluidizing agent. A strong reduction of the aromatic HCs is instead observed when the devolatilization temperature is 800 °C, in which the HC contents are reduced to <40 mg/gsample for all the samples.
In general, samples treated with N2+air give the higher content of HCs, while wet samples treated with N2+air give the lower content for equal operating temperatures and feedstock. The total HC content produced at 800 °C is approximately 20–40 mg/gsample, while for lower temperatures, the HC produced ranges between 40 and 140 mg/gsample.
3.4. Simulations Results
Figure 13 shows the results of the model comparison between the new hybrid approach and a thermodynamic-equilibrium approach. The figure reports the relative weight of the four main components of the syngas CO, CO2, H2, and CH4 for different values of ER.
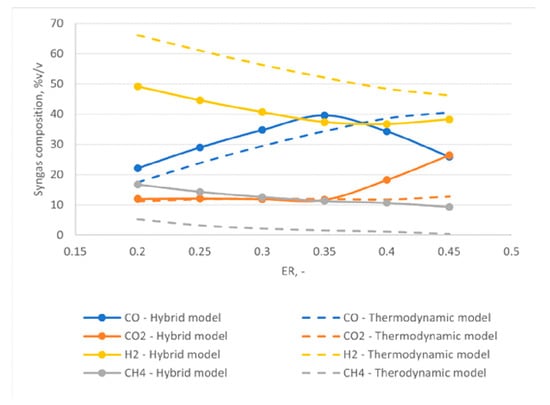
Figure 13.
Comparison between new hybrid approach and thermodynamic model results: relative weights of CO, CO2, CH4, and H2.
Figure 13 shows that the thermodynamic model estimates a higher molar fraction of hydrogen compared to the hybrid approach, while the opposite is true for methane. For the case of methane, the thermodynamic model predicts a very low content that decreases with increasing ER and leads to almost negligible content of the component, in agreement with the thermodynamic equilibrium conditions. However, this is not always true under real operation conditions.
Figure 13 additionally shows a good agreement between the two models for the trends of CO2 and CO at low ERs. With increasing ERs, however, a decrease of the molar fraction of CO and a sharp increase of CO2 are observed for the hybrid model. In particular, the CO content has a peak for an ER equal to 0.35. This trend can be explained by looking at the gasification temperature as a function of ER, reported in Figure 14. By increasing the value of ER, an increase of the gas produced in the devolatilization step is observed, as the temperature of the process increases. This implies a reduction of the feedstock content available for gasification. At the same time, higher oxygen is available for oxidation reactions, thus favoring the complete oxidation and thus the formation of carbon dioxide at the expense of CO production.
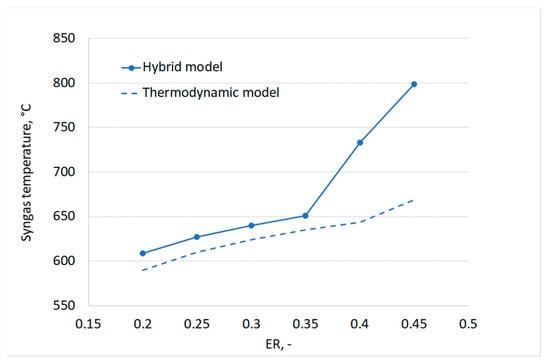
Figure 14.
Syngas temperature at the outlet of the gasifier as a function of ERWe further conducted a qualitative verification against the experimental findings from Xiao et al. [46], who published experimental results of gasification tests carried out in a fluidized bed reactor for polypropylene feedstock, the main component of chirurgical masks.
Lastly, Figure 13 highlights a general higher equilibrium temperature obtained using the hybrid approach compared to the thermodynamic equilibrium model, strictly connected to the higher concentration of CO2 at high ERs, resulting from more exothermic oxidation reactions obtained using the hybrid approach.
The work by Xiao et al. [46] reports, for example, a constant and non-negligible amount of CH4 in the syngas for different ER tests. By using empirical correlations for the devolatilization step, the hybrid approach allows introducing non-equilibrium effects and thus obtaining a similar non-negligible concentration of methane. The trend of methane justifies the decrease of hydrogen concentration because of the mass balance on hydrogen species.
The trend for CO2 is also in agreement with experimental results reported by Xiao et al. [46]. This trend, resulting from kinetic regime of the investigated phenomena, cannot be observed in the thermodynamic model results.
It must be noted that it was not possible to quantitatively validate the suggested hybrid approach against experimental data due to a lack of experimental data available for gasification of the same plastic material in the temperature range for which the devolatilization empirical correlations were derived. However, the results in Figure 14 clearly show how the thermodynamic equilibrium model fails to predict non-equilibrium phenomena, affecting real gasifier operation. By including empirical laws for the devolatilization step, the hybrid approach allowed considering a few of these effects.
Future work can be devoted to the extension of the devolatilization experiments to a higher temperature, thus obtaining a larger range for simulating the process, a complete extension of the validation process against experimental data for continuous gasification processes.
4. Conclusions
This work had as its purpose the valorization of waste products, i.e., disposable masks, through their use as an alternative to fossil fuels. To do that, an experimental study was carried out through a physic-chemical characterization of the material. The parameters investigated during this last phase were: type of mask used, different temperature levels (500, 600, 700, and 800 °C), and gasifying agents (nitrogen and a mixture of air and nitrogen). Gas productivity increases with increasing temperature, especially in the presence of air. As the temperature increases, syngas composition changes: CH4 develops mainly at 500 °C (68% in N2 environment and about 45% in N2 and air environment), while H2 at 800 °C (71% in N2 atmosphere at and about 60% in N2 and air); this is due to the higher decomposition that takes place at higher temperatures.
In a nitrogen atmosphere, there is a reduced amount of oxidized compounds compared to CH4 and H2, resulting in a high H2/CO ratio (22.46 mol/mol for chirurgical masks). On the other hand, when air is added to the inlet gas mixture, oxidized compounds (CO and CO2) are developed. For carbon conversion, the highest values are obtained at 700 °C and 800 °C, however, these do not exceed 50%, and this is attributable to the rapid condensation of vaporous products, which are exposed to room temperature both on the reactor head and in the piping before condensation zone, results in a very viscous residue in pipes, similar to tar, which causes blackening and obstruction; Aromatic HCs generated in the devolatilization tests were analyzed and quantified by GC-MS; the results show that benzene and toluene are the most abundant compounds generated (50 to 100 mg/gsample), while heavy HCs are present in very low quantities (<10 mg/gsample). In particular, tests carried out at higher temperatures (800 °C) and with wet samples presented the lowest contents of aromatic HCs produced. In particular, for these conditions, both FFP2 and chirurgical mask samples gave a total HC content of approximately 33 mg/gsample composed exclusively of light 1-ring compounds.
The simulation study aimed at demonstrating the utilization of experimental data to model the devolatilization step of the gasification process. A hybrid model was developed and compared with the simple thermodynamic approach. The results showed that the hybrid model was able to predict a few non-equilibrium effects as a higher methane content at the expense of hydrogen content and a peak of CO production for an equivalence ratio equal to 0.35. The results shown in this work illustrated how the hybrid approach was able to qualitatively predict non-equilibrium phenomena while thermodynamic models failed to capture these effects.
Author Contributions
Conceptualization, K.G.; methodology, K.G., M.S. and R.M.; software, M.S. and R.M.; validation, M.S., R.M. and R.F.; formal analysis, R.F.; investigation, K.G., R.F. and E.S, resources, K.G.; data curation, M.S, R.M, R.F. and E.S.; writing—original draft preparation, R.F., M.S., R.M. and E.S.; writing—review and editing, R.F., M.S., R.M., E.S. and K.G.; visualization, R.F. and E.S.; supervision, K.G.; project administration, K.G.; funding acquisition, K.G. and M.S. All authors have read and agreed to the published version of the manuscript.
Funding
This research received no external funding.
Data Availability Statement
The data presented in this study are available on request from the corresponding author.
Acknowledgments
The authors warmly thank Fabiola Ferrante for FT-IR, XRF and CHNS/O analyses.
Conflicts of Interest
The authors declare no conflict of interest.
Appendix A
Table A1.
Average values of pyrolysis parameters in N2 atmosphere for dry samples.
Table A1.
Average values of pyrolysis parameters in N2 atmosphere for dry samples.
| Temperature | Sample | ηav (mol/100 gsample) | H2/CO | YavH2 (%mol N2 free) | YavCO (%mol N2 free) | YavCO2 (%mol N2 free) | YavCH4 (%mol N2 free) | χav |
|---|---|---|---|---|---|---|---|---|
| 500 °C | Chirurgical | 1.41 | 10.20 | 27% | 3% | 3% | 67% | 15% |
| FFP2 | 1.33 | 5.39 | 26% | 6% | 7% | 61% | 15% | |
| 600 °C | Chirurgical | 2.02 | 21.67 | 37% | 2% | 2% | 60% | 15% |
| FFP2 | 2.20 | 10.34 | 38% | 4% | 4% | 54% | 20% | |
| 700 °C | Chirurgical | 2.96 | 22.46 | 58% | 3% | 0% | 39% | 19% |
| FFP2 | 3.83 | 17.15 | 58% | 4% | 3% | 35% | 24% | |
| 800 °C | Chirurgical | 5.27 | 9.27 | 71% | 8% | 1% | 20% | 22% |
| FFP2 | 5.02 | 9.28 | 71% | 9% | 1% | 18% | 22% |
Table A2.
Average values of pyrolysis parameters in N2 and air atmosphere for dry samples.
Table A2.
Average values of pyrolysis parameters in N2 and air atmosphere for dry samples.
| Temperature | Sample | ηav (mol/100 gsample) | H2/CO | YavH2 (%mol N2 free) | YavCO (%mol N2 free) | YavCO2 (%mol N2 free) | YavCH4 (%mol N2 free) | χav |
|---|---|---|---|---|---|---|---|---|
| 500 °C | Chirurgical | 1.74 | 2.10 | 19% | 9% | 23% | 49% | 20% |
| FFP2 | 1.56 | 2.18 | 20% | 9% | 22% | 49% | 19% | |
| 600 °C | Chirurgical | 2.51 | 2.88 | 26% | 9% | 23% | 41% | 27% |
| FFP2 | 2.31 | 3.03 | 29% | 9% | 18% | 44% | 24% | |
| 700 °C | Chirurgical | 4.90 | 5.28 | 46% | 9% | 18% | 27% | 38% |
| FFP2 | 4.43 | 5.68 | 48% | 9% | 18% | 26% | 34% | |
| 800 °C | Chirurgical | 7.16 | 5.91 | 60% | 11% | 13% | 17% | 43% |
| FFP2 | 5.80 | 6.20 | 62% | 10% | 10% | 17% | 33% |
Table A3.
Average values of pyrolysis parameters in N2 and air atmosphere for wetted samples.
Table A3.
Average values of pyrolysis parameters in N2 and air atmosphere for wetted samples.
| Temperature | Sample | ηav (mol/100 gsample) | H2/CO | YavH2 (%mol N2 free) | YavCO (%mol N2 free) | YavCO2 (%mol N2 free) | YavCH4 (%mol N2 free) | χav |
|---|---|---|---|---|---|---|---|---|
| 500 °C | Chirurgical | 1.37 | 1.77 | 21% | 13% | 21% | 45% | 16% |
| FFP2 | 1.60 | 1.41 | 22% | 16% | 21% | 41% | 18% | |
| 600 °C | Chirurgical | 2.27 | 2.56 | 29% | 12% | 13% | 46% | 23% |
| FFP2 | 2.88 | 1.76 | 26% | 15% | 19% | 40% | 32% | |
| 700 °C | Chirurgical | 5.28 | 4.73 | 47% | 10% | 13% | 30% | 42% |
| FFP2 | 5.33 | 4.35 | 44% | 10% | 20% | 26% | 44% | |
| 800 °C | Chirurgical | 5.99 | 7.65 | 61% | 8% | 12% | 19% | 34% |
| FFP2 | 4.97 | 5.15 | 55% | 11% | 17% | 18% | 34% |
Appendix B
Figure A1 reports the exponential and polynomial laws that were obtained based on the experimental data from the devolatilization tests. These expressions were used as input in the Aspen Plus ® model to simulate the devolatilization step in a R-YIELD block.

Figure A1.
Polynomial equation (a) used to model the CH4 productivity, and exponential equations (b–d) used to model the H2, CO, and CO2 productivity.
Figure A1.
Polynomial equation (a) used to model the CH4 productivity, and exponential equations (b–d) used to model the H2, CO, and CO2 productivity.

References
- Malinauskaite, J.; Jouhara, H. The trilemma of waste-to-energy: A multi-purpose solution. Energy Policy 2019, 129, 636–645. [Google Scholar] [CrossRef]
- Siwal, S.S.; Chaudhary, G.; Saini, A.K.; Kaur, H.; Saini, V.; Mokhta, S.K.; Chand, R.; Chandel, U.K.; Christie, G.; Thakur, V.K. Key ingredients and recycling strategy of personal protective equipment (PPE): Towards sustainable solution for the COVID-19 like pandemics. J. Environ. Chem. Eng. 2021, 9, 106284. [Google Scholar] [CrossRef] [PubMed]
- Centi, G.; Perathoner, S. Chemistry and energy beyond fossil fuels. A perspective view on the role of syngas from waste sources. Catal. Today 2020, 342, 4–12. [Google Scholar] [CrossRef]
- Sebastiani, A.; Macrì, D.; Gallucci, K.; Materazzi, M. Steam-oxygen gasification of refuse derived fuel in fluidized beds: Modelling and pilot plant testing. Fuel Process. Technol. 2021, 216, 106783. [Google Scholar] [CrossRef]
- Siwal, S.S.; Zhang, Q.; Devi, N.; Saini, A.K.; Saini, V.; Pareek, B.; Gaidukovs, S.; Thakur, V.K. Recovery processes of sustainable energy using different biomass and wastes. Renew. Sustain. Energy Rev. 2021, 150, 111483. [Google Scholar] [CrossRef]
- Green Energy: From Waste to Syngas Production—Instrumentation Monthly. Available online: https://www.instrumentation.co.uk/green-energy-from-waste-to-syngas-production/ (accessed on 28 June 2021).
- De-la-Torre, G.E.; Aragaw, T.A. What we need to know about PPE associated with the COVID-19 pandemic in the marine environment. Mar. Pollut. Bull. 2021, 163, 111879. [Google Scholar] [CrossRef]
- Parku, G.K.; Collard, F.; Görgens, J.F. Pyrolysis of waste polypropylene plastics for energy recovery: In fl uence of heating rate and vacuum conditions on composition of fuel product. Fuel Process. Technol. 2020, 209, 106522. [Google Scholar] [CrossRef]
- Ahmad, I.; Khan, M.I.; Khan, H.; Ishaq, M.; Tariq, R.; Gul, K.; Ahmad, W. Pyrolysis study of polypropylene and polyethylene into premium oil products. Int. J. Green Energy 2015, 12, 663–671. [Google Scholar] [CrossRef]
- Hou, Q.; Zhen, M.; Qian, H.; Nie, Y.; Bai, X.; Xia, T.; Laiq Ur Rehman, M.; Li, Q.; Ju, M. Upcycling and catalytic degradation of plastic wastes. Cell Rep. Phys. Sci. 2021, 2, 100514. [Google Scholar] [CrossRef]
- Hou, Q.; Qi, X.; Zhen, M.; Qian, H.; Nie, Y.; Bai, C.; Zhang, S.; Bai, X.; Ju, M. Biorefinery roadmap based on catalytic production and upgrading 5-hydroxymethylfurfural. Green Chem. 2021, 23, 119–231. [Google Scholar] [CrossRef]
- Huang, F.; Li, W.; Hou, Q.; Ju, M. Enhanced CH4 production from corn-stalk pyrolysis using Ni-5CeO2/MCM-41 as a catalyst. Energies 2019, 12, 774. [Google Scholar] [CrossRef]
- GSTC. Waste to Energy Gasification; GSTC. Available online: https://globalsyngas.org/syngas-technology/syngas-production/waste-to-energy-gasification/ (accessed on 6 April 2021).
- Puig-Arnavat, M.; Bruno, J.C.; Coronas, A. Review and analysis of biomass gasification models. Renew. Sustain. Energy Rev. 2010, 14, 2841–2851. [Google Scholar] [CrossRef]
- González-Vázquez, M.P.; Rubiera, F.; Pevida, C.; Pio, D.T.; Tarelho, L.A.C. Thermodynamic analysis of biomass gasification using aspen plus: Comparison of stoichiometric and non-stoichiometric models. Energies 2021, 14, 189. [Google Scholar] [CrossRef]
- Galvagno, A.; Prestipino, M.; Chiodo, V.; Maisano, S.; Brusca, S.; Lanzafame, R. Biomass blend effect on energy production in a co-gasification-CHP system. AIP Conf. Proc. 2019, 2191, 020082. [Google Scholar] [CrossRef]
- Tauqir, W.; Zubair, M.; Nazir, H. Parametric analysis of a steady state equilibrium-based biomass gasification model for syngas and biochar production and heat generation. Energy Convers. Manag. 2019, 199, 111954. [Google Scholar] [CrossRef]
- Kaushal, P.; Tyagi, R. Advanced simulation of biomass gasification in a fluidized bed reactor using ASPEN PLUS. Renew. Energy 2017, 101, 629–636. [Google Scholar] [CrossRef]
- George, J.; Arun, P.; Muraleedharan, C. Stoichiometric Equilibrium Model Based Assessment of Hydrogen Generation through Biomass Gasification. Procedia Technol. 2016, 25, 982–989. [Google Scholar] [CrossRef]
- De Kam, M.J.; Morey, R.V.; TIffany, D.G. Integrating biomass to produce heat and power at ethanol plants. Appl. Eng. Agric. 2009, 25, 227–244. [Google Scholar] [CrossRef][Green Version]
- Haydary, J. Aspen simulation of two-stage pyrolysis/gasification of carbon based solid waste. Chem. Eng. Trans. 2018, 70, 1033–1038. [Google Scholar] [CrossRef]
- Khuriati, A.; Purwanto, P.; Setiyo Huboyo, H.; Suryono, S.; Bawono Putro, A. Application of aspen plus for municipal solid waste plasma gasification simulation: Case study of Jatibarang Landfill in Semarang Indonesia. J. Phys. Conf. Ser. 2018, 1025, 012006. [Google Scholar] [CrossRef]
- Mutlu, Ö.Ç.; Zeng, T. Challenges and Opportunities of Modeling Biomass Gasification in Aspen Plus: A Review. Chem. Eng. Technol. 2020, 43, 1674–1689. [Google Scholar] [CrossRef]
- Gagliano, A.; Nocera, F.; Bruno, M.; Cardillo, G. Development of an Equilibrium-based Model of Gasification of Biomass by Aspen Plus. Energy Procedia 2017, 111, 1010–1019. [Google Scholar] [CrossRef]
- Salman, C.A.; Omer, C.B. Process modelling and simulation of waste gasification-based flexible polygeneration facilities for power, heat and biofuels production. Energies 2020, 13, 4264. [Google Scholar] [CrossRef]
- Beheshti, S.M.; Ghassemi, H.; Shahsavan-Markadeh, R. Process simulation of biomass gasification in a bubbling fluidized bed reactor. Energy Convers. Manag. 2015, 94, 345–352. [Google Scholar] [CrossRef]
- Pauls, J.H.; Mahinpey, N.; Mostafavi, E. Simulation of air-steam gasification of woody biomass in a bubbling fluidized bed using Aspen Plus: A comprehensive model including pyrolysis, hydrodynamics and tar production. Biomass Bioenergy 2016, 95, 157–166. [Google Scholar] [CrossRef]
- Aspen Plus v 12.0. Available online: https://www.aspentech.com/en/-/media/aspentech/home/support-and-training/deployment-solutions/aspenone-v12-getting-started-guide.pdf?la=en (accessed on 8 February 2021).
- Ffp2—All Medical Device Manufacturers. Available online: https://www.medicalexpo.com (accessed on 18 February 2022).
- Jung, S.; Lee, S.; Dou, X.; Kwon, E.E. Valorization of disposable COVID-19 mask through the thermo-chemical process. Chem. Eng. J. 2021, 405, 126658. [Google Scholar] [CrossRef] [PubMed]
- Abraham, J.P.; Plourde, B.D.; Cheng, L. Using heat to kill SARS-CoV-2. Rev. Med. Virol. 2020, 30, 8–10. [Google Scholar] [CrossRef]
- Solid Recovered Fuels. Determination of Moisture Content Using The Oven Dry Method. Moisture in General Analysis Sample. 2011. Available online: https://www.iso.org/standard/71327.html (accessed on 18 February 2021).
- The British Standards Institution Methods for Analysis and Testing of Coal and Coke (Multi-Part Document BS 1016) 2022. Available online: https://landingpage.bsigroup.com/LandingPage/Series?UPI=BS%201016 (accessed on 18 February 2022).
- ASTM International Standard Test Method for Compositional Analysis by Thermogravimetry 2003. Available online: https://standards.globalspec.com/std/14182172/ASTM%20E1131-20 (accessed on 18 February 2021).
- Gutierrez, A.C.G. Characterization of the Fuel Fraction of Solid Urban Solid Wastes of the Municipality of Santo André Aiming.
- UNI CEN/TS 15439:2008 Biomass Gasification. Tar and Particles in Product Gases. Sampling and Analysis 2008. Available online: https://www.uni.com/ (accessed on 8 February 2021).
- Gibilaro, L.G. Fluidization Dynamics. Butterworth Heinemann: Oxford, UK, 2011; ISBN 0750650036. [Google Scholar]
- Yang, W. Handbook of Fluidization and Fluid-Particle Systems; CRC Press: Boca Raton, FL, USA, 2003. [Google Scholar]
- Malsegna, B.; Di Giuliano, A.; Gallucci, K. Experimental study of absorbent hygiene product devolatilization in a bubbling fluidized bed. Energies 2021, 14, 2399. [Google Scholar] [CrossRef]
- Ramzan, N.; Ashraf, A.; Naveed, S.; Malik, A. Simulation of hybrid biomass gasification using Aspen plus: A comparative performance analysis for food, municipal solid and poultry waste. Biomass Bioenergy 2011, 35, 3962–3969. [Google Scholar] [CrossRef]
- Basu, P. Biomass Gasification, Pyrolysis and Torrefaction: Practical Design and Theory; Academic Press: Cambridge, MA, USA, 2013; ISBN 9780123964885. [Google Scholar]
- Basu, P. Combustion and Gasification in Fluidized Beds; CRC Press: Boca Raton, FL, USA, 2006; ISBN 9780849333965. [Google Scholar]
- Zaror, C.A.; Pyle, D.L. The pyrolysis of biomass: A general review. Proc. Indian Acad. Sci. Sect. C Eng. Sci. 1982, 5, 269–285. [Google Scholar] [CrossRef]
- Aragaw, T.A. Surgical face masks as a potential source for microplastic pollution in the COVID-19 scenario. Mar. Pollut. Bull. 2020, 159, 111517. [Google Scholar] [CrossRef] [PubMed]
- Di Giuliano, A.; Lucantonio, S.; Gallucci, K. Devolatilization of residual biomasses for chemical looping Gasification in Fluidized Beds Made up of Oxygen-Carriers. Energies 2021, 14, 311. [Google Scholar] [CrossRef]
- Xiao, R.; Jin, B.; Zhou, H.; Zhong, Z.; Zhang, M. Air gasification of polypropylene plastic waste in fluidized bed gasifier. Energy Convers. Manag. 2007, 48, 778–786. [Google Scholar] [CrossRef]


Publisher’s Note: MDPI stays neutral with regard to jurisdictional claims in published maps and institutional affiliations. |
© 2022 by the authors. Licensee MDPI, Basel, Switzerland. This article is an open access article distributed under the terms and conditions of the Creative Commons Attribution (CC BY) license (https://creativecommons.org/licenses/by/4.0/).