Article

Economic Integration of Renewable and Conventional Power Sources—A Case Study

by
Muhammad Mateen Afzal Awan
1,
Muhammad Yaqoob Javed
2,
Aamer Bilal Asghar
2,*,
Krzysztof Ejsmont
3,* and
Zia-ur-Rehman
4
1
Department of Electrical Engineering, University of Management and Technology Lahore, Sialkot 51310, Punjab, Pakistan
2
Department of Electrical and Computer Engineering, COMSATS University Islamabad, Lahore 54000, Punjab, Pakistan
3
Faculty of Mechanical and Industrial Engineering, Warsaw University of Technology, 02-524 Warsaw, Poland
4
Department of Electrical Engineering, Mirpur University of Science and Technology, Mirpur 10250, Azad Kashmir, Pakistan
*
Authors to whom correspondence should be addressed.
Energies 2022, 15(6), 2141; https://doi.org/10.3390/en15062141
Submission received: 27 January 2022 / Revised: 9 March 2022 / Accepted: 13 March 2022 / Published: 15 March 2022
(This article belongs to the Special Issue Applied Energy System Modeling 2021)

Abstract

:
In this study, we have presented an optimal microgrid design that ensures the uninterrupted energy supply to Mirpur University of Engineering and Technology (MUST), Azad Jammu and Kashmir AJK, Pakistan at the cheapest price by using reliable energy resources. The availability of energy resources, environmental viability, and economic feasibility are the key parameters of design. The available resources for the MUST site include the National grid, Solar photovoltaic (SPV), Battery bank, and Diesel generator. The data of electrical load, solar illumination, atmospheric temperature at the university, diesel fuel cost, SPV module lifetime, SPV degradation factor, SPV efficiency, SPV cost, battery cost, battery life, national grid energy price, load shedding and toxic emissions have been considered valuables in designing the hybrid micro-grid. The difference in net present cost (NPC) of the optimal design and the worst design is calculated by considering the above parameters. The proposed optimal microgrid design supplies energy to the load using SPV, Diesel generator, and battery bank with NPC of $250,546 and the renewable fraction of 99%. Whereas the worst design includes the Diesel generator and battery bank as energy supplying sources with the NPC of $2.14 M and a renewable fraction of 0%. Simulations performed using HOMER Pro software (HOMER Energy, HOMER Pro-3.11, Boulder, CO, USA) proved that after considering all the data and requirements mentioned above, out of 979 feasible designs, the proposed hybrid microgrid design is best suitable for MUST.

1. Introduction

Depletion of fossil fuel, unreliability, power outages, greenhouse gas emissions, and increasing energy prices has turned the world’s attention towards reliable and renewable energy resources. Sustainability transitions are long-term, versatile, and vital transformation processes through which conventional socio-technical systems advances to more sustainable modes of production and consumption [1]. The energy transition is a process of transformation from a fossil fuel regime to renewable energy resources [2]. The energy transition could not be achieved without the support of local authorities, and the worth of local authorities for this purpose was well known in the 2015 Paris Agreement [3], and it is still particularly relevant in Denmark (one of the figureheads of the world in energy transition policies) [4,5]. Indeed, local authorities could turn the sustainability perceptions into experiences, promoting social acceptability and creating socio-technical change [6]. Therefore, the roles and perspectives of local stakeholders need to be identified in supporting and promoting sustainability [7,8].
The literature has shown that the socio-economic aspects (job opportunities, social and economic development, and the revitalization of marginalized lands) convinced the local stakeholders to support transition processes. However, the stakeholders have different priorities for each conversion process for multiple reasons.
Finally, an appreciable commitment from stakeholders and policymakers is needed in the energy transition from fossil fuels to renewable resources in order to enhance the collaboration among local value chain authorities, to find synergies and benefits for different sectors and actors (including farmers).
The microgrid includes the integration of renewable energy resources, energy storage banks, and distributed energy generation resources. The microgrid can supply energy as standalone energy integrated resource or can also be integrated with the grid. The selection depends upon the availability of resources at the desired location. In remote areas, the standalone microgrid is the appropriate choice for all the energy requirements. Whereas grid-connected microgrid is more suitable in urban areas. The prominent advantage of integration is that the consumer would produce the energy as well [9]. The microgrid is more reliable, flexible, and promising compared to the conventional energy setup [10]. There are three existing categories of microgrids, (1) AC microgrid is the most known structure. In this design, the AC sources are connected to a common bus to supply the required power to the AC loads through AC/AC converter or transformers, (2) DC microgrid composed of DC energy generating sources that are connected to the DC bus and provide energy to the DC loads using DC/DC converter, and (3) hybrid microgrid is a combination of AC and DC microgrids. It utilizes both the AC and the DC energy resources using AC and DC bus bars. The DC and AC loads are connected to their respective bus bars and extract energy from both sources using the AC/DC and DC/AC converters [11].
Extensive research has been conducted on microgrids. There is a huge literature showing the benefits, challenges, opportunities associated with microgrids [12,13].
Hybrid microgrid models were developed for the following different countries, Maldives, South Korea, Australia, Busan, and Bangladesh, to increase the electrical energy generation using renewable energy resources through techno-economic feasibility analysis using the HOMER [14,15,16,17,18,19]. Researchers have designed an off-grid solar PV system and a hybrid PV/WT system to test the feasibility of an off-grid hybrid system in Nice, Nicosia, France, and Cyprus [20]. Researchers in [21] observed the reliability and estimated price for PV/WT/Fuel-cell/BESS-based microgrid using HOMER software. The rise in fuel prices and energy demand has turned the researcher’s attention towards PV/WT/DG system and its feasibility. A noticeable reduction in CO2 was observed, which is of global concern in the modern industrial era [22]. A mathematical model for the PV/WT system was developed by the researchers using HOMER software in [23] to investigate the microgrid composed of PV/WT/ and conventional grid without backup storage. The purpose was to mitigate the problems created by fossil fuels.
A considerable amount of work in microgrids has been observed, investigated, and mathematically proven. The conventional fuel-based power system is optimized to ensure lower fuel consumption while maximizing renewable electrical energy [24]. A standalone microgrid was designed to fulfill the energy needs of the Faroe Islands with a battery backup system to increase its reliability [25]. The particle swarm optimization algorithm-based simultion is used for a standalone hybrid microgrid [26]. A standalone hybrid microgrid composed of PV/pumped hydro energy storage/BESS was designed for a building of an engineering institute [27]. A feasibility study was conducted on multiple hybrid energy systems that included PV, wind, diesel generator, and a battery backup to supply the electrical energy to a hotel located in Kish Island in Iran [28]. Another study was conducted to design a microgrid for small-scale educational building in a low wind area of Tripura [29]. The performance analysis of on-grid and standalone microgrid with renewable energy resources of PV/WT/fuel cell (FC) system was evaluated. Where the grid was connected proved a more feasible solution [30]. The efficiency and reliability of hydropower and wind power were investigated and compared, which proved hydropower as a better solution for energy generation [31]. A feasibility study was conducted for a small-scale hybrid energy system (PV/Wind) with a battery backup [32]. The size of the micro-grid was optimized by using an evolutionary algorithm [33]. The techno-economical optimization for a standalone microgrid (PV/WT/DG/BESS) was addressed [34]. The size of the micro-grid was optimized by using harmony search algorithm [35]. A standalone microgrid (PV/WT/PHES) was designed for providing power to the desalination plants using a stochastic evolutionary algorithm. The water transportation cost was remarkably reduced [36].
According to the International Energy Agency (IEA) World Energy Outlook report, 16.6% of the world’s population people have access to electricity [37]. The reason provided by the government and companies is the large distances and huge investments, despite the lavishness of renewable energy technologies and sources [37].
From the above literature, it was concluded that encouraging hybrid renewable energy microgrids to fulfill the energy requirements is the most feasible option. In addition, for the modeling and optimization of the hybrid renewable energy microgrid, the HOMER software is a widely used optimization tool as per industrial standards.
A microgrid should be economically feasible, reliable, and environmentally friendly. The selection of a battery backup is an important parameter of microgrids due to the dependence of renewable energy resources on atmospheric conditions, the unreliability of the grid, and other multiple factors. Battery backup will ensure the uninterrupted power supply when the production of energy is less than the energy consumption. The microgrid allows multiple energy resources to participate and encourage the energy management system to select the best suitable combination of resources in terms of cost, reliability, and power quality.
Hence, a study is planned to model a hybrid renewable energy microgrid to fulfil the university electricity demand, and the key contributions of this study are as follows:
  • A framework for hybrid microgrid optimization was suggested by considering the key features of the sustainable development goals (inexpensive, reliable, and sustainable).
  • Under each feature of sustainable development goals, few benchmarks were spotted, i.e., inexpensive: lower COE, NPV, and capital investments; reliable: continuous power supply, minimized energy shortage, and ensured the quality of power; and sustainable: higher renewable fraction and minimum emissions.
  • Modeling of the hybrid renewable energy microgrid considering PV/DG/Battery backup was designed and analyzed for a Mirpur University of Pakistan by considering the weather conditions.
Optimization of the hybrid renewable energy microgrid was carried out to pick the most feasible configuration within the context of the sustainable development goals by considering explored benchmarks as constraints.
The Hybrid Optimization of Multiple Energy Resources (HOMER) is one of the widely known software for designing a microgrid. The simulation, sensitivity analysis, and optimization of a grid-tied and off-grid microgrid are performed in HOMER. All the available resources with relative data are applied in the simulation and the HOMER comes up with the best possible design of the microgrid. The objective of this study is to ensure continuous energy supply at the cheapest prices by using an optimal energy management system.

Introduction to HOMER-Pro

The HOMER-Pro software is designed by National Renewable Energy Laboratory (NREL), Colorado, United States of America USA. It is a powerful tool to develop an optimal hybrid design to ensure uninterrupted and low-cost electricity under certain sensitive and decision variables for grid-connected and off-grid models. The HOMER-Pro software analyses different possible combinations of available resources to provide the optimal hybrid configuration of the model. HOMER-Pro provides accurate and unbiased results. HOMER-Pro incorporates the metrological data, which is provided by the National Aeronautics and Space Administration (NASA), (Washington, DC, USA) to access the potential of available renewable resources at any location. The HOMER-Pro software works in three steps, starting with project inputs that include site-specific resources, load Profile, and system components. The second step performs the simulation, optimization under certain sensitive variables. The third step shows the result, which gives detailed information on financial parameters, performance, and system sizing.
Multiple studies have been reported in the literature about the optimization, evaluation, and analysis of microgrids. A design of microgrid was proposed for the Eskisehir Osmangazi University campus by Cetinbas in [38] to achieve the minimum energy consumption cost using an optimal energy management strategy. The simulation was conducted in MATLAB software (manufactured by MathWorks, version-MATLAB-2019, Carlsbad, CA, USA) [39]. An off-grid hybrid system composed of the solar photovoltaic, wind energy system, battery bank, and load were simulated in MATLAB and HOMER for the same purpose by Zahboune in [40]. The results showed that both software provided the optimal solution. A hybrid power system composed of solar photovoltaic, diesel generator and battery bank were simulated in HOMER to obtain optimal results of economic benefits and technical performance in [41]. An on-grid and off-grid microgrid composed of photovoltaic, diesel generator, and biomass gasifier were simulated in HOMER for optimal configuration selection [42]. An independent microgrid based on solar photovoltaic and biomass was proposed for agricultural and residential purposes in Pakistan [43]. A solar photovoltaic system with battery backup was simulated in HOMER for a hospital in Osmangazi University Campus, Eskişehir, Turkey in [44]. Furthermore, after the addition of a power converter and diesel generator in the above project, the simulations were conducted with real-time energy consumption data for one year. Results showed a notable improvement in cost, power quality, and reliability by using renewables [45].
This paper provides the design of an optimal microgrid for two departments of Mirpur University of Science and Technology (MUST) using the real-time data of electric load. All the available resources at the site of campus were considered, which includes a solar photovoltaic system, battery bank, diesel generator, and electrical grid. Each resource and equipment used in this simulation was first studied in the market for its cost, performance, and availability.
The paper is organized as follows, (1) Introduction, (2) Methodology, the installed load and the metrological data collection at site, and the introduction to HOMER Pro® software, (3) Design of microgrid, (4) Assessment criteria for microgrid optimization, (5) the optimization process of hybrid microgrid, the performance of microgrid project throughout its lifetime, the evaluation of technical and economic aspects of microgrid along with results, (6) the discussions, and (7) the conclusion of the study.

2. Methodology

An optimal design of microgrid was proposed for the Civil and Mechanical engineering departments of MUST University, Mirpur campus. The objective is to provide an uninterrupted power supply to the campus at the lowest possible cost. Predicting the operating cost of microgrids for the next 25 years is a challenging task. Moreover, multiple factors would possibly affect the performance of microgrids, such as changes in fuel prices, grid interruptions frequency, PV degrading factor, and change in energy demand. Hence, it is necessary to consider these factors to design the optimal microgrid power system, which could meet the objective within 25 years of operations. HOMER is capable of performing such analysis with great accuracy and reliability. Therefore, simulation of a microgrid considering all the variables and conditions is performed in HOMER software for MUST university Mirpur campus. The Flow Chart of Research Methodology for this research is presented in Figure 1.

2.1. Site Selection

The considered site for the proposed research was the new civil and mechanical engineering departments of MUST’s new campus located in Jari Kus Mirpur AJK. AJK consists of 2 types of areas, one is a plane area and another one is hilly. The campus is located in the plane area, thus the on-grid site selection is preferred. The latitude of the selected site is 33.140, and the longitude is 73.150.

2.2. Installed Load and Metrological Data Calculations

The load calculation was an important task of the research work. The light load was calculated for this research. We will design the system on the peak load of the selected site of the civil and mechanical engineering department of MUST. The detail of installed load in the CE and ME campus can be seen in Table 1. The National Aeronautics and Space Administration (NASA) provided worldwide solar and meteorological data for support and research of renewable energy. For the selected site, NASA has reported the minimum solar radiation of 2.99 kWh/m2/day in December and maximum solar radiation of 7.54 kWh/m2/day during June, which is a hot and long month. The annual average daily solar radiation was 5.24 KWh/m2/day, which is most suitable for the generation of electricity in the selected site civil and mechanical engineering campus MUST. The clearance index and solar illumination can be seen in Figure 2.
The average daily temperature of the location can also be obtained from the NASA prediction of the worldwide energy resources power database. The value of temperature was the average of a 30-year period. The data shows that the annual average temperature was 18.05 °C. Figure 3 indicates the temperature variation for selected site throughout the year, in January the temperature is at a minimum value of 6.940 °C, and in June, the temperature is at a maximum value of 27.600 °C.

2.3. Energy Resources

Energy resources are one of the main objectives of the study. The site is located in the region where the energy produced from the sun can be a prominent source of generation and can also be seen from the metrological data calculated in the previous section. There is also the potential of hydro, hydrokinetic, biomass, and other renewable resources, but in the study, we only mention solar energy, diesel generator, and grid.

2.4. Software

The HOMER Pro® microgrid software was selected because it has become a recognized global standard for optimizing microgrid design in all sectors, from off-grid village power and island utilities to grid-connected campuses and military bases [46]. HOMER (Hybrid Optimization Modeling for Electric Renewable) Software is used for the integration of solar photovoltaic with the diesel generator and grid. A battery storage system is also used for backup purposes. By using HOMER, it is possible to compare different possible microgrid designs based on economics and their technical matters. Sensitivity analysis of optimized designs is also possible in HOMER.

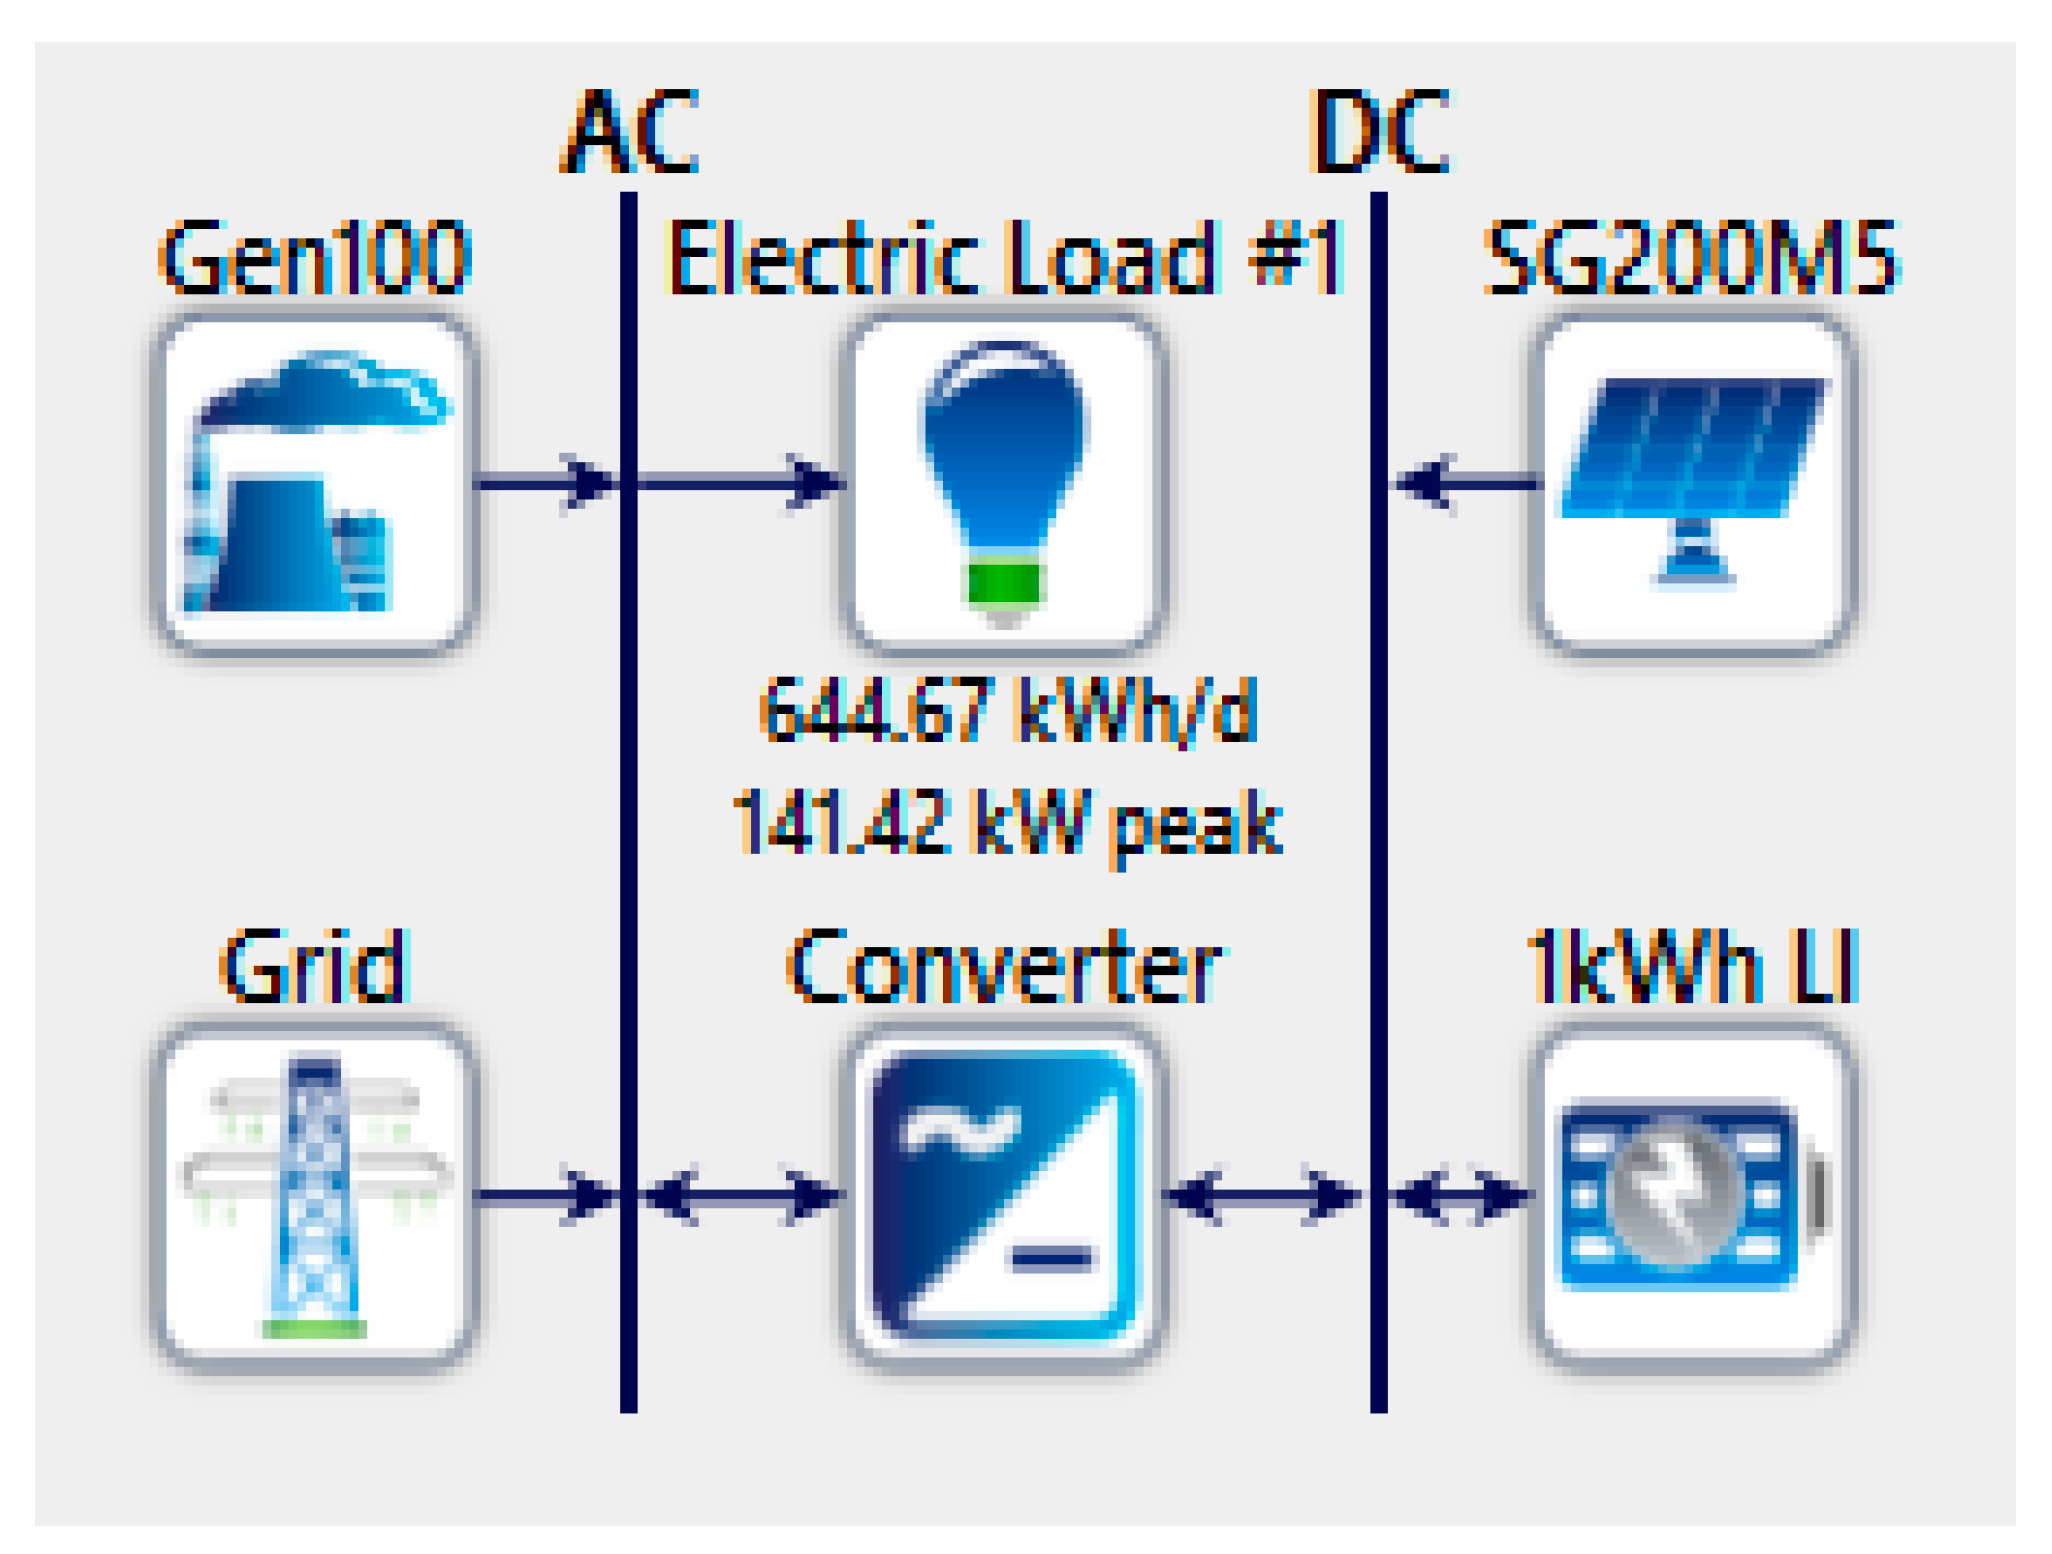
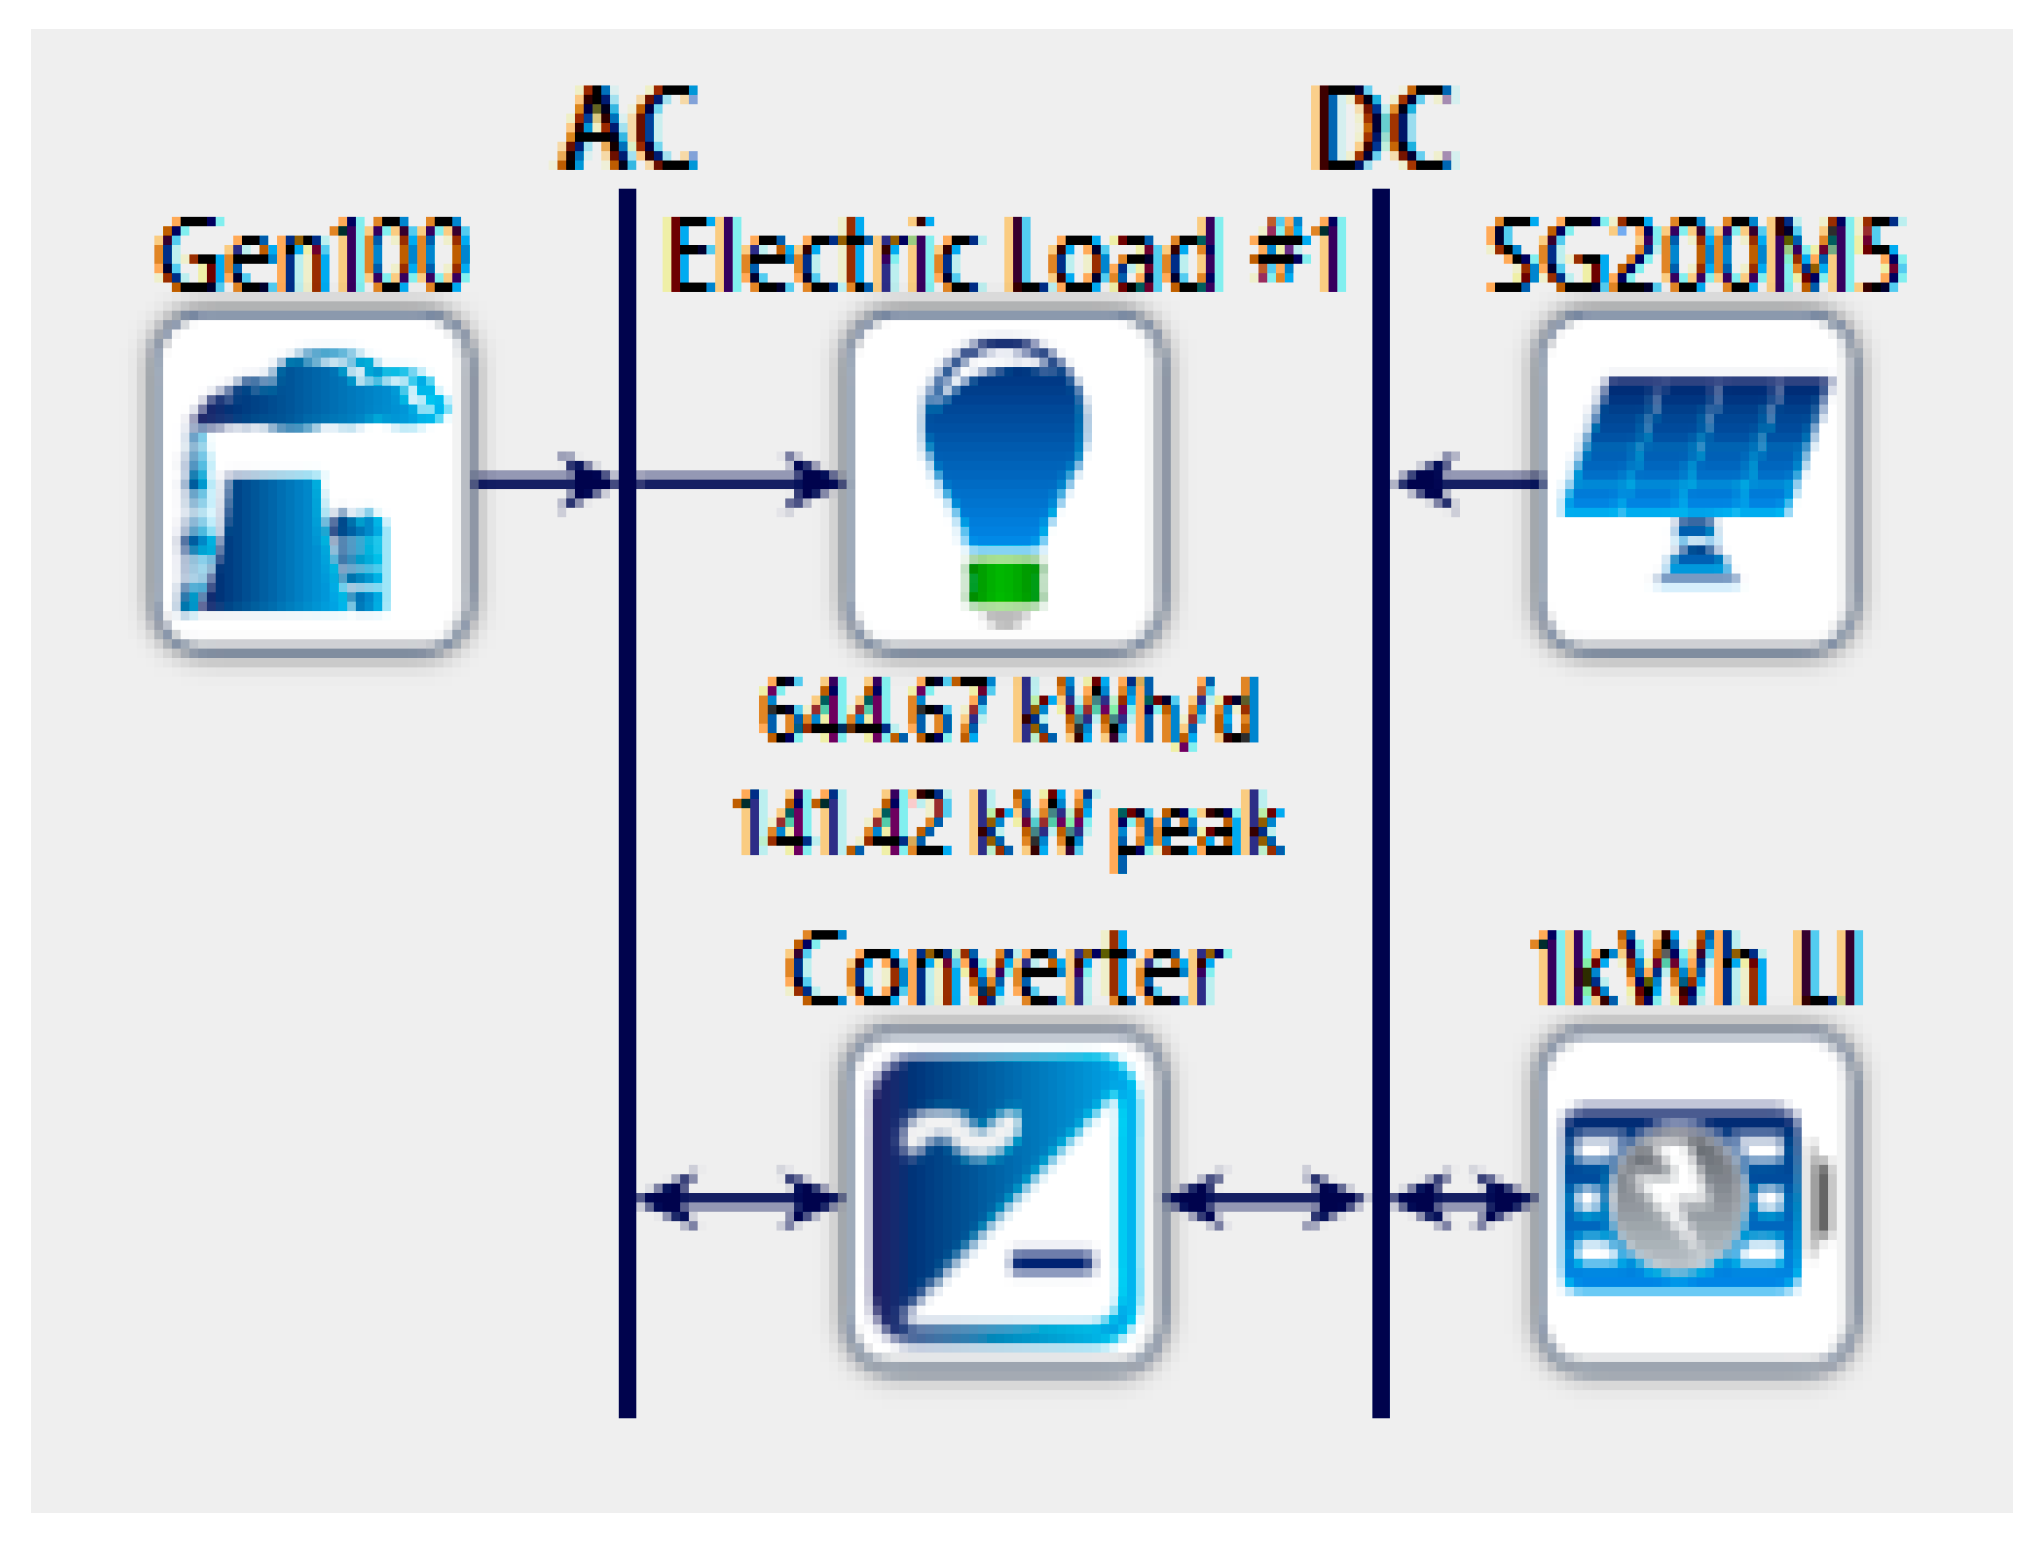
3. Design of Microgrid

The design, development, and optimization of microgrids for the MUST university Mirpur campus will be discussed in detail in this section. The designed microgrid using all the available resources at the MUST University is presented in Figure 4 and the proposed optimal design is presented in Figure 5.
In Figure 4, all the available resources at MUST University were modeled initially. The SPV (SG200M5) and battery bank (1 kWh L) was connected to the DC bus as these are the DC voltage sources, whereas the diesel generator (GEN 100) and grid were connected to the AC bus as these are the AC voltage sources. A bidirectional power converter was used to connect the DC and AC bus bars to manage the two-way flow of electrical energy when required. The load is currently attached to the AC bus bar, but a DC load with a DC bus bar can be used instead.
Whereas the simulations performed based on the parameters and data, the optimal design proposed by HOMER did not use a single energy unit from the grid throughout the year. Therefore, the grid was exempted from the proposed optimal design of microgrid for the MUST University, Mirpur campus, and the proposed microgrid is shown in Figure 5.
The parameter description of each component used in the initial and final design of the microgrid is presented in Table 2. The description of each component mentioned in Table 1 is real. The purchasing cost of components, fuel prices, grid tariff rates, etc., were based on the recent market prices in Pakistan.

3.1. Grid Power

The power from the national grid was included in the initial design for the continuous and cheap energy supply, but unfortunately, in the present day, the Govt. has raised the electricity prices and taxes to a limit where the electrical energy from the other resources becomes more suitable. If we stand with the previous price ratios of the grid and other energy resources, grid energy was undoubtedly the cheapest. However, in recent conditions, the grid was not the cheapest energy source in Pakistan. The details of grid power price were $0.22 for commercial or industrial purposes.

3.2. Solar Photovoltaic System

The solar photovoltaic is a DC energy source. Its power generation is directly dependent on solar illumination and temperature [47,48]. The output current of photovoltaic can be calculated using Equation (1) [49]. While designing a photovoltaic system, multiple factors should be considered, such as material, nominal output, derating factor, temperature, illumination, and environmental conditions.
I = I P V I D ( V + I R s R s h )  
This single diode model has five parameters Ipvn, ID, Rs, Rp, and α. Where:
I P V = Current of PV cell,
I D = Diode Current,
R s = Resistance in Series,
R s h = Parallel Resistance,
α = Diode ideality factor VD.
The PV module’s current can be calculated by:
I = N P P ( I P V I 0 [ exp ( V + I R s α V T N s s ) 1 ] ) ( V + I R s R s h )
where:
N P P = Number of parallel-connected cells,
N s s = Number of series-connected cells,
I = Module current,
I 0 = Reverse saturation current,
V = Module Voltage,
VT = Thermal Voltage.
The most commonly used flat plate photovoltaic module (SG200M5) was selected while doing the simulations in HOMER as shown in Figure 4 and Figure 5. The capital and replacement costs of the module of 1 KW power mentioned in the simulation ($316) were taken from the market of Rawalpindi, Pakistan. The amount of operation and maintenance was set at $10. The lifetime of the solar module was 30 years. Solar photovoltaic is a DC source, therefore, connected to the DC bus bar of the microgrid system. “HOMER uses the following equation to calculate the output of the PV array [50]:
P P V = Y P V f P V ( G T G T , S T S ¯ ¯ ) [ 1 + α P ( T C T C , S T C ) ]
where:
P P V = the rated capacity of the PV array, meaning its power output under standard test conditions [kW],
Y P V = the rated capacity of the PV array, meaning its power output under standard test conditions [kW],
f P V = the PV derating factor [%],
G T = the solar radiation incident on the PV array in the current time step [kW/m2],
G T , S T S = the incident radiation at standard test conditions [1 kW/m2],
α P = the temperature coefficient of power [%/°C],
T C = the PV cell temperature in the current time step [°C],
T C , S T C = the PV cell temperature under standard test conditions [25 °C].
If on the PV page, you choose not to model the effect of temperature on the PV array, HOMER assumes that the temperature coefficient of power is zero, thus Equation (3) is simplified in the form of Equation (4):
P P V = Y P V f P V ( G T ¯ G T , S T C ¯ )  
The annual maximum power, average daily maximum power, and average output power of the solar panel for a year is shown in Figure 6.

3.3. Battery Bank

A battery bank of 1 KWh was used as a backup in the microgrid. It supplies the load with the cheapest rate when required or plays its role in an emergency. The capital and replacement cost of the battery bank mentioned in the simulation ($101) was taken from Rawalpindi, Pakistan. The lifetime of a battery is 15 years. For optimal performance, the charging and discharging limits of the battery bank were set at 100% and 20%, respectively. A battery bank is a DC source, therefore, connected to the DC bus bar in the microgrid. The yearly battery charging and discharging is shown in Figure 7.

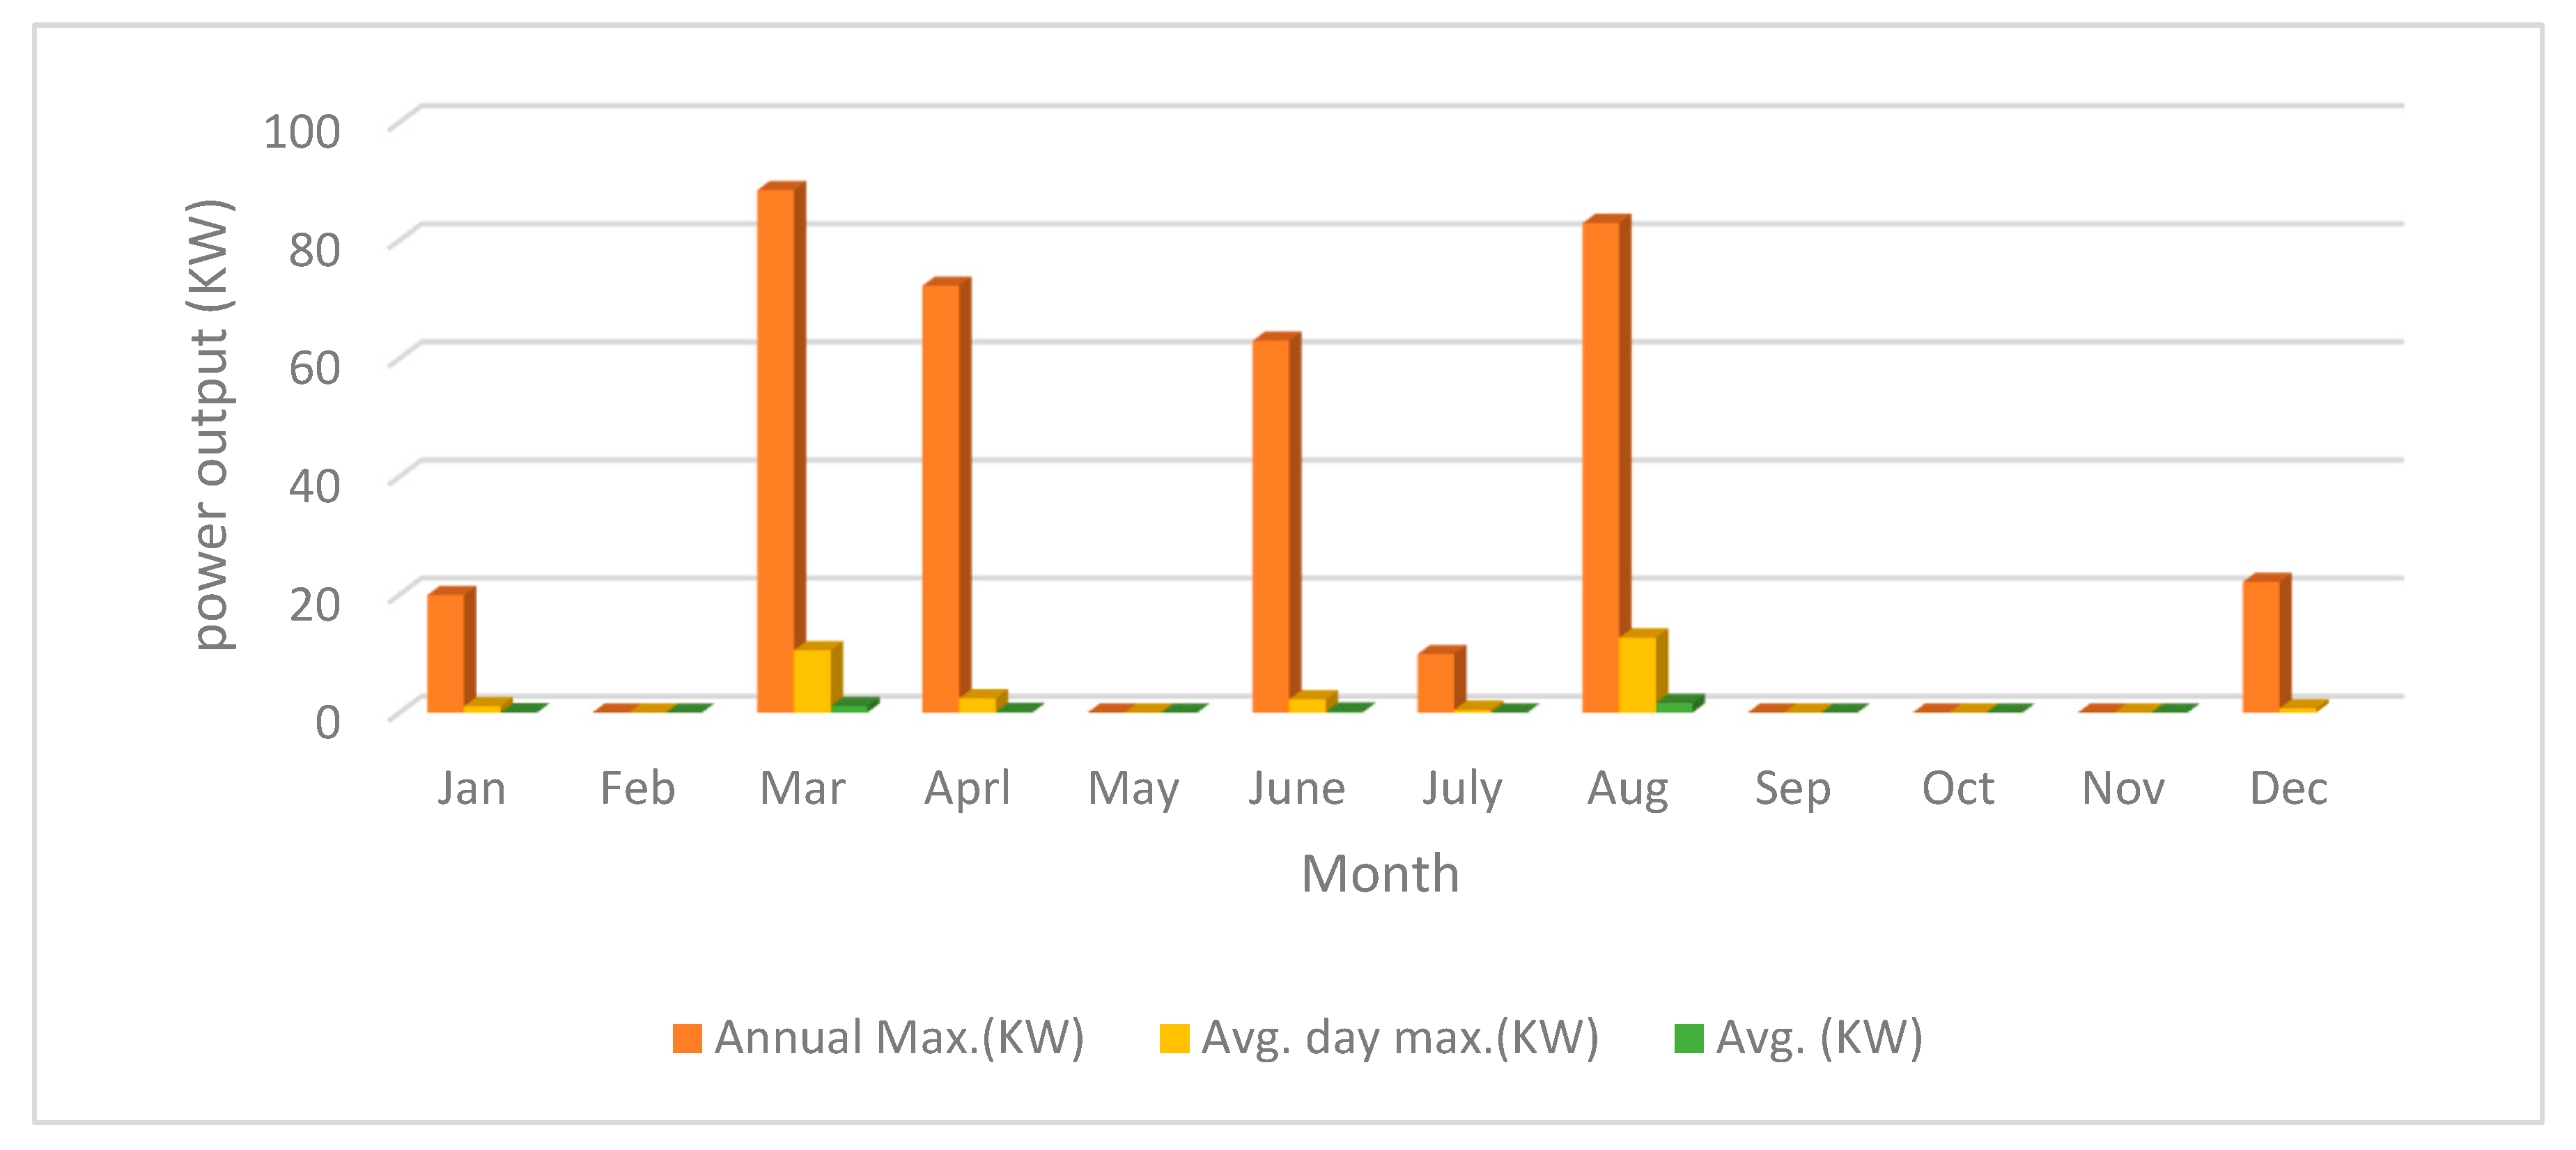
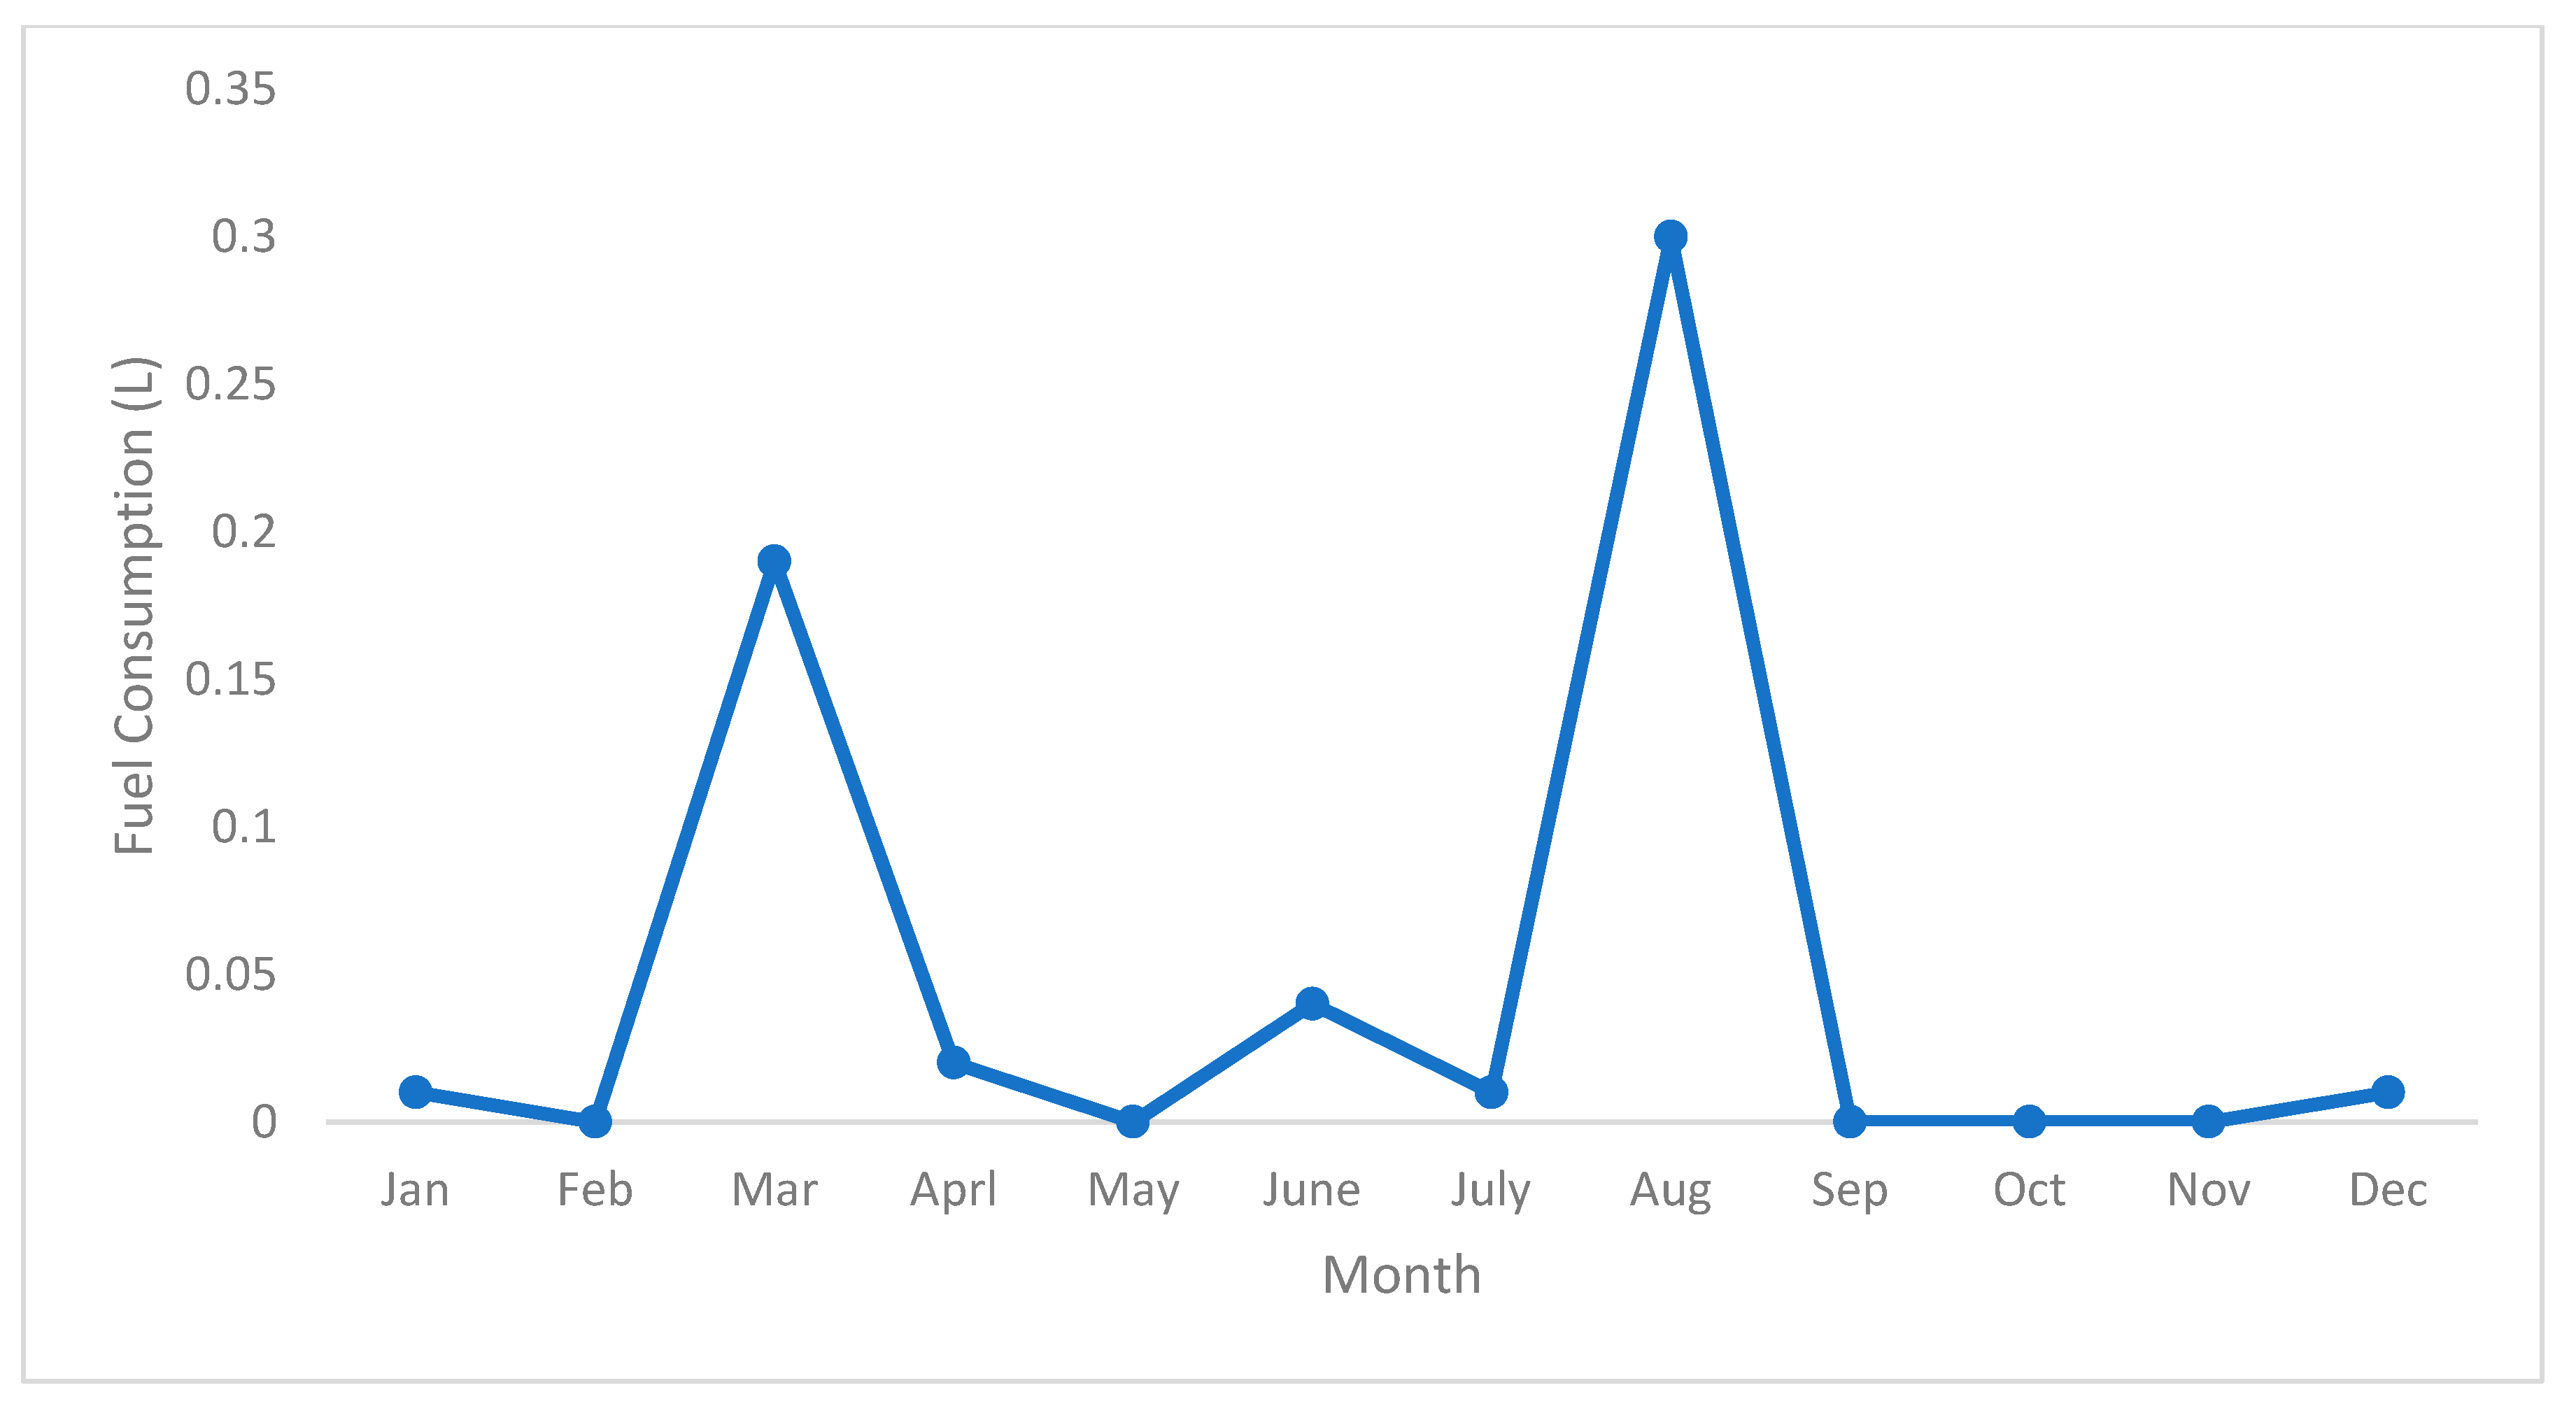
3.4. Diesel Generator

A diesel generator was installed as an alternate energy source in the microgrid. However, nowadays, compared to the grid, the diesel generator is a cheap energy source in Pakistan. It always performs as a reliable backup source even when its energy generation was costly in comparison to the grid (2–3 years before). The fuel price entered in the simulation was the recent market price of diesel fuel in Pakistan, which is $0.6. A diesel generator of 100 KW with the capital, replacement, and O&M cost of $40,000, $40,000, and $2 (per hour), respectively, was simulated in the HOMER. It consumes 0.253 L/hour/KWh. Its lifetime is 15,000 h and connected to the AC bus bar of microgrid. The month wise power output and fuel consumption of the generator are shown in Figure 8 and Figure 9, respectively.

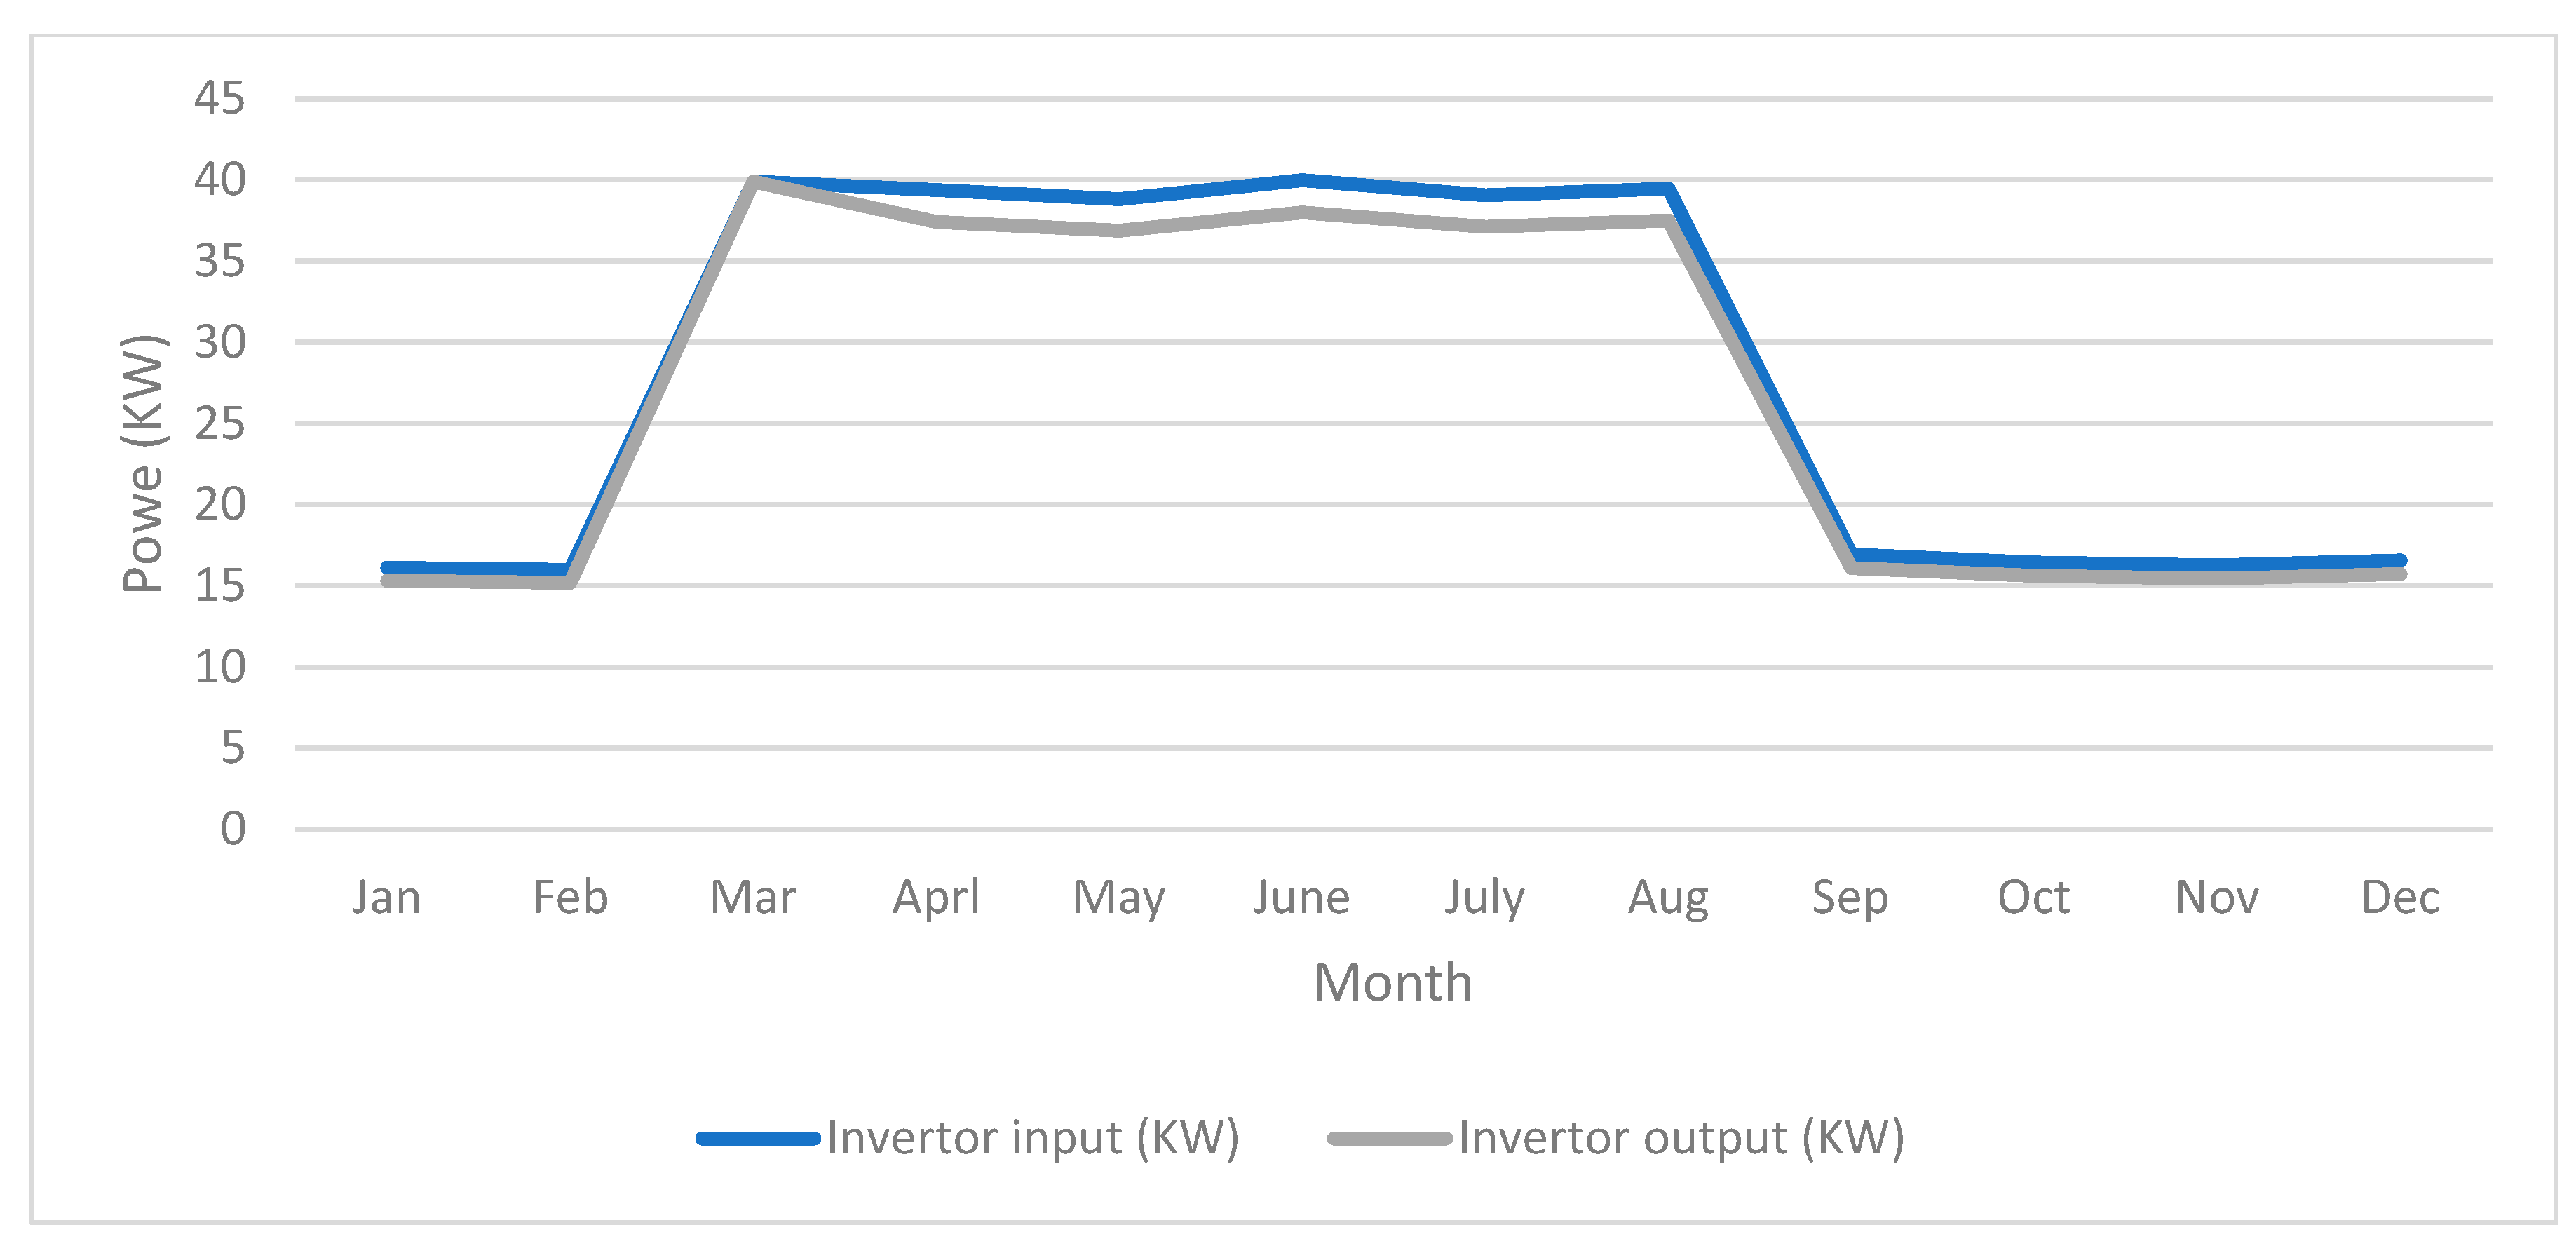
3.5. Power Convertor

A generic system converter of 100 KW was used to maintain the bidirectional flow of power in the microgrid. It acts as a rectifier for AC and as an inverter for DC power supply. With a capital and replacement cost of $300, it has a lifetime and capacity of 15 years and 100 KW, respectively. It operates at 95% efficiency and is connected between the AC and DC bus bars of the microgrid. The invertor input and output are presented in Figure 10.

3.6. Load

The load of Civil and Mechanical Engineering departments of MUST University, Mirpur campus was measured using the measuring devices at an hourly basis for one year. The monthly load profile is presented in Figure 11.
The monthly load profile provides information about the maximum energy consumption per month along with the average and average day maximum information. Designing a microgrid based on the real data is compulsory to obtain the optimal design. Therefore, the real cost of each component and current tariff charges was collected and used in the simulation to obtain efficient results.
It can be clearly observed from the table that the campus departments consume maximum energy in the months from March to August in summer and have their peak demand in the month of August (147.96 KW). The reason for this peak consumption is the addition of fans and air conditioner loads in the summers. Whereas the load for the electric heater is not dominating in the months of winter due to the usage of gas heaters in the campus. The daily load consumption and seasonal profile is displayed in the HOMER software in Figure 12. The load operates in the university timing and totally shuts down afterward. The university operation hours are from 8:00 A.M. to 6:00 P.M. and remain closed on Saturday and Sunday. Therefore, load after 6:00 P.M. and before 8:00 A.M. is zero and completely zero for the weekend (Saturday and Sunday).

4. Assessment Criteria for Optimization

Designing, simulation, and optimization are the three phases of the project. Proceeding towards the optimization phase needs assessment criteria to be defined. In this research work, the performance assessment criteria are net present cost (NPC), levelized cost of energy (COE), operating cost (OC), initial capital cost (CC), and renewable fraction ( f r e n ). Each criterion is defined and explained further in this section as defined in the index of HOMER [15].

4.1. Net Present Cost (NPC)

HOMER defines it as “The net present cost (or life-cycle cost) of a component is the present value of all the costs of installing and operating the component over the project lifetime, minus the present value of all the revenues that earns over the project lifetime. HOMER calculates the net present cost of each component in the system and of the system as a whole”.

4.2. Levelized Cost of Energy (COE)

It is defined by the HOMER as “To calculate the COE, HOMER divides the annualized cost of producing electricity (the total annualized cost minus the cost of serving the thermal load) by the total electric load served”. This can be calculated using Equation (5).
C O E = C a n n , t o t C b o i l e r H s e r v e d E s e r v e d  
Where, Cann,tot is the total annualized cost of the system ($/year), Cboiler is the boiler marginal cost ($/kWh), Hserved is the total thermal load served (kWh/year), Eserved is the total electrical load served (kWh/year).

4.3. Operating Cost (OC)

As per HOMER definition, the operating cost is the annualized value of all costs and revenues other than initial capital costs. Operating cost is calculated using Equation (6).
C o p e r a t i n g = C a n n , t o t C a n n , c a p  
Where, Coperating is the total annualized cost of the system ($/year), Cann,cap is the total annualized capital cost ($/year).

4.4. Capital Cost (CC)

Initial capital cost is defined by the HOMER program as the following. The initial capital cost of a component is the total installed cost of that component at the beginning of the project.

4.5. Renewable Fraction

Renewable fraction is defined by the HOMER program as the following. The renewable fraction is the fraction of the energy delivered to the load that originated from renewable power sources. Renewable fraction is calculated using Equation (7).
f r e n = 1 E n o n r e n H n o n r e n E s e r v e d + H s e r v e d
Where, Enonren is the non-renewable electrical production (kWh/year), Hnonren is the non-renewable thermal production (kWh/year), Eserved is the total electrical load served (kWh/year), Hserved is the total thermal load served (kWh/year). The monthly renewable energy output is presented in Figure 13.

5. Optimization of Microgrid

The primary objective is to fulfill the energy demand of MUST CE and ME departments without any interruption. Therefore, multiple available sources are applied to serve the load. Optimization of this designed power system is performed to provide a cheap and uninterrupted power supply. For this purpose, multiple sources are put together with their present market and operating prices, along with detailed data of their structure and availability.
To obtain the optimal results, the upper and lower limit settings for each energy source were left up to the HOMER by selecting the option of “HOMER Optimization”. The optimized design of the microgrid proposed by the HOMER software after hundreds of simulations is presented in Table 3. The five optimized microgrid designs for the MUST, Mirpur campus were proposed based on the five performance indicating criteria: net operating cost, cost of energy, operating cost, capital cost, and renewable fraction.
Sensitivity analysis provides the understanding of how much changes in the variables of an optimization problem modify the optimal objective function value and the point where the optimum is obtained. The HOMER-Pro software performs optimization under certain sensitivity variables and decision variables. The objective function is to ensure the supply of cheap and uninterrupted electricity using reliable energy sources. In this study, we have taken solar illumination, atmospheric temperature, diesel cost, solar PV cost, and batteries cost as sensitivity variables. Whereas, the size of the generator, size of PV module, size of ac to dc converter, batteries, and the supply from grid were taken as decision variables. The performance of each microgrid design was evaluated under certain assessment criteria such as Net Present Cost (NPC), Levelized Cost of Energy (COE), Operating Cost (OC), Capital Cost (CC), and Renewable Fraction ( f r e n ). Hence, the sensitivity analysis for five microgrid models is presented in Table 3 under certain decision variables, and the optimum model is selected on the basis of NPC, COE, OC, CC and f r e n .
The most optimal combination of components includes the SPV system, battery bank, diesel generator, and power converter. The selection is based on the five parameters mentioned in Table 3. We will proceed with the system proposed by HOMER in the first row of Table 3. This system has a continuous backup system along with the energy storage system, which is very compulsory.
The hybrid microgrid is evaluated in terms of capital and O&M costs provided in Table 4. The highest capital cost belongs to the solar photovoltaic system, and the highest O&M cost belongs to the diesel generator. The total cost of the system for the one year is calculated as $250,545.58 according to this assessment.
Further, a one-year evaluation is performed for the designed microgrid. Comparison based on the generation and consumption of energy is presented in Table 5. In the proposed design of the microgrid, 99.7% of total energy is generated by the solar photovoltaic and supplied to the load directly. The remaining 0.333% of electric energy is supplied by the diesel generator. This reflects that diesel generator participates during the absence or lower illumination.
The economic comparison of all the proposed optimal scenarios/categories of a microgrid is presented in Table 6. It showed that the first optimal proposed design of microgrid by HOMER has the least payback period, highest return on investment, and highest present and annual worth, out of the five proposed designs, which further increased its suitability for the site.

6. Discussion

Grid power outages, soaring energy prices, the unreliability of conventional energy resources, and greenhouse gas emissions are serious energy issues in developing countries such as Pakistan. Ensuring continuous energy supply using reliable resources with a high fraction of renewable energy resources at the cheapest price is the hottest research topic today all over the world. In this study, an optimal microgrid is designed for the MUST University of Pakistan, using HOMER Pro Software. Initially, the load of the university is measured continuously for one year. A microgrid with all the available resources (Solar, Wind, Diesel Generator, Grid, and Battery bank) is simulated in HOMER after predicting the data of illumination, wind, temperature, fuel prices, battery life, load, etc., for the next 25 years. After 979 successful simulations, an optimal design is proposed after a detailed economic analysis to fulfill the energy needs of MUST university using reliable resources at the cheapest prices. The performance of each microgrid design is evaluated under certain assessment criteria such as Net Present Cost (NPC), Levelized Cost of Energy (COE), Operating Cost (OC), Capital Cost (CC), and Renewable Fraction. The economic analysis observed many factors such as capital cost, fuel cost, replacement cost, net present cost, energy cost, operational cost, maintenance cost, present worth, annual worth, return on investment, and payback period to select the best possible microgrid design. The performance, suitability, and reliability of the proposed optimal microgrid design are selected after detailed evaluation at all the above-mentioned standard benchmarks.
The most optimal combination of components includes the SPV system, battery bank, diesel generator, and power converter. The selection is based on the following five parameters: Net Present Cost, Levelized Cost of Energy, Operating Cost, Capital Cost, and Renewable Fraction. This system has a continuous backup system along with the energy storage system, which is compulsory. The highest capital cost belongs to the solar photovoltaic system, and the highest O&M cost belongs to the diesel generator. The total cost of the system for the one year is calculated as $250,545.58. In the proposed design of the microgrid, 99.7% of total energy is generated by the solar photovoltaic and supplied to the load directly. The remaining 0.333% of electric energy is supplied by the diesel generator. This reflects that diesel generator participates during the absence or lower illumination. The economic comparison of all the proposed optimal scenarios/categories of a microgrid is also conducted. It is shown that the optimal hybrid microgrid design proposed by HOMER has the least payback period, highest return on investment, and highest present and annual worth, out of five proposed designs, which further increased its suitability for the site.

7. Conclusions

The objective of this study is to propose an optimum microgrid design for the selected site, which can ensure the continuous supply of electricity at the cheapest prices by using an optimal energy management system. The proposed optimal design of the microgrid is analyzed and verified at different benchmarks under multiple scenarios and considering all possible conditions. It has been proven beneficial for the CE and ME department of MUST University, Mirpur campus under all circumstances. The proposed system consists of a solar photovoltaic system, Diesel generator, battery bank, and a power converter, as the best possible combination of power sources to fulfill the energy demand of university campus departments uninterruptedly, and at the cheapest price using reliable energy sources for the next 25 years with the 99% fraction of renewable energy, which promotes the green and clean energy generation and reduces the greenhouse gas emissions. In order to achieve maximum benefits, the size and optimal operation of the microgrid is of utmost importance. Therefore, the design, simulation, and optimization of the proposed microgrid are carried out using the HOMER software. The optimal selection of combination of energy resources to supply continuous energy at the cheapest price for a period of 25 year has been made after the detailed economic analysis, energy demand and weather prediction, study of PV module degradation effect, and the prediction of network outages projected over the selected lifetime (25 years) of system. In conclusion, a PV power source of 200 kW, a diesel generator of 100 kW, and one energy storage unit having a capacity of 100 kWh were found to be optimum for the selected load profile. The effects of PV module degradation, demand increase, and network outages were investigated in the proposed hybrid microgrid consisting of PV-diesel generator-battery-converter combination. The proposed system of 200 kW PV system, 100 kW diesel generator, and a 100-kwh battery bank was an optimal selection to fulfill the energy needs of both departments of MUST for a selected lifetime.
In the future, a comparative analysis of grid-connected and off-grid designs for various locations can be investigated. Moreover, hybrid systems with other renewable resources such as biomass, wind, geothermal, and tidal could be integrated to examine the optimal design.

Author Contributions

Conceptualization, M.M.A.A., M.Y.J. and A.B.A.; methodology, M.M.A.A., M.Y.J. and A.B.A.; software, M.M.A.A. and Z.-u.-R.; validation, M.Y.J., A.B.A. and K.E.; resources, M.M.A.A., M.Y.J., A.B.A. and Z.-u.-R.; data curation, M.M.A.A., M.Y.J. and A.B.A.; writing—original draft preparation, M.M.A.A., M.Y.J., A.B.A., K.E. and Z.-u.-R.; writing—review and editing, M.Y.J., A.B.A. and K.E.; supervision, M.Y.J. and A.B.A.; funding acquisition, A.B.A. and K.E. All authors have read and agreed to the published version of the manuscript.

Funding

This research was funded by Polish National Agency for Academic Exchange under grant no. PPI/APM/2018/1/00047 entitled “Industry 4.0 in Production and Aeronautical Engineering” (International Academic Partnerships Program). The APC was funded by the Polish National Agency for Academic Exchange. The authors also want to offer their thanks for the substantive support provided by the KITT4SME (platform-enabled KITs of artificial intelligence for an easy uptake by SMEs) project. The project was funded by the European Commission H2020 Program, under GA 952119.

Institutional Review Board Statement

Not applicable.

Informed Consent Statement

Not applicable.

Data Availability Statement

The data are generated on MUST, MIRPUR and available on personal request to the third author.

Conflicts of Interest

The authors declare no conflict of interest.

References

  1. Dialga, I. Evaluating Normandy’s sustainable development and energy transition policies. J. Clean. Prod. 2021, 305, 127096. [Google Scholar] [CrossRef]
  2. Tiranzoni, P.; Sapio, A.; Casamassima, A.; Falcone, P.M. Assessing energy misperception in Europe: Evidence from the European social survey. Energy Sources Part B Econ. Plan. Policy 2022, 1–16. [Google Scholar] [CrossRef]
  3. United Nations. Paris Agreement, United Nations Framework Convention on Climate Change; United Nations: New York, NY, USA, 2015. [Google Scholar]
  4. Mendonça, S.; Lacey, F. Hvelplund, Stability, participation and transparency in renewable energy policy: Lessons from Denmark and the United States. Policy Soc. 2009, 27, 379–398. [Google Scholar] [CrossRef] [Green Version]
  5. Falcone, P.M.; Imbert, E.; Sica, E.; Morone, P. Towards a bioenergy transition in Italy? Exploring regional stakeholder perspectives towards the Gela and Porto Marghera biorefineries. Energy Res. Soc. Sci. 2021, 80, 102238. [Google Scholar] [CrossRef]
  6. Truffer, B.; Coenen, L. Environmental innovation and sustainability transitions in regional studies. Reg. Stud. 2021, 46, 1–21. [Google Scholar] [CrossRef]
  7. Sorman, A.H.; García-Muros, X.; Pizarro-Irizar, C.; González-Eguino, M. Lost (and found) in Transition: Expert stakeholder insights on low-carbon energy transitions in Spain. Energy Res. Soc. Sci. 2020, 64, 101414. [Google Scholar] [CrossRef]
  8. Boyle, E.; Watson, C.; Mullally, G.; Gallachóir, B.Ó. Regime-based transition intermediaries at the grassroots for community energy initiatives. Energy Res. Soc. Sci. 2021, 74, 101950. [Google Scholar] [CrossRef]
  9. Boudoudouh, S.; Maâroufi, M. Multi agent system solution to microgrid implementation. Sustain. Cities Soc. 2018, 39, 252–261. [Google Scholar] [CrossRef]
  10. Khorasany, M.; Azuatalam, D.; Glasgow, R.; Liebman, A.; Razzaghi, R. Transactive energy market for energy management in microgrids: The monash microgrid case study. Energies 2020, 13, 2010. [Google Scholar] [CrossRef]
  11. Dash, R.L.; Behera, L.; Mohanty, B.; Hota, P.K. Cost and sensitivity analysis of a microgrid using HOMER-Pro software in both grid connected and standalone mode. In Proceedings of the 2018 International Conference on Recent Innovations in Electrical, Electronics & Communication Engineering (ICRIEECE), Bhubaneswar, India, 27–28 July 2018; pp. 3444–3449. [Google Scholar]
  12. Lopolito, A.; Falcone, P.M.; Sica, E. The role of proximity in sustainability transitions: A technological niche evolution analysis. Res. Policy 2022, 51, 104464. [Google Scholar] [CrossRef]
  13. D’Adamo, I.; Falcone, P.M.; Imbert, E.; Morone, P. Exploring regional transitions to the bioeconomy using a socio-economic indicator: The case of Italy. Econ. Polit. 2020, 1–33. [Google Scholar] [CrossRef]
  14. Shafiullah, G.M.; Amanullah, M.T.O.; Ali, A.S.; Jarvis, D.; Wolfs, P. Prospects of renewable energy—A feasibility study in the Australian context. Renew. Energy 2012, 39, 183–197. [Google Scholar] [CrossRef]
  15. Shoeb, M.; Shafiullah, G.M. Renewable energy integrated islanded microgrid for sustainable irrigation—A Bangladesh perspective. Energies 2018, 11, 1283. [Google Scholar] [CrossRef] [Green Version]
  16. Höfer, T.; Madlener, R. A participatory stakeholder process for evaluating sustainable energy transition scenarios. Energy Policy 2020, 139, 111277. [Google Scholar] [CrossRef] [Green Version]
  17. Ali, I.; Shafiullah, G.M.; Urmee, T. A preliminary feasibility of roof-mounted solar PV systems in the Maldives. Renew. Sustain. Energy Rev. 2018, 18, 18–32. [Google Scholar] [CrossRef]
  18. Brka, A.; Al-Abdeli, Y.M.; Kothapalli, G. The interplay between renewables penetration, costing and emissions in the sizing of stand-alone hydrogen systems. Int. J. Hydrogen Energy 2015, 40, 125–135. [Google Scholar] [CrossRef]
  19. Baek, S.; Park, E.; Kim, M.G.; Kwon, S.J.; Kim, K.J.; Ohm, J.Y.; del Pobil, A.P. Optimal renewable power generation systems for Busan metropolitan city in South Korea. Renew. Energy 2016, 88, 517–525. [Google Scholar] [CrossRef]
  20. Panayiotou, G.; Kalogirou, S.; Tassou, S. Design and simulation of a PV and a PVWind standalone energy system to power a household application. Renew. Energy 2012, 37, 355–363. [Google Scholar] [CrossRef]
  21. Gangwar, S.; Bhanja, D.; Biswas, A. Cost, reliability, and sensitivity of a stand-alone hybrid renewable energy system—A case study on a lecture building with low load factor. J. Renew. Sustain. Energy 2015, 7, 013109. [Google Scholar] [CrossRef]
  22. Islam, A.K.M.S.; Rahman, M.M.; Mondal, M.A.H.; Alam, F. Hybrid energy system for St. Martin Island, Bangladesh: An optimized model. Procedia Eng. 2012, 49, 179–188. [Google Scholar] [CrossRef] [Green Version]
  23. Ahmad, J.; Imran, M.; Khalid, A.; Iqbal, W.; Ashraf, S.R.; Adnan, M.; Ali, S.F.; Khokhar, K.S. Techno economic analysis of a wind-photovoltaic-biomass hybrid renewable energy system for rural electrification: A case study of Kallar Kahar. Energy 2018, 148, 208–234. [Google Scholar] [CrossRef]
  24. Baghdadi, F.; Mohammedi, K.; Diaf, S.; Behar, O. Feasibility study and energy conversion analysis of stand-alone hybrid renewable energy system. Energy Convers. Manag. 2015, 105, 471–479. [Google Scholar] [CrossRef]
  25. Enevoldsen, P.; Sovacool, B.K. Integrating power systems for remote island energy supply: Lessons from Mykines, Faroe Islands. Renew. Energy 2016, 85, 642–648. [Google Scholar] [CrossRef]
  26. Sharafi, M.; ELMekkawy, T.Y. Multi-objective optimal design of hybrid renewable energy systems using PSO-simulation based approach. Renew. Energy 2014, 68, 67–79. [Google Scholar] [CrossRef]
  27. Biswas, A.; Kumar, A. Techno-economic optimization of a stand-alone PV/PHS/ Battery systems for very low load situation. Int. J. Renew. Energy Res. 2017, 7, 844–856. [Google Scholar]
  28. Fazelpour, F.; Soltani, N.; Rosen, M.A. Feasibility of satisfying electrical energy needs with hybrid systems for a medium-size hotel on Kish Island, Iran. Energy 2014, 73, 856–865. [Google Scholar] [CrossRef]
  29. Bhattacharjee, S.; Acharya, S. PV–wind hybrid power option for a low wind topography. Energy Convers. Manag. 2015, 89, 942–954. [Google Scholar] [CrossRef]
  30. Türkay, B.E.; Telli, A.Y. Economic analysis of standalone and grid connected hybrid energy systems. Renew. Energy 2011, 36, 1931–1943. [Google Scholar] [CrossRef]
  31. Thakur, G.; Sharma, K.K.; Kaur, I.; Singh, B. Cost Analysis of Hybrid Power System Design Using Homer; Springer: Singapore, 2018; pp. 247–257. [Google Scholar]
  32. Nafeh, A.E. Optimal economical sizing of a PV-wind hybrid energy system using genetic algorithm. Int. J. Green Energy 2011, 8, 25–43. [Google Scholar] [CrossRef]
  33. Li, B.; Roche, R.; Miraoui, A. Microgrid sizing with combined evolutionary algorithm and MILP unit commitment. Appl. Energy 2017, 188, 547–562. [Google Scholar] [CrossRef] [Green Version]
  34. Abdelhamid, K.; Rachid, I. Techno-economic optimization of hybrid photovoltaic/wind/diesel/battery generation in a stand-alone power system. Sol. Energy 2014, 103, 171–182. [Google Scholar]
  35. Heydari, A.; Askarzadeh, A. Optimization of a biomass-based photovoltaic power plant for an off-grid application subject to loss of power supply probability concept. Appl. Energy 2016, 165, 601–611. [Google Scholar] [CrossRef]
  36. Spyrou, I.D.; Anagnostopoulos, J.S. Design study of a stand-alone desalination system powered by renewable energy sources and a pumped storage unit. Desalination 2010, 257, 137–149. [Google Scholar] [CrossRef]
  37. Rousis, A.O.; Tzelepis, D.; Konstantelos, I.; Booth, C.; Strbac, G. Design of a Hybrid AC/DC Microgrid Using HOMER Pro: Case Study on an Islanded Residential Application. Inventions 2018, 3, 55. [Google Scholar] [CrossRef] [Green Version]
  38. Çetinbaş, İ.; Tamyürek, B.; Demirtaş, M. Design and analysis of a hybrid microgrid system using HOMER software: Eskisehir Osmangazi University example. Int. J. Renew. Energy Dev. 2019, 8, 65. [Google Scholar] [CrossRef] [Green Version]
  39. Garni, H.Z.A.; Awasthi, A.; Ramli, M.A.M. Optimal design and analysis of grid-connected photovoltaic under different tracking systems using HOMER. Energy Convers. Manag. 2018, 155, 42–57. [Google Scholar] [CrossRef]
  40. Halabi, L.M.; Mekhilef, S.; Olatomiwa, L.; Hazelton, J. Performance analysis of hybrid PV/diesel/battery system using HOMER: A case study Sabah, Malaysia. Energy Convers. Manag. 2017, 144, 322–339. [Google Scholar] [CrossRef]
  41. Hirsch, A.; Parag, Y.; Guerrero, J. Microgrids: A review of technologies, key drivers, and outstanding issues. Renew. Sustain. Energy Rev. 2018, 90, 402–411. [Google Scholar] [CrossRef]
  42. HOMER Pro 3.12. Available online: https://www.homerenergy.com/products/pro/docs/3.12/index.Html (accessed on 27 January 2022).
  43. Jatoi, A.R.; Samo, S.R.; Jakhrani, A.Q. Influence of Temperature on Electrical Characteristics of Different Photovoltaic Module Technologies. Int. J. Renew. Energy Dev. 2018, 7, 85–91. [Google Scholar] [CrossRef]
  44. Jinko Solar. Available online: https://www.jinkosolar.com/ftp/EN-Eagle+-275PP(Plus)-60_rev2015.pdf (accessed on 27 January 2022).
  45. Jordan, D.C.; Kurtz, S.R.; VanSant, K.; Newmiller, J. Compendium of photovoltaic degradation rates. Prog. Photovolt. Res. Appl. 2016, 24, 978–989. [Google Scholar] [CrossRef]
  46. Awan, M.M.A.; Awan, F.G. Improvement of maximum power point tracking perturb and observe algorithm for a standalone solar photovoltaic system. Mehran Univ. Res. J. Eng. Technol. 2017, 36, 501–510. [Google Scholar] [CrossRef] [Green Version]
  47. Afzal Awan, M.M.; Mahmood, T. A novel ten check maximum power point tracking algorithm for a standalone solar photovoltaic system. Electronics 2018, 7, 327. [Google Scholar] [CrossRef] [Green Version]
  48. Awan, M.M.A.; Mahmood, T. Optimization of maximum power point tracking flower pollination algorithm for a standalone solar photovoltaic system. Mehran Univ. Res. J. Eng. Technol. 2020, 39, 267–278. [Google Scholar] [CrossRef]
  49. Nasab, N.M.; Kilby, J.; Bakhtiaryfard, L. Case study of a hybrid wind and tidal turbines system with a microgrid for power supply to a remote off-grid community in New Zealand. Energies 2021, 14, 3638. [Google Scholar]
  50. Optimize the Value of Your Hybrid Power System—From Utility-Scale and Distributed Generation to Standalone Microgrids. Available online: https://www.homerenergy.com (accessed on 27 January 2022).
Figure 1. Flow chart of research methodology.
Energies 15 02141 g001
Figure 2. Metrological data of the site.
Energies 15 02141 g002
Figure 3. Average monthly temperature in Mirpur, Pakistan.
Energies 15 02141 g003
Figure 4. Microgrid structure with available resources at MUST site.
Energies 15 02141 g004
Figure 5. Proposed microgrid for the MUST site.
Energies 15 02141 g005
Figure 6. Peimar SG200M5 average output power in KW.
Energies 15 02141 g006
Figure 7. Monthly Li-ion charge and discharge power.
Energies 15 02141 g007
Figure 8. Monthly genset power output (KW).
Energies 15 02141 g008
Figure 9. Monthly avg. fuel consumption (L).
Energies 15 02141 g009
Figure 10. Monthly avg. inverter input and output (KW).
Energies 15 02141 g010
Figure 11. Site load profile for one year.
Energies 15 02141 g011
Figure 12. Daily load profile.
Energies 15 02141 g012
Figure 13. Monthly avg. total renewable power output (KW).
Energies 15 02141 g013
Table 1. Installed load of the selected site.
Ground Floor
Sr. NoD.B Light LoadQTYLoadTotal Load
01Fluorescent light with 01 tube60362160
02Fluorescent light with 02 tube2207215,840
03Ceiling light225204500
04Ceiling fan17010017,000
05Wardrobe bracket fan251002500
06Exhaust fan201002000
07Light plug 5A501507500
First Floor
01Fluorescent light with 01 tube2536900
02Fluorescent light with 02 tube1607211,520
03Ceiling light120202400
04Ceiling fan12010012,000
06Exhaust fan101001000
07Light plug 5A201503000
Total Load of Civil and Mechanical Department82,320 [W]
Table 2. Description of microgrid parameters.
Components of MicrogridParametersUnit CostUnit
GridPurchase Price0.22$/kWh
Sellback Price0.20$/kWh
Solar PhotovoltaicManufacturerPeimar lnc.
(Brescia, Italy)
Panel TypeFlat Plate
Rated Capacity200kW
Efficiency22.70%
Capital Cost316$/kW
Replacement Cost316$/kW
O&M10$/year
Lifetime30years
Diesel GeneratorManufacturer
Capital Cost40,000$
Replacement Cost40,000$
O&M2$/1op.hour
Fuel Price1$/L
Lifetime15,000hours
Battery BankManufacturer
TypeLi-lon
Nominal Capacity1kWh
Capital Cost101$/battery
Replacement Cost101$/battery
O&M0$/year
Initial State of charge100%
Minimum state of charge20%
Lifetime15years
Power ConverterManufacturer
Capital Cost300$/kW
Replacement Cost300$/kW
O&M0($/year)/year
Lifetime15years
Efficiency (inverter input)95%
Relative Capacity100%
Efficiency (rectifier input)95%
Table 3. Optimized design of microgrid proposed by HOMER.
CategoryPV (KW)Genset (KW)Battery (kWh)Grid (KW)Convertor (KW)Net Present Cost ($)Cost of Energy ($)Operating Cost ($/Year)Capital Cost ($)Renewable Fraction (%)
01395100262 138250,5460.0426719.11232,56899.0
02747 414 155343,5630.0584778.96324,089100
031218100 130691,5560.1189100464,06697.2
04 100 99,999 1.34 M0.22751,45850,0000
05 100100 62.12.14 M0.36583,00468,7380
Table 4. Cost status of the proposed optimum system.
ComponentCapital ($)Replacement ($)O&M ($)Fuel ($)Salvage ($)Total ($)
Diesel Generator$40,000.00$0.00$5100.00$21,679.46$33,200.00$33,579.46
Battery Bank$26,462.00$26,462.00$0.00$0.00$8820.67$44,103.33
Solar Photovoltaic$124,776.4$0.00$0.00$0.00$20,796.07$103,980.3
Power Converter$41,329.45$41,329.45$0.00$0.00$13,776.48$68,882.42
System$232,567.9$67,791.45$5100.00$21,679.46$76,593.23$250,545.5
Table 5. Energy production and consumption.
Production & ConsumptionComponentskWh/YearPercentage (%)
ProductionSolar Photovoltaic688,44699.7
Diesel Generator22990.333
Total690,745100
ConsumptionAC Primary Load235,305100
DC Primary Load00
Total235,305100
Table 6. Economic comparison of proposed five categories of microgrid.
MetricCategory 01Category 02Category 03Category 04Category 05
Present Worth ($)1,076,894983,877635,8840816,408
Annual Worth ($/year)43,07639,35525,435032,656
Return on Investment (%)22.513.96.00−117.7
Simple Payback (year)3.715.379.56n/an/a
Publisher’s Note: MDPI stays neutral with regard to jurisdictional claims in published maps and institutional affiliations.

