Article

Assessing the Siting Potential of Low-Carbon Energy Power Plants in the Yangtze River Delta: A GIS-Based Approach

1
Institute of Geography, Center for Earth System Research and Sustainability (CEN), University of Hamburg, 20146 Hamburg, Germany
2
School of Integrated Climate System Sciences, University of Hamburg, 20146 Hamburg, Germany
3
Department of Geography, Ludwig Maximilians University of Munich (LMU), 80333 Munich, Germany
4
Department of Environmental Science & Engineering, Fudan University, Shanghai 200437, China
*
Author to whom correspondence should be addressed.
Energies 2022, 15(6), 2167; https://doi.org/10.3390/en15062167
Submission received: 14 February 2022 / Revised: 6 March 2022 / Accepted: 11 March 2022 / Published: 16 March 2022
(This article belongs to the Section A: Sustainable Energy)

Abstract

:
China announced a target of achieving carbon neutrality by 2060. As one of the most promising pathways to minimize carbon emissions, the low-carbon electricity supply is of high consideration in China’s future energy planning. The main purpose of this study is to provide a comparative overview of the regional siting potential of various low-carbon power plants in the Yangtze River Delta of China. First, unsuitable zones for power plants are identified and excluded based on national regulations and landscape constraints. Second, we evaluate the spatial siting potential of the seven low-carbon energy power plants by ranking their suitability with geographic information system (GIS)-based hierarchical analysis (AHP). The results revealed that around 78% of the area is suitable for power plant siting. In summary, biomass power plants have high siting potential in over half of the spatial areas. Solar photovoltaic and waste-to-electricity are encouraged to establish in the long-term future. The maps visualize micro-scale spatial siting potential and can be coupled with the sustainability assessments of power plants to design an explicit guiding plan for future power plant allocation.

1. Introduction

In 2020, the low-carbon energy power development was promoted by the “Net-Zero” emission target, which was set by Europeans and three major Asian economies, including China, Japan, and Korea [1]. China has set a target to increase the share of non-fossil fuels and reach “carbon neutral” by the end of 2060 [2,3]. Since 1980, the Chinese economy has grown rapidly for over forty years [4]. One of the consequences of the rapid economic growth is the immediate increase in energy consumption [5,6,7]. In China, the abundant coal resources and limited oil and natural gas have resulted in a coal dominated (installed capacity of 1007 GW in 2018) energy structure, quadrupling since 2000 [8]. It contributed, largely, to carbon emission, and posed a significant challenge to the clean energy transition. In 2018, the carbon emissions resulting from the coal-fired power plants was 4.6 Gt (49.23% of China’s total) [9], which decreased to 1.4 Gt in 2020 [10]. To wean from the heavy reliance on coal, China has been undergoing a reform of power generation structure and seeking alternative clean energies [11]. Low-carbon power plays a vital role in effectively controlling carbon emission in the power generation system [12,13].
For the low-carbon power plants’ implementation, the spatial condition has been evidenced to be important by recent research and energy transition history of China. The spatial availability of energy resources, especially renewable energy, determines the operating hours and generation capacity of the power plant [14]. For instance, the geographic locations of crop residue supply areas are important for the bioenergy plant siting [15,16,17,18], since the intermediate feedstock transportation influences the supply security of bioenergy resources [19]. Second, to avoid electric curtailment, the siting location of power plants should also consider the local electricity supply–demand market or the accessibility of high voltage power transmission grid [20,21]. In the early stages of China’s energy transition, renewable energy plants with significant capacity were installed in the western and northern resource-rich regions [18]. However, the large amounts of electricity can neither be consumed by the local market nor efficiently transmitted to the economically developed eastern coastal regions due to the poorly constructed transmission grid. Until 2019, the power curtailment was reduced to 4% for wind power and 2% for solar power [13]. Third, the ecological and social environment around the power plant site also needs to be considered since the pollution and noise generated by the power plant can affect the surrounding environment [22,23,24]. Furthermore, specific political criteria should be, also, considered in some countries based on the localized political conditions, such as the political stability are important for the case studies in Egypt [24].
Based on these spatial conditions, previous researches evaluated the spatial energy resource potential [16,25] or identified preferable sites of power plants [17,20] by implementing the GIS-based AHP. The assembly of GIS and the analytic hierarchy process are mutually complementary to reveal deeper cognition of aggregated spatial data [16]. For instance, Derdouri et al. [26] considered the environmental, social, and economic conditions to evaluate the wind farm suitability in Japan using the GIS-based AHP weighted linear combination and ELECTRE-TRI. The methodology has been widely used in practice and gained significance for different electricity generation technologies, including bioenergy [17,27], municipal solid waste power [25], wind [28,29,30,31], solar [20,32,33], and hydro [34,35]. Although, these independent studies can demonstrate the optimal site or suitable sites for their particularly focused type of power plant over a spatial extent. They cannot rank the spatial suitability of various power plants within the same spatial cell and didn’t consider different land carrying capacities [36]. Clear instructions for comparing spatial siting potential of low-carbon power plants are missing but needed to optimize spatial energy planning.
Therefore, we develop a mapping tool to illustrate a potential power plant landscape across alternative low-carbon powers in high-resolution spatial cells in the Yangtze River Delta region. We first define suitable areas in the study region for power plant installation. Second, we evaluate the spatial suitability of the implementation for alternative low-carbon power plants through GIS-based AHP. To enable a comparison of the spatial suitability of different power plants, we propose a suitability index scheme for the selected siting evaluation criteria. Data of the selected theoretical, environmental, economic, and social criteria have been collected, scaled, and processed as the criteria maps calculated by the ArcGIS AHP function [37]. As a result, we obtain spatial siting potential maps of alternative power plants, which support decision-makers in better interpreting the complex problem of energy planning. This study represents a replicable example, which could be applied in other regions or in energy planning models, which contribute to future sustainable energy planning. The mapping tool can be valuable for energy planners and energy managers in government or private sectors.
The article is organized as follows: Section 2 introduces the overall research process and the relevant methodological details. Section 3, firstly, illustrates the suitable area for sting power plants, and second present the scaled suitability indices of different criteria. Finally, the results of the spatial siting potential of alternative low-carbon powers and the comparison of these spatial siting potentials are demonstrated. Section 4 discusses the research results by comparing them with previous literature. Finally, Section 5 concludes the remakes of this research and research outlook.

2. Materials and Methods
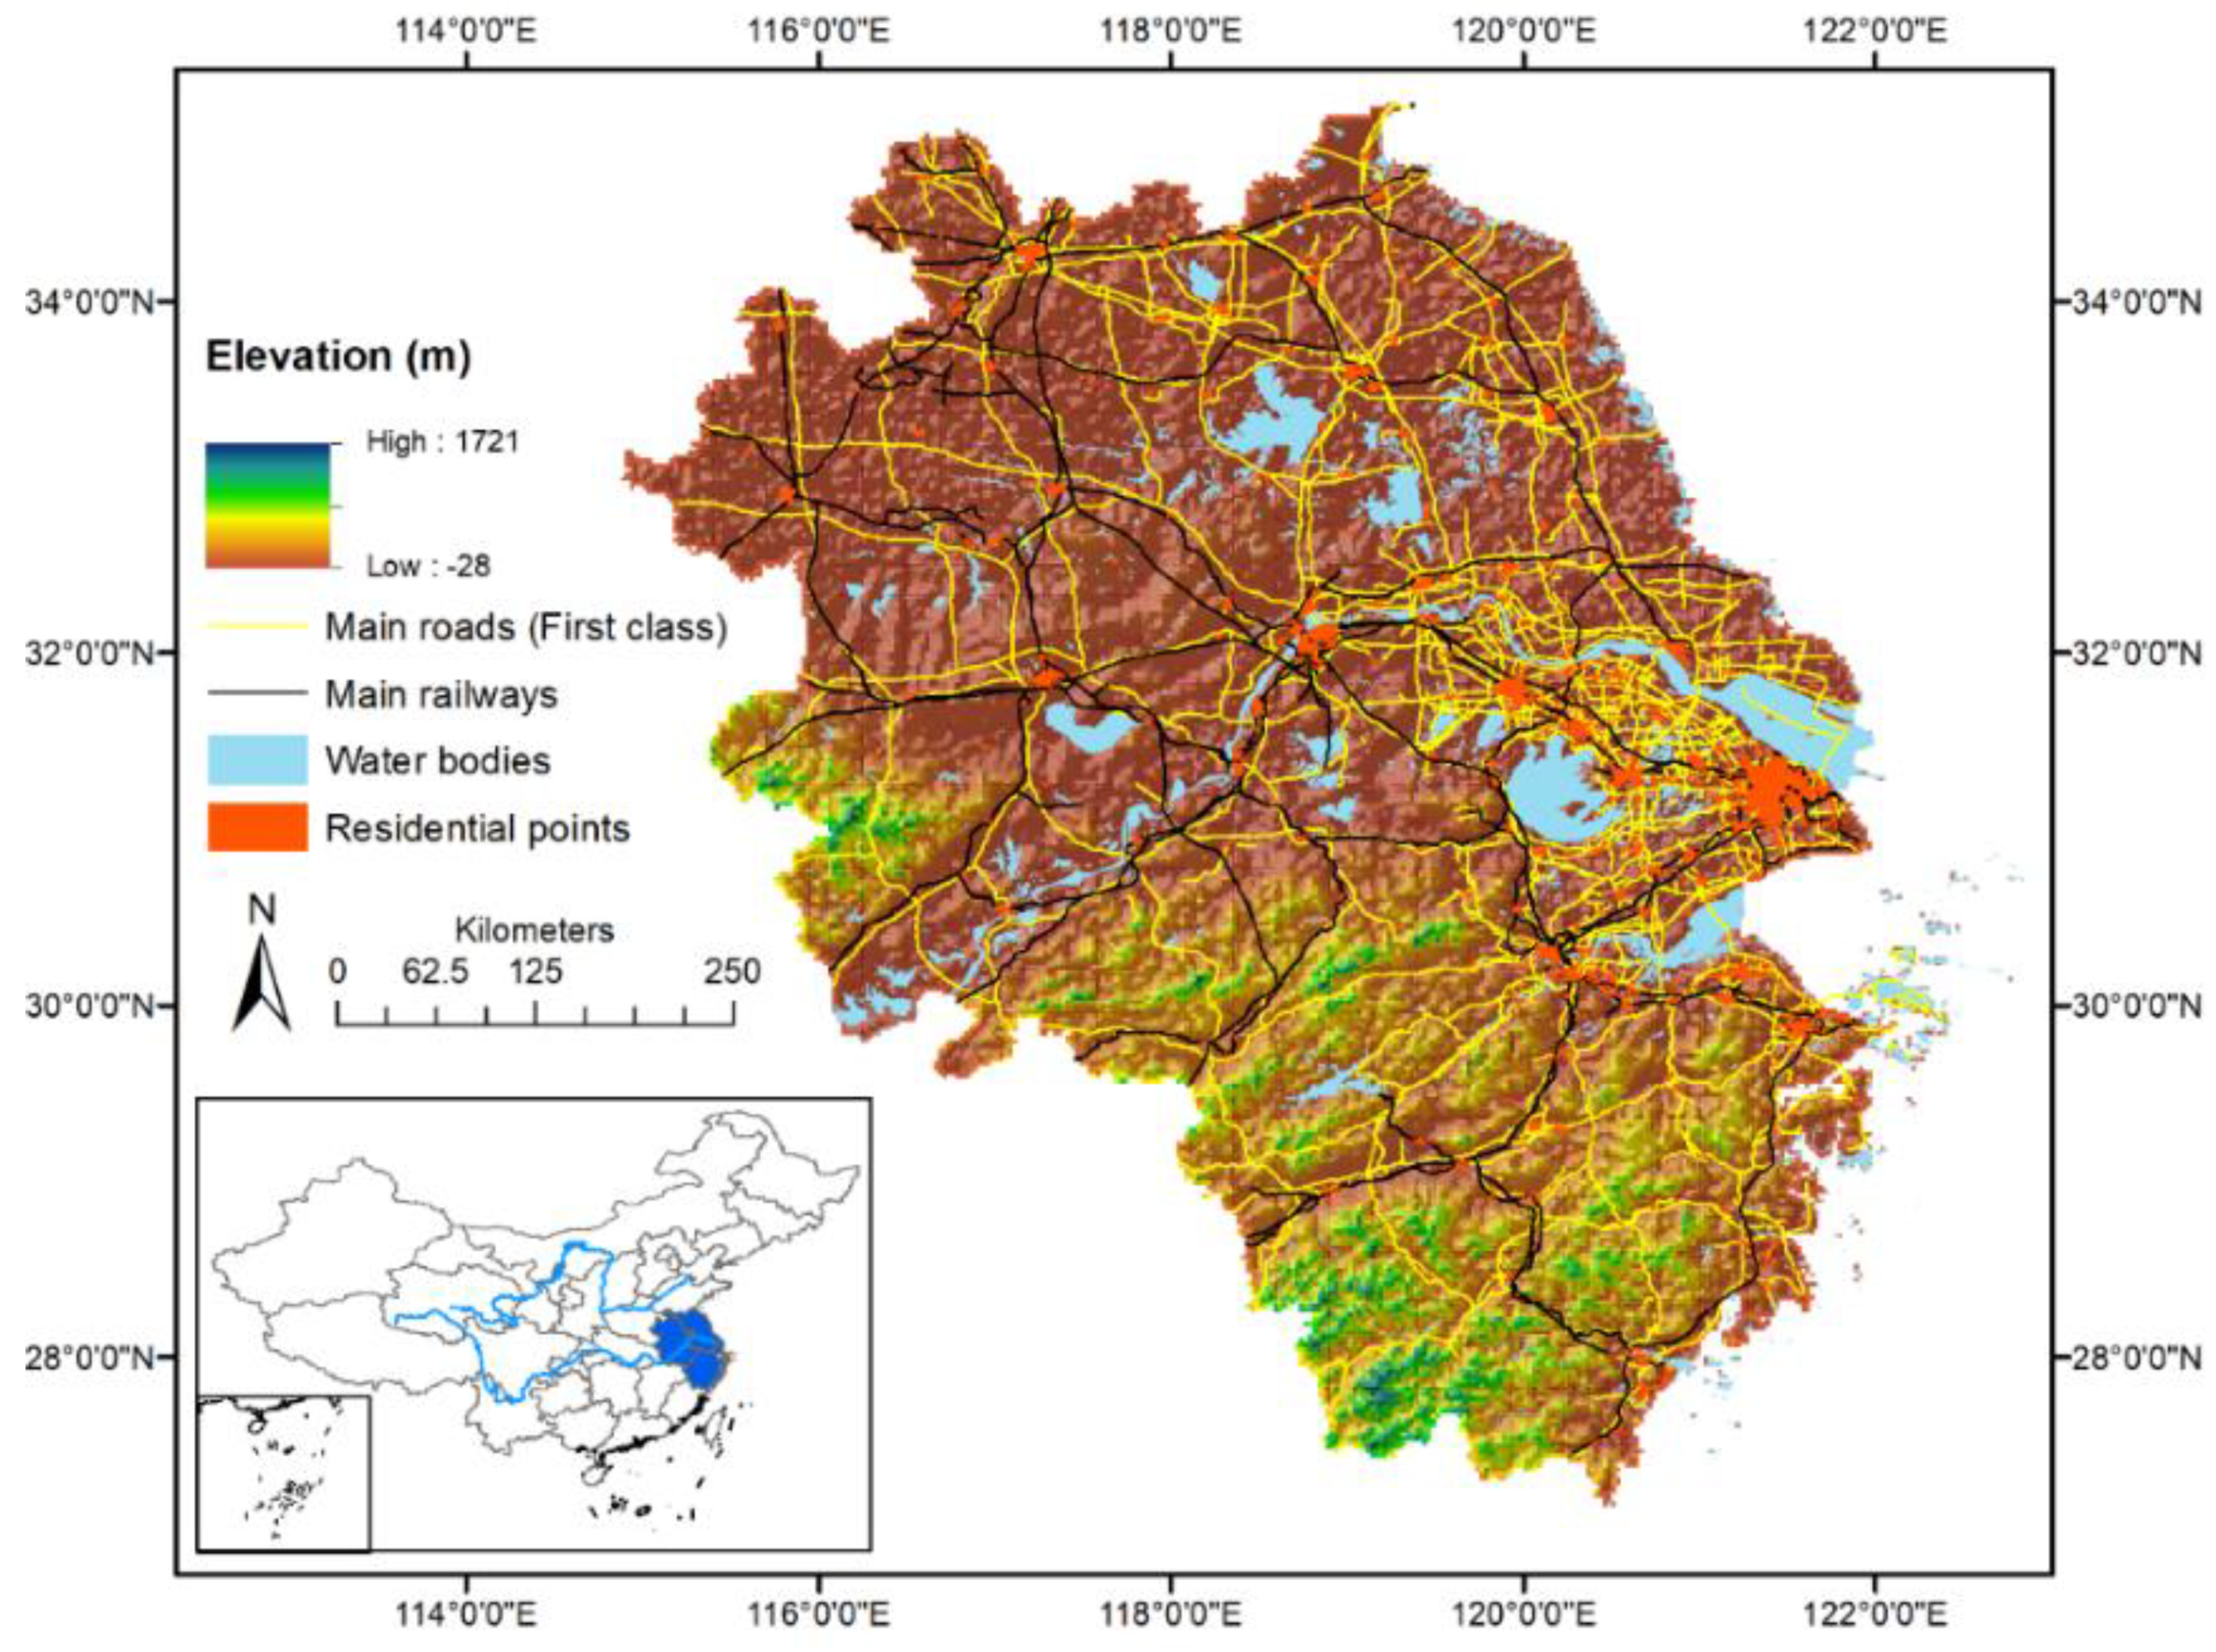
2.1. Study Area

In Figure 1, the Yangtze River Delta region (YRD) encompasses Shanghai, Jiangsu, Zhejiang, and Anhui (between 115–122° E and 27–35° N) and covers approximately 358 × 103 km2 [38]. In the YRD region, 16.65% of the national population contributed to 23.94% of China’s national gross domestic product (GDP) in 2019 (calculated from the GDP statistical data sources: [38,39,40,41]) in 3.69% of the national land area. YRD region consumed 20.53% of China’s total electricity production in 2019 (calculated from the electricity consumption statistical data sources: [38,39,40,41]), mainly supplied by local thermal power plants and electricity imported from the other regions. Furthermore, fossil fuel resources are also mostly imported in the YRD region. As the largest electricity consumer and importer, the YRD region faces the risk of electricity supply security. In 2020, the total power generation of the Yangtze River Delta region is 1226.8 GW, which accounts for 80.67% of the total electricity consumption. Of the total electricity generation, only 20.38% (250.06 GW) of the electricity is generated from non-fossil sources [42]. Under such a circumstance, renewable and nuclear power, which are not limited by regional resources, become a potential solution for improving the power generation capacity in the region to ensure energy supply security. The state council has developed integrated development goals of flexible power dispatching and low-carbon energy resource exploration for the overall region to promote electricity security in the medium or long term [43]. However, adequate feasibility visualized studies of spatial low-carbon energy are still necessary and scarce for energy planners.

2.2. Methodology

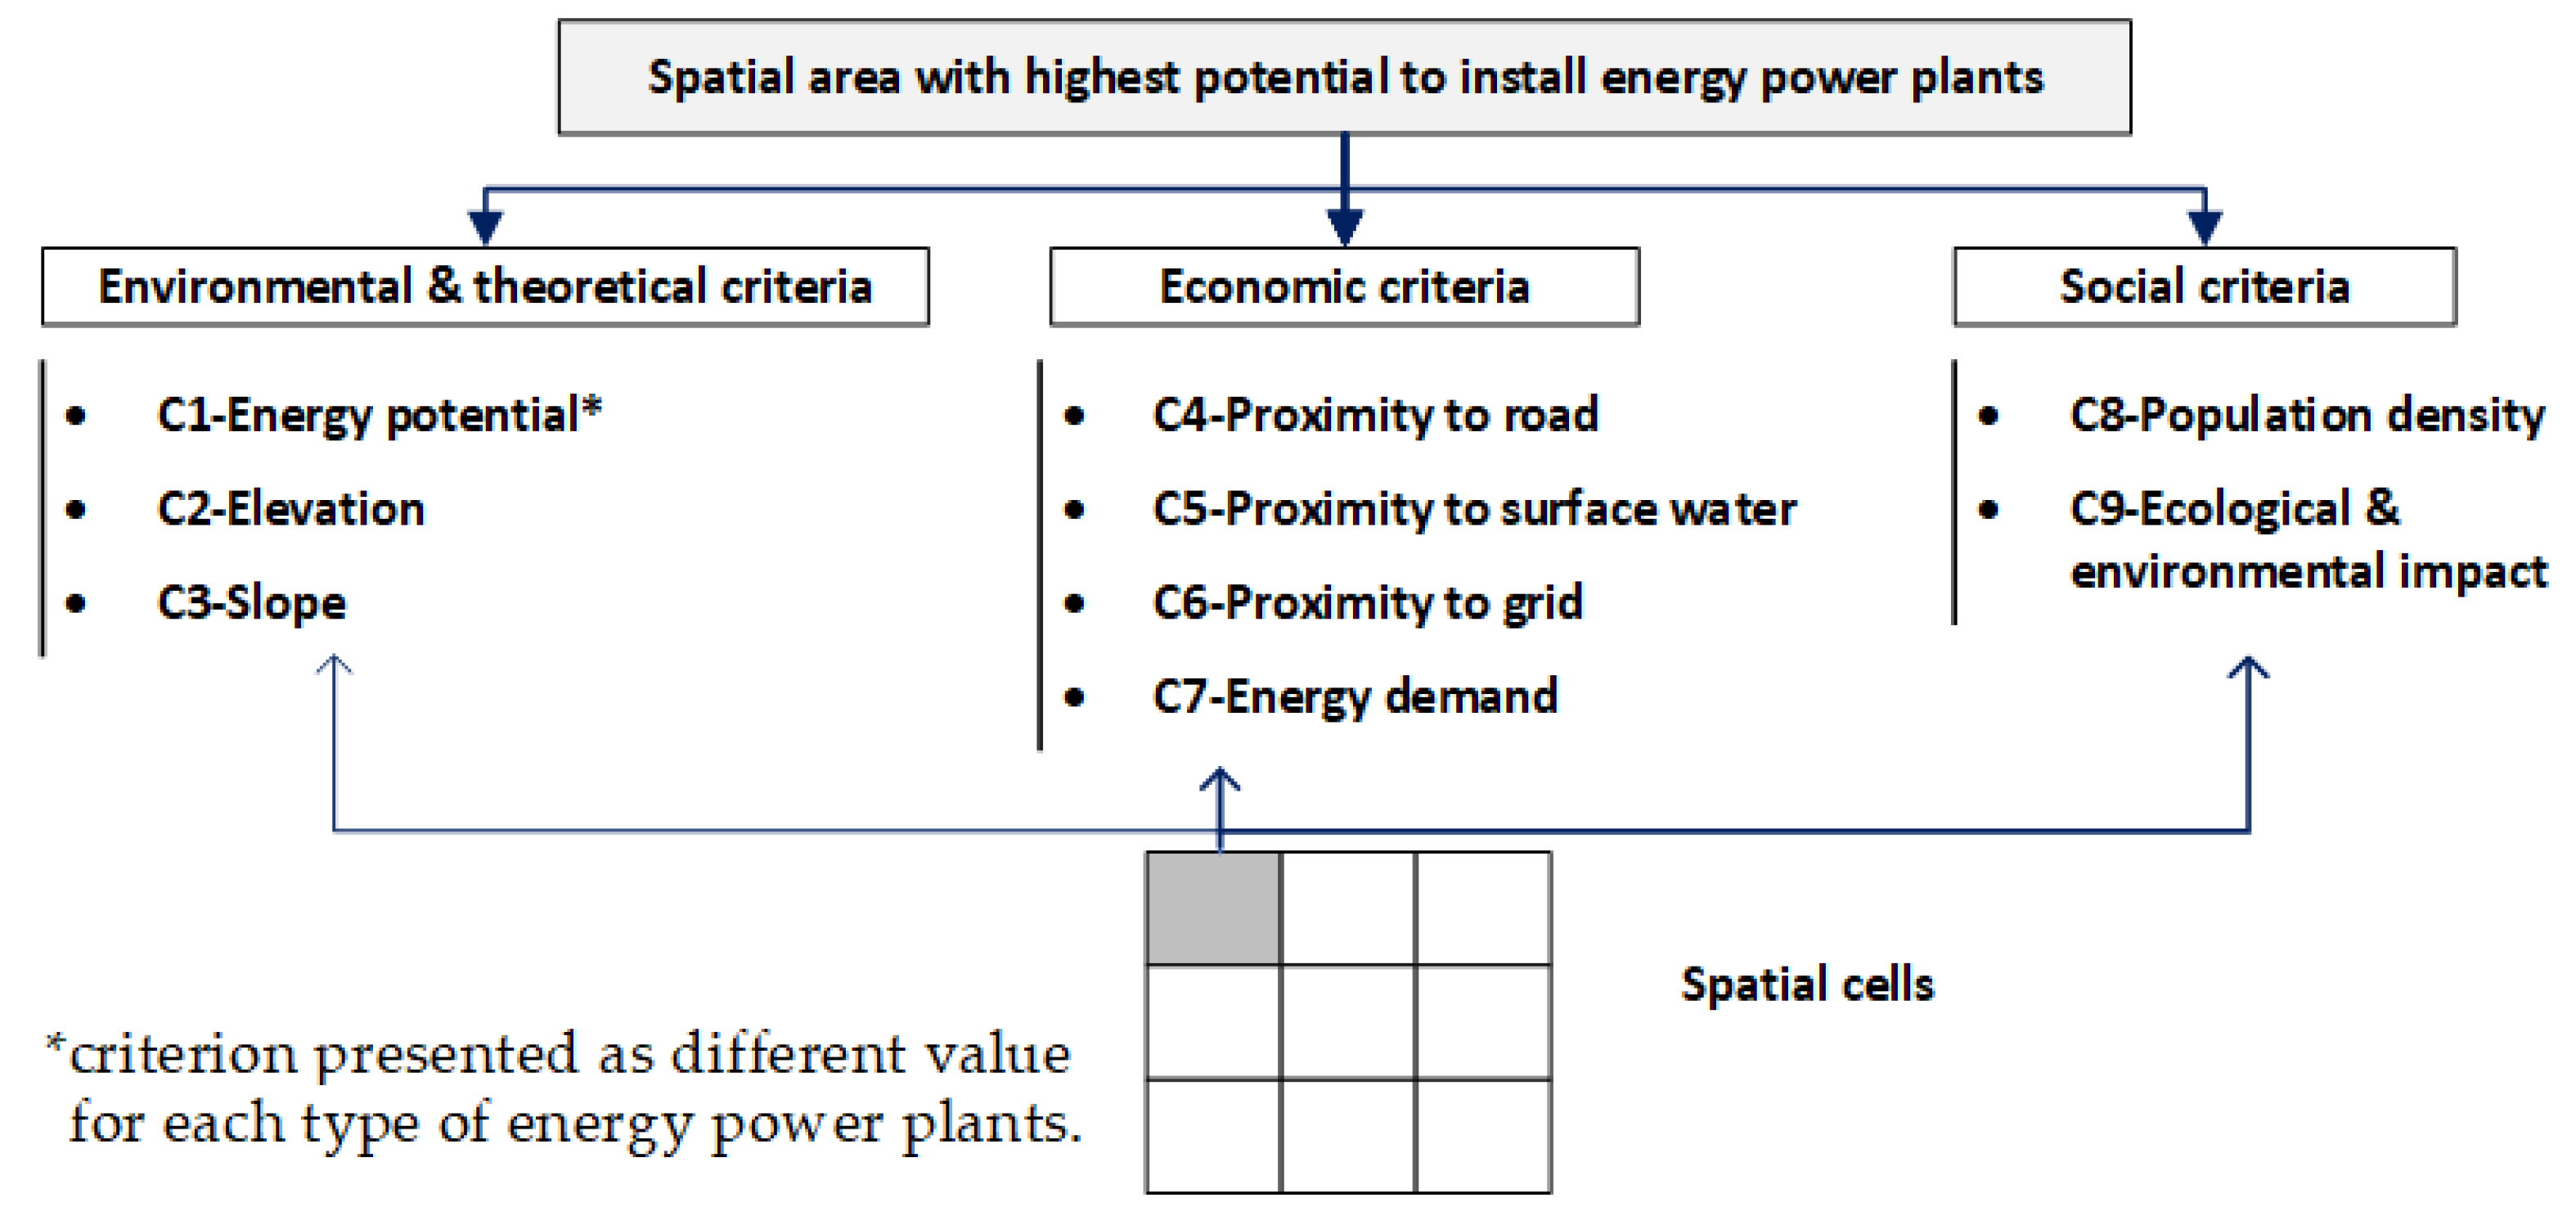
2.2.1. Methodology Framework

This paper selects seven types of low-carbon power plants as the research objects based on their developing potential in the Yangtze River Delta Region, including natural gas (NG) power, nuclear power, on-shore wind power, solar PV, pump-storage hydropower, biomass power, and waste-to-energy. We extend the approach of power plant suitable site selection for one specific power generation technology to a comparable spatial siting potential evaluation across alternative low-carbon power plants.
As shown in Figure 2, the study methodology is divided into two phases:
  • The first phase identifies the unsuitable zones through constraining rules formed by legal system provisions, technical difficulties, etc. We derive the suitable zones by eliminating these unsuitable areas.
  • The second phase evaluates the spatial siting potential of alternative power plants in the suitable zones proposed by the first phase. It applies the GIS-combined AHP method to determine the value and weight for evaluation criteria. The weighted sum value of the evaluation criteria is calculated to rank the spatial siting potential of alternative energy technologies.
Phase 1 is used to exclude unsuitable areas. However, suitable areas do not refer to the high potential areas of the power plant installation, but only the areas where implementation is allowed from a technical and legislative perspective. In comparison, even if the power plant siting potential is highly ranked by Phase 2 in the spatial cells, the insurmountable impediments created by the constraints (Phase 1) shut down the possibility to install power plants. Therefore, the combination of Phase 1 and 2 are necessary. Suitable areas from Phase 1 would join the spatial siting potential evaluation in Phase 2. The whole process would eventually lead to an overall siting potential evaluation for each type of low-carbon power plant in each spatial cell.

2.2.2. Identification of Suitable Zones

This phase identifies the suitable zone for energy power plant siting by eliminating unsuitable zones resulting from several constraining factors. The constraining factors shown in Table 1 derive from the existing legal and institutional regulations and the literature review concerning the impact of power plants on the natural and human environment and the technical difficulties in power plant siting. According to the listed constraints, each restrictive layer is generated by the “buffer” analyzing tool. The constraints could be illustrated through individual GIS map layers, and an aggregated suitable zone map is generated by “erasing” the unsuitable zone from the original study area.
The first constraining factor is resulted from the impact of power plants on the environment during the construction and operation period. In the parameter of distance to protected areas, the constraint comes down to the national legislation. Production and operation activities are prohibited in protected areas and limited in the peripheral area (300 m) of the protection zone [46]. Second, unsuitable zones are determined by land-use conflict. Most research excludes the urban area and its buffer zones between 1.5 km to 2 km [33,47,48]. In our study area, the city scale varied from smaller than 100 km2 to over 1000 km2 (Shanghai). The urbanization speed of these cities with different scales significantly correlated to per capita GDP and industrial level [49]. The cities with larger sizes and higher per capita GDP, thus, have the potential to expand more speedy than small cities. Thus, the constraining parameters of distance to the residential areas are differentiated with the city size from 500 m for small towns and rural areas (smaller than 100 km2) to 5 km for Shanghai megacity (over 1000 km2). Third, the potential visual and sound impacts of power plants could influence the surrounding infrastructures. Thus, it is necessary to consider such neighboring areas (<50 m) as limiting. In addition, the difficult access areas, including steep slopes larger than 30% and high elevations larger than 2000 m, are not suitable to install power plants from the technical and economic perspectives [26,33].

2.2.3. Evaluation Criteria and AHP

In the second phase, the power plant siting potential is evaluated by the most important criteria that affect power plant siting. Figure 3 presents the analytic hierarchy process of power plant siting potential evaluation in spatial cells. The nine sub-criteria are energy potential, slope, elevation, proximity to the road, proximity to high voltage grid, proximity to surface water, energy demand, population density, and ecological and environmental impact. In this research, a cell size of 0.025 × 0.025 degrees is used in the study area. Each spatial cell is evaluated by the selected criteria. An integrated grade, which represents the potential to accommodate alternative energy power plants, would be generated through an analytical hierarchy process.
Since the evaluation criteria are measured by different units or scales, it is necessary to transform these layers into comparable units. In this research, we propose a suitability index scheme (Table 2) to score the spatial area from 1 (low) to 10 (high) based on each evaluation criterion. This suitability degree index scheme is established through literature reviews by comparing the suitability of evaluation criteria from previous research. Table 2 shows the detailed scoring of each criterion.
C1-energy potential* presents the energy potential of each type of power plant. The scoring method differentiates between renewable and non-renewable energy. In particular, the environmental and theoretical criterion of energy potential is essential for renewable power plants. The suitable areas are graded based on renewable resources potentials, such as GHI for solar PV power plants and wind power density for wind power plants [23,30,50]. In addition, there are minimum thresholds (an index of zero) to establish renewable power plants. Previous literature stated that spatial areas with wind power density less than 150 W/m2, technically, has no potential (score 0) to install a wind power plant [51,52]. For solar PV, the minimal requirement is 1000 kWh/m2. Unlike renewables, the energy potential (C1) is rather complex depending on the aggregated influences of accessibility to fuel [53], the spatial location of previous power plants and others. The installed power plants have the highest potential to be extended. As an example, we defined the spatial areas within 5 km around the previous nuclear power plants as the most suitable areas with a suitability index of 10. In addition, nuclear power plants are necessary to be considered implemented in the 10 km buffer inland area of coastal, resulting from its requirement of the high cooling efficiency of seawater [54].
C2–elevation and C3–slope impact the spatial suitability of low-carbon power plants from both economic and technical aspects [37,55]. High latitudes and steep slopes lead to high transportation costs and create technical challenges for power plants’ installation [15,18]. Many reviewed scientific studies have identified different ranges of suitable elevation and slope values for different power plants [26,44,48,55,56]. In particular, Yousefi et al. [33] proposed a slope threshold value of 10° for solar power, and Ali et al. [16] proposed 15° for biomass power plants. This research uses the most applied ranges of suitable elevation and slope as a common standard. The lowest score of slopes is assigned to the area steeper than 17% (10°). Suitability scores increase with the stepwise decreased value of C2 and C3.
The proximity to roads (C4), surface water (C5), and ultra-high voltage grids (C6) closely relate to the costs of the construction and operating stage. Proximity to the transporting and transmission infrastructure could reduce costs and avoid electricity loss [29,57,58]. Therefore, the whole region is classified along with the distance to the road connections, ultra-high voltage grid (voltage ≥ 1000 kv), and surface water resources. The maximum threshold has been set for C4 (proximity to roads) by Yousefi et al. [33] and Ali et al. [16]. They considered the area without road connections in the 10 km surrounding area as the lowest suitable area. We applied this threshold in this research, and assigned the area with an index of 1. Similar thresholds “10 km” were also applied for criterion C6 (proximity to ultra-high voltage grids) in many previous studies [29,33]. Therefore, the areas beyond 10 km from the ultra-high voltage grids were assigned with the lowest index of 1.
In addition, the other economic criterion is energy demand (C7). Panagiotidou et al. [48] state that “the proximity of production and consumption could reduce energy losses caused by the electricity distribution”. Thus, it is valuable to consider the electricity demand of local markets [59,60]. Power plants are suggested to be located as closely as possible to areas with high energy demand to minimize electricity losses during transmission [26]. The highest score of C7 is assigned to the triangle-shaped megalopolis led by Shanghai, with an annual energy demand value larger than 7500 MWh/km2.
Unlike the economic criteria, social criteria (C8—population density and C9—ecological and environmental impact), negatively affect the spatial subtility [23,48,57,58,61]. Power plant siting will cause pertinent inferences (emissions, pollutions, and visual and sound impacts) on nearby areas during the construction and operation stages [62,63]. Derdouri and Murayama [26] suggested establishing new power plants away from the populated and natural protected area to avoid conflict with residents and guarantee natural conservations [57]. The most populated areas with a population density larger than 3000/km2, such as Shanghai, are probably unsuitable for power plants (Score 1). The area around the protected area with a distance greater than 5 km has a high score of 9.
The relative importance of criteria is determined through literature reviews. Then, according to the pairwise relative importance of criteria for each type of power plant, the comparison matrixes are generated for each type of clean power plant. The resulting weights of criteria for each type of power plant are shown in Table 3.
Table 3 shows that C1 is more important for renewable and nuclear power plants. This is due to the heavy reliance on spatial energy resources of renewable powers. For nuclear power, we include the distance to costal as an important indicator of energy potential. Thus, the nuclear power siting is also highly reliant on C1—energy potential. Unlike renewable power plants, which are more sustainable and play an important role in the future energy transition, the NG power plant is less sustainable but more secure in electricity supply. Therefore, the weight of energy demand (C7) and social indicators (C8 and C9) of NG power plant is higher than other indicators.

2.2.4. GIS Dataset Acquisition and Processing

According to the AHP framework, we present the evaluation criteria as GIS maps. The initial data sources for map layer preparation include the 1:1,000,000 scale geographic information map, remote sensing land use map, topographic radar map, renewable energy resources map, location map of existing power plants, open street map, and annual statistical data (Table 4). To be more specific, the initial data resources are projected, re-sampled, and spatially analyzed to be in the same format with the same extent and cell sizes to present the criteria.
We further scale the criteria map layers with continuous or discontinuous data based on the suitability degree index. Based on the proposed suitability degree index scheme, each criterion’s values are classified into several ranges by using a “multi-buffer” or “reclassify” function of ArcGIS. For instance, we use the multi-buffer function to grade the spatial potential according to the radial distances from the main roads, surface water, and high-voltage electricity grids (C4–C6).
By adding up these graded multiple evaluation map layers according to their weight through the AHP function of ArcGIS, we obtain the spatial siting potential of different low-carbon powers.

3. Results

3.1. Map of Suitable Zone

As Section 2.2.1 described, the unsuitable zone for power plants siting should be excluded in phase 1. Figure 4 shows the unsuitable area due to each constraint and the rest areas, which are suitable for the establishment of power plants.
Only three constraints (environmental, land use, and infrastructure constraints) have resulted in unsuitable areas in the study area. The Yangtze River Delta region, located in the middle and lower Yangtze Valley Plain, has the highest spatial cell of 1721 m and the steepest cell of 17.93%. Thus, no area is excluded due to geographical constraints. The other three constraining maps (Figure 4a–c) define the areas where power plant siting is legally, technically, or environmentally prohibited. The unsuitable areas are resulted by environmental constrains (Figure 4a), land use constraints (Figure 4b) and infrastructure constraints (Figure 4c). By eliminating the three overlying unsuitable zone in the study region, Figure 4d results the rest unsuitable zones. The unsuitable area for power plants siting is calculated through the “zonal geometry” function of GIS. As a result, 21.78% of the whole region is defined as unsuitable areas, and the rest 78.22% areas are suitable. A large area of Shanghai is excluded because it is a mixed area of the mouth of the Yangtze River and the highly populated megacity of Shanghai.

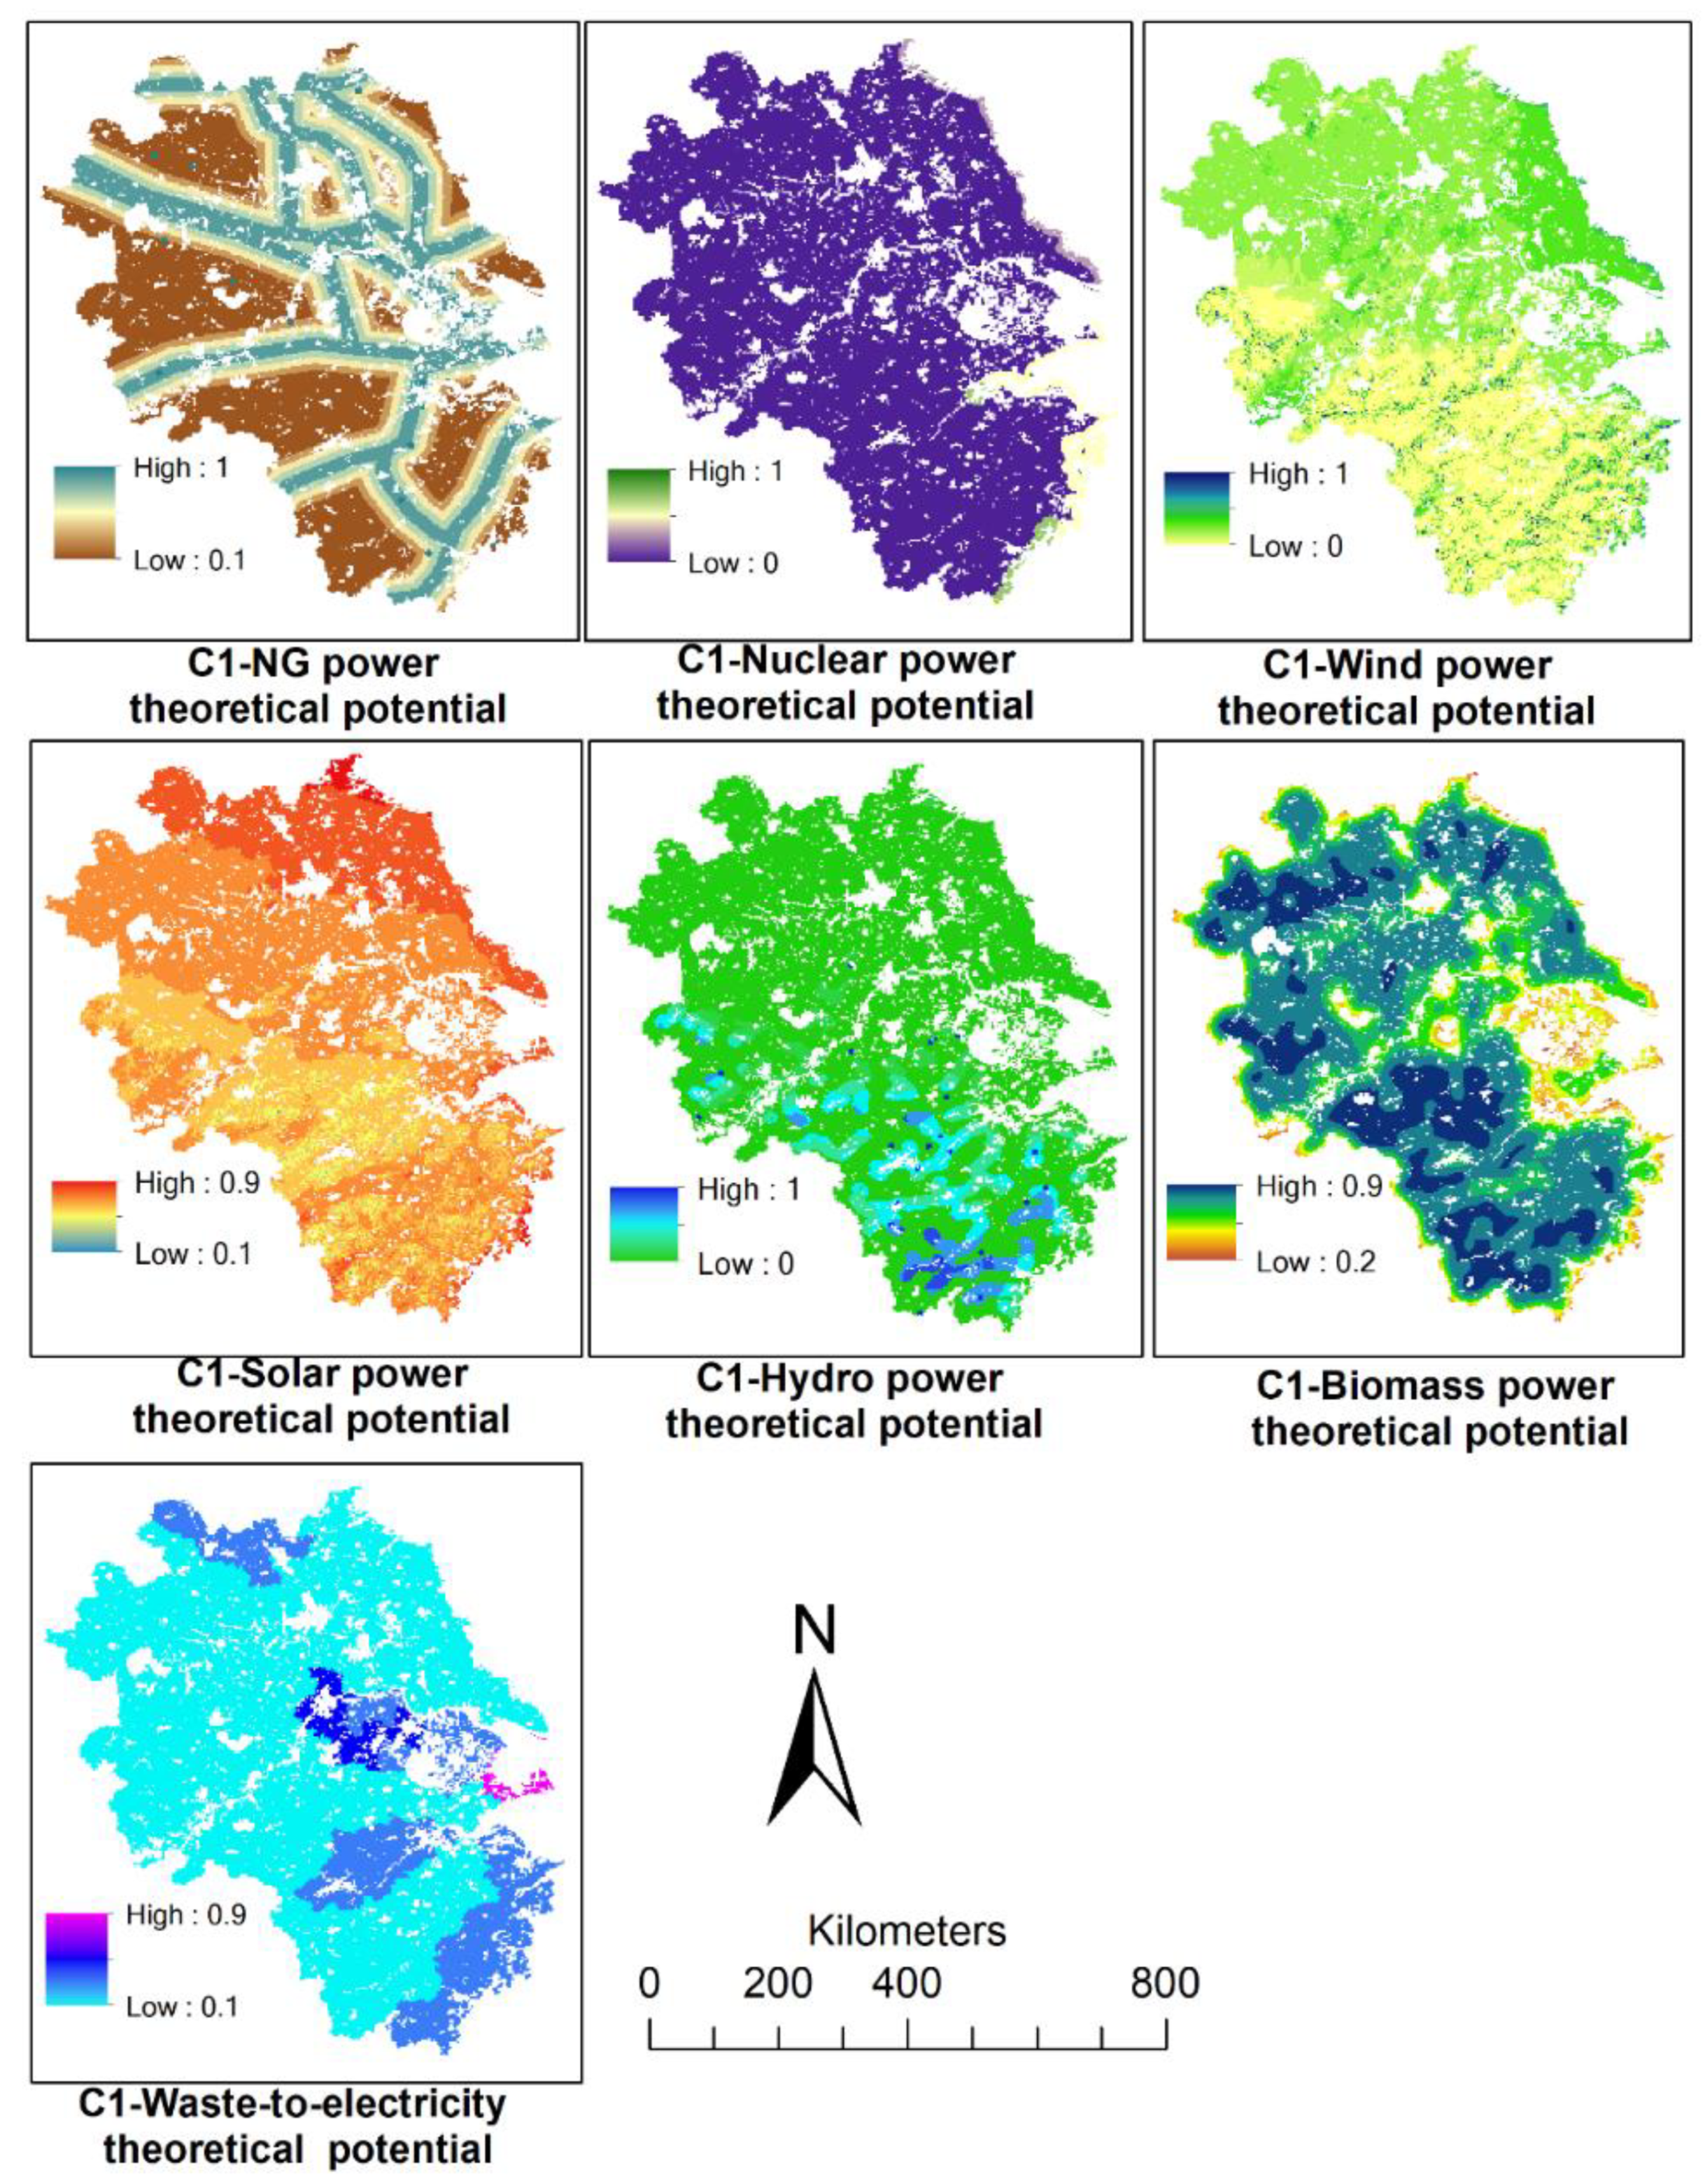
3.2. Map of AHP Evaluation Criteria

To obtain the normalized AHP spatial siting potential map of alternative power plants, we first create spatial theoretical energy potential (C1) maps (Figure 5) for alternative power plants. Second, the spatial suitability maps for the other evaluation criteria (C2–C9) (Figure 6) are created according to the suitability index in Table 3.
Figure 5 presents the result of spatial theoretical energy potential (C1) for each type of low-carbon energy power. The first map of NG power theoretical potential shows that areas with highly suitable indexes (>0.8) are concentrated near the NG pipeline. This is due to the fact that this area could better assess the imported NG resources from other regions or other countries. In the second map, the theoretical energy potential of nuclear power highly depends on the distance from the sea. Only the coastal area has theoretical potential to establish nuclear power plants. The south coastal region has a higher potential than the north coastal region due to the higher accessibility to uranium resources, which is essential for nuclear power plants. The third map of wind power theoretical potential shows that the overall region has low wind power potential. Most of the areas are assigned with a suitable index lower than 0.4 (wind density < 300 W/m2), and the suitability index decreases from northeastern to southwestern areas. The northeast coastal area of the YRD region has the highest wind power theoretical potential because it is close to the sea with high stable wind speed and regular wind direction changes [74]. Similar to the wind power theoretical potential, the solar power theoretical potential also decreases from northeastern to southwestern areas. Nevertheless, solar energy resources are richer than wind power resources. Most areas in the solar energy potential map are assigned with a suitable index higher than 0.6, presenting the annual GHI larger than 1250 kWh/m2. The fifth map of hydropower potential shows that only a small riverside area in the south with a significant elevation drop has a highly suitable index (>0.8). The sufficient river discharge from the perennial river and significant natural elevation drop in these areas provides geographical benefits for establishing hydropower plants [75,76]. The rest area with flat terrain has a very low theoretical potential for hydro powers. In the biomass power potential map, it is easy to find that biomass resources are abundant in the overall study area, which could easily satisfy the feed-in stock of biomass resources for biomass plants [16,17]. Most of the area has been ranked over 0.8, which is highly suitable for biomass plants. However, in China, the high crops demand has limited the development of biomass powers. In the last WtE theoretical potential map, results rely highly on the spatial distribution of house refuse density. Although the metropolitan and large cities, such as Shanghai and Hangzhou, have been eliminated as unsuitable areas, the areas surrounding these cities have a higher potential for establishing WtE sites. This is due to the high population density and the high production of domestic waste in the areas surrounding large cities. Conversely, in counties and small cities, the population density is much lower, and the generated domestic waste is only sufficient for a few WtE plants. Therefore, the theoretical potential of waste-to-energy plants is very low in these areas.
Unlike C1, determined mainly by different conjunct factors, criteria C2 to C9 only depend on the individual criterion as it is named. Figure 6 shows the resulting map of C2 to C9. From the map, we can easily find that the high suitability indexes of C2 and C3 exist in the flat area of the northeast of the YRD region. It results from the geographic characteristic of the northeast of the YRD region, which locates in the middle and lower Yangtze natural alluvial plain. The region is low and flat, so the values of elevation and slope are low, indicating high suitability for power plant siting [25,55]. However, the southwest of the YRD region is covered by hilly areas, which is less suitable for power plant implementation. Except the geographic advantage, the east region is also highly urbanized [77], including Shanghai, Suzhou, and Hangzhou, and has a well-developed transportation system and power transmission grids. Therefore, in the map of C4 and C6, east areas are most suitable to implement power plants. To be more specific, most areas of the YRD region are close to the roads, except some hilly areas in the south. By the same token, the north and west are more urbanized and more economically developed with higher population and energy demand [78]. For criteria, C7 and C8, north and east areas have a higher suitability index than the south and west areas. In the map of C5 and C9, most of the areas are assigned with high suitability indexes. The research area with Yangtze River and Tai Lake is rich in water resources [78,79]. There are also high-density tributaries, which distribute water to the whole region. Thus, it is easy to access surface water in the overall region. As for C9, only the impacts on the nearby areas of protected regions are considered, so that most of the areas in the region have a high value.

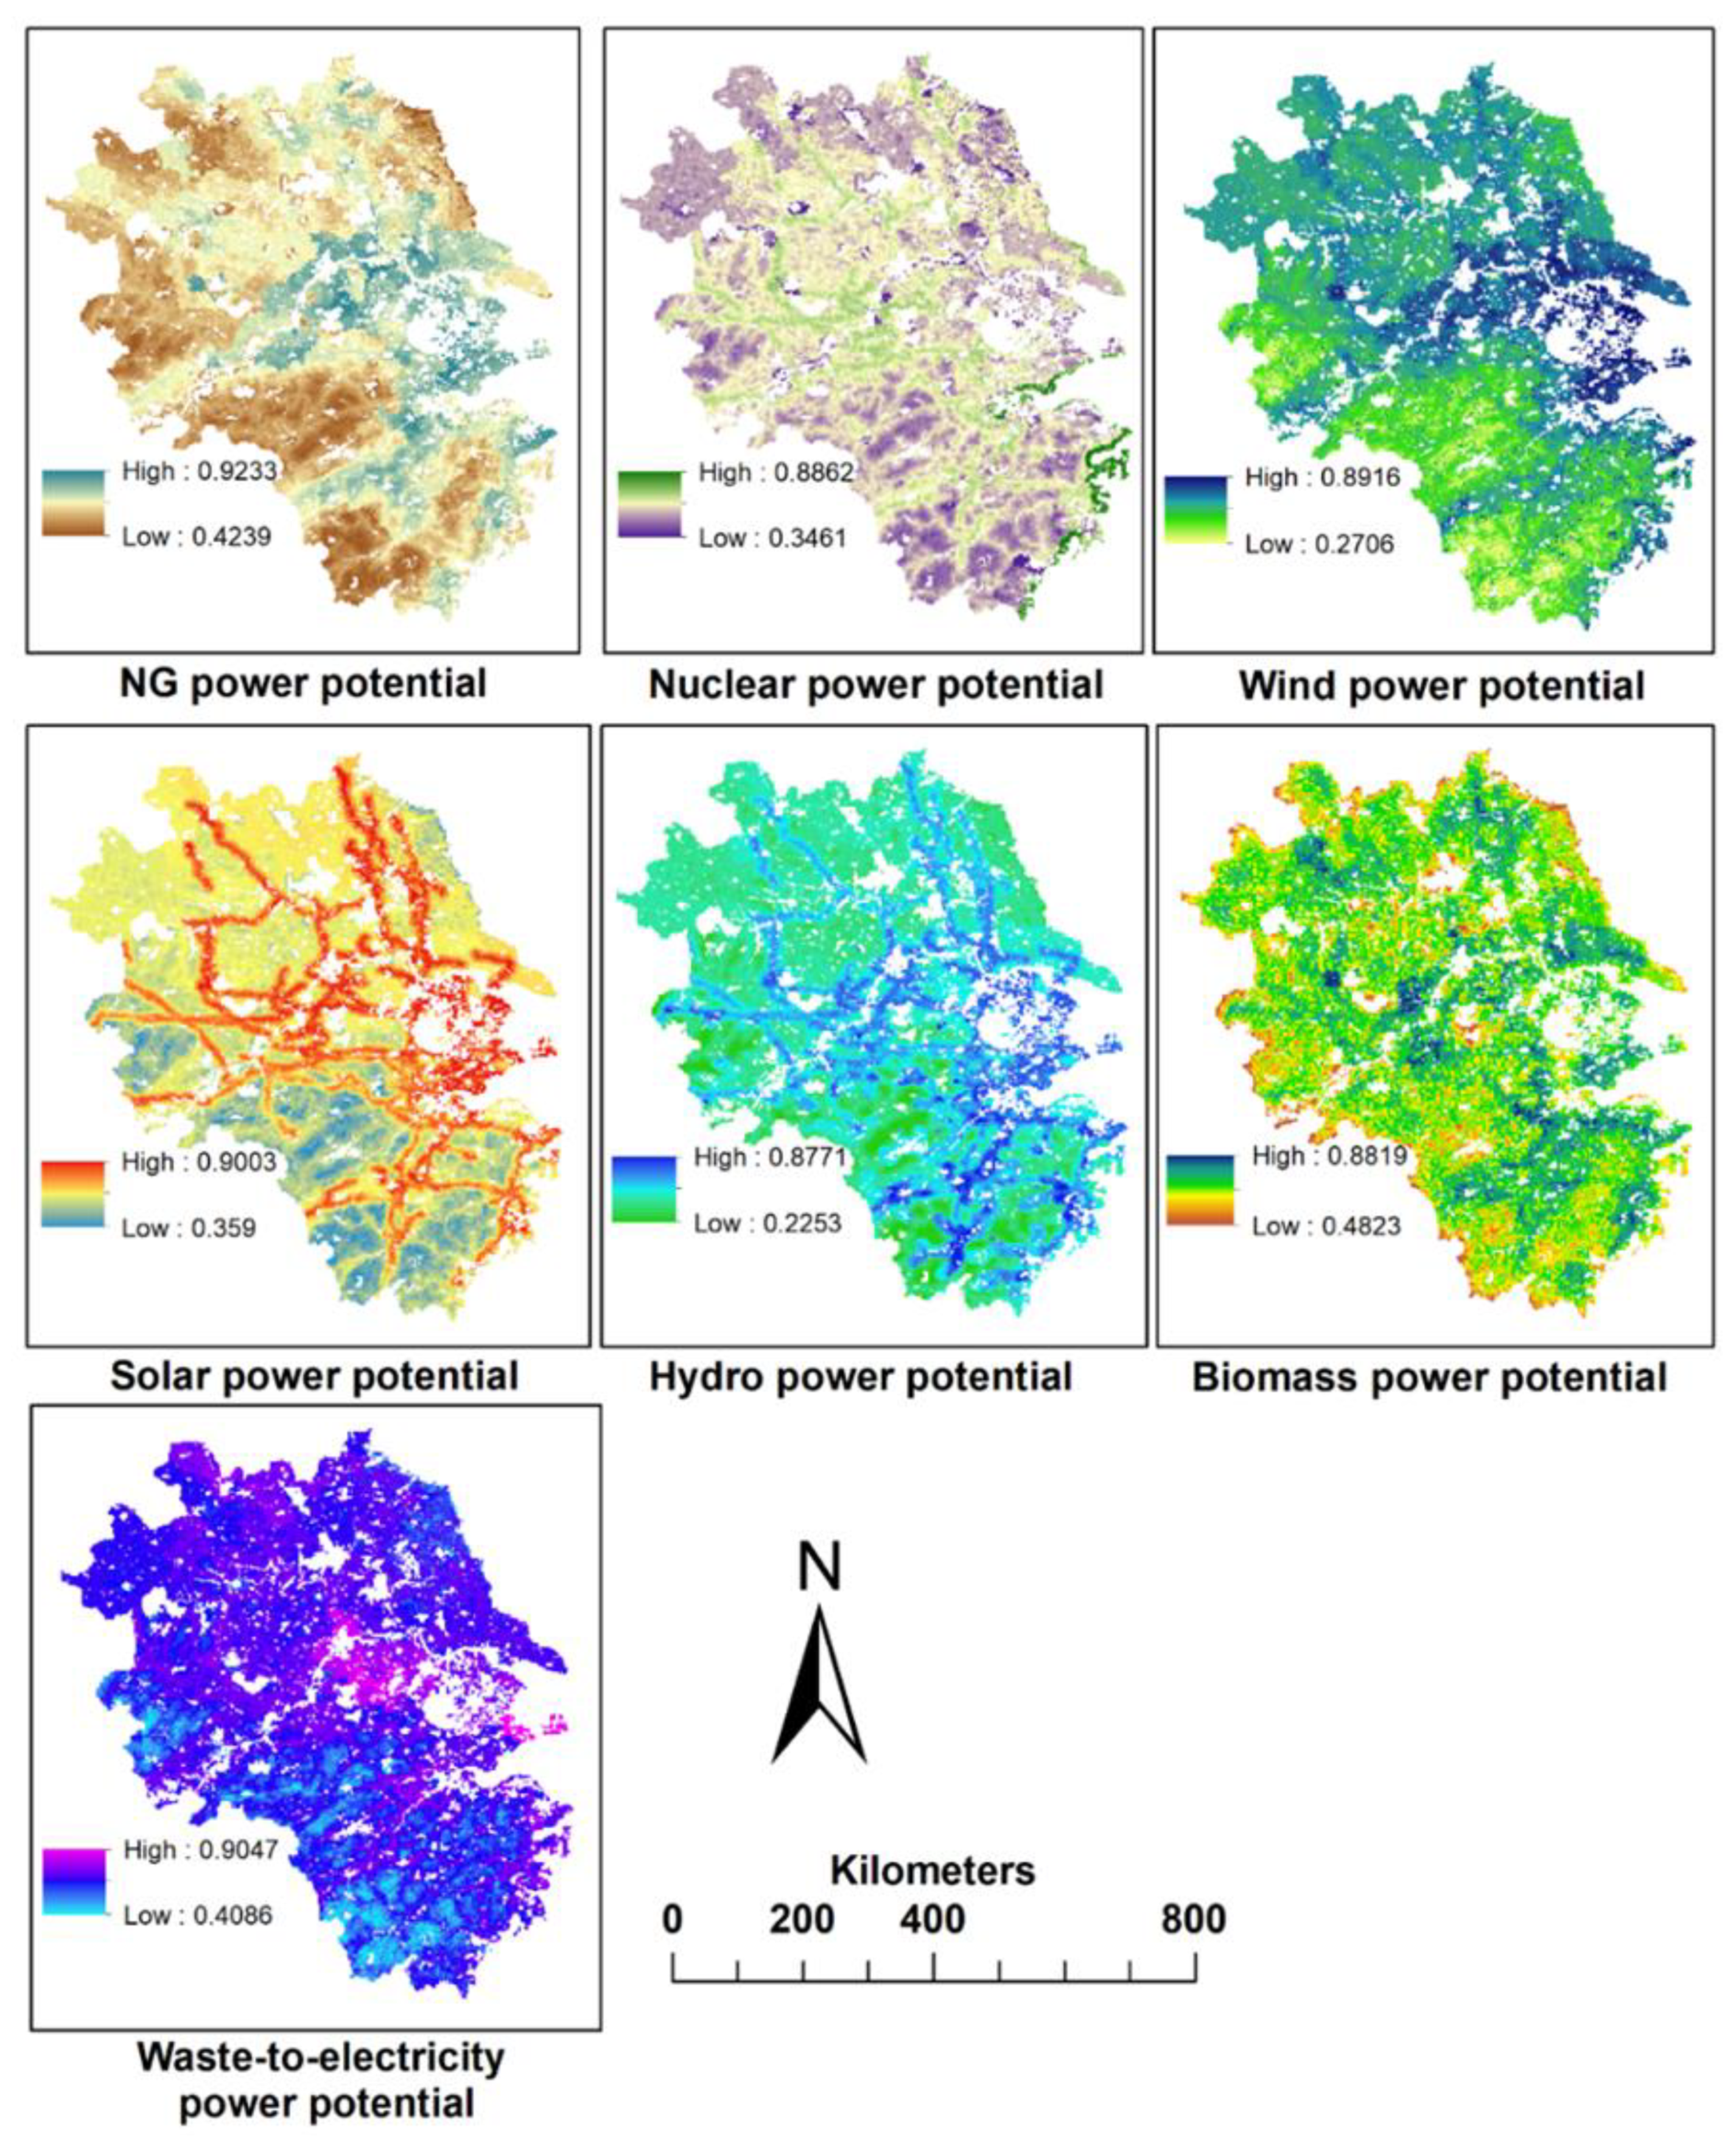
3.3. Map of Spatial Power Plant Siting Potential

The aggregated spatial siting potential maps from evaluation criteria C1–C9 of alternative power plants are shown in Figure 7. The map shows that areas with higher siting potential of different low-carbon powers are distributed very differently in the study area. This is due to the different spatial theoretical energy potential and different weight matrices of evaluation criteria for each type of power plant. Regarding the different weighting matric of alternative power plants, the spatial siting potential of power plants is rated differently from low to high (0–1). The areas with high siting potential of NG power plants are concentrated in the east because of the well-developed pipeline (C1) and high electricity demand (C7). The theoretical energy potential (C1) is also crucial for renewable and nuclear power plants. Therefore, the highest potential siting value for nuclear power is seen in the southern coastal area; the high potential value of wind power plant siting is seen in the northeastern area with rich wind resources; the high potential value of WtE power plant siting is seen in the nearby area of urban agglomeration. In addition, renewable power plants have higher siting potential in areas with a high suitability index of proximity to grids (C6), especially solar and hydropower plants. It is because renewable energy requires a transmission grid to minimize the financial cost of electricity storage devices.
The resulting spatial siting potential map shows the rated spatial siting potential scores of alternative power plants in each cell. The siting potentials of different low-carbon power plants can be compared in each spatial cell. Since the number of cells is very large, we select one random cell as an example in Figure 8, which shows the varied siting suitability of alternative power plants in one cell. The same cell is highly suitable for NG and WtE power plants but less suitable for pumped-storage hydropower and nuclear power plants. It could explicitly guide the decision makers’ choice of power plants in each spatial cell.

3.4. Comparison of Spatial Siting Potential of Alternative Power Plants

To compare the spatial siting potential of different power plants, the “zonal geometry” function of ArcGIS has been used to calculate the spatial area of different potential scales for each type of power plant. Table 5 shows the percentage of the area in each potential scale out of the suitable area for alternative power plants.
For hydro, nuclear, and wind power plants, more than 90% of the suitable area is assigned with low to medium potential, resulting from the low theoretical potential. The low theoretical potential of hydropower results from the non-significant elevation drops. Without significant elevation drops, the gravitational potential energy of the water discharge is less, which cannot be adequately converted into electrical energy [75]. The nuclear and theoretical wind potentials are, respectively, limited by the seawater accessibility and the annual wind power density in 100 m above the ground. In contrast, for NG, solar, biomass, and WtE powers, more than 30% of the suitable area is considered as high potential areas. For solar, biomass, and WtE powers, there is a stretch of areas with high theoretical energy potential in addition to high spatial siting potential. However, NG and biomass are not encouraged in the long-term future due to the characteristics of their fuel resources. In particular, 62.476% of the suitable areas are considered as a high potential area for biomass power plants. However, the conflicts between the food supply and biomass resources of power plants could limit the developing potential of biomass power plants (Shu et al., 2017). To achieve “carbon neutrality” by the end of 2060, the NG power can only serve as a short-term electricity transition path to secure electricity supply, but not in the long-term because the NG power is not a “zero-carbon” choice.
In summary, the NG, solar, biomass power and WtE power plants are ranked with high potential to be populated installed in a large area of the study region by only considering the spatial theoretical potential and suitability. From the long-term perspective, solar and WtE power plants are more encouraged to be established for future energy planning.

4. Discussion

China is currently facing the challenge of achieving carbon neutrality by the end of 2060 [2]. The country has managed to disengage itself from the coal-reliant electricity generation system [80,81]. However, with the rapid increase of renewable power capacity, the country has experienced many problems associated with transmissions and electricity supply. The YRD region is an economically advanced region of China [77], which has high energy intensity and historically relies on input electricity from the other areas of China [82]. To satisfy the energy demand, flexibly modulate peak loads of the electricity supply, and minimize the electricity loss during the transmission, complementary electricity generation mixed plans should be developed in the YRD region. To that end, comparing the spatial siting potential of alternative low-carbon power plants is essential in energy planning [83].
This research contributes to the comparison of spatial siting potential evaluation across different low-carbon powers by proposing a suitability index scheme for evaluation criteria based on the GIS-based analytic hierarchy process. This design complements previous research on power plant sites selection [17,29,31,33] by transforming incompatibility datasets into comparable scaled values according to the suitability index, which is gathered from a literature review. It allowed the spatial siting potential of different low-carbon power generation technologies to be comparable.
The case study in the Yangtze River Delta region shows that solar PV, biomass, WTE, and NG power are assigned with high siting potential (>0.8) in more spatial areas compared to other low-carbon power generation technologies. The great spatial siting potential of solar power in the YRD region has also been approved by Odhiambo et al. [55]. For biomass, WTE, and NG power, the theoretical energy potential is the most important criterion of siting potential. The geographical, climatic, and economic conditions support an adequate supply of fuel resources for these three energy technologies. However, the Chinese food shortage could limit the development of biomass power plants [84]. Therefore, the spatial siting potential of low-carbon powers is not the only factor that should be considered in energy planning. Furthermore, in most areas of the Yangtze River Delta region, the siting potential for wind, nuclear, and hydro powers is in the medium range (0.4–0.7). Although wind resources are also plentiful in the YRD region [74], the theoretical potential of wind is relatively lower compared to solar resources, according to the suitability index proposed in Table 3. Nuclear and hydropower siting potentials are limited by geographic reasons (distance to coastal and elevation drops) in a vast area.
Our results are promising, and the proposed suitability index scheme of siting potential evaluation criteria could be applied in the spatial siting comparison research in city-level or regional-level spatial areas. The ranked low-carbon power generation technologies in each spatial cell could sufficiently support decision-makers for energy planning.

5. Conclusions

This research develops a power plant siting potential mapping tool to compare the spatial siting potential of alternative low-carbon power plants in each spatial cell of the Yangtze River Delta region. The research supports us in taking steps further in the comparison of power plant spatial suitability and providing decision-makers with more applicable information for energy planning. Indeed, the previous research of individual energy technology is inadequate to show the suitability ranking of different technologies within a spatial cell. In this research, we first identified a suitable area of 381,613.95 km2 for power plant siting. Second, we ranked the suitability of different power plants in each spatial cell of the study region. Distributed solar PV and WtE plants should be encouraged to be established. This study represents a replicable example, which could be applied to regional-level or city-level spatial areas and contribute to future energy planning.
This research will be expanded into an energy landscape model to investigate the optimal spatial energy planning strategy for future sustainable energy development. Other factors should also be considered, including the environmental impact of power plants, the economic benefit of power plants, the conflict of renewable energy resources and regional demand, and the national developing inclination of specific electricity industries [67]. Thus, instead of only considering the spatial potential, we recommend designing the future energy plan from more perspectives. Future research could be developed by considering the impact of power plants on the spatial environment and the decision makers’ preferences of energy planning.

Author Contributions

Conceptualization, Y.P. and J.S.; methodology, Y.P.; software, Y.P.; formal analysis and investigation, Y.P.; data preparation, Y.P.; writing—original draft preparation, Y.P.; writing—review and editing, H.A., L.Y. and J.S.; visualization, Y.P.; supervision, J.S.; project administration, J.S. and P.J.; funding acquisition, J.S. and P.J. All authors have read and agreed to the published version of the manuscript.

Funding

The study is funded by the Sino-German Mobility Program (M-0049).

Institutional Review Board Statement

Not applicable.

Informed Consent Statement

Not applicable.

Data Availability Statement

Publicly available datasets were analyzed in this study. This data can be found in the corresponding links provided in the reference section.

Acknowledgments

The research project was carried out at the School of Integrated Climate System Sciences (SICSS) at University of Hamburg. We are grateful for the support of the DFG Sino-Germen Mobility Program (M-0049) and the climate cluster of excellence CLICCS funded by DFG.

Conflicts of Interest

The authors declare no conflict of interest.

References

  1. European Commission. Going Climate-Neutral by 2050: A Strategic Long-Term Vision for a Prosperous, Modern, Competitive and Climate-Neutral EU Economy; Publications Office of the European Union: Luxembourg, 2019. [Google Scholar]
  2. McGrath, M. Climate change: China aims for “carbon neutrality by 2060”. BBC News, 22 September 2020. [Google Scholar]
  3. DCREA. China Nationally Determined Contribution (NDC) and Domestic 14th Power Five-Year-Plan (FYP); Draworld Environmental Research Center: Beijing, China, 2020. [Google Scholar]
  4. Liu, S. Chinese Economic Growth and Fluctuations, 1st ed.; Routledge: New York, NY, USA, 2017; pp. 1–196. [Google Scholar] [CrossRef]
  5. Dong, K.; Hochman, G.; Zhang, Y.; Sun, R.; Li, H.; Liao, H. CO2 emissions, economic and population growth, and renewable energy: Empirical evidence across regions. Energy Econ. 2018, 75, 180–192. [Google Scholar] [CrossRef]
  6. Peng, Y.; Yang, L.E.; Scheffran, J.; Yan, J.; Li, M.; Jiang, P.; Wang, Y.; Cremades, R. Livelihood transitions transformed households’ carbon footprint in the Three Gorges Reservoir area of China. J. Clean. Prod. 2021, 328, 129607. [Google Scholar] [CrossRef]
  7. Peng, Y.; Yang, L.E.; Scheffran, J. A life-cycle assessment framework for quantifying the carbon footprint of rural households based on survey data. MethodsX 2021, 8, 101411. [Google Scholar] [CrossRef] [PubMed]
  8. IEC. China: Energy Efficiency Report, 2018; International Energy Chater: Brussels, Belgium, 2018; ISBN 9789059482036. [Google Scholar]
  9. Zheng, B.; Wang, S.; Xu, J. A Review on the CO2 Emission Reduction Scheme and Countermeasures in China’s Energy and Power Industry under the Background of Carbon Peak. Sustainability 2022, 14, 879. [Google Scholar] [CrossRef]
  10. IEA. China’s Emissions Trading Scheme; IEA Publications: Paris, France, 2020. [Google Scholar]
  11. UNFCCC. The Paris Agreement. 2015. Available online: https://unfccc.int/process-and-meetings/the-paris-agreement/the-paris-agreement (accessed on 12 July 2021).
  12. NEA. The 13th Five-Year Plan for Energy Development; National Energy Administration: Beijing, China, 2016.
  13. NEA. Starting Work of “14th Five-Year Plan” Power Planning. 2020. Available online: http://www.gov.cn (accessed on 25 July 2021).
  14. Voivontas, D.; Assimacopoulos, D.; Mourelatos, A. Evaluation of renewable energy potential using a GIS decision support system. Renew. Energy 1998, 13, 333–344. [Google Scholar] [CrossRef]
  15. Soha, T.; Papp, L.; Csontos, C.; Munkácsy, B. The importance of high crop residue demand on biogas plant site selection, scaling and feedstock allocation—A regional scale concept in a Hungarian study area. Renew. Sustain. Energy Rev. 2021, 141, 110822. [Google Scholar] [CrossRef]
  16. Ali, S.; Waewsak, J. GIS-MCDM approach to scrutinize the suitable sites for a biomass power plant in southernmost provinces of Thailand. IOP Conf. Ser. Earth Environ. Sci. 2019, 265, 012021. [Google Scholar] [CrossRef]
  17. Pergola, M.; Rita, A.; Tortora, A.; Castellaneta, M.; Borghetti, M.; De Franchi, A.S.; Lapolla, A.; Moretti, N.; Pecora, G.; Pierangeli, D.; et al. Identification of suitable areas for biomass power plant construction through environmental impact assessment of forest harvesting residues transportation. Energies 2020, 13, 2699. [Google Scholar] [CrossRef]
  18. Van Holsbeeck, S.; Srivastava, S.K. Feasibility of locating biomass-to-bioenergy conversion facilities using spatial information technologies: A case study on forest biomass in Queensland, Australia. Biomass Bioenergy 2020, 139, 105620. [Google Scholar] [CrossRef]
  19. Zhu, J.; Li, Y.; Jiang, P.; Hu, B.; Yang, L.E. Analysis on the Dynamic Evolution of Bioenergy Industry in the Yangtze River Delta Based on Multilevel Social Network Theory. Energies 2021, 13, 6383. [Google Scholar] [CrossRef]
  20. Solangi, Y.A.; Shah, S.A.A.; Zameer, H.; Ikram, M.; Saracoglu, B.O. Assessing the solar PV power project site selection in Pakistan: Based on AHP-fuzzy VIKOR approach. Environ. Sci. Pollut. Res. 2019, 26, 30286–30302. [Google Scholar] [CrossRef] [PubMed]
  21. Yilan, G.; Kadirgan, M.A.N.; Çiftçioğlu, G.A. Analysis of electricity generation options for sustainable energy decision making: The case of Turkey. Renew. Energy 2020, 146, 519–529. [Google Scholar] [CrossRef]
  22. Rios, R.; Duarte, S. Selection of ideal sites for the development of large-scale solar photovoltaic projects through Analytical Hierarchical Process – Geographic information systems (AHP-GIS) in Peru. Renew. Sustain. Energy Rev. 2021, 149, 111310. [Google Scholar] [CrossRef]
  23. Chen, W.; Zhu, Y.; Yang, M.; Yuan, J. Optimal site selection ofwind-solar complementary power generation project for a large-scale plug-in charging station. Sustainability 2017, 9, 1994. [Google Scholar] [CrossRef] [Green Version]
  24. Shaaban, M.; Scheffran, J.; Böhner, J.; Elsobki, M.S. Sustainability Assessment of Electricity Generation Technologies in Egypt Using Multi-Criteria Decision Analysis. Energies 2018, 11, 1117. [Google Scholar] [CrossRef] [Green Version]
  25. Feyzi, S.; Khanmohammadi, M.; Abedinzadeh, N.; Aalipour, M. Multi- criteria decision analysis FANP based on GIS for siting municipal solid waste incineration power plant in the north of Iran. Sustain. Cities Soc. 2019, 47, 101513. [Google Scholar] [CrossRef]
  26. Derdouri, A.; Murayama, Y. Geostatistics: An Overview Onshore Wind Farm Suitability Analysis Using GIS-based Analytic Hierarchy Process: A Case Study of Fukushima. Geoinform. Geostat. Overv. Res. 2018, 16, 2. [Google Scholar] [CrossRef]
  27. Wang, C.N.; Tsai, T.T.; Huang, Y.F. A model for optimizing location selection for biomass energy power plants. Processes 2019, 7, 353. [Google Scholar] [CrossRef] [Green Version]
  28. Cunden, T.S.M.; Doorga, J.; Lollchund, M.R.; Rughooputh, S.D.D.V. Multi-level constraints wind farms siting for a complex terrain in a tropical region using MCDM approach coupled with GIS. Energy 2020, 211, 118533. [Google Scholar] [CrossRef]
  29. Jamshed, A.; Saleem, A.A.; Javed, S.; Riffat, M. Site Suitability Analysis for Developing Wind Farms in Pakistan: A GIS-Based Multi-Criteria Modeling Approach. Sci. Technol. Dev. 2018, 37, 195–201. [Google Scholar] [CrossRef]
  30. Xing, L.; Wang, Y. A practical wind farm siting framework integrating ecosystem services—A case study of coastal China. Environ. Impact Assess. Rev. 2021, 90, 106636. [Google Scholar] [CrossRef]
  31. Xu, Y.; Li, Y.; Zheng, L.; Cui, L.; Li, S.; Li, W.; Cai, Y. Site selection of wind farms using GIS and multi-criteria decision making method in Wafangdian, China. Energy 2020, 207, 118222. [Google Scholar] [CrossRef]
  32. Tercan, E.; Eymen, A.; Urfalı, T.; Saracoglu, B.O. A sustainable framework for spatial planning of photovoltaic solar farms using GIS and multi-criteria assessment approach in Central Anatolia, Turkey. Land Use Policy 2021, 102, 105272. [Google Scholar] [CrossRef]
  33. Yousefi, H.; Hafeznia, H.; Yousefi-Sahzabi, A. Spatial site selection for solar power plants using a gis-based boolean-fuzzy logic model: A case study of Markazi Province, Iran. Energies 2018, 11, 1648. [Google Scholar] [CrossRef] [Green Version]
  34. Wang, C.-N.; Hsueh, M.-H.; Lin, D.-F. Hydrogen Power Plant Site Selection Under Fuzzy Multicriteria Decision-Making (FMCDM) Environment Conditions. Symmetry 2019, 11, 596. [Google Scholar] [CrossRef] [Green Version]
  35. Yan, X.; Yang, J.; Zheng, K. Key Issues and Trends of Pumped Storage Development at Present. 2019. Available online: https://news.bjx.com.cn/html/20190409/973565.shtml (accessed on 21 May 2021). (In Chinese).
  36. Yang, L.; Lü, Y.; Zheng, H. Review on research of urban land carrying capacity. Prog. Geogr. 2010, 29, 593–600. [Google Scholar]
  37. Taminiau, J.; Byrne, J.; Kim, J.; Kim, M.W.; Seo, J. Infrastructure-scale sustainable energy planning in the cityscape: Transforming urban energy metabolism in East Asia. Wiley Interdiscip. Rev. Energy Environ. 2021, 10, e397. [Google Scholar] [CrossRef]
  38. Shanghai Statistical Bureau. Shanghai Statistical Yearbook. 2020. Available online: http://www.stats-sh.gov.cn (accessed on 20 May 2021).
  39. Anhui Statistical Bureau. Anhui Statistical Yearbook. 2020. Available online: http://tjj.ah.gov.cn/ssah/qwfbjd/tjnj/index.html (accessed on 22 May 2021).
  40. Zhejiang Statistical Bureau. Zhejiang Statistical Yearbook. 2020. Available online: https://tjj.zj.gov.cn/col/col1525563/index.html (accessed on 20 May 2021).
  41. Jiangsu Statistical Bureau. Jiangsu Statistical Yearbook; 2020. Available online: http://tj.jiangsu.gov.cn (accessed on 21 May 2021).
  42. Tsinghua University Power Installation and Power Generation Data Handbook. 2020. Available online: https://cloud.tsinghua.edu.cn/f/4c6ff1461fd747de8b32/ (accessed on 29 April 2021).
  43. General Office of the State Council. Outline of the Plan for Integrated Regional Development of the Yangtze River Delta; The State Council the People’s Republic of China: Beijing, China, 2019.
  44. Siefi, S.; Karimi, H.; Soffianian, A.R.; Pourmanafi, S. GIS-Based Multi Criteria Evaluation for Thermal Power Plant Site Selection in Kahnuj County, SE Iran. Civ. Eng. Infrastruct. J. 2017, 50, 179–189. [Google Scholar] [CrossRef]
  45. General Office of the State Council of the People’s Republic of China. Regulations on the Management of Taihu Lake. Available online: http://www.gov.cn/ (accessed on 21 May 2021).
  46. General Office of the State Council of the People’s Republic of China. Regulations of the People’s Republic of China on Nature Reserves. 1994. Available online: http://www.gov.cn/ (accessed on 21 May 2021).
  47. Sliz-Szkliniarz, B.; Vogt, J. GIS-based approach for the evaluation of wind energy potential: A case study for the Kujawsko-Pomorskie Voivodeship. Renew. Sustain. Energy Rev. 2011, 15, 1696–1707. [Google Scholar] [CrossRef]
  48. Panagiotidou, M.; Xydis, G.; Koroneos, C. Environmental siting framework for wind farms: A case study in the Dodecanese Islands. Resources 2016, 5, 24. [Google Scholar] [CrossRef] [Green Version]
  49. Lin, W.; Wu, M.; Zhang, Y.; Zeng, R.; Zheng, X.; Shao, L.; Zhao, L.; Li, S.; Tang, Y. Regional differences of urbanization in China and its driving factors. Sci. China Earth Sci. 2018, 61, 778–791. [Google Scholar] [CrossRef]
  50. Baseer, M.A.; Rehman, S.; Meyer, J.P.; Alam, M.M. GIS-based site suitability analysis for wind farm development in Saudi Arabia. Energy 2017, 141, 1166–1176. [Google Scholar] [CrossRef] [Green Version]
  51. Li, J.; Gao, H.; Shi, P.; Shi, J.; Ma, L.; Qin, H.; Yanqin, S. China Wind Power Report·2007 Greenpeace Coordinators; China Environmental Science Press: Beijing, China, 2007. [Google Scholar]
  52. Yang, J.; Liu, Q.; Li, X.; Cui, X. Overview of wind power in China: Status and future. Sustainability 2017, 9, 1454. [Google Scholar] [CrossRef] [Green Version]
  53. Nuclear Energy Agency; International Atomic Energy Agency. Uranium 2016: Resources, Production and Demand-Executive Summary; Nuclear Energy Agency: Boulogne-Billancourt, France, 2016.
  54. Gao, J.; Zhao, P.; Zhang, H.; Mao, G.; Wang, Y. Operational water withdrawal and consumption factors for electricity generation technology in China-A literature review. Sustainability 2018, 10, 1181. [Google Scholar] [CrossRef] [Green Version]
  55. Odhiambo, M.R.O.; Abbas, A.; Wang, X.; Mutinda, G. Solar Energy Potential in the Yangtze River Delta Region—A GIS-Based Assessment. Energies 2020, 14, 143. [Google Scholar] [CrossRef]
  56. Ferretti, V.; Pomarico, S. Integrated sustainability assessments: A spatial multicriteria evaluation for siting a waste incinerator plant in the Province of Torino (Italy). Environ. Dev. Sustain. 2012, 14, 843–867. [Google Scholar] [CrossRef]
  57. Solangi, Y.A.; Tan, Q.; Mirjat, N.H.; Ali, S. Evaluating the strategies for sustainable energy planning in Pakistan: An integrated SWOT-AHP and Fuzzy-TOPSIS approach. J. Clean. Prod. 2019, 236, 117655. [Google Scholar] [CrossRef]
  58. Wu, Y.; Qin, L.; Xu, C.; Ji, S. Site selection of waste-to-energy (WtE) plant considering public satisfaction by an extended vikor method. Math. Probl. Eng. 2018, 2018, 5213504. [Google Scholar] [CrossRef]
  59. Chien, F.; Wang, C.N.; Nguyen, V.T.; Nguyen, V.T.; Chau, K.Y. An evaluation model of quantitative and qualitative fuzzy multi-criteria decision-making approach for hydroelectric plant location selection. Energies 2020, 13, 2783. [Google Scholar] [CrossRef]
  60. Jeong, J.S.; Ramírez-Gómez, Á. Optimizing the location of a biomass plant with a fuzzy-DEcision-MAking Trial and Evaluation Laboratory (F-DEMATEL) and multi-criteria spatial decision assessment for renewable energy management and long-term sustainability. J. Clean. Prod. 2018, 182, 509–520. [Google Scholar] [CrossRef]
  61. Peng, H.M.; Wang, X.K.; Wang, T.L.; Liu, Y.H.; Wang, J.Q. A multi-criteria decision support framework for inland nuclear power plant site selection under Z-Information: A case study in hunan province of China. Mathematics 2020, 8, 252. [Google Scholar] [CrossRef] [Green Version]
  62. Li, X.; Gui, F.; Li, Q. Can hydropower still be considered a clean energy source? Compelling evidence from a middle-sized hydropower station in China. Sustainability 2019, 11, 4261. [Google Scholar] [CrossRef] [Green Version]
  63. Ramos, A.; Teixeira, C.A.; Rouboa, A. Environmental analysis of waste-to-energy-a Portuguese case study. Energies 2018, 11, 548. [Google Scholar] [CrossRef] [Green Version]
  64. Google Global Energy Observatory; KTE Royal Institute of Technology in Stockholm; World Resources Institute Enipedia. Global Power Plant Database. Available online: http://datasets.wri.org/dataset/globalpowerplantdatabase (accessed on 25 June 2020).
  65. NDRC. NEA Medium and Long Term Gas Pipeline Planning; National Development and Reform Commission: Beijing, China, 2017.
  66. Ministry of natural resources of the People’s Republic of China. China Mineral Resource; Geological Publishing House: Beijing, China, 2020.
  67. World Bank; Technical University of Denmark. Mean Wind Power Density in Height 100 m in China. Available online: https://globalwindatlas.info/about/introduction (accessed on 23 June 2020).
  68. Solargis; World Bank. Annual Global Horizontal Irradiance–China-Global Solar Atlas 2.0. Available online: https://globalsolaratlas.info/map (accessed on 20 June 2020).
  69. Geospatial Data Cloud Site; Computer Network Information Center; Chinese Academy of Sciences. SRTM 90 m Digital Elevation Database. Available online: https://www.gscloud.cn/ (accessed on 23 June 2020).
  70. Ministry of Nutural Resources of the People’s Republic of China; National Geomatic Center of China; National Remote Sensing Center of China. Group on Earth Observations Global Land 30. Available online: http://www.globallandcover.com/ (accessed on 23 June 2020).
  71. National Catalogue Service For Geographic Infomation 1:1 Million National Basic Geographic Database. Available online: https://www.webmap.cn/commres.do?method=result100W (accessed on 19 May 2020).
  72. OSM OpenStreetMap. Available online: https://www.openstreetmap.de (accessed on 27 June 2020).
  73. Xingliang, X. Grid Data Set of Spatial Population Distribution of China in One Kilometer. Available online: http://www.resdc.cn (accessed on 25 May 2020).
  74. Wei, X.; Duan, Y.; Liu, Y.; Jin, S.; Sun, C. Onshore-offshore wind energy resource evaluation based on synergetic use of multiple satellite data and meteorological stations in Jiangsu Province, China. Front. Earth Sci. 2019, 13, 132–150. [Google Scholar] [CrossRef]
  75. Bódis, K.; Monforti, F.; Szabó, S. Could Europe have more mini hydro sites? A suitability analysis based on continentally harmonized geographical and hydrological data. Renew. Sustain. Energy Rev. 2014, 37, 794–808. [Google Scholar] [CrossRef]
  76. Ingason, H.T.; Pall Ingolfsson, H.; Jensson, P. Optimizing site selection for hydrogen production in Iceland. Int. J. Hydrogen Energy 2008, 33, 3632–3643. [Google Scholar] [CrossRef]
  77. Zhao, W.; Liu, X.; Deng, Q.; Li, D.; Xu, J.; Li, M.; Cui, Y. Spatial Association of Urbanization in the Yangtze River Delta, China. Int. J. Environ. Res. Public Health 2020, 17, 7276. [Google Scholar] [CrossRef]
  78. Wang, Y.; Dong, W.; Boelens, L. The interaction of city and water in the Yangtze River Delta, a natural/artificial comparison with Euro Delta. Sustainability 2018, 10, 109. [Google Scholar] [CrossRef] [Green Version]
  79. Bu, M.; Luo, H. Globalization and Energy Consumption in the Yangtze River Delta; Shujie, Y., Maria Jesus, H., Eds.; Palgrave Macmillan UK: London, UK, 2014. [Google Scholar]
  80. NEA. The 13th Five-Year Plan for Electric Power Development; National Energy Administration: Beijing, China, 2016.
  81. CEC. Research on “14th Five-Year Plan” Plan of Electric Power Industry; China Electricity Council: Beijing, China, 2020. (In Chinese) [Google Scholar]
  82. World Resources Institute. Potential and Viosion of Distributed Renewable Energy in Yangtze River Delta Region; Energy Founfation: Beijing, China, 2021. [Google Scholar]
  83. Spyridonidou, S.; Sismani, G.; Loukogeorgaki, E.; Vagiona, D.G.; Ulanovsky, H.; Madar, D. Sustainable Spatial Energy Planning of Large-Scale Wind and PV Farms in Israel: A Collaborative and Participatory Planning Approach. Energies 2021, 14, 551. [Google Scholar] [CrossRef]
  84. Shu, K.; Scheffran, J.; Schneider, U.A.; Yang, L.E.; Elflein, J. Reconciling food and bioenergy feedstock supply in emerging economies: Evidence from Jiangsu Province in China. Int. J. Green Energy 2017, 14, 509–521. [Google Scholar] [CrossRef]
Figure 1. Study area—the Yangtze River Delta region.
Energies 15 02167 g001
Figure 2. Flowchart of the methodology (adapted from Siefi et al. [44]).
Energies 15 02167 g002
Figure 3. The analytic hierarchy of spatial siting potential evaluation.
Energies 15 02167 g003
Figure 4. Suitable zones.
Energies 15 02167 g004
Figure 5. Spatial theoretical energy potential (C1) map of alternative power plants.
Energies 15 02167 g005
Figure 6. Spatial suitability map of evaluation criteria (C2–C9).
Energies 15 02167 g006
Figure 7. Spatial siting potential map of alternative power plants.
Energies 15 02167 g007
Figure 8. Spatial siting potential of alternative power plants in one cell.
Energies 15 02167 g008
Table 1. Constraining factors of the unsuitable zones.
Constraining FactorConstraining
Parameter
Constraining Map LayerBuffer Zone
(Unsuitable Area)
References
Environmental reasonDistance to water and riversConstraining map to distance to permanent rivers and lakesD < 500 m[45]
Distance to protected areasConstraining map to distance to national and regional natural ecosystem reserves, wildlife refuges, and nature reservesD < 300 m[46]
Land use reasonDistance to residential areaConstraining map to distance to residential areas
Area > 1000 km2 (megacity)
D < 5 km[47]
Constraining map to distance to residential areas
400 km2 ≥ Area >100 km2 (large and median cities)
D < 2 km[33]
Constraining map to distance to residential areas
Area ≤ 100 km2 (small towns and rural areas)
D < 500 m[47]
Infrastructure reasonDistance to roadsConstraining map to distance to motorways, firs-class roads, secondary roads, and tertiary roadsD < 50 m[48]
Distance to railwaysConstraining map to distance to major railwaysD < 50 m[48]
Distance to gridConstraining map to distance to high-voltage electricity grids (Voltage > 100,000 Volt)D < 50 m[48]
Geographic reasonSlopeConstraining map to slope percentage>30% [26]
ElevationConstraining map to the altitude>2000 m[33]
Table 2. Scoring scheme of criteria map layers.
CriterionMap Layer LowMediumHigh
Index 012345678910
C1—NG potentialNG plant and Distance to NG pipeline (km)->40-30–40-20–30-10–20-<10NG plant and 5 km buffer area
C1—Nuclear potentialNuclear plant and Distance to uranium ore (km)--->400 200–400-<200--Nuclear plant and 5 km buffer area
Costal buffe (km) Coastal areas and 10 km buffer area
C1—Wind potentialWind power density in 100 m (W/m2)<150150–200200–250250–300300–350350–400400–450450–500500–550550–600>600
C1—Solar potentialAnnual GHI
(kWh/m2)
<10001000–10501050–11001100–11501150–12001200–12501250–13001300–13501350–1400>1400-
C1—Hydro potentialContour (5 m) density100100–300-300–500-500–700-700–900->900power plant and 10 km buffer
River buffer River and 10 km buffer area
C1—Biomass potentialAgricultural and forest land kernel density-<100100–300300–500500–700700–900900–11001100–13001300–1500>1500-
C1—WTE potentialAnnual house refuse density (tons/km2)-<150-150–300-300–450-450–600->600-
C2Elevation (m)-1700–20001500–17001300–15001100–1300900–1100700–900500–700300–500100–3000–100
C3Slope (%)-17–3015–1713–1511–139–117–95–73–51–3<1
C4Proximity to road: motorway, 1st, 2nd, 3rd (m)-> -7500–1000-5000–7500-2500–5000-<2500-
C5Proximity to waterbody(m)-> -7500–1000-5000–7500-2500–5000-<2500-
C6Proximity to powerline with voltage > 1000 v (m)-> -7500–1000-5000–7500-2500–5000-<2500-
C7Energy demand (MWh/km2)-<900-900–1600-1600–3000-3000–7500->7500-
C8Population density
(pop/km2)
-≥3000-1500–3000-1000–1500-500–1000-<500-
C9Protected zone buffer (m)-----<5000---≥5000-
Table 3. Weight of criteria for energy power plants.
NGNuclearWindPVHydroBiomassWTE
W C 1 0.10050.28110.27340.24700.25520.27870.2367
W C 2 0.04380.06440.07880.08110.02150.03060.0891
W C 3 0.06710.03430.18820.12070.04920.05720.2398
W C 4 0.05750.06440.10390.06640.14550.03060.1040
W C 5 0.03270.06440.02590.02530.06560.27870.0615
W C 6 0.02320.06010.05790.21180.21340.05130.0234
W C 7 0.22510.02450.13860.04710.13040.14410.0238
W C 8 0.22510.23510.03060.03350.03270.09800.1453
W C 9 0.22510.17170.10260.16720.08650.03060.0764
Table 4. GIS data sources for criteria map layers.
CriteriaMap SourceMap LayerReferences
C1—NG potentialLocation of power plants;
Spatial allocation of natural gas pipeline
Natural gas power plants and their buffer area;
Distance to pipeline
[64,65]
C1—Nuclear potentialLocation of power plants;
The map of mineral resource distribution;
Boundary map
Nuclear power plants and their buffer area;
Distance to uranium ore;
Distance to coastal areas
[64,66]
C1—Wind potentialMean wind power density at an altitude of 100 mMean wind power density[67]
C1—Solar potentialAnnual global horizontal irradianceGlobal horizontal irradiance (GHI)[68]
C1—Hydro potentialSRTM 90 m Digital Elevation DatabaseStreams;
Elevation drop
[69]
C1—Biomass potentialGlobal land 30Agricultural and biomass density[70]
C1—WTE potentialStatistical yearbooks of county-level administrative regionsAnnual house refuse density [38,39,40,41] *
C2—ElevationSRTM 90 m Elevation[69]
C3—SlopeSRTM 90 m Slope[69]
C4—Proximity to roadsRoad mapDistance to motorways, firs-class roads, secondary roads, and tertiary roads[71]
C5—Proximity to surface waterRiver map
Waterbody map
Distance to rivers and water bodies[71]
C6—Proximity to gridsElectricity grid mapDistance to high-voltage electricity grids[72]
C7—Energy demandStatistical year books of the county and city-level administrative regionsAnnual electricity demand density at city and county levels[38,39,40,41] *
C8—Population densitySpatial population distribution of China in 1 kmSpatial population distribution of resampled grid[73]
C9—Ecological/
environmental impact
Protected zone mapProtected zone buffer[71]
* More data from 2019 statistical year books at the city or county level have been included.
Table 5. Percentage of areas in each potential scale out of the suitable area for alternative power plants.
LowMediumHigh
Potential Scale0.1–0.20.2–0.30.3–0.40.4–0.50.5–0.60.6–0.70.7–0.80.8–0.90.9–1
NG0%0%0%0.163%13.986%47.320%32.557%5.957%0.017%
Nuclear0%0%0.097%5.220%76.179%17.200%1.288%0.017%0%
Onshore Wind0%0.052%3.736%17.271%45.690%28.381%4.797%0.073%0%
Solar PV0%0%0.002%1.148%14.887%49.301%20.666%13.993%0.002%
Hydro0%3.899%27.798%33.426%22.748%10.957%1.141%0.031%0%
Biomass0%0%0%0.002%1.600%35.922%59.641%2.836%0%
WTE0%0%0%0.903%11.212%56.538%30.194%1.148%0.005%
Publisher’s Note: MDPI stays neutral with regard to jurisdictional claims in published maps and institutional affiliations.

