Article

Experimental and Numerical Investigation of a Surface Sliding Discharge in a Supersonic Flow with an Oblique Shock Wave

1
Faculty of Physics, Lomonosov Moscow State University, 119991 Moscow, Russia
2
Ishlinsky Institute for Problems in Mechanics of the RAS, 119526 Moscow, Russia
*
Author to whom correspondence should be addressed.
Energies 2022, 15(6), 2189; https://doi.org/10.3390/en15062189
Submission received: 15 February 2022 / Revised: 12 March 2022 / Accepted: 15 March 2022 / Published: 17 March 2022

Abstract

:
This study presents an experimental and numerical investigation on a surface sliding discharge in a supersonic airflow in the presence of an oblique shock wave. In experiments, flow Mach numbers were 1.20–1.68 in the shock tube combined with the discharge chamber. A single high-voltage 25 kV pulse sustains the plasma; the discharge current has a duration of ~500 ns. A surface sliding discharge is developed as a localized channel in a zone of interaction of an oblique shock wave with a boundary layer on the upper wall of the discharge chamber. The discharge channel acts as a linear source of heat and is at the origin of the induced shock wave. The flow field in the discharge chamber is spatio-temporally surveyed using high-speed shadowgraphy imaging with a frequency of up to 525,000 frames per second. The experiments show that the perturbed flow restored the initial structure after more than 100 μs. Numerical simulation with local energy input into the supersonic flow in a flat channel is carried out on the base of unsteady two-dimensional Navier–Stokes equations. It is determined that the dynamics of an induced shock wave are dependent on the energy input regime and on the flow parameters. The thermal energy release in the discharge channel of 0.22–0.29 J was estimated from a comparison of experimental data and numerical simulations.

1. Introduction

The effects of electrical discharges on high-speed airflows have been discussed widely during the last decades. Plasma actuators based on different types of discharges have shown their ability of active flow control [1,2]. These devices are robust, compact, and have short response times. The plasma actuators on the base of dielectric barrier discharge [3,4,5], surface sliding discharge [6,7], spark and arc discharges [8,9,10] are used for flow control. The dielectric barrier discharge [1,2,3,4] allows using different electrode geometries, different supply voltages, and voltage waveforms for flow control. This type of plasma actuator can control fluid motion in the form of ionic wind [1,2,3]. The dielectric barrier discharges have also been applied to control the boundary layer and to control the interaction of shock waves with a boundary layer. The rapid heat release in nanosecond discharges leads to the generation of shock waves and the development of a complex flow field near the actuator surface [1,2,6,7,11]. Plasma-induced flow can involve the wall jets and vortices [1,4,5]. Therefore, the proposed plasma actuators are expected to assist the realization of boundary layer control, laminar-turbulent transition control, shock wave control, etc.
When initiating nanosecond discharges in supersonic airflows, gas heating [1,2,8,9,10,12,13] and shock wave mechanism [6,9,11,14,15,16] are decisive factors for flow control. A significant part of electrical energy of nanosecond discharge goes into fast gas heating in sub-microsecond time periods [1,2,6,7,12,15]. At high electric fields in air, a considerable part of discharge energy is spent for the vibrational excitation of molecules and for the electronically excited states of nitrogen and oxygen, for which the lifetimes of metastable states are rather large [1,2,17]. This energy can transform into thermal energy at different time scales. Vibrational relaxation times are longer than a millisecond [2,17]. The quenching of electronically excited nitrogen molecules can lead to additional gas heating at microsecond time periods after the discharge. In nanosecond surface discharges, gas temperatures can exceed 10,000 K [1,14,18]. Under high temperature, excitation of vibrational energy, electronic excitation, and dissociation, causes the air to become calorically imperfect. It is therefore important to take into account the non-equilibrium effects when considering a high-enthalpy gas flow such as a hypersonic double-wedge flow [19] or a jet of titanium vapor in nitrogen under the action of pulsed laser radiation [20]. The non-equilibrium effects can lead to discrepancies between the results obtained with the classical thermo-physical multi-temperature thermochemical model, and the state-to-state vibrational kinetics [19,20].
A rapid gas heating is accompanied by a formation of shock waves, slip surfaces, and rarefaction waves arising from the boundary of plasma [6,7,11,14,16,18]. When a pulse energy is input into a supersonic flow, a complex interaction of the induced flow with an initial flow arises [6,9,14,15,16,21,22,23]. The intensity of the induced shock wave depends on the thermal energy released in a gas [1,2,6,7,14,15,16,23]. Nanosecond discharges result in fast heating in a sub-microsecond time. Experiments and numerical simulations have shown that 20–60% of the electric energy of the discharge goes to fast heating [1,2,15,18]. The processes of fast heating in air plasma of a nanosecond discharge are related to the quenching of nitrogen and oxygen excited atoms [1,2,12]. In gas-dynamic simulations, it is possible to consider a nanosecond discharge as a local volume of energy release to calculate the motion of shock waves [6,14,15,16,18]. The simulated motion of shock waves is then compared to experiments to analyze the energy input.
Nanosecond surface sliding discharge consists of a set of thin channels near the dielectric surface [6,15]. The discharge enables to produce a plasma layer of ~0.5 mm thickness and can be used to control near-surface flow [6,11,14,18]. When a sliding discharge is generated in motionless air or in high-speed homogeneous airflow, the semi-cylindrical shock waves arise. The previous works examine the influence of a supersonic airflow perpendicular to the discharge channels on the discharge properties, by means of electrical and optical diagnostics [6,15]. The identification of discharge channels as sources of semi-cylindrical shock waves was demonstrated experimentally by recording the discharge radiation and high-speed visualization of the induced flow [6,15,24]. Each of the shock waves were induced by an individual discharge channel. In addition, two-dimensional simulations with channeled energy deposition near the streamlined surface in air flow have shown a good agreement with the experiments. A surface sliding discharge-based actuator was experimentally tested in the supersonic flow with a vortex zone [11,18]. The pulsed discharge regime can change in airflows [6,14,18,25,26]. The presence of a zone of low density can lead to a change in the mode of the discharge and the discharge current [11,18,27]. The flow configuration with inclined shock waves finds application in supersonic inlets when the shock wave interacts with the boundary layer. Numerical simulation of flows with an energy input into a separation zone is a promising gas-dynamics task.
The focus of work is to study the discharge-induced flow at the interaction between an oblique shock wave and the boundary layer, which is important for an understanding of the plasma-assisted control of supersonic airflow. The characteristics of a nanosecond surface sliding discharge in the interaction of a boundary layer with an oblique shock wave is investigated. The induced flow structure after the discharge in the discharge chamber was analyzed experimentally. The induced flow after a pulsed surface energy deposition near inclined shock waves was simulated by solving Navier–Stokes equations. The computed results are compared with experimental data to determine the thermal energy released in the discharge.

2. Experimental Method

2.1. Experimental Setup

The experiments were carried out on a shock tube with a discharge chamber. The shock tube channel was of rectangular section 24 × 48 mm2 [6,15]. The scheme of the experimental setup is shown in Figure 1. Supersonic airflows with velocities of 600–1400 m/s were created behind plane shock waves in the shock tube. The Mach numbers of plane shock waves were 2.5–5.2, the Mach numbers of the flow were 1.20–1.68, and the Reynolds numbers were ~105 at a density of 0.01–0.30 kg/m3. Quartz glass forms the sidewalls of the discharge chamber of the shock tube (Figure 1 and Figure 2). The electrodes of surface sliding discharge 100 mm long were located on the upper wall of the discharge chamber. The width of discharge gap was 30 mm. The electrodes were composed of a 0.1 mm thick copper layer. The dielectric parallelepiped on the lower wall was an obstacle generating the inclined shock wave in a supersonic flow [26,27]. The dimensions of parallelepiped are 48.0 × 6.2 × 1.9 mm3.
In experiments, a synchronizing system initiated a surface sliding discharge 200–700 μs after the initial shock wave passed the obstacle. A quasi-stationary flow with an inclined shock wave behind the obstacle formed within 100–200 μs after that. To determine the shape of the discharge region, the discharge glow was recorded using photo cameras on both sides of the discharge chamber. To determine the discharge glow duration, registration was carried out with a 9-frame ICCD camera. The discharge radiation emission spectrum was recorded.
The diffraction of a plane shock wave and the development of the flow field in the discharge chamber were studied using high-speed shadowgraphy imaging [6,26]. The optical system for direct shadowgraphy forms a parallel beam of light with a diameter of 40 mm and directs it perpendicular to the glass of the discharge chamber. Then, the light beam hits the matrix of a high-speed video camera (Figure 1). Shadowgraph images of the flow field were recorded with a high-speed camera at a frequency of 150,000–525,000 frames per second with an exposure time of 1 μs. High-speed shadowgraphy reveals all stages of the evolution of the flow field during shock wave diffraction. Figure 2 shows a formation of a shock wave pattern behind a plane shock wave that demonstrates the interaction of the boundary layer on the upper wall of the discharge chamber with an oblique shock wave.
Under experimental conditions, the duration of a uniform flow behind the shock wave was 200–500 μs [26]. The thickness of the laminar boundary layer on the wall of the shock tube increases from the front of the shock wave in the direction of the flow. At some distance from the shock wave front, the boundary layer becomes turbulent [28]. The Reynolds number of the flow was ~105 in experiments, estimated from the size of the shock tube channel. The boundary layer in the experiments was laminar for 100–150 µs after the shock wave passed the obstacle. The thickness of the laminar boundary layer was less than 1 mm [6,28]. A shock wave interacting with the boundary layer can lead to creation of a region of thickened or separated boundary layer flow [29]. The low-density zone is formed near the wall in the region where the oblique shock wave interacts with the boundary layer [27,29].

2.2. Surface Sliding Discharge Characteristics

The discharge characteristics are described only briefly here; more details can be found in [6,15,26]. A nanosecond surface sliding discharge develops upon the application of voltage pulse to the special electrodes near the dielectric (see Figure 3). The current waveform was measured using a custom designed current shunt connected to a Tektronix TPS 2014 oscilloscope. The discharge current is ~1 kA and duration is ~500 ns at the applied voltage pulse with an amplitude 25 kV. In homogeneous gas media, the discharge has the form of plasma sheet ~0.5 mm thick, which is comparable to the thickness of the laminar boundary layer on the wall of the shock tube (~1 mm) [6,15].
The surface sliding actuator consumes a total of 0.72 J of energy. The energy input to the gas occurs almost instantaneously compared to the gas-dynamic flow time in the shock tube. As experiments have shown, surface sliding discharge is formed as a single straight channel on the upper wall of the discharge chamber. It locates directly in the region of interaction of the inclined shock wave with the boundary layer (Figure 4) [27]. A short thin plasma layer (less than 2 mm thick) is formed on a dielectric surface. This thin layer is located in a complex flow field, which occupies the region of interaction between the boundary layer and the oblique shock wave. The thickness and width of the plasma channel were measured by digital processing of discharge glow images.
The pulsed breakdown of gas depends on the value of the reduced electric field E/N, where E is the electric field strength, N is the concentration of molecules [17]. The flow parameters near the surface affect the sliding discharge mode [6,11,14,18]. In an inhomogeneous medium, the reduced electric field is higher at lower density. In a supersonic flow, a region of reduced density is formed on the upper wall in the boundary layer when interacting with an oblique shock wave [27]. Therefore, a surface sliding discharge occurs in a low-density area. In experiments, we observed the discharge channel as a bright strip ~2–10 mm wide (see Figure 3b,c). The discharge channel has the same shape when formed in quasi-stationary flows around the wedge. Figure 3b,c obviously shows the sharp boundaries of the localized discharge. The emission spectra from the plasma channel showed a high-intensity continuum [26]. The non-equilibrium nature of the plasma layer can be responsible for the changes in the power and longer power deposition.

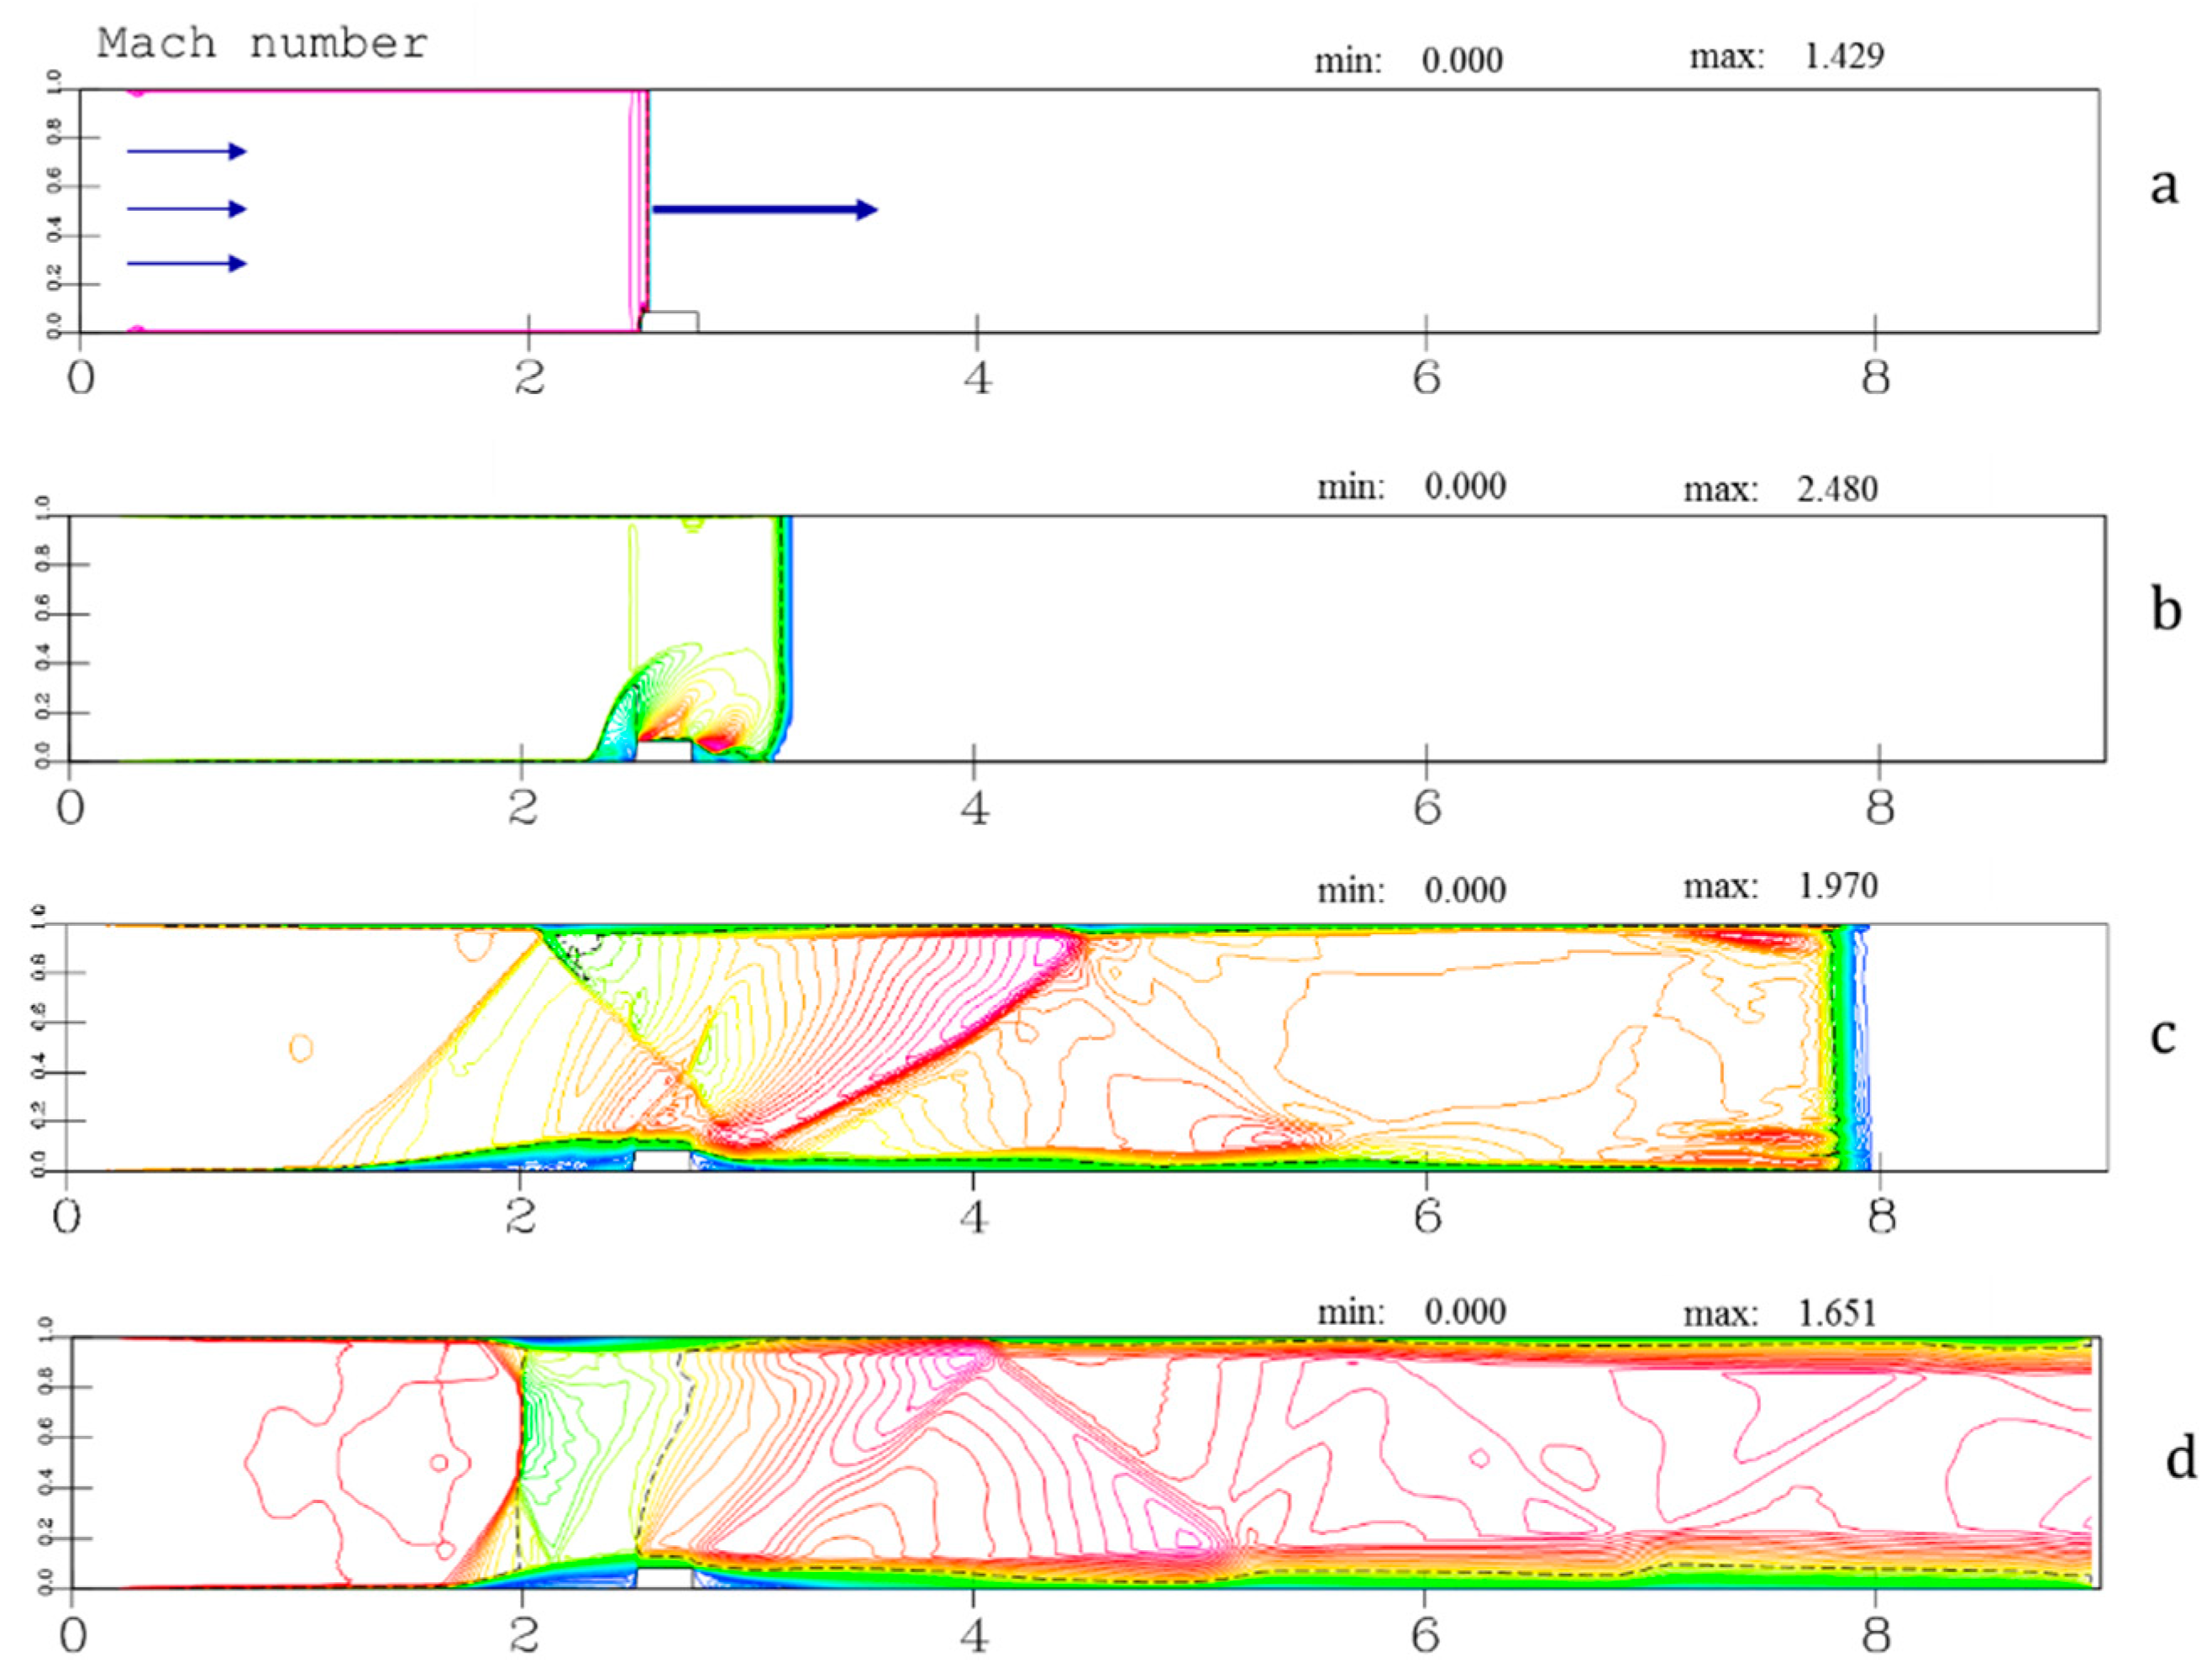
3. Numerical Simulations of Supersonic Flows in a Channel

A model of a viscous, heat-conducting, thermodynamically perfect gas (air) with a constant isentropic index γ = 1.4 and Prandtl number Pr = 0.72 is used as a physical model. The dynamic viscosity coefficient is calculated using the temperature dependence given by the Sutherland formula.
The system of Navier–Stokes equations [30,31] is used as a mathematical model of the supersonic flow of a viscous gas in a flat channel and the process of shock wave diffraction on a rectangular obstacle. This system describes the flows of a viscous, compressible gas in two-dimensional regions and is completed by the improved two-equation k-ε turbulence model [30], caloric and thermal equations of state, initial and boundary conditions. The initial distribution of the gas flow parameters is set, taking into account the experimental conditions.
The computational algorithm was implemented to use a two-dimensional, non-uniform, structured computational grid with quadrangular cells. The mesh adapts to boundaries coinciding with solid walls. The computational algorithm is based on the finite volume scheme. The algorithm uses the approximation of the terms in the system of equations responsible for the convective transfer based on the explicit Godunov method of a higher order of accuracy. The terms describing the viscous, diffusion, and heat transfer use three-point approximations. The gas-dynamic parameters in computational grid cells are represented as a piecewise linear distribution obtained using a two-dimensional reconstruction procedure with limiter functions. The fluxes of conservative variables through the faces of the computational cell are determined from the approximate solution of the Riemann problem by the AUSM+ method. To approximate time derivatives, the Runge–Kutta method of the second order is used. In general, the numerical algorithm developed by the authors is conservative and monotonic and has the second order in space and time. The algorithm correctly takes into account the characteristic properties of the system of equations (i.e., the direction of propagation of disturbances in the computational region).
The computational domain of this study is presented in Figure 4. The shock wave and gas flow propagate from left to right. The upper and lower boundaries of the computational region and the boundaries of the obstacle are solid walls on which the no slip condition is set. On the left boundary, the supersonic inlet flow is set, and on the right outlet boundary, the condition of non-reflection is set. The computational grid has dimensions of 600 × 100 cells and is refined in the direction of the solid walls, so that the first nodal point of the grid from the wall is at a distance y+ = 0.4–1.0 from the wall. In this case, the size of the first cell near wall is no more than 0.0001 m.
The results of numerical calculations of the shock wave diffraction by a rectangular obstacle in the channel for different times are shown in Figure 4 in the form of contour lines of the Mach number field colored on a linear scale in the range from the minimum (blue color) to the maximum (magenta color). The limiting values of the range of Mach numbers are shown on the right above the figure field (Figure 4a–d). From the analysis of the results, it follows that the thickness of the laminar boundary layer is less than 0.5 mm. The thickness of the turbulent boundary layer that appears after the shock wave passes the obstacle does not reach 1 mm.
Numerical simulation of the supersonic gas flow around a rectangular obstacle in the shock tube channel with a local energy supply was performed. In calculations, the thermal effect from all processes in the gas-discharge plasma is integrally taken into account by changing the internal energy in a given volume V by a certain value ΔE. In the computational cells that enter a given volume V, the specific internal energy of the gas flow is increased by the value of the energy supply. The pressure in the volume V is increased. Excess pressure can be calculated as follows: Δp = (γ − 1)·ΔE/V, where γ is the specific heat ratio of air. Numerically, the process of energy input is carried out through the source term in the energy conservation equation. The influence of the geometric shape and size of the energy supply region, the time period of energy supply, the specific value of the energy supplied, and the gas parameters inside the volume were studied. The energy release time varied from 300 to 1500 ns. The results of the numerical calculation were compared with the results of experimental measurements. By comparing the experimental and numerical results, one can estimate the amount of energy, which causes the shock wave formation.

4. Results and Discussion

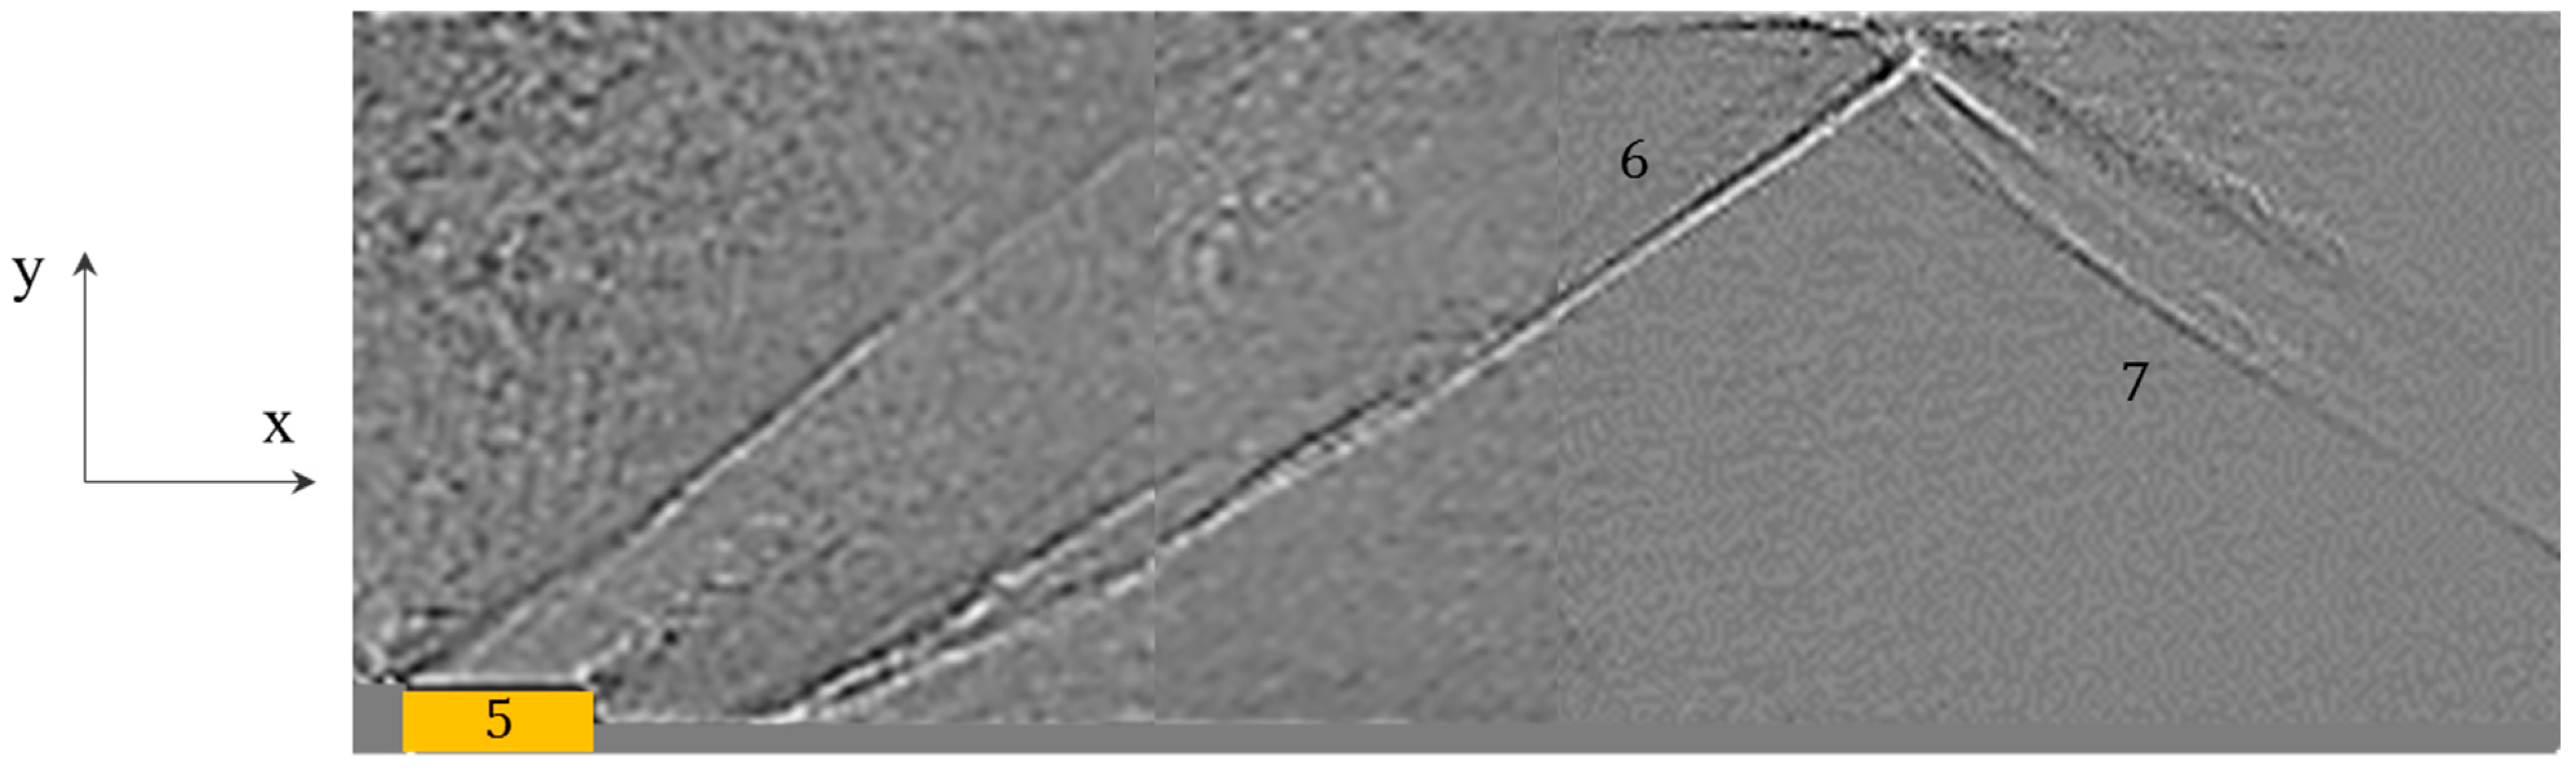
4.1. Shadowgraph Visualizations

The formation of a quasi-stationary flow after the diffraction of the shock wave by the obstacle occurs within 100–200 μs, as shown using high-speed imaging. The duration of a quasi-stationary flow is ~200–500 μs depending on the flow parameters [6,26]. Figure 5 shows shadowgraph visualization of steady flow after the plane shock wave has been diffracted by the obstacle. The flow field image is composed of three experimental images obtained under identical initial conditions. Images are recorded in the XY plane, where X corresponds to the direction of flow and Y is perpendicular to the surface of the dielectric. Behind the bottom of the obstacle, an oblique shock wave is formed, which then interacts with the boundary layer on the upper wall (see Figure 4 and Figure 5). The diffraction pattern behind an obstacle depends on the Mach number of the flow, and the type of reflection of the oblique shock wave from the boundary layer depends on the characteristics of the boundary layer. Figure 5 demonstrates the interaction of an inclined shock wave with a laminar boundary layer.
Figure 6 shows shadowgraph visualizations after the discharge ignition in quasi-steady flow. The sliding discharge propagates in the Z-axis direction perpendicular to the XY plane. The obtained results indicated that the structure of the supersonic flow has a distinct influence on the mode of nanosecond surface sliding discharge. It was found that the spatial position and dimensions of the discharge channel are particularly influenced by the location of area of intersection of the inclined shock wave with an upper boundary layer. The discharge current and spectrum of radiation also depend on the flow parameters [26,27].
Shadowgraphy imaging reveals a shock wave movement from the discharge channel. The induced shock wave velocity depends on the discharge current and the discharge areal dimensions. It was found that at the beginning of the motion, the shape of the shock wave front is close to semi-cylindrical. The shock wave moves in the flow direction and downward influencing the inclined and the reflected shock wave (Figure 6). The motion of the shock wave causes an unsteady change in the flow field. A thermal trace of the discharge channel caused by heating the near-surface layer with a large time scale influences the upper boundary layer (see also [21,23,32]). Flow disturbances in the channel persist for longer than 100 µs. After 100–150 μs the quasi-stationary flow pattern is restored (see Figure 6b).
The experimental images were processed to obtain information about the dynamics of the shock wave coming from the discharge channel. The vertical and horizontal displacements of the shock wave front were measured for 30 μs after the discharge.
The result of processing a sequence of experimental shadowgraph images at a flow Mach number of 1.40 is shown in Figure 7. The vertical and horizontal displacement of the induced shock wave was studied in detail. The vertical coordinate of the shock wave after the discharge changes over time linearly within 6–19 μs. The vertical velocity of the shock wave front in the first 6 μs is ~1300 m/s, then it decreases to 800 m/s for 10 µs.

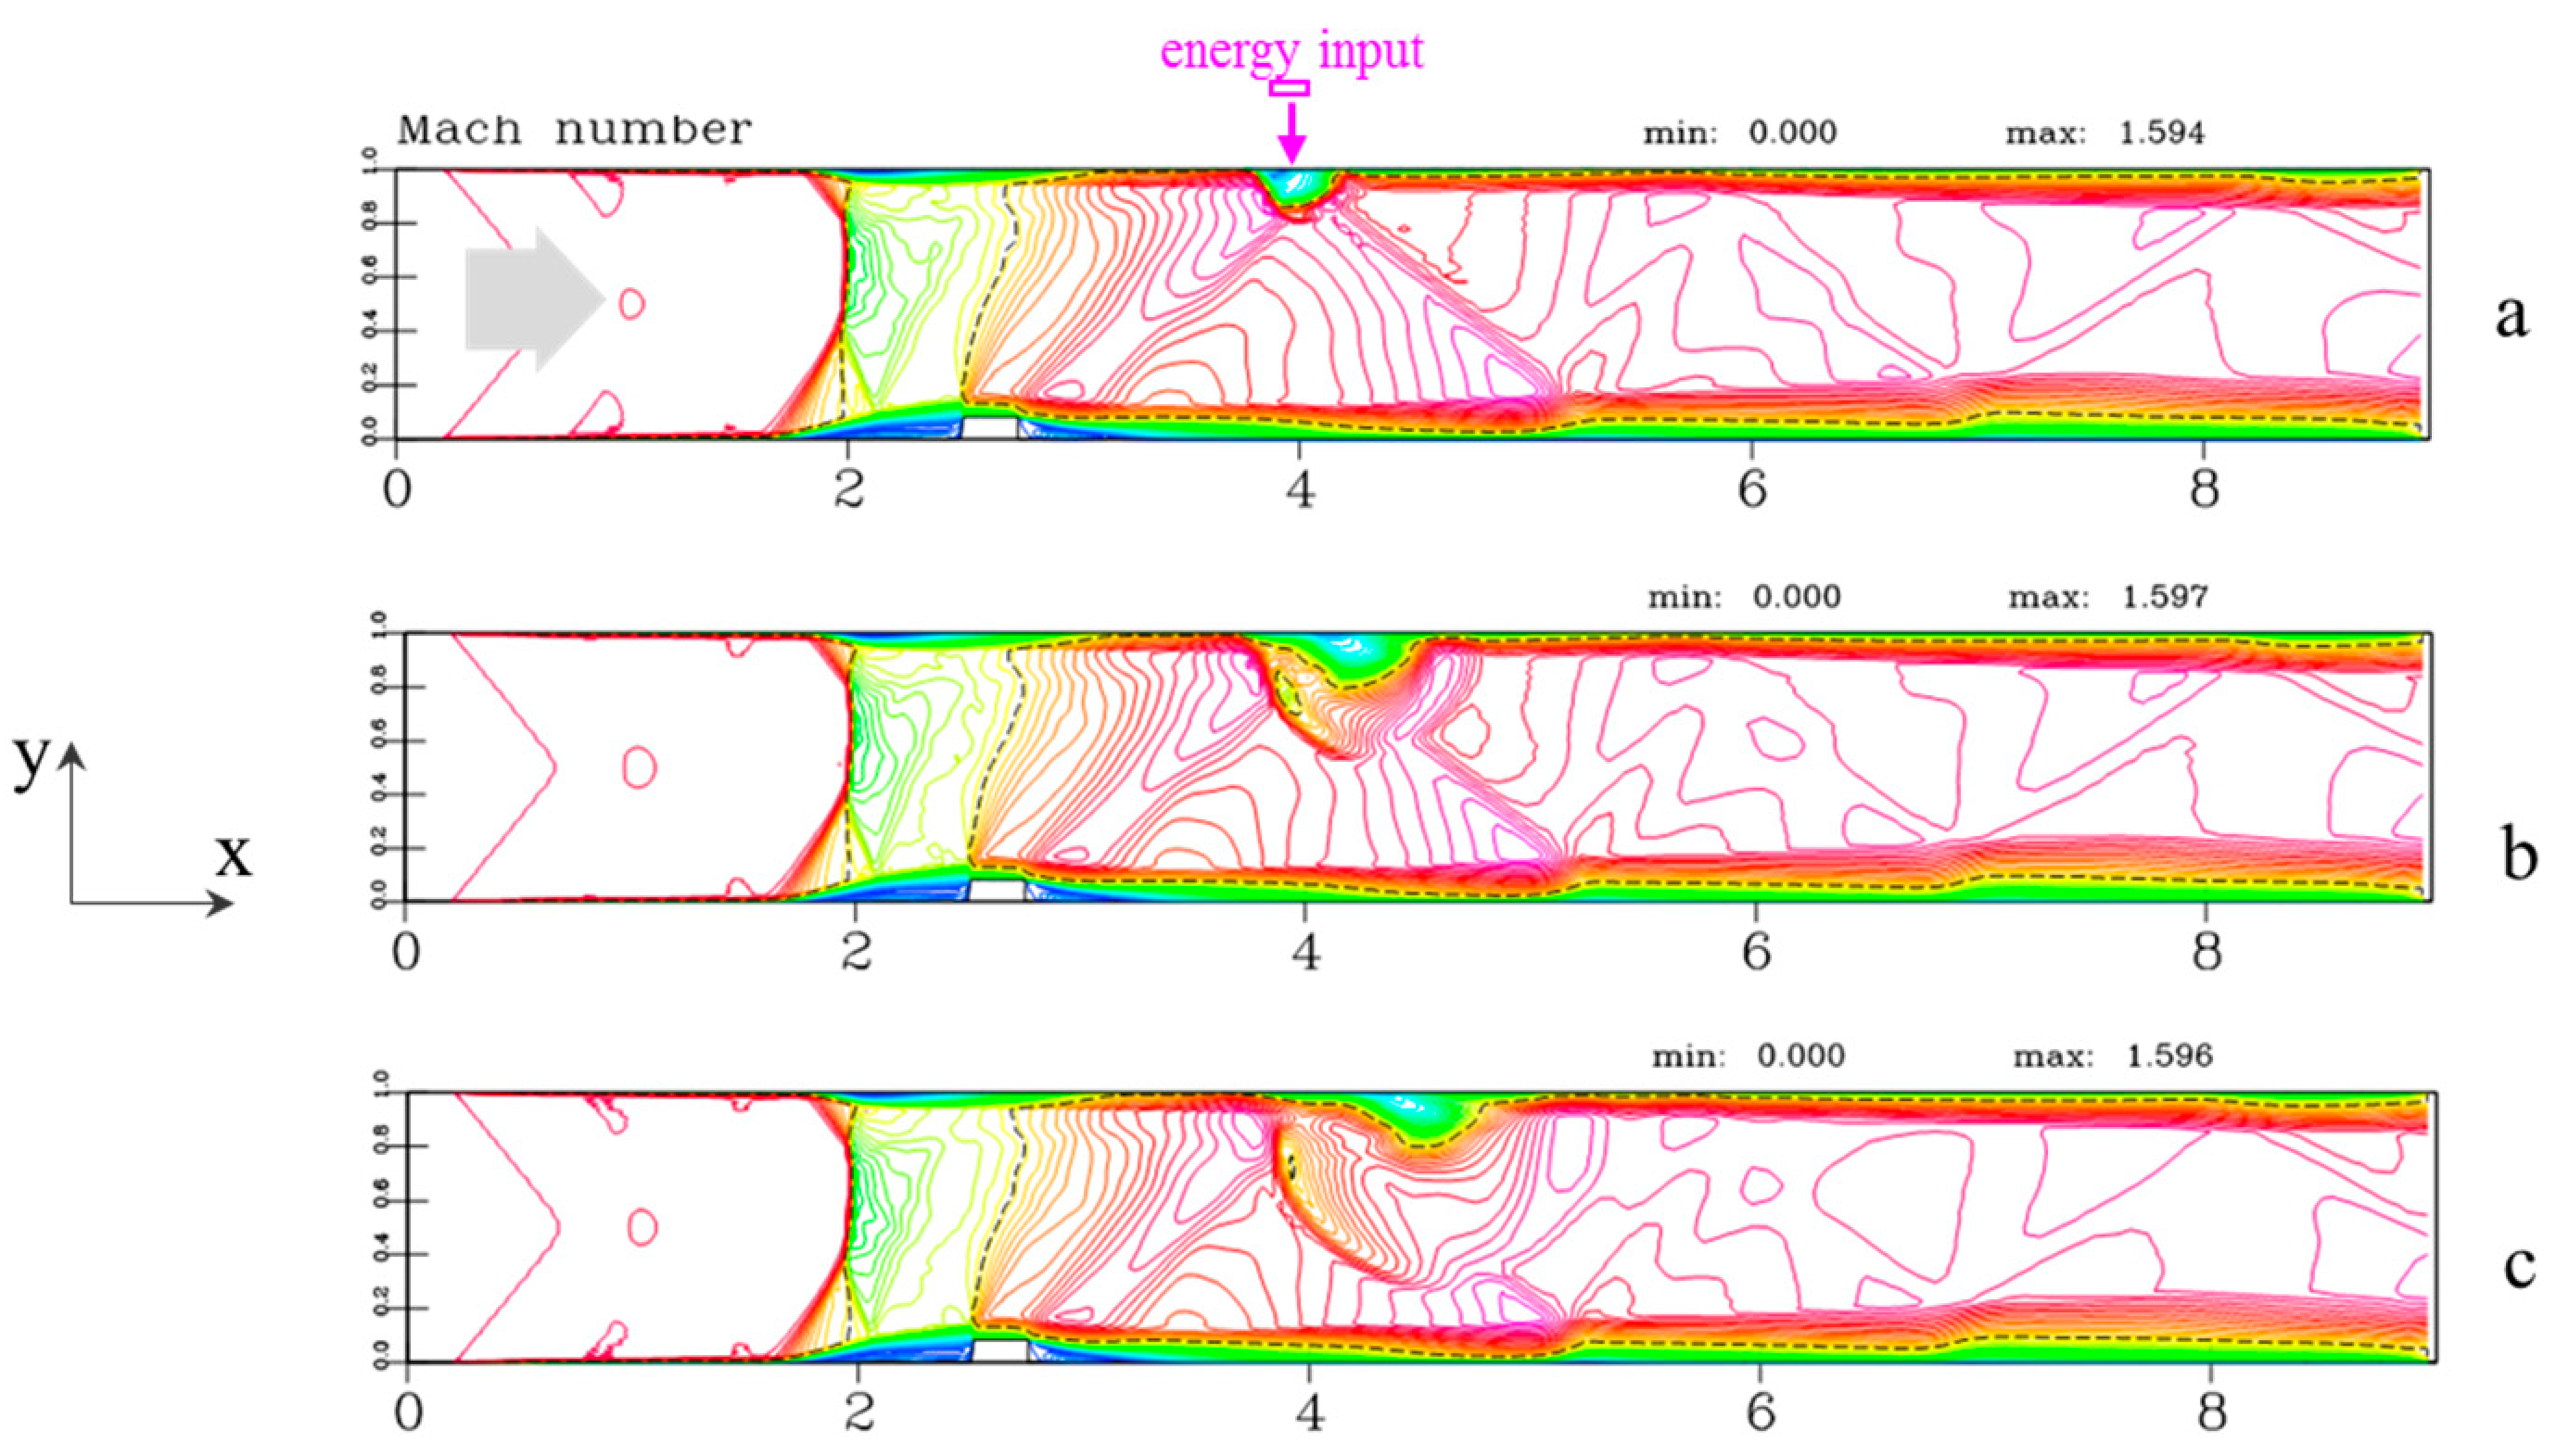
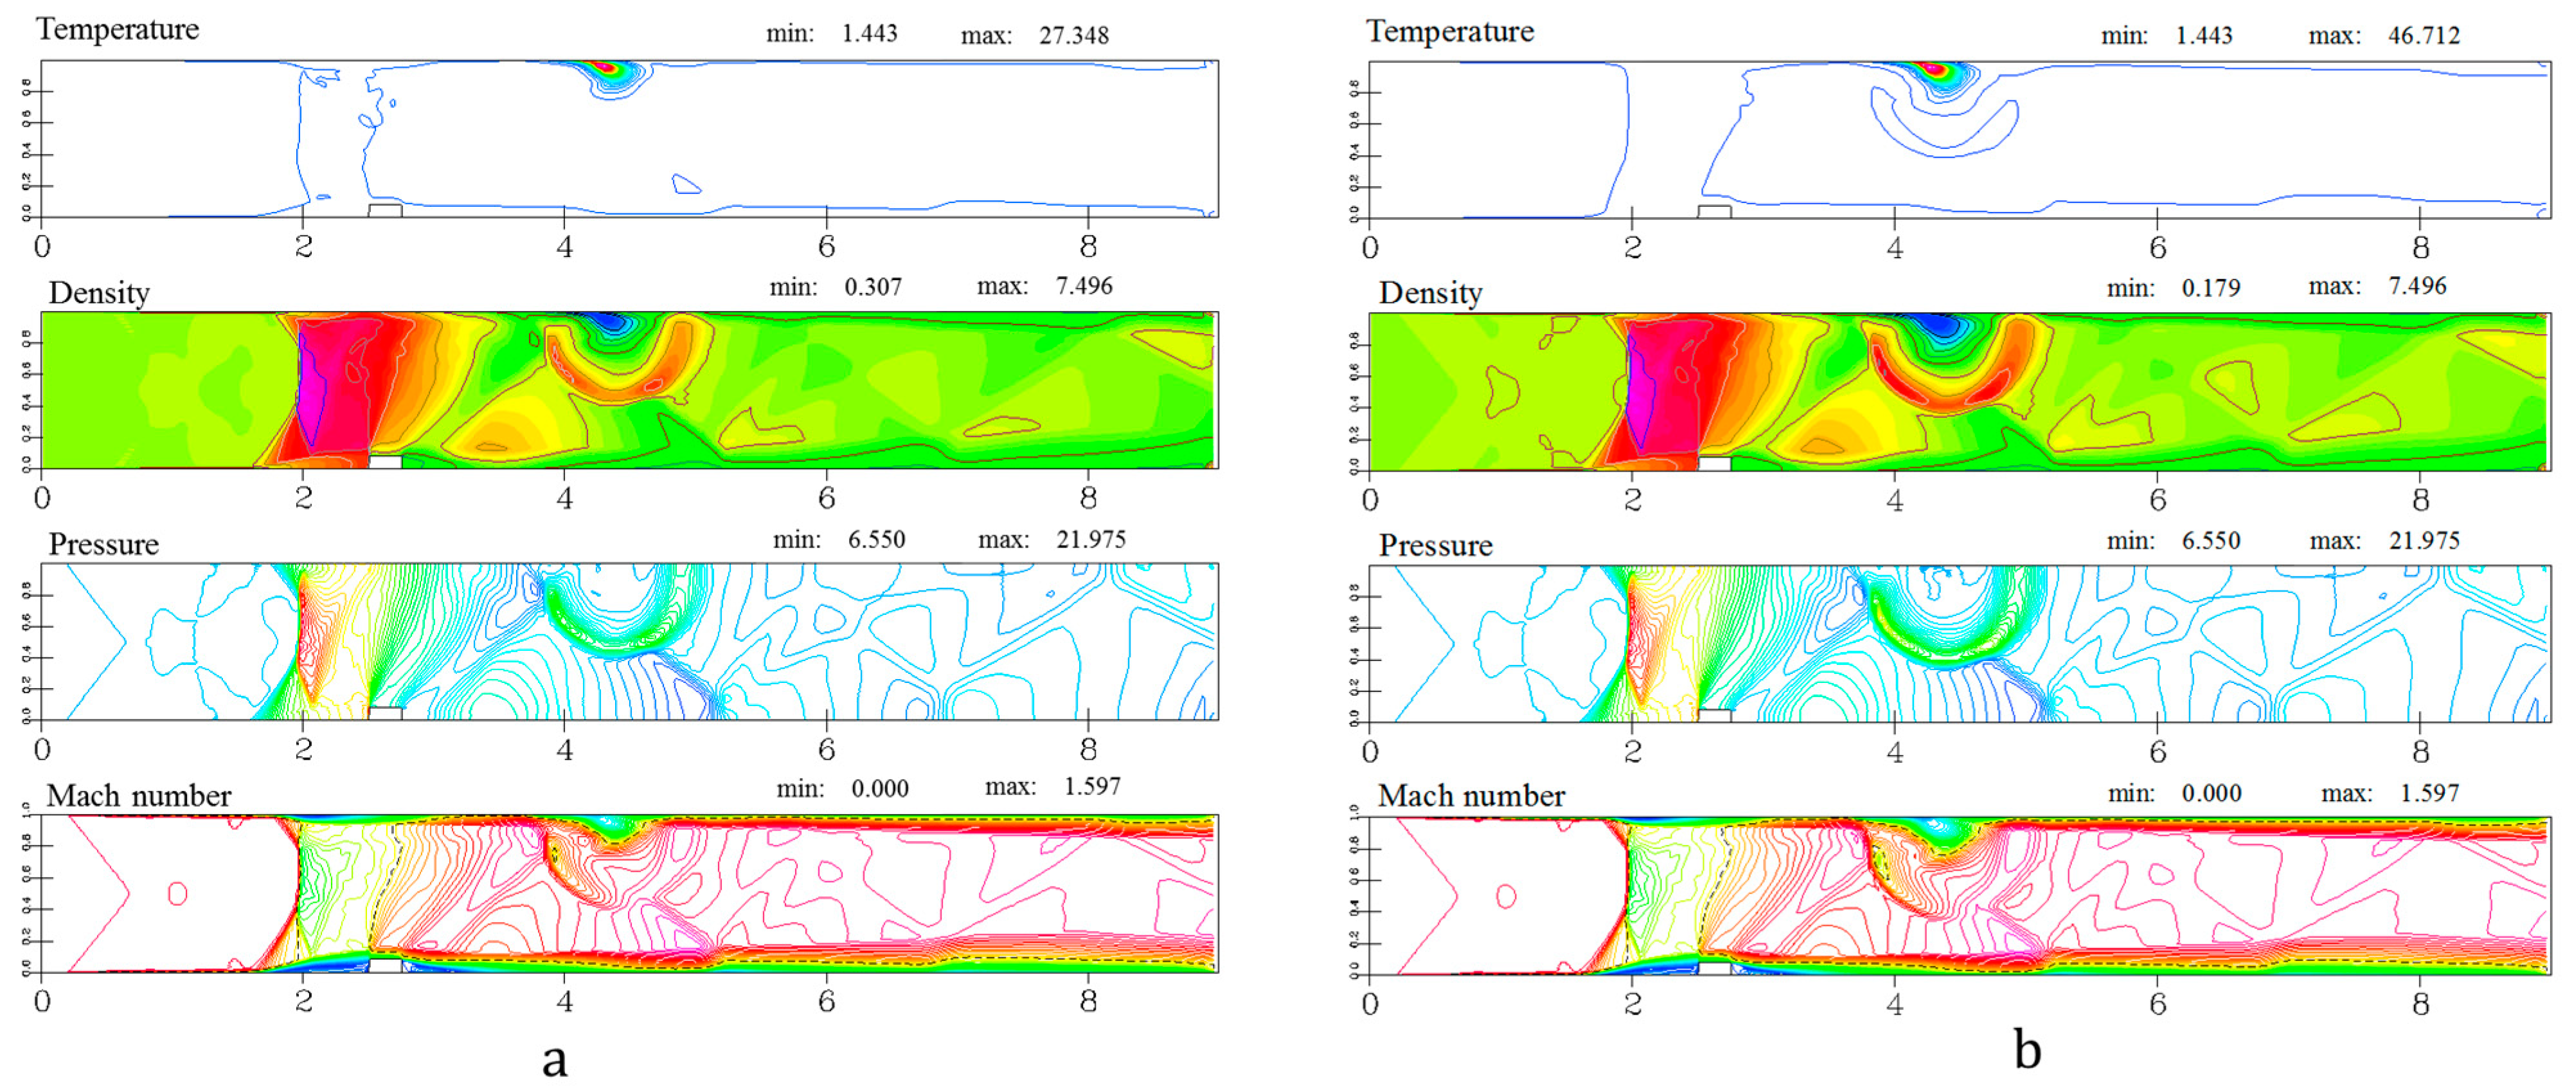
4.2. Computational Analysis

As a result of the simulations, the density flow fields were determined with the regions of increased and reduced density (Figure 8). The low-density regions are formed under the interaction of inclined shock waves with boundary layers [16,21,26,27]. Low-density regions can be formed with or without flow separation [27]. Figure 8b shows the enlarged near-wall flow region of 5 × 12 mm2 in size. The low-density region on the upper wall of 5–20 mm long and ~1 mm thick is at 25–45 mm from the obstacle. The discharge channel develops in this region of reduced density on the upper wall as shown by experiments.
Since the shape of the discharge channel in the experiments is close to rectilinear, it can operate as a line source of heat. Therefore, a two-dimensional simulation was carried out with a local supply of energy to the flow near the wall (Figure 9 and Figure 10). The purpose of the simulations was to determine the dynamics of the shock wave after a pulse energy supply into near-surface flow. The first stage of modeling includes the movement of a shock wave through the computational domain and the diffraction on the obstacle up to steady supersonic flow (see Figure 4d). The second stage includes the energy release in a small volume near the surface, simulating the discharge channel (Figure 9 and Figure 10). An energy input was specified near the surface into a volume in the form of a rectangular parallelepiped. The parallelepiped was 30 mm long, 0.5–2.0 mm high, and 1–3 mm wide (z × y × x, Figure 9a). Power of the full single plasma channel was constant. In this formulation, the calculated shock wave corresponds to the semi-cylindrical wave up to 5 microseconds after the energy input.
The deposition of energy into the volume was 0.14–0.43 J. The options for energy input were varied so that the front shape and the dynamics of the motion of the simulated shock wave corresponded to experimental data (see Figure 7 and Figure 10). The simulated fields of temperature, density, pressure, and local Mach number are shown in Figure 10 for two different energy input values. The intensity and velocity of shock waves were determined by the specific energy input and the duration of the energy input. At a constant volume of the energy deposition zone, as the energy increases, the shock wave velocity becomes higher. It can be seen from Figure 10 that the shock wave front changes with time. A local subsonic zone is formed near the region of energy deposition. A limited heat exchange results in a high temperature in the zone of low density. The shock wave dynamics generated by the pulse energy input were further studied by numerical simulation at different flow parameters.
The results of the calculation were compared the measured and calculated shock wave positions and configurations. Figure 7 and Figure 10 show a good agreement between the experimental and simulated shapes and positions of shock waves. Calculated dependences of the vertical coordinate of the shock wave on time were obtained for various regimes of energy input. The vertical motion of the shock wave corresponds to the simulation at an energy of 0.25 ± 0.04 J (Figure 7), as shown by comparing the results of simulation and experiment after the energy input. Under the experimental conditions, the specific energy input is 35% ± 5% of the electric energy of the discharge.

5. Conclusions

The results of an experimental study and numerical modeling characterizing the influence of surface sliding discharge on the flow with an inclined shock wave in the rectangular channel were presented. Experimental investigation was carried out in air at Mach numbers of supersonic flows of 1.20–1.68. The shock wave structure of a supersonic flow in the channel of a shock tube with an obstacle as well as the structure of the region of interaction of an oblique shock wave with a boundary layer were determined.
A surface sliding discharge with a duration ~500 ns was initiated in the discharge chamber at 25 kV voltage pulse, ~1 kA current. The localized discharge channel generated a shock wave, the movement of which led to a change in the spatial structure of a supersonic flow. High-speed shadowgraphy showed that the shock wave generated by the discharge channel can influence the supersonic airflow longer than 100 μs, producing non-stationary action on the boundary layer. It was established that the near-wall thermal layer, produced with the discharge channel, also influences the boundary layer. Thus, the generation of a surface sliding discharge of nanosecond duration in a supersonic airflow leads to prolonged change in the flow field. In this study, we focused on shock wave dynamics. Accurate measurement of the shock wave position in time and comparing to the numerical simulations made it possible to estimate the thermal energy released in the discharge channel within 0.22–0.29 J.
In conclusion, the results of the study showed that the nanosecond surface sliding discharge in the supersonic airflow leads to a significant change in the flow field downstream from the discharge due to the motion of the shock wave. The shock wave generated by a localized discharge channel would be important for high-speed flow control. Further work may focus on accurately simulating induced shock wave interaction with an inclined shock wave and with boundary layers. The results obtained can be useful for plasma flow control, for example, in supersonic air intakes and jet engines that can contain oblique-angled shock waves.

Author Contributions

Conceptualization, I.V.M.; methodology, I.V.M. and I.E.I.; software, I.E.I. and I.A.K.; validation, I.E.I. and I.A.K.; formal analysis, I.V.M., I.E.I. and Y.L.; investigation, I.V.M. and Y.L.; data curation, Y.L. and I.E.I.; writing—original draft preparation, I.V.M.; writing—review and editing, I.V.M.; visualization, I.E.I. and Y.L.; supervision, I.V.M.; project administration, I.V.M. All authors have read and agreed to the published version of the manuscript.

Funding

This research received no external funding.

Institutional Review Board Statement

Not applicable.

Informed Consent Statement

Not applicable.

Conflicts of Interest

The authors declare no conflict of interest.

References

  1. Starikovskiy, A.Y.; Aleksandrov, N.L. Gasdynamic flow control by ultrafast local heating in a strongly nonequilibrium pulsed plasma. Plasma Phys. Rep. 2021, 47, 148–209. [Google Scholar] [CrossRef]
  2. Komuro, A.; Takashima, K.; Suzuki, K.; Kanno, S.; Nonomura, T.; Kaneko, T.; Ando, A.; Asai, K. Gas-heating phenomenon in a nanosecond pulse discharge in atmospheric-pressure air and its application for high-speed flow control. Plasma Sources Sci. Technol. 2018, 27, 104005. [Google Scholar] [CrossRef]
  3. Sugimoto, K.; Ogata, S. Highly responsive multi-flow pattern generation by multi-electrode plasma actuator using a single power supply. J. Phys. D Appl. Phys. 2022, 55, 105201. [Google Scholar] [CrossRef]
  4. Rodrigues, F.F.; Pascoa, J.C.; Trancossi, M. Experimental analysis of dielectric barrier discharge plasma actuators thermal characteristics under external flow influence. J. Heat Transf. 2018, 140, 102801. [Google Scholar] [CrossRef]
  5. Ukai, T.; Kontis, K. Thermal Fluctuation Characteristics around a Nanosecond Pulsed Dielectric Barrier Discharge Plasma Actuator using a Frequency Analysis based on Schlieren Images. Energies 2020, 13, 628. [Google Scholar] [CrossRef] [Green Version]
  6. Mursenkova, I.V.; Znamenskaya, I.A.; Lutsky, A.E. Influence of shock waves from plasma actuators on transonic and supersonic airflow. J. Phys. D Appl. Phys. 2018, 51, 105201. [Google Scholar] [CrossRef]
  7. Moreau, E.; Bayoda, D.; Benard, N. Streamer propagation and pressure waves produced by a nanosecond pulsed surface sliding discharge: Effect of the high-voltage electrode shape. J. Appl. Phys. 2021, 54, 075207. [Google Scholar] [CrossRef]
  8. Mehdi, G.; Bonuso, S.; De Giorgi, M.G. Effects of Nanosecond Repetitively Pulsed Discharges Timing for Aeroengines Ignition at Low Temperature Conditions by Needle-Ring Plasma Actuator. Energies 2021, 14, 5814. [Google Scholar] [CrossRef]
  9. Elliott, S.; Firsov, A.A.; Leonov, S.B. Oblique shock wave reflection at plasma array presence. In Journal of Physics: Conference Series; IOP Publishing: Bristol, UK, 2021; Volume 2100, p. 012008. [Google Scholar]
  10. Wei, X.; Zhenbing, L.; Yan, Z.; Tianxiang, G.; Yun, W.; Qiu, W. Experimental study on shock wave control in high-enthalpy hypersonic flow by using SparkJet actuator. Acta Astronaut. 2021, 188, 416–425. [Google Scholar] [CrossRef]
  11. Mursenkova, I.V.; Sazonov, A.S.; Liao, Y. The effect of pulsed sliding surface discharges on supersonic airflow past a thin wedge in shock tube. Tech. Phys. Lett. 2018, 44, 157–159. [Google Scholar] [CrossRef]
  12. Bocharov, A.N.; Mareev, E.A.; Popov, N.A. Numerical simulation of high-current pulsed arc discharge in air. J. Phys. D Appl. Phys. 2022, 55, 115204. [Google Scholar] [CrossRef]
  13. Kazanskiy, P.; Kotvitskii, A.; Moralev, I. Three-Dimensional Flow Structure in the Vicinity of the Pulsed Surface Arc Discharge in a Magnetic Field. Tech. Phys. Lett. 2021, 47, 565–568. [Google Scholar] [CrossRef]
  14. Znamenskaya, I.A.; Ivanov, I.E.; Orlov, D.M.; Sysoev, N.N. Pulsed action on a shock wave in the case of self-localized high-current surface discharge in front of the shock-wave front. Dokl. Phys. 2009, 54, 107–110. [Google Scholar] [CrossRef]
  15. Znamenskaya, I.A.; Latfullin, D.F.; Lutskiĭ, A.E.; Mursenkova, I.V. Energy deposition in boundary gas layer during initiation of nanosecond sliding surface discharge. Tech. Phys. Lett. 2010, 36, 795. [Google Scholar] [CrossRef]
  16. Saveliev, A.S. 2D simulation of interaction between separation region and gasdynamic perturbation caused by rapid heat release in supersonic airflow. In Journal of Physics: Conference Series; IOP Publishing: Bristol, UK, 2020; Volume 1698, p. 012007. [Google Scholar]
  17. Raizer, Y.P.; Allen, J.E. Gas Discharge Physics; Springer: Berlin, Germany, 1991. [Google Scholar]
  18. Liao, Y.; Mursenkova, I.V.; Ivanov, I.E.; Znamenskaya, I.A.; Sysoev, N.N. Shock waves generated by a pulsed surface sliding discharge in a supersonic airflow past a wedge. Phys. Fluids 2020, 32, 106108. [Google Scholar] [CrossRef]
  19. Ninni, D.; Bonelli, F.; Colonna, G.; Pascazio, G. Unsteady behavior and thermochemical non equilibrium effects in hypersonic double-wedge flows. Acta Astronaut. 2022, 191, 178–192. [Google Scholar] [CrossRef]
  20. Colonna, G.; Pascazio, G.; Bonelli, F. Advanced model for the interaction of a Ti plume produced by a ns-pulsed laser in a nitrogen environment. Spectrochim. Acta Part B At. Spectrosc. 2021, 179, 106120. [Google Scholar] [CrossRef]
  21. Georgievskiy, P.Y.; Levin, V.A.; Sutyrin, O.G. Spatial effects of interaction of a shock with a lateral low-density gas channel. Tech. Phys. Lett. 2018, 44, 905–908. [Google Scholar] [CrossRef]
  22. Azarova, O.A.; Lapushkina, T.A.; Krasnobaev, K.V.; Kravchenko, O.V. Redistribution of Energy during Interaction of a Shock Wave with a Temperature Layered Plasma Region at Hypersonic Speeds. Aerospace 2021, 8, 326. [Google Scholar] [CrossRef]
  23. Luo, Y.; Liang, H.; Li, J.; Guo, S.; Tang, M.; Kong, W. Experimental investigation of incident shock wave/boundary layer interaction controlled by pulsed spark discharge array. Exp. Therm. Fluid Sci. 2022, 132, 110515. [Google Scholar] [CrossRef]
  24. Koroteeva, E.; Mursenkova, I.; Liao, Y.; Znamenskaya, I. Simulating particle inertia for velocimetry measurements of a flow behind an expanding shock wave. Phys. Fluids 2018, 30, 011702. [Google Scholar] [CrossRef] [Green Version]
  25. Höft, H.; Becker, M.M.; Kettlitz, M. Impact of gas flow rate on breakdown of filamentary dielectric barrier discharges. Phys. Plasmas 2016, 23, 033504. [Google Scholar] [CrossRef]
  26. Mursenkova, I.V.; Liao, Y.; Ulanov, P.Y.; Shi, L. High-Speed Shadowgraphy of the Interaction of an Oblique Shock Wave in a Channel with a Surface Sliding Discharge. Sci. Vis. 2021, 13, 47–57. [Google Scholar] [CrossRef]
  27. Mursenkova, I.; Sazonov, A.; Liao, Y.; Ivanov, I. Visualization of the interaction region of an oblique shock wave with a boundary layer by the radiation of a nanosecond surface sliding discharge. Sci. Vis. 2019, 11, 76–87. [Google Scholar] [CrossRef]
  28. Znamenskaya, I.A.; Latfullin, D.F.; Mursenkova, I.V. Laminar-Turbulent Transition in a Supersonic Boundary Layer during Initiation of a Pulsed Surface Discharge. Tech. Phys. Lett. 2008, 34, 668–670. [Google Scholar]
  29. Dussauge, J.P.; Piponniau, S. Shock/boundary-layer interactions: Possible sources of unsteadiness. J. Fluids Struct. 2008, 24, 1166–1175. [Google Scholar] [CrossRef]
  30. Glushko, G.S.; Ivanov, I.E.; Kryukov, I.A. Computational method for turbulent supersonic flows. Math. Model. Comput. Simul. 2010, 2, 407–422. [Google Scholar] [CrossRef]
  31. Ivanov, I.E.; Kryukov, I.A. Numerical study of ways to prevent side loads in an over–expanded rocket nozzles during the launch stage. Acta Astronaut. 2019, 163, 196–201. [Google Scholar] [CrossRef]
  32. Correale, G.; Michelis, T.; Ragni, D.; Kotsonis, M.; Scarano, F. Nanosecond-pulsed plasma actuation in quiescent air and laminar boundary layer. J. Phys. D Appl. Phys. 2014, 47, 105201. [Google Scholar] [CrossRef]
Figure 1. Scheme of the experimental setup: (1) shock tube; (2) discharge chamber; (3) flow direction; (4–6) pressure sensors; (7) oscilloscope; (8) high-voltage block; (9) delay generator; (10) photo camera; (11) high-speed camera/ICCD camera, (12) optical shadowgraphy system; (13) PC. Arrows indicate the flow direction.
Energies 15 02189 g001
Figure 2. Schematic of a shock wave pattern in the discharge chamber: (1) initial plane shock wave; (2) co-current flow direction; (3) quartz glass; (4) dielectric surface; (5) obstacle; (6) oblique shock wave; (7) reflected shock wave; (8) discharge channel.
Energies 15 02189 g002
Figure 3. (a) Electrode configuration of surface sliding discharge: 1—high-voltage electrode; 2—grounded electrode; 3—dielectric; C—capacitor; S—spark gap; U—high voltage; photo images of discharge in supersonic air flow with inclined shock wave (b,c) at flow Mach number 1.33 (b) and 1.55 (c). Air density is 0.10 kg/m3.
Energies 15 02189 g003
Figure 4. The flow fields of the local Mach number at the shock wave diffraction by an obstacle at 1 (a), 10 (b), 120 (c), 380 μs (d) after the contacting the obstacle (from top to bottom). Mach number of shock wave is 3.20, initial air density is 0.03 kg/m3. Arrows indicate the direction of incoming shock wave and the direction of co-current flow. Sonic lines (Ml = 1) are shown in dashed lines.
Energies 15 02189 g004
Figure 5. The shadowgraph image of quasi-stationary flow field 200 microseconds after the plane shock wave passed the obstacle. The Mach number of shock wave is 3.37; initial air density is 0.02 kg/m3. The zero-time corresponds to the moment of contact of the incoming shock wave with the obstacle (yellow rectangular). Designations (numbers) as in Figure 1.
Energies 15 02189 g005
Figure 6. The sequences of shadowgraph images of the flow field after the discharge at flow Mach number 1.27 and 0.14 kg/m3 density (a) and at Mach number 1.30 and 0.11 kg/m3 density (b). The zero-time corresponds to the discharge initiation. The flow is from left to right.
Energies 15 02189 g006
Figure 7. Dependence of the vertical coordinate of the shock wave front on time yf after the energy input: symbols (1)—experiment; lines (2–4)—simulations: (2) 500 ns duration, 0.22 J energy, 60 mm3 volume; (3) 600 ns, 0.29 J, 90 mm3; (4) 800 ns, 0.29 J, 60 mm3. Flow Mach number is 1.40. The zero-time corresponds to the beginning of energy input.
Energies 15 02189 g007
Figure 8. Simulated flow density field (a) and the enlarged fragment (b). The flow Mach number is 1.40. Designations (numbers) as in Figure 1.
Energies 15 02189 g008
Figure 9. The Mach number field after the energy input in simulations at times 2.5 μs (a), 10 μs (b), 20 μs (c). The energy input is 0.29 J. The energy input volume is 90 mm3; the total time of the energy input is 600 ns. The Mach number of the incoming flow is 1.40. The zero-time corresponds to the beginning of energy input. Sonic lines (Ml = 1) are shown in dashed lines.
Energies 15 02189 g009
Figure 10. The simulated fields of dimensionless temperature, density, pressure, and local Mach number (from top to bottom) 16 μs after the energy input: 0.22 J (a) and 0.29 J (b). The energy input volume is 60 mm3; the total time of the energy input is 600 ns. The flow Mach number is 1.40. The zero-time corresponds to the beginning of energy input. The temperature is normalized to a temperature of 293 K and the pressure is normalized to an initial pressure of 8.3 × 10³ Pa. Density is given in kg/m3.
Energies 15 02189 g010
Publisher’s Note: MDPI stays neutral with regard to jurisdictional claims in published maps and institutional affiliations.

