Article

Hybrid Energy System Model in Matlab/Simulink Based on Solar Energy, Lithium-Ion Battery and Hydrogen

Faculty of Computer Science, Electrical Engineering and Mathematics, Electrical Energy Technology-Sustainable Energy Concepts (EET-NEK), Paderborn University, Warburger Str. 100, 33098 Paderborn, Germany
*
Author to whom correspondence should be addressed.
Energies 2022, 15(6), 2201; https://doi.org/10.3390/en15062201
Submission received: 14 February 2022 / Revised: 5 March 2022 / Accepted: 10 March 2022 / Published: 17 March 2022
(This article belongs to the Special Issue Sustainable Energy Concepts for Energy Transition)

Abstract

:
In this work, a model of an energy system based on photovoltaics as the main energy source and a hybrid energy storage consisting of a short-term lithium-ion battery and hydrogen as the long-term storage facility is presented. The electrical and the heat energy circuits and resulting flows have been modelled. Therefore, the waste heat produced by the electrolyser and the fuel cell have been considered and a heat pump was considered to cover the residual heat demand. The model is designed for the analysis of a whole year energy flow by using a time series of loads, weather and heat profile as input. This paper provides the main set of equations to derive the component properties and describes the implementation into MATLAB/Simulink. The novel model was created for an energy flow simulation over one year. The results of the simulation have been verified by comparing them with well-established simulation results from HOMER Energy. It turns out that the novel model is well suited for the analysis of the dynamic system behaviour. Moreover, different characteristics to achieve an energy balance, an ideal dimensioning for the particular use case and further research possibilities of hydrogen use in the residential sector are covered by the novel model.

1. Introduction

Due to the rapidly increasing global warming issues caused by the emission of greenhouse gases into the atmosphere from burning oil, gas and coal, there is a need for alternative technologies to satisfy the world’s energy demand, with the focus now being shifted to environmentally friendly technologies [1]. One promising approach for the success of the energy change can be hydrogen, when it is produced by renewable energy sources (RES) [2].
While hydrogen is already being used in the mobility sector [3], it is as yet to be employed within the residential sector. This sector is responsible for 26.5% of the total energy demand in Germany which is predominantly covered by fossil energy sources [4,5]. Moreover, the highest energy demand in Germany occurs during winter which coincides with low photovoltaic (PV) generation. This leads to the necessity of long-term energy storage systems such as hydrogen, which are charged during the summer by usage of high excess energy produced, for example, via PV.
PV is already widely installed, as more than 1.7 million PV systems have been installed in Germany as of the end of 2020 [6]. However, the degree of PV autoconsumption is around 35% on average due to the volatility of the energy production [7]. The residual energy is fed into the external energy grid. Nonetheless, the high number of PV systems installed with grid connections leads to a burden of the grids during periods with high PV overproduction (e.g., on midday in summer), which becomes even more critical as the number of PV systems increases. This phenomenon contributes to the slow expansion of renewable energy systems in Germany: An increase in the share of renewable energy with grid connection implies further investment from grid operators in additional transmission and distribution capacity as well as in grid stabilising measures [8]. Since the implementation of such measures is very time consuming, short-term solutions are preferable.
With the increase of renewable energy share, a transition from a predominantly centralised to a decentralised energy supply is performed [9]. Not only decentralised production but also decentralised long-term energy storage should be considered to reduce the necessity of grid expansion. A degree of self-sufficiency of up to 100% by usage of decentralised long-term storages would lead to an expansion of PV systems which are not influenced by these constraints. However, the intermittent nature and the uncertainty of production of RES necessitates the usage of efficient and sufficient seasonal storage systems in order to store the overproduction for use during periods of low energy production [10]. Hydrogen is especially well suited for long-term energy storage due to its inherent high energy density and its long lifetime as a storage device (compared to batteries) [11].
In literature, some research has already been carried out on this topic but with a focus on specific partial aspects of hybrid, hydrogen-based energy systems. In [12], the authors presented a hybrid energy system including RES as energy supply, an alkaline electrolyser, a proton exchange membrane fuel cell (PEMFC) and a hydrogen storage. They focused on the analysis of the system dynamics with the aim to improve self-sufficiency by reducing grid interaction. Within that energy system a Li-ion battery and a heating system have not been considered. Due to the lack of short-term energy storage, they used the hydrogen storage to store the amount of hydrogen produced by the electrolyser within one day and directly reconverted the hydrogen by usage of a fuel cell as soon as the energy production with RES was less than the energy demand. In [13], a Simulink model of an energy system consisting of a PV system, a PEM electrolyser and a hydrogen storage system has been presented. The model was created for the analysis of system dynamics and was therefore used for short-term analysis. It also did not consider a fuel cell and real load profiles. In [14], the authors compared different meta-heuristic methods to optimally design an isolated hydrogen-based microgrid. The model was good enough for energy evaluation. However, the model also did not consider short-term energy storage, which is important in terms of dealing with rapid load peaks for ensuring a high degree of self-sufficiency. In [15], a hydrogen-based energy system model created in Simulink was presented. The authors used a time horizon of 24 h with focus on the power management system and the control system. They analysed the suitability of a hydrogen-based energy system consisting of hydrogen as the only energy storage type for stand-alone systems. However, the load profile did not contain rapid peaks which should not be covered by a fuel cell in terms of lifetime [16]. In none of the literature found, with focus on hybrid, hydrogen-based energy systems, were the heating sector and thus the overall energy demand of a household considered. When dealing with the attempt to increase the self-sufficiency of a household, the heating system plays an important role, especially in terms of stand-alone systems which shall be fully supplied by RES. An energy system model including a hybrid energy storage consisting of a Li-ion battery and hydrogen has hardly been considered so far.
Within this paper, a model of a decentralised energy system whose energy demand is mainly covered via photovoltaics even during winter by including sufficient storage facilities is presented. The aim is to minimise the grid load by achieving low or even zero grid interaction, which is realised by the use of decentralised long-term energy storage. The model consists of an electrolyser, which produces hydrogen in case of PV overproduction (overproduction = present PV generation—autoconsumption), and the hydrogen is subsequently stored in a hydrogen tank via a compressor. If the energy demand exceeds the energy provided by the PV system, a fuel cell is used for reconversion of hydrogen. To guarantee fast reactions to rapid load changes and to avoid comparatively high energy losses that arise when only using hydrogen as a storage medium, the system has to be extended by a short-term lithium-ion battery. Such a system can provide autonomy for electricity over the whole year.
The model was created in Matlab/Simulink [
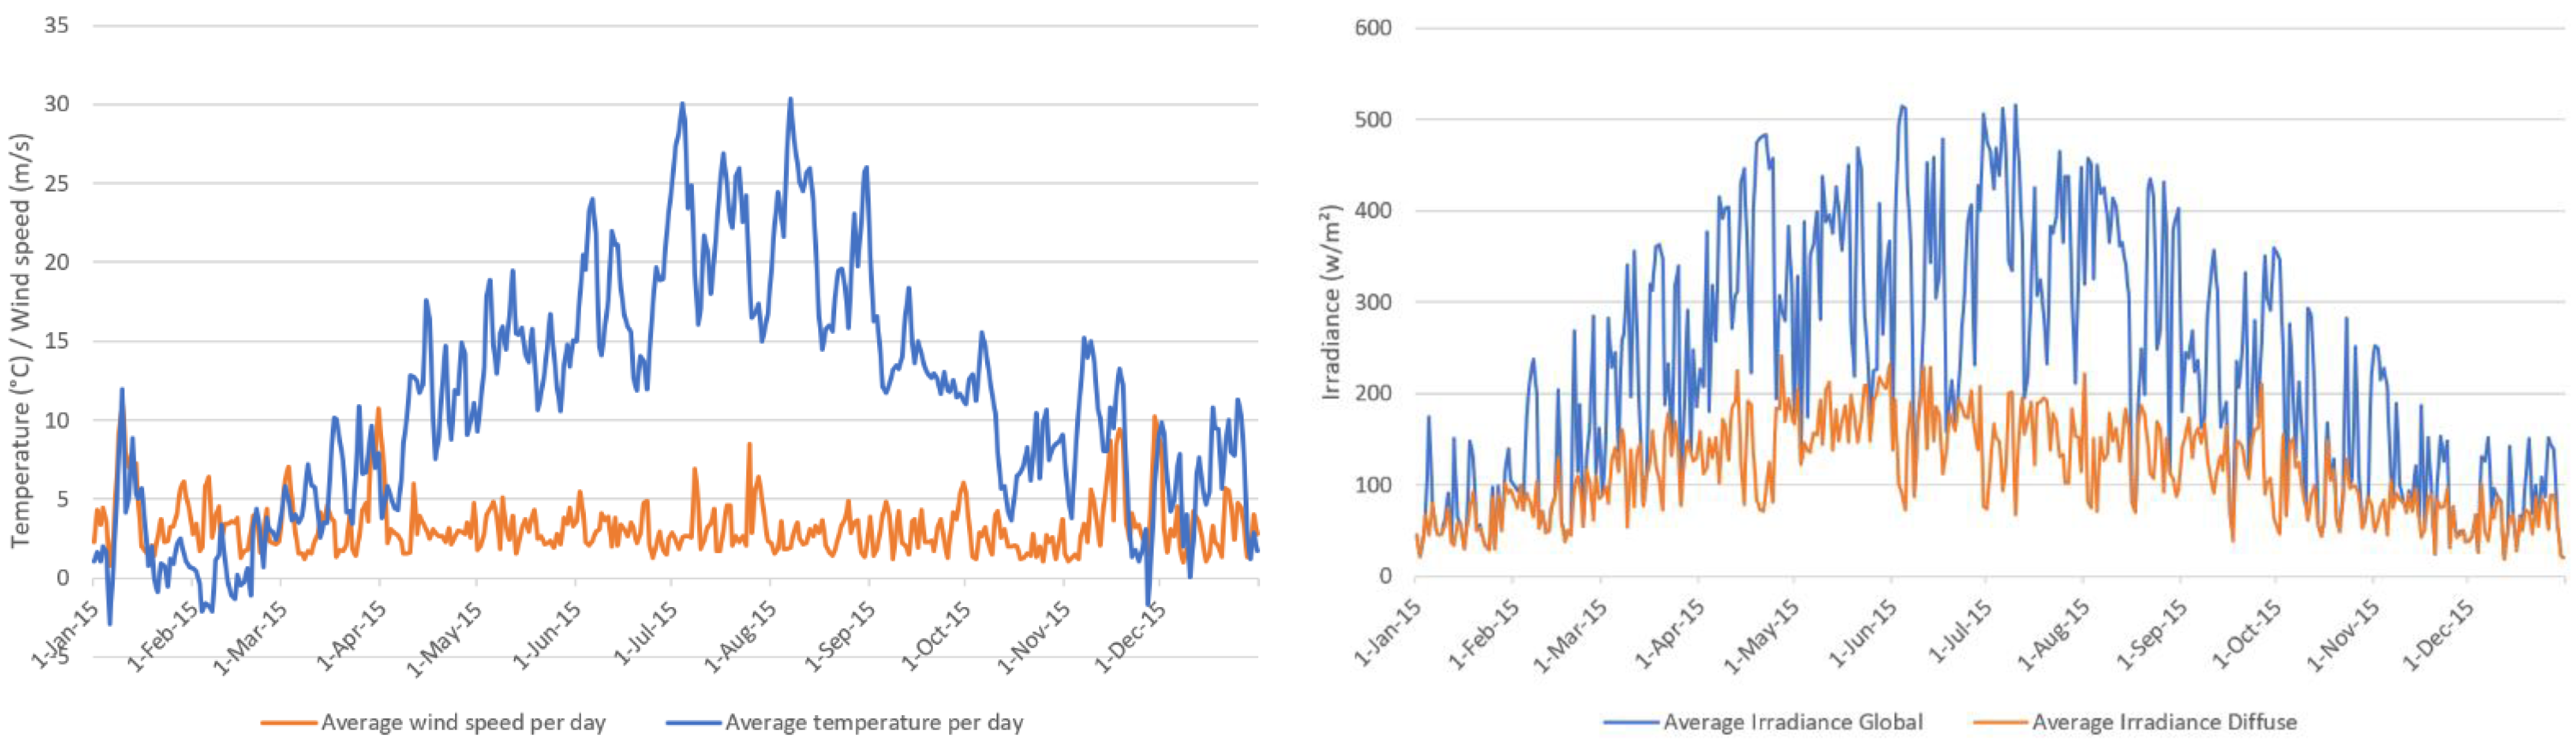
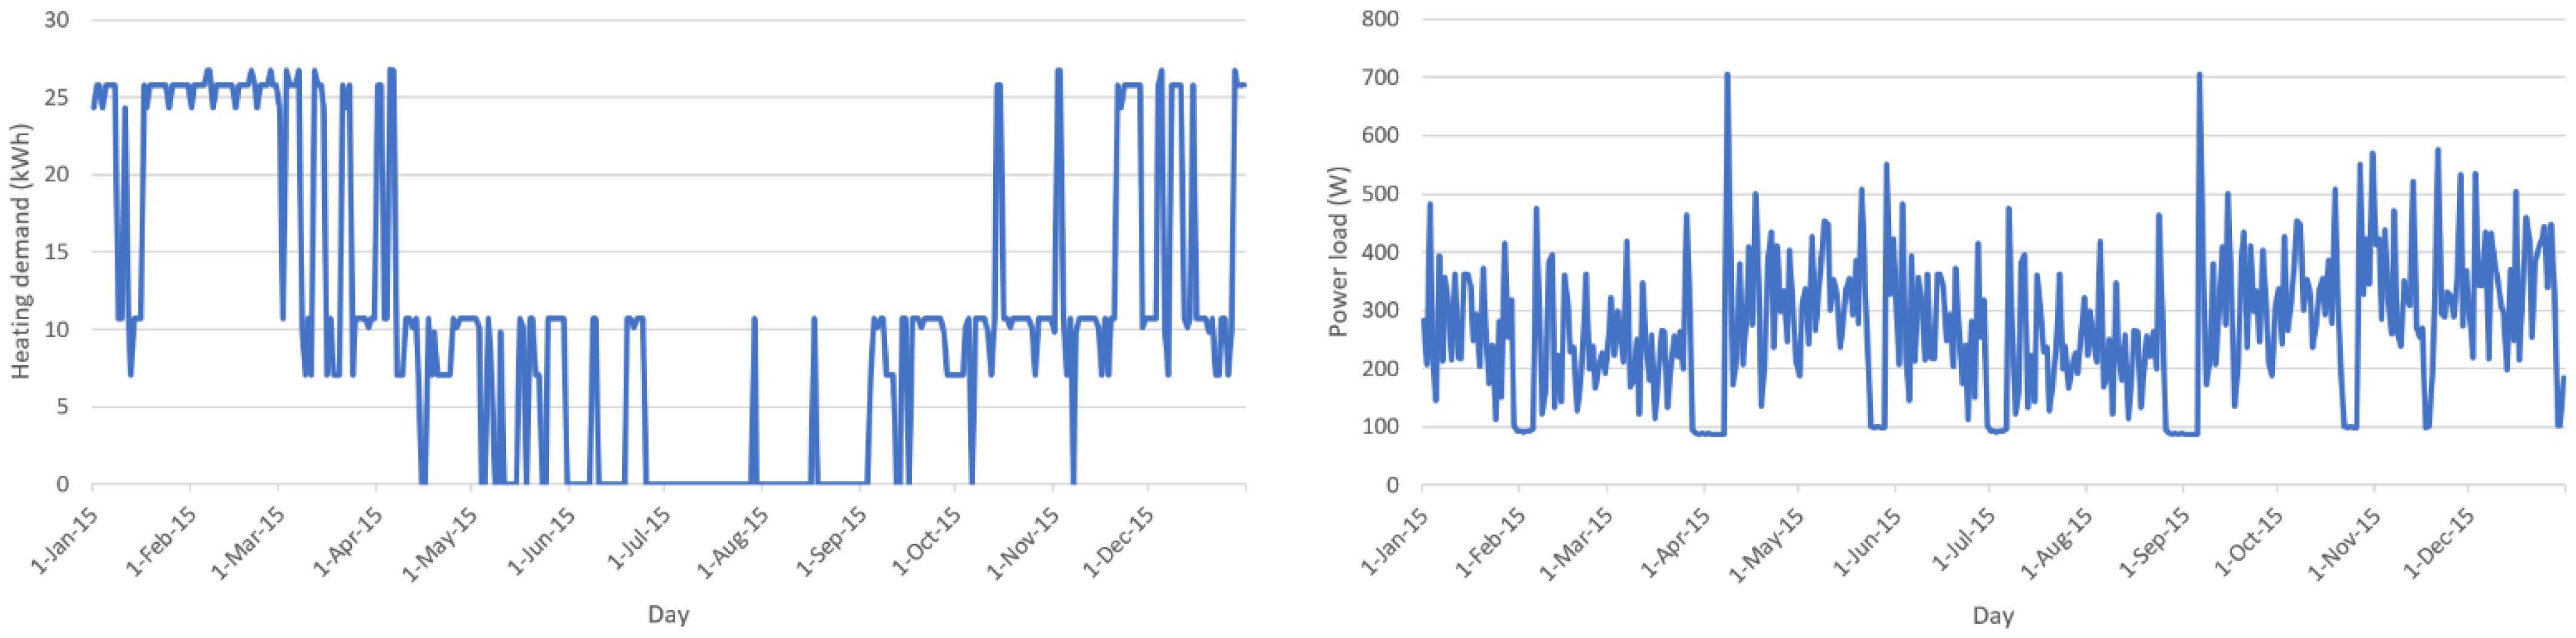
17] and was designed for the analysis of real data series over an entire year with a time resolution of 15 min. A representative dataset recorded in Switzerland in 2012 was used as the household load profile [18]. The load profile originally had a time resolution of one second which was converted to a time resolution of 15 min by averaging the values. The irradiance and temperature profile have been granted by the Deutscher Wetterdienst (DWD) with a time resolution of one hour [19]. The data used were recorded in 2015 in Wuerzburg (Germany). The given resolution was converted to a time resolution of 15 min using linear interpolation. As the heating system was also considered, a synthetic heat demand profile was generated using the reference load profiles from the VDI 4655 standard [20]. Using the temperature profile for 2015 and an Excel tool created by Hessen [21], which uses the reference load profiles from the VDI 6455 standard, a heating demand profile with a 15 min time resolution was generated.
This work shows the development of a model that has been designed to analyse the possibilities of a household system fully powered by a PV system considering hybrid energy storage composed of a lithium-ion battery and hydrogen. The focus of the research is based on the analysis of the kind and size of components required under different scenarios and an analysis as to what extent and under which conditions such a system is price-competitive with a conventional energy supply. The impact of different operating modes on the overall energy balance is also a subject of the investigation. Due to a time resolution of 15 min and a total timeframe of one year, a detailed analysis of the energy flows which is based on real data rather than synthetic profiles is possible.
The paper is organised as followed: Section 2 introduces the architecture of the entire energy system, Section 3 describes the model components mathematically and graphically and Section 4 specifies the configuration of the components used for the test case. In Section 5, the Simulink model is verified and compared to the results delivered by HOMER Energy Simulation [22] for the same system dimensioning and finally Section 6 concludes the findings.

2. Input Data

Figure 1 shows the weather data used as input for the simulation. The trend of the ambient temperature and the wind speed is shown in Figure 1 (left). The data have been averaged for every day within the applied time period to achieve a better visualisation of the trend. The temperature curve has an arithmetic mean of 11.07 °C and a standard deviation of 7.44. The wind speed trend is used for calculation of the probable cell temperature of the PV modules to achieve more realistic PV energy yields. The wind speed has an arithmetic mean of 3.26   m s and a standard deviation of 1.76. The curve of the global horizontal irradiance is shown in Figure 1 (right). The curve shows an irradiance value for every day, which was achieved by calculating the arithmetic mean of all sunshine hours within the specific day.
The heating demand depends on the actual ambient temperature within the time stamp. The heating demand curve of the whole year can be seen in Figure 2 (left). As can be seen in the figure, the heating demand is between 26.72 kWh per day (commonly during winter period) and 0 kWh (during summer period). The electrical load profile used for the simulation (Figure 2 (right)) has a base load of around 100 W, an arithmetic mean of 268.96 W and a standard deviation of 119.85. The base load is evident from time periods in which the residents were on holiday.

3. System Architecture and Control System

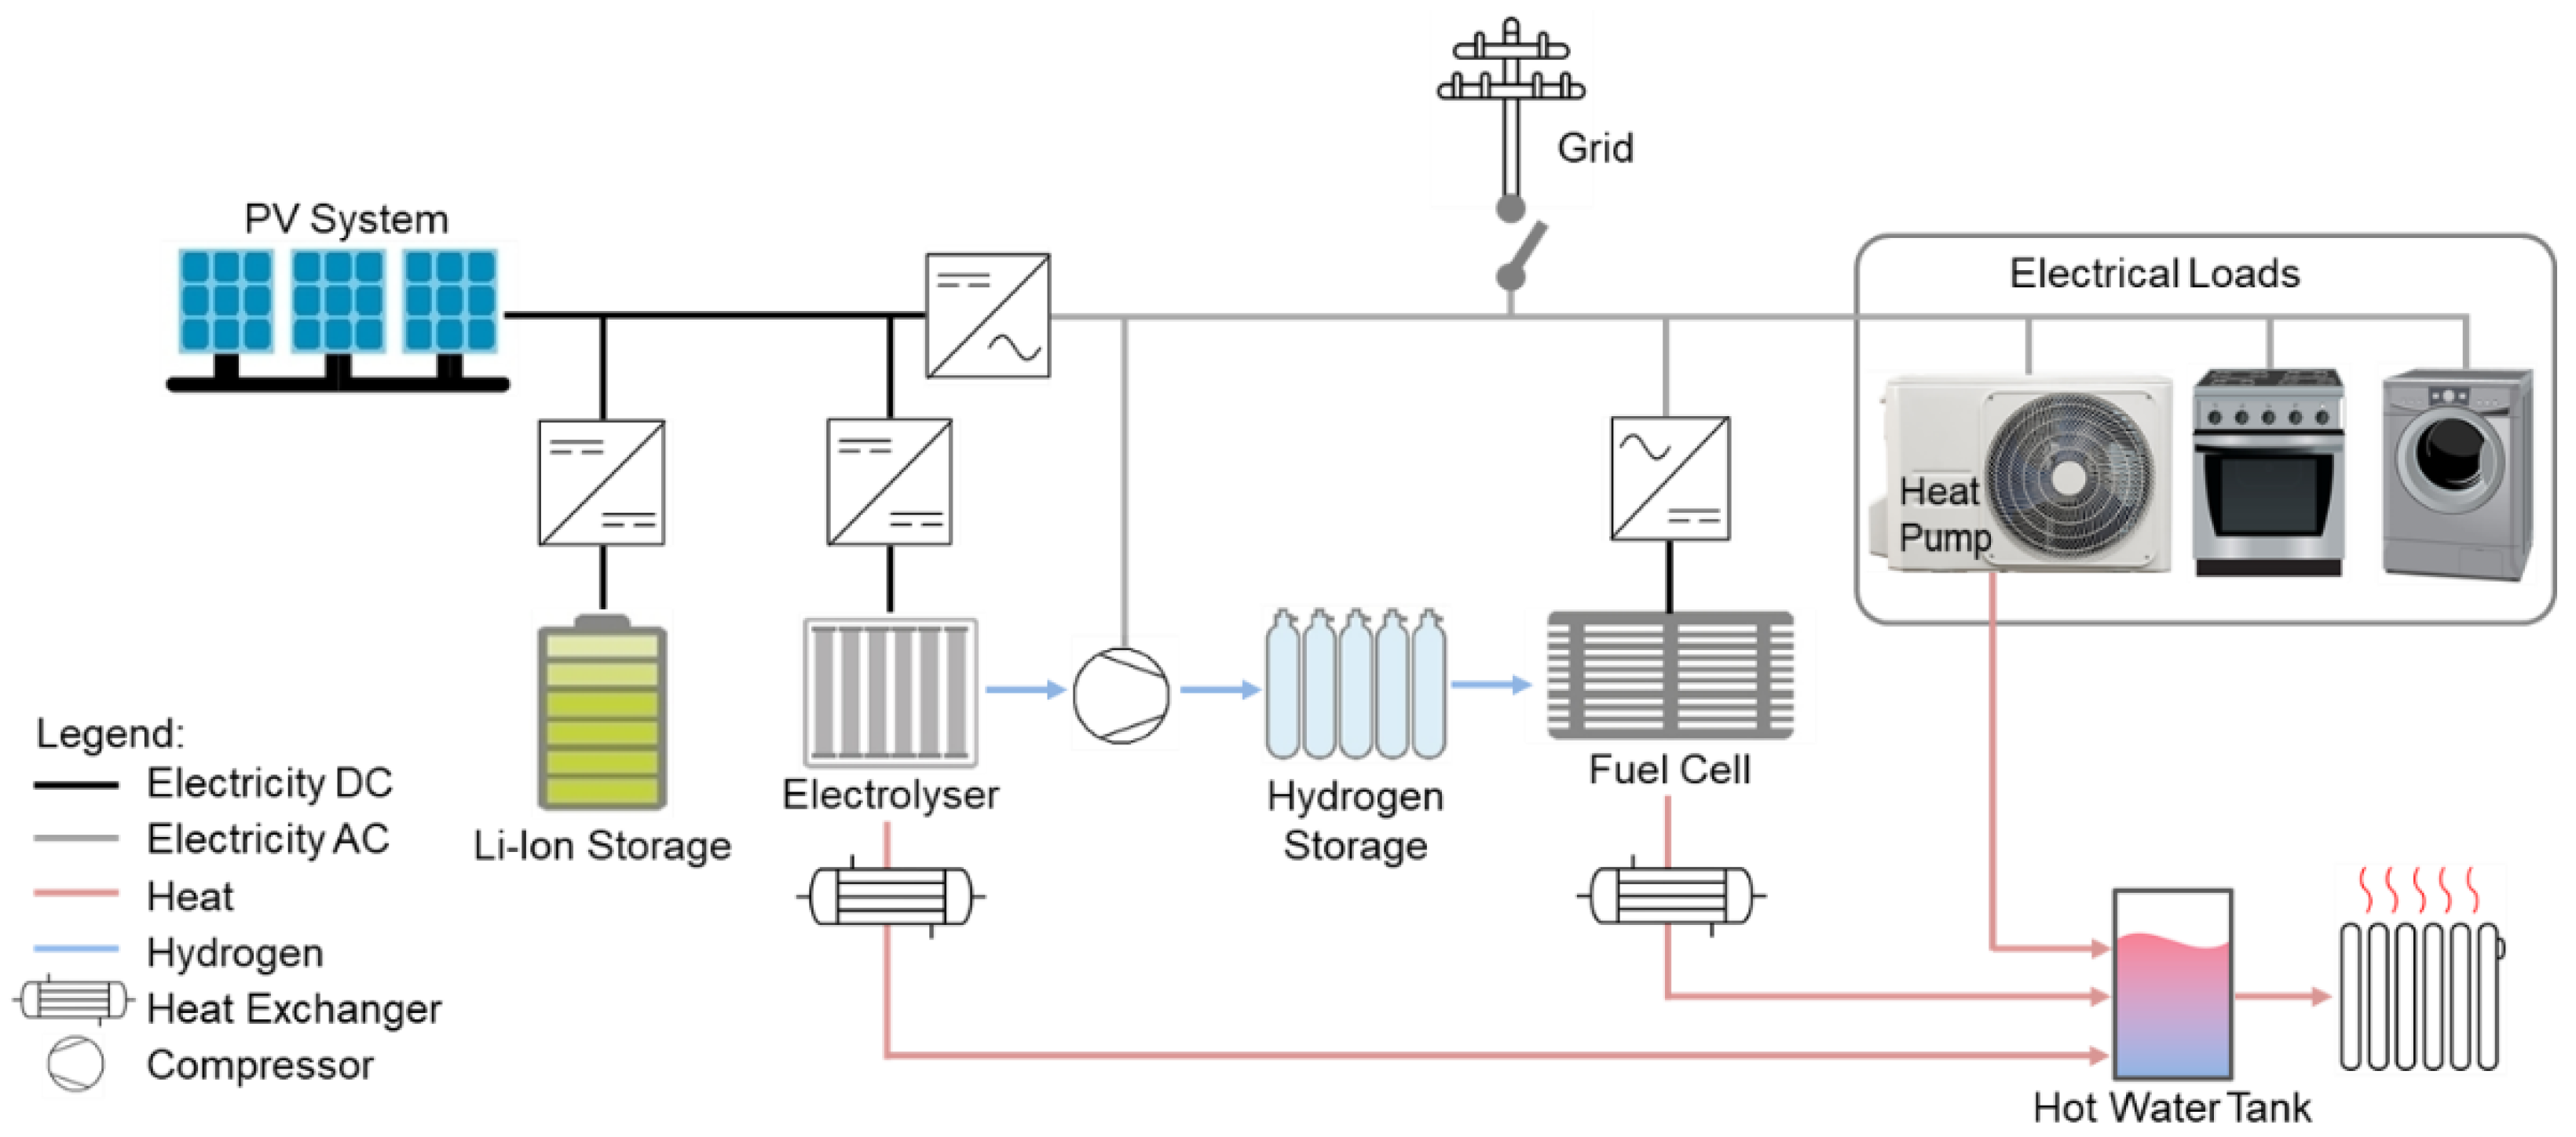
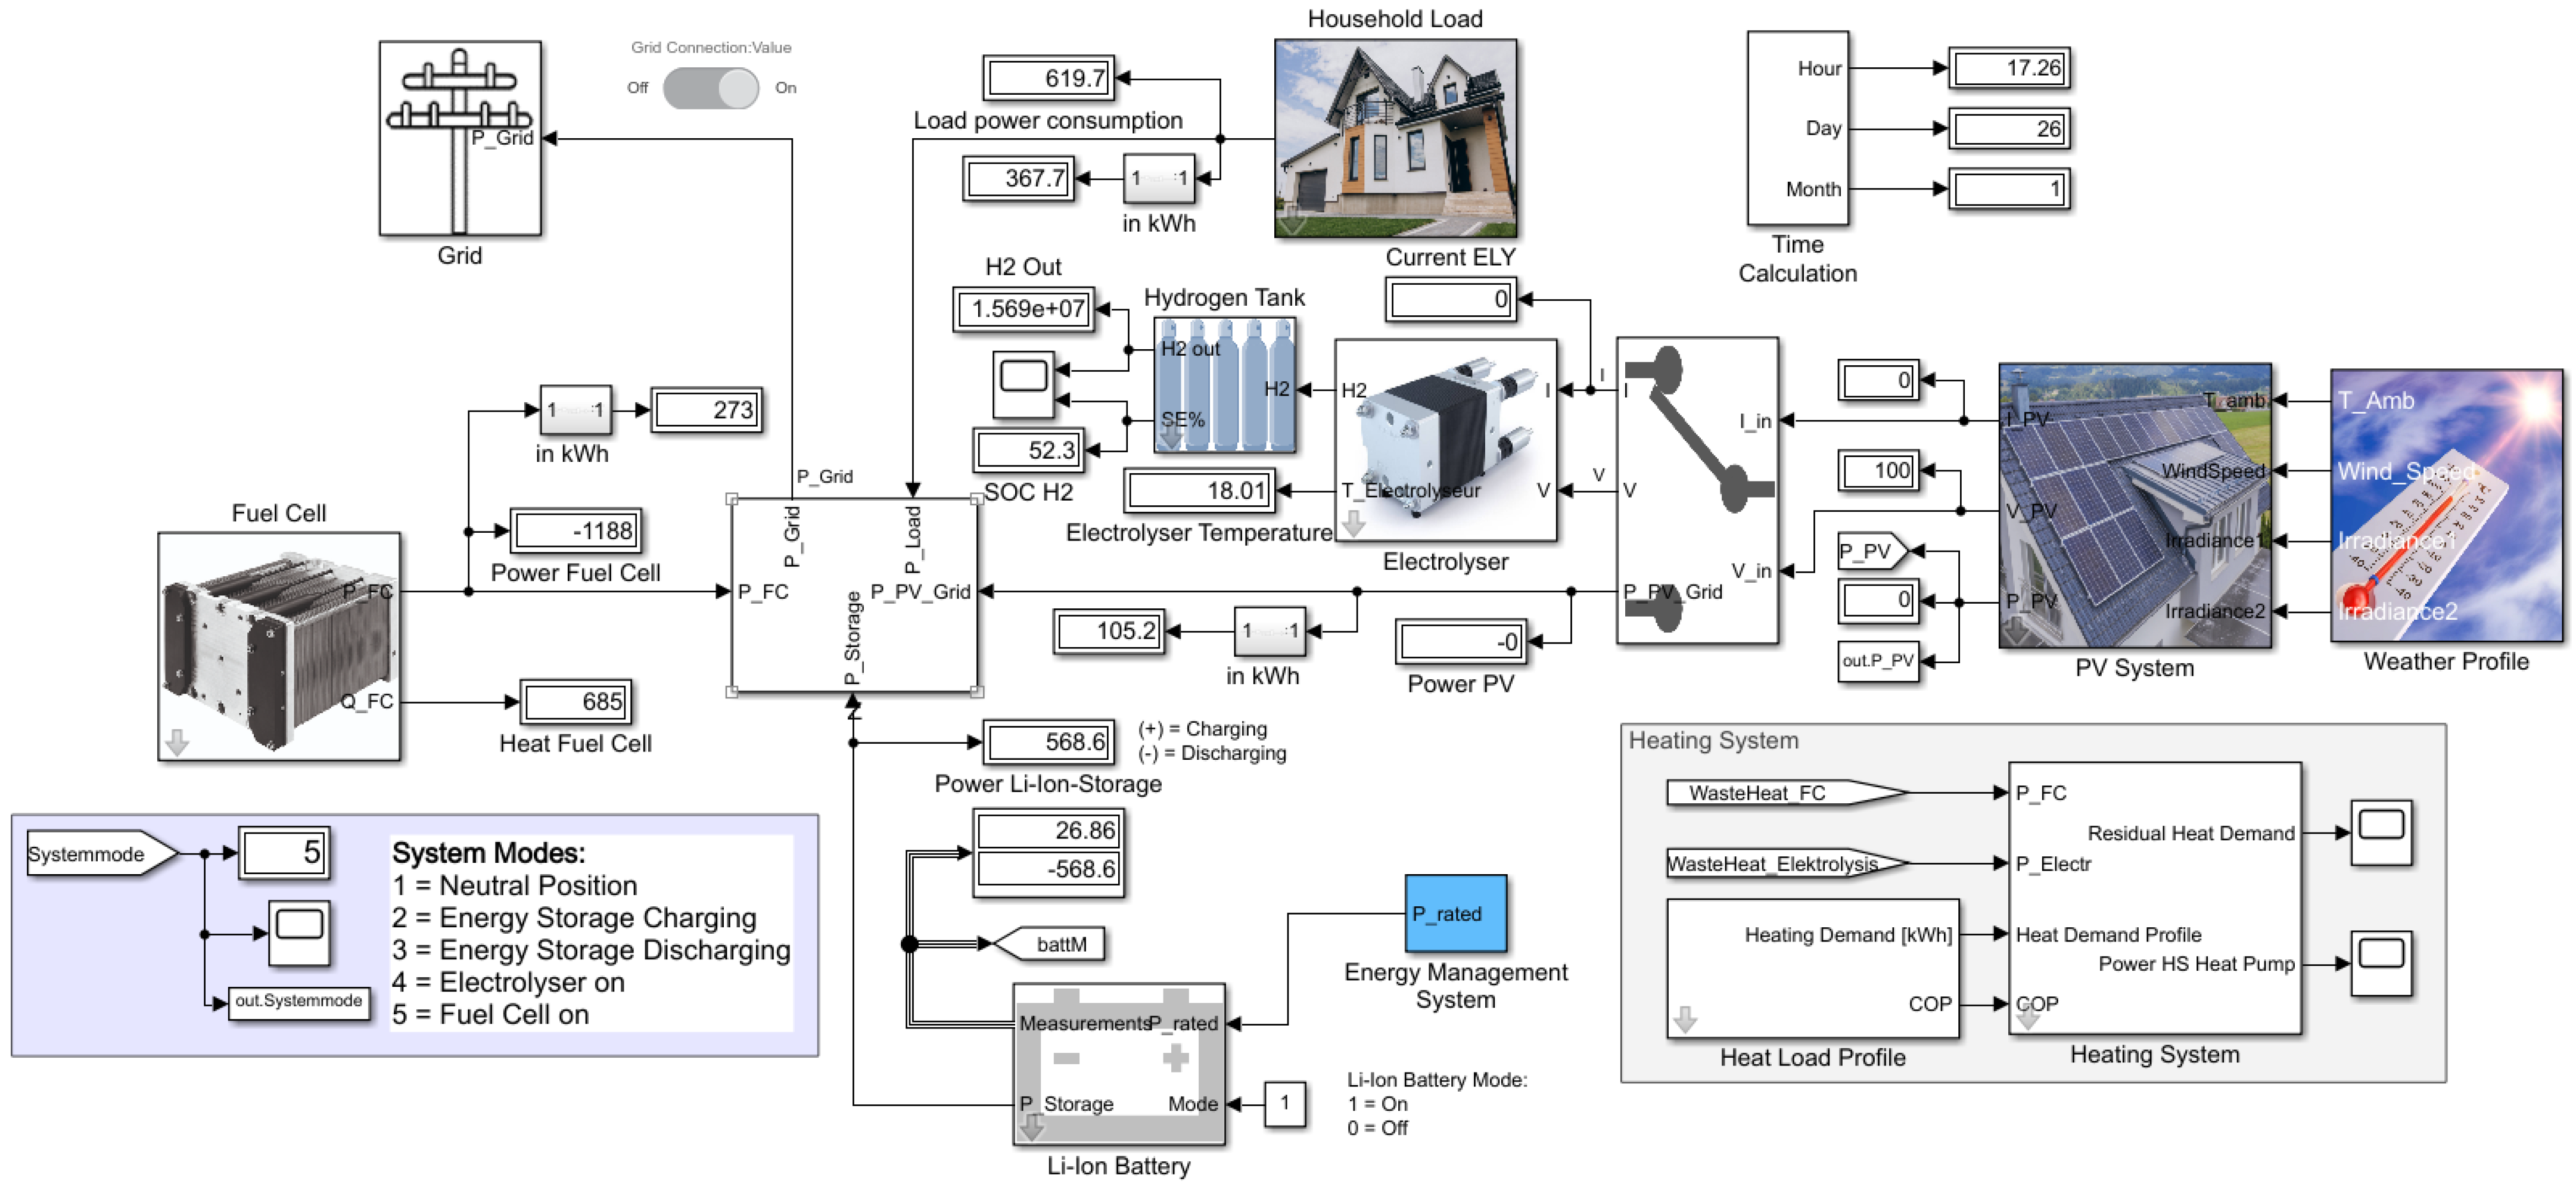
Within this section, the hybrid energy system, the functions of the individual components and the control procedure are qualitatively described. The core elements of the energy system model are a fuel cell (FC), an electrolyser, a lithium-ion battery, a hydrogen storage tank and a PV system.
Figure 3 shows the architecture of the proposed energy system. The PV system serves as the main energy source. With an inverter, the produced solar energy can directly be used for the electrical loads in the household (direct consumption). The surplus energy is stored in the lithium-ion battery by passing a DC/DC converter as a charge controller, and the energy is transferred back to the household grid via an inverter in case of less energy production than demand. If the lithium-ion battery is fully charged and the solar energy still exceeds the electricity demand, the electrolyser is switched on and hydrogen is produced by the surplus energy. After passing a compressor, the hydrogen is stored inside the hydrogen tank. In case of high electricity demand in combination with low energy production and an empty lithium-ion battery, the fuel cell is switched on. The fuel cell operates at constant power and acts as an electricity supplier for electrical loads. Since only the lithium-ion battery can deal with load peaks, the fuel cell switches on even before the lithium-ion battery is completely empty. So, the lithium-ion battery works as a buffer and is also charged by the residual energy delivered by the fuel cell in case of lower energy consumption than is delivered by the fuel cell and as long as the state of charge (SoC) of the lithium-ion battery does not reach a predefined state. A simple control algorithm via Simulink chart is used to control the energy flow. 
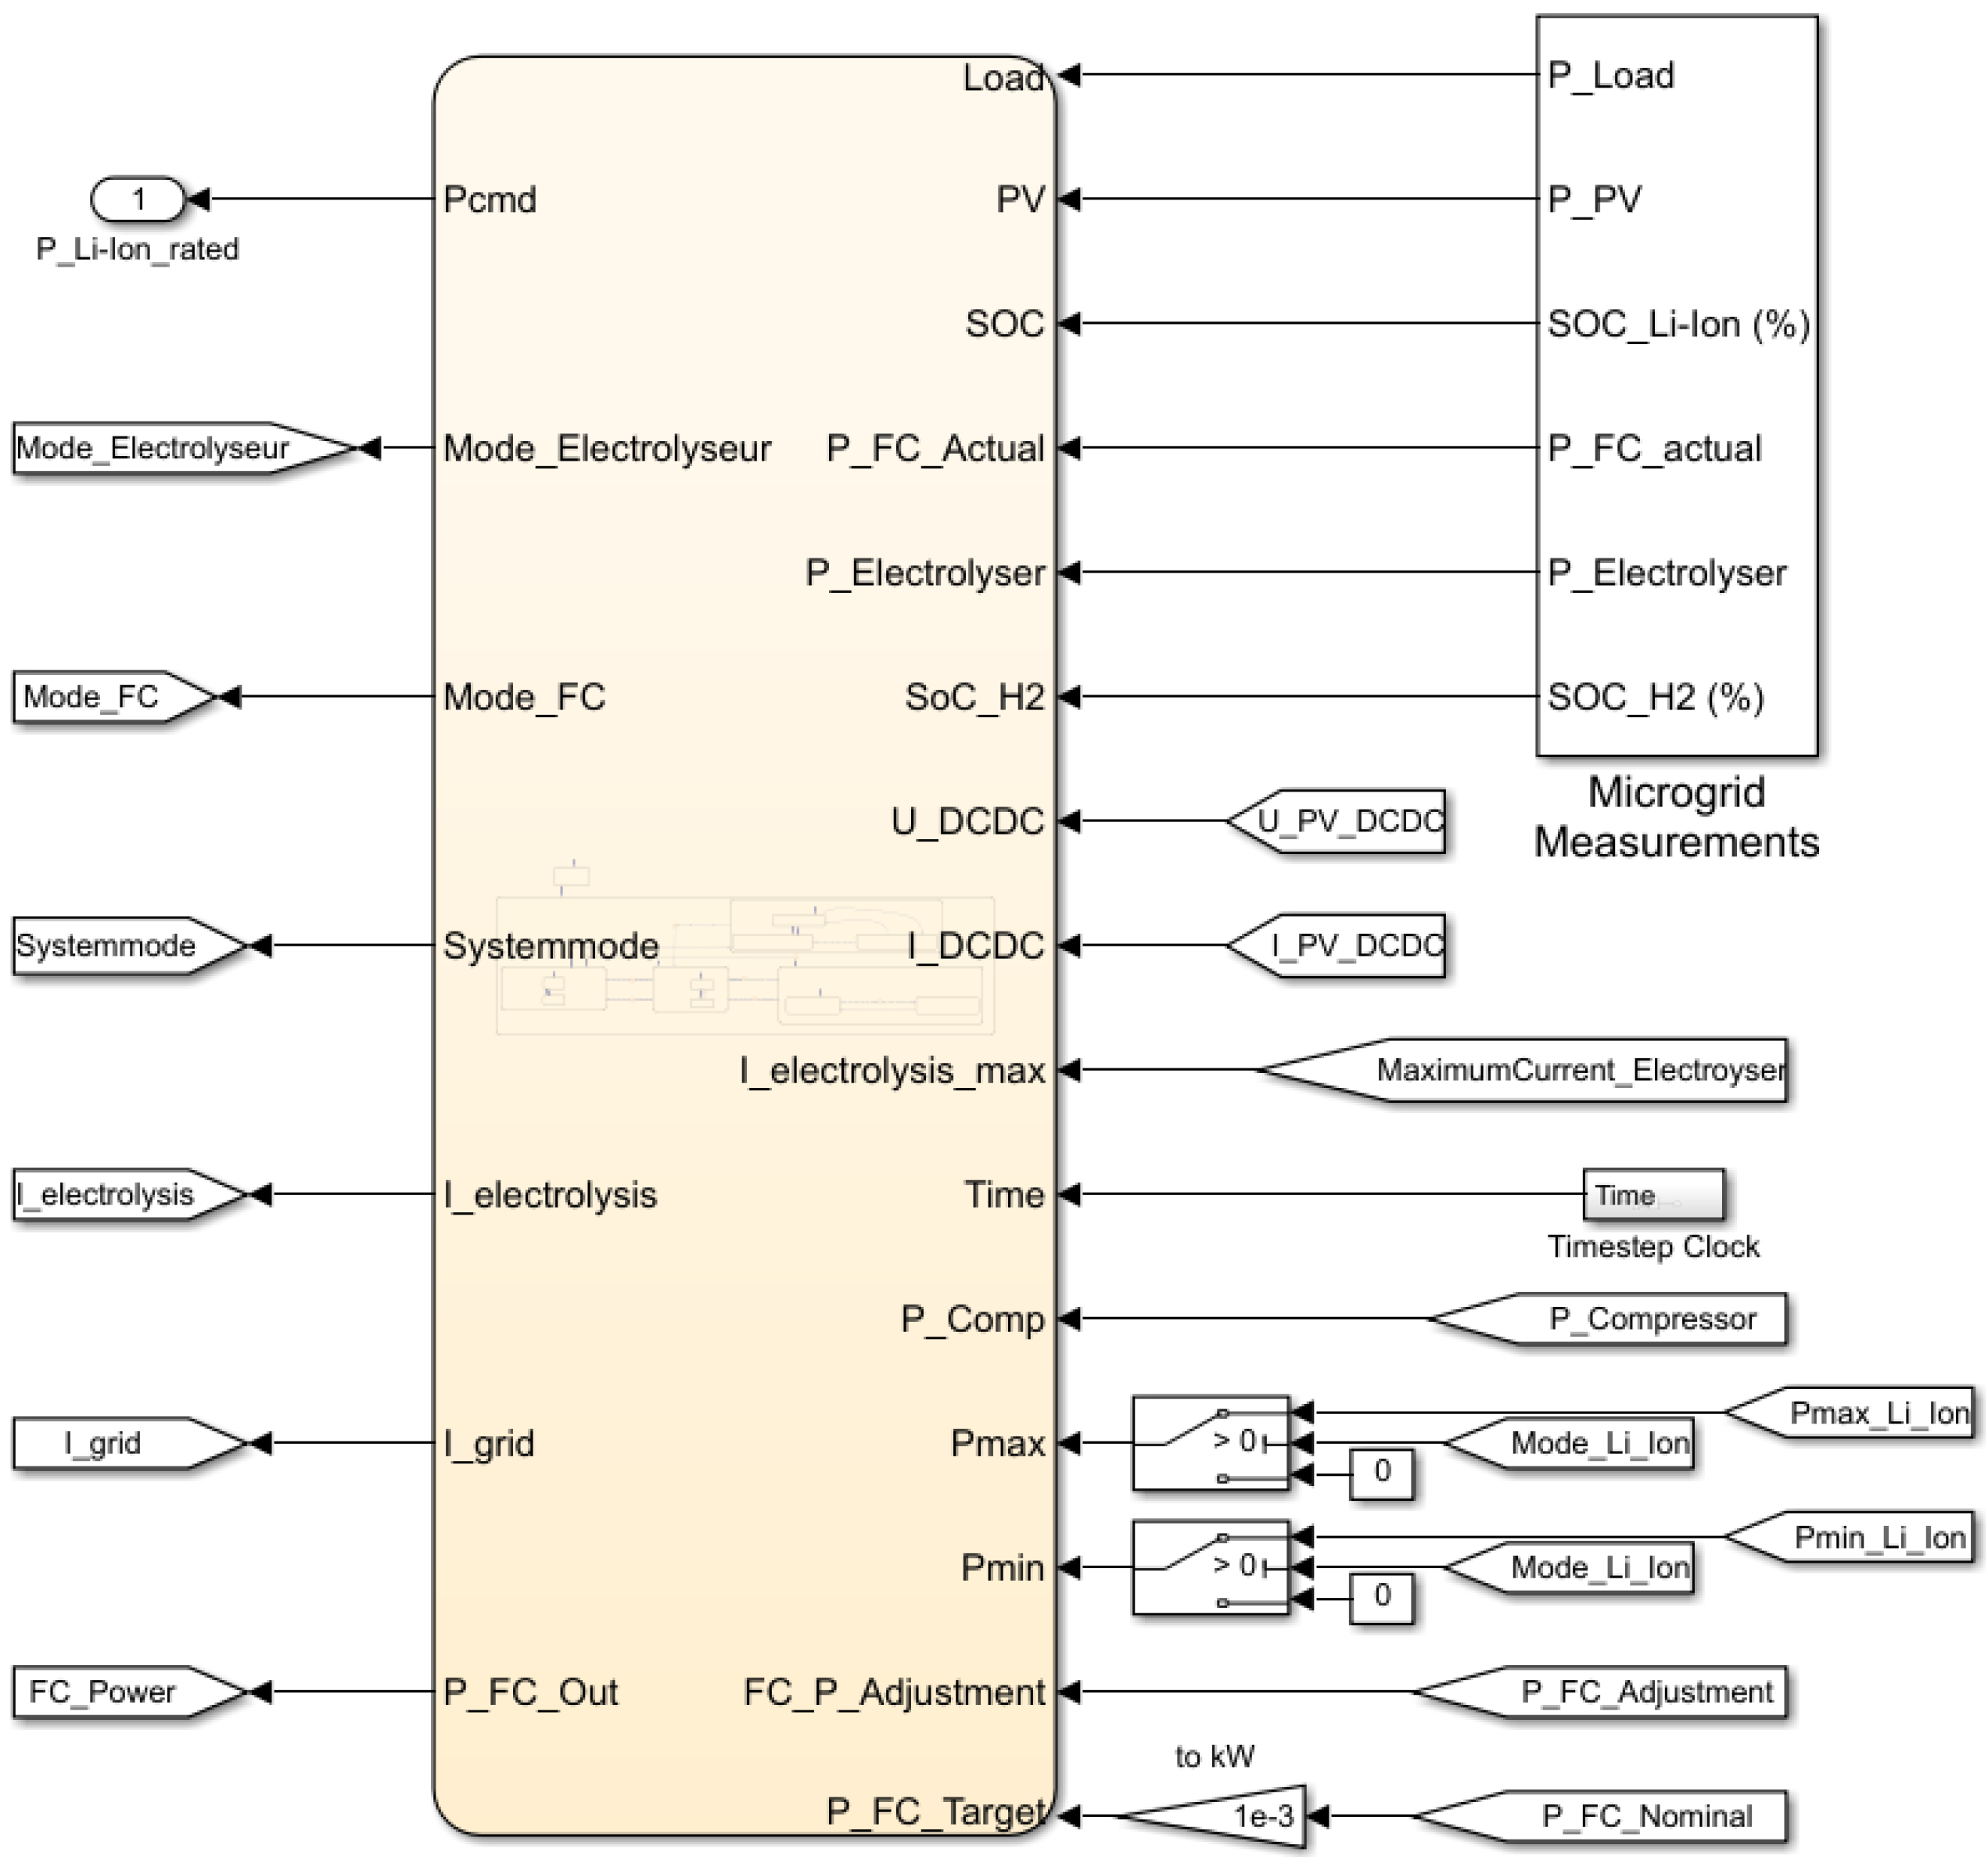
Figure 4 shows the input and output parameters that are involved in the control algorithm, which has been qualitatively described before.
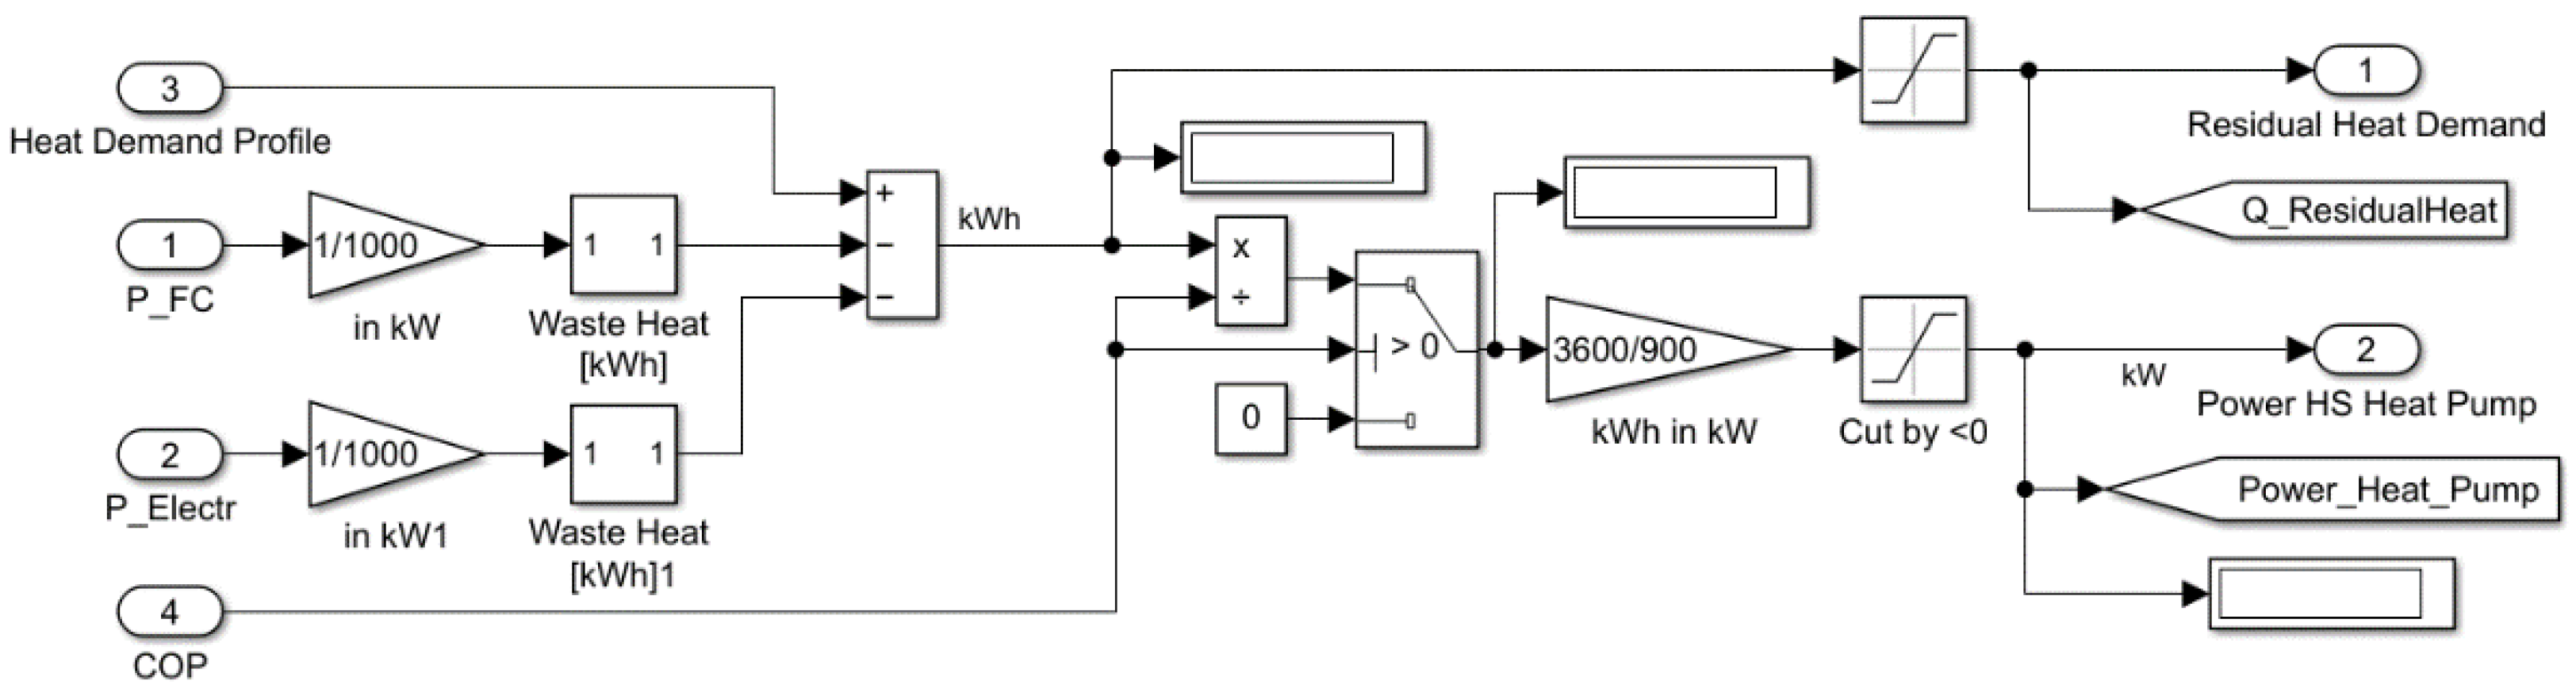
To profit from the waste heat produced by the fuel cell and the electrolyser, heat exchangers are employed which extract the heat and transfer it to the hot water tank. The residual heat demand is covered by a heat pump. The waste heat of the compressor has not been considered because the usable heat is comparatively small and real hydrogen compressors with waste heat utilisation have not been found.

4. Description of the Partial Models

Within this chapter, the mathematical models and the implementation in Matlab/Simulink are described. The Matlab/Simulink version R2021b has been used. Therefore, the components are considered individually.

4.1. PV System Model

The PV system functions as the main energy source. The model proposed in this study is based on the model of Bellini [24]. The irradiance, the ambient temperature and the wind speed are used as input parameters while the PV current and PV voltage are received as output (Figure 5).
The PV cell current I y depends on the PV output voltage as well as the two parameters K 1 and K 2 . The following mathematical equations are used [24]:
I y = I S C [ 1 K 1 ( e ( V y / ( K 2 · V O C ) ) 1 ) ]
K 1 = ( 1 I M P I S C ) e ( V M P ( K 2 · V O C ) )
K 2 = ( ( V M P / V O C ) 1 ) l n ( 1 ( I M P / I S C ) )
The parameters K 1 and K 2 are changing with irradiance and temperature. The formulas for the temperature dependency are given below:
I S C ( G , T c ) = I S C S · G G s · [ 1 + α ( T c T s ) ]   V O C ( T c ) = V O C S [ 1 + β ( T c T s ) ]
I M P ( G , T c ) = I M P S · G G s · [ 1 + α ( T c T s ) ] V M P ( T c ) = V M P S [ 1 + β ( T c T s ) ]
The parameters I S C , I M P , V O C and V M P are listed in the datasheet of the used PV modules and are defined for the standard test conditions ( G s = 1000 W m 2 ,   T s = 298.15   K ) [25]. The values for G and T c represent the actual irradiance and cell temperature and α and β are the specific temperature coefficients for the current and the voltage which are also specified in the data sheet.
The actual cell temperature T c   ( K ) can be calculated by the ambient temperature T a   ( K ) , the actual irradiance G   ( W m 2 ) , the wind speed ω   ( m s ) and the coefficient k r (approx. 1.542 K · s m for monocrystalline [26]) using the following formula [27]:
T c = 0.93 · T a + 0.031 m 2 K W · G k r · ω + 3.6   K  
In this study, the current at Maximum Power Point (MPP) I M P ( G , T c ) and the voltage at MPP V M P ( T c ) are taken as the output current and voltage for the used PV system. The cell parameters block was modified so that the parameters for a whole PV system instead of one single PV module were calculated. Therefore, the temperature-dependent voltage was multiplied by the modules in series within one string and the current was multiplied by the number of parallel strings.
Two PV systems were integrated into the energy system in order to offer the possibility of integrating two different irradiation profiles based on different orientations (Figure 6). This enables the implementation of a split east-west-oriented PV system within the model. The DC/DC converters bring the voltage of the PV system to the nominal voltage of the electrolyser. The current and the power of the PV system are reduced by an efficiency parameter that considers factors such as module pollution and conduction losses.

4.2. Electrolyser Model

An electrolyser is used to split water molecules into hydrogen and oxygen by using an electrical current [28]. Therefore, the electrolyser converts electrical energy into chemical energy stored in hydrogen [13]. Usually, several electrolyser cells are stacked together by connection in series. For this household model, a Proton Exchange Membrane (PEM) electrolyser is used due to several advantages such as smaller dimension and mass, lower operating temperatures and lower power consumption [29]. PEM electrolysers have the intrinsic ability to cope with transient electrical power variations (especially important when fed by fluctuating renewable energies as in the designated use case) [30]. Moreover, they provide a high degree of purity of gases and the potential to compress hydrogen at a higher pressure within the unit and with a higher safety level [30].
The electrolysis characteristics of a single PEM electrolysis cell can mathematically be described as follows [31]:
V ( T , p ) = e r e v ( T , p ) e r e v ( T , p ) e   5 · I 0.02   A + I · R i ( T , p )
The formula for a complete stack is given by [32]:
V ( T , p ) = I n s n p R i ( T , p ) + n s e r e v ( T , p )
with n s as the number of cells in series and n p as the cells in parallel, respectively. The reversible potential e r e v ( T , p ) and the PEM cell resistance R i ( T , p ) are temperature- and pressure-dependent [31]:
e r e v ( T , p ) = e r e v 0 + R ( 273.15   K + T ) 2 F l n ( p p 0 )
R i ( T , p ) = R i 0 + k · l n ( p p 0 ) + d R t ( T T 0 )
where R is the universal gas constant, T is the temperature inside the electrolyser, F is the Faraday constant, p and p 0 are the working pressure, and the ambient pressure, respectively and k is the derived curve-fitting parameter ( k = 0.0395   VA 1 ).
The production rate of hydrogen can be calculated according to Faraday’s law. The production rate of hydrogen inside an electrolyser cell is directly proportional to the transfer rate of electrons at the electrodes [28]. This is equivalent to the electrical current in the circuit. The formula for the hydrogen production rate is [26,29]:
v H 2 ( m 3 s ) = v m · N c · I 2 F   with   v m ( m 3 mol ) = R ( 273.15   K + T ) p
where v m is the molar volume, N c is the number of cells in series and I is the actual current towards the electrolyser. Figure 7 shows the electrolyser model implemented in Simulink which is based on the work of Albarghot and Beainy but is partially modified [13,29].

4.3. Hydrogen Storage Model including Compressor

The hydrogen storage is used to store the hydrogen produced by an electrolyser which can then be used in the fuel cell to regenerate electricity. The hydrogen produced by the electrolyser needs to be stored to power the fuel cell to ensure electricity supply at times with low incoming PV energy. There are different types of hydrogen storage possibilities, which have different advantages and disadvantages. The fitness of the options depends on the intended purpose of hydrogen storage. There are four main hydrogen storage options [33]:
  • Compressed hydrogen;
  • Liquid hydrogen;
  • Liquid Organic Hydrogen Carrier (LOHC);
  • Metal hydride hydrogen storage.
Metal hydride hydrogen storage has the advantage of having high energy density and high safety due to storage by near normal pressure [34,35]. Disadvantages are high material costs and the requirement of heat for the release of hydrogen out of the metal hydride storage. Rudow [34] calculated a required temperature of 303.8 °C for releasing the hydrogen out of magnesium hydride storage. Due to the fact that the hydrogen release typically occurs during winter time in which low energy via PV is available, usage of this hydrogen storage option is not sensible. In the case of LOHC, a high temperature is also necessary to release the bound hydrogen and is therefore also unsuitable for the designated use case [36]. The usage of liquid hydrogen storage options typically is useful in applications with limited space. For liquid hydrogen storage, the hydrogen first has to be cooled down to 20 Kelvin which requires around 12 kWh per kg hydrogen (approx. 36% of the total H 2 energy content) [33] and is therefore also not suitable for the designated use case in which energy must be used sparingly.
Compressed hydrogen, on the other hand, is characterised by a lower energy requirement than other options. When compressing from 10 bar to 500 bar, for example, approx. 4 kWh per kg of hydrogen is required, which corresponds to around 12% of the H 2 energy content and is therefore significantly less than the energy required for storage as liquid hydrogen [34]. However, compressed hydrogen requires more space, which, however, does not have such a high importance due to the stationary application. Therefore, the compressed hydrogen option has been used in this particular use case.
Prior to the storage, the hydrogen has to be compressed from an electrolyser output pressure of around 1 bar up to 300 bar to reach a higher storage capacity. The system dynamics of the hydrogen storage can be described by the following formulas [28]:
P b P b i = z N H 2 R T b M H 2 V B z = P b V m R T b N H 2 = v H 2 · ρ H 2
where P b     ( Pa ) is the actual tank pressure, P b i   ( Pa ) is the initial tank pressure, R is the universal gas constant, T b   ( K ) is the operating temperature, V B   ( m 3 ) is the tank volume, z is the compressibility factor, N H 2   ( kg / s ) is the flow rate of the produced hydrogen, M H 2   ( kg / mol ) is the molar mass of hydrogen and V m   ( m 3 / mol ) is the molar volume.
The formula is used to calculate the tank pressure using the ratio of hydrogen flow to the tank [28]. The implementation of the formulas can be seen in Figure 8. The blue marked part calculates the pressure loss of the storage tank caused by the hydrogen demand of the fuel cell. The power required for the compression of hydrogen is calculated as follows [37,38]:
P e l , c o m p = η e l · η c o m p · κ κ 1 · m ˙ i n l e t · R j · T 1 ( ( p 2 p 1 ) κ 1 κ 1 )
where η e l and η c o m p are the electrical and compressor efficiency, m ˙ i n l e t   ( kg / s ) is the flow rate of H 2 towards the compressor, R j is the specific gas constant (for H 2 :   4124.2   J / ( kg · K ) ), T 1   ( K ) is the temperature of H 2 at entrance, κ is the heat capacity ratio (for H 2 1.4 ) and p 1   ( Pa ) and p 2   ( Pa ) are the pressures before and after the compression.

4.4. Lithium-Ion Battery Model

The lithium-ion battery is the main storage for short-term electrical power demand. Generated surplus energy of the PV system is stored there as long as the upper charge limit is not reached. If the upper charge limit is reached, the remaining surplus energy of the PV system is used for the production of hydrogen. Surplus energy produced by the fuel cell which is not used to cover the actual household energy demand is also stored in the lithium-ion battery as long as the predefined SoC from which the fuel cell is turned off is not reached. The stored energy is used to cover the energy demand within time periods of insufficient PV supply (such as during night time, cloud cover or very high energy demand) and during occurrence of rapid load changes during periods of time where the fuel cell is activated. Since the lithium-ion battery has less storage capacity than the hydrogen tank, it is therefore only used for short-term energy demand. The key parameter which has to be considered for energy autonomous operation is the maximum energy provided during the considered time period. This parameter depends on household’s electrical loads and the energy usage preferences of the fitted household.
Fuel cells are often used in combination with electric energy storage systems which can supply electrical loads [39]. As fuel cells are often operating constantly and cannot switch the output power as fast as load peaks appear in the load profile, the electrical storage is used as a backup due to the faster ramp time. In this study, a lithium-ion battery model which already existed in Simulink as part of the model Microgrid-EMS-Optimization [40] was used and has been modified to fit into the household system type (Figure 9). The lithium-ion battery SoC is limited by an upper and a lower limit, which was set to 80% respectively 20% in this particular case. This may be modified according to the desired lifetime and usable capacity. The rated power which can be delivered from and transferred into the storage is restricted by the rated power P r a t e d given in the datasheet. With a simple control algorithm, the amount of energy into and out of the storage is calculated. If the PV system is producing more energy than is actually needed for covering the load demand, the residual energy is delivered to the lithium-ion battery but is restricted by the rated power. In case of a larger energy demand than that produced by the PV system, the stored energy covers the additional electricity demand. If the SoC is close to the lower limit, the fuel cell is switched on. In this case, the storage is charged by the residual energy which is not required for covering the load. The fuel cell is switched off if the SoC reaches 37.5   % .

4.5. Fuel Cell Model

As the fuel cell model, a modified Simulink fuel cell stack is used [41]. This fuel cell stack calculates the output voltage in dependency on a given cell current and hydrogen flow rate which is by itself dependent on the current. The output of the block is the respective voltage which depends on the current and other internal performance factors. A heat exchanger is added to the model due to the relatively high amount of waste heat produced inside the fuel cell. The amount of waste heat produced is calculated by a formula described in Section 4.6.

4.6. Heat Model

Heat represents the largest amount of energy needed in a typical German household. Since fuel cells produce a high amount of waste heat, the usage of that surplus heat is able to increase the sustainability and efficiency of the novel system. Even during summer, there is demand for heat (e.g., for hot water). As the amount of waste heat produced inside the fuel cell and the electrolyser does not suffice for covering the overall heat demand, a heat pump is considered for delivering the residual heat demand.
The waste heat is extracted by using heat exchangers which have two separate circles, one towards the appropriate component and the second towards the hot water storage. Due to the decision of using a PEM fuel cell with an operating temperature of in the vicinity of 60 °C, water can be used as a media in the circle towards the fuel cell and also for the second circle towards the household water storage tank. The PEM electrolyser typically operates at temperatures of around 60 °C, so water can be used as a media in both cycles. The temperatures of the fuel cell and the electrolyser are high enough to be used for water heating and storage since the temperature of the water storage tank should be at least 55 °C [42]. Instead of modelling the complete climatic behaviour with a highly detailed household model including radiators in every room and the heat exchange behaviour towards walls, which would lead to an extremely high control effort, a heat demand profile with a heat demand given for every 15 min has been used instead.
The temperature increase of an electrolyser is calculated by the following formula [43,44]:
C t h , S t a c k d T d t = Q ˙ H e a t , S t a c k   Q ˙ L o s s   Q ˙ C o o l i n g
with
Q ˙ H e a t , S t a c k = Q ˙ H e a t , C e l l · N c e l l s E L Y = ( V C e l l V t n ) · I C e l l · N c e l l s E L Y
Q ˙ L o s s = k · A s · ( T P E M E T a )
Q ˙ C o o l i n g = m ˙ s t a c k · c p , s t a c k · T o u t T i n l n ( T P E M E T i n T P E M E T o u t )
where m ˙ s t a c k   ( k g ) is the mass of the stack and c p , s t a c k   ( J kg · K ) is the specific heat. The coolant cycle must be controlled such that the electrolyser never rises over 80 °C since the electrolyser could be severely affected by degradation problems [45]. Therefore, a stack temperature-dependent control mechanism is used to regulate the coolant flow rate dependent on the actual power which is delivered towards the electrolyser (Figure 10). The maximum and minimum coolant flow rates in dependency to the maximum and minimum operating temperature of the electrolyser are used, which are obtained from the datasheet of a real electrolyser.
Inside the fuel cell, a relatively high amount of heat is produced. The produced heat can be described as the overall possible power of the electrolyser P o v e r a l l minus the power generated as electricity P e l . The formula for the heat power P H e a t is given by [45]:
P H e a t = P o v e r a l l P e l = I S t a c k · N c e l l s F C · ( 1.254   V V C e l l s )  
P e l = I S t a c k · V S t a c k = I S t a c k · V C e l l s · N c e l l s F C P o v e r a l l = I S t a c k · N c e l l s F C · 1.254   V
For exchanging the heat, a counterflow heat exchanger is used, which was mathematically described by Martínez [45]. The exchanged heat power P r can be calculated by:
P H E F C = U c o o l · A c o o l ( T o u t T i n l n ( T P E M F C T i n T P E M F C T o u t ) )
with U c o o l as the global heat transfer coefficient (specific for the heat exchanger) and A c o o l as the coolant contact area. The output and input temperature T P E M F C from and towards the fuel cell are assumed to be constant. Heat losses, for example due to tubing losses, were considered by means of an efficiency parameter.
The heating energy produced within 15 min inside the fuel cell and the electrolyser has to be calculated by summation of the heating power within 15 min using the algorithm shown in Figure 11. The overall produced waste heat is then subtracted from the overall heat demand of the designated energy system which is implemented by a heat demand profile. Thereby, the remaining heat demand Q r e m a i n i n g which has to be delivered by a heat pump is achieved (Figure 12). The energy demand W H P within 15 min, which has to be covered by the heat pump, is calculated by:
W H P = Q r e m a i n i n g / C O P
where COP is the Coefficient of Performance (ratio of useful heating provided to energy required) which depends on the actual ambient temperature. The COP value is calculated for every 15-min step within one whole year. Therefore, a table for COP values at different ambient temperatures and a sink side temperature of 55 °C as reference is used [46].

5. Overall Model and Dimensioning of the Components

Figure 13 shows the complete Simulink model of the household energy system. To map the power flow, the components are interconnected and are stuck together in a subsystem to calculate the residual power which has to be covered by the external grid. The energy management system yields to minimise the external grid usage. Table 1, Table 2, Table 3, Table 4, Table 5 and Table 6 show the configurations of the specific components used within Simulink for evaluation of the household energy system [47,48,49]. Real components have been used for the component dimensioning and determination of the parameter specification. Therefore, components have been searched for which fulfil the requirements for usage in private households and suite for small-scale applications. The parameter settings used in the simulation are based on the values given in the specific datasheets of the components. Suitable component dimensioning of all energy system components to ensure 100% energy independence over an entire year has been figured out by altering and repeating the Simulink simulation several times.

6. Verification and Data Analysis

The validity of the energy system modelled in Simulink was analysed using a single-family house. Therefore, the energy system was rebuilt in HOMER Energy (HE) to be compared. HE provides a wide range of components for basic energy system modelling with focus on energy balance and profitability analysis. To evaluate the plausibility of the developed energy system model, the magnitudes of the energy and hydrogen generation and the consumption are compared, respectively.
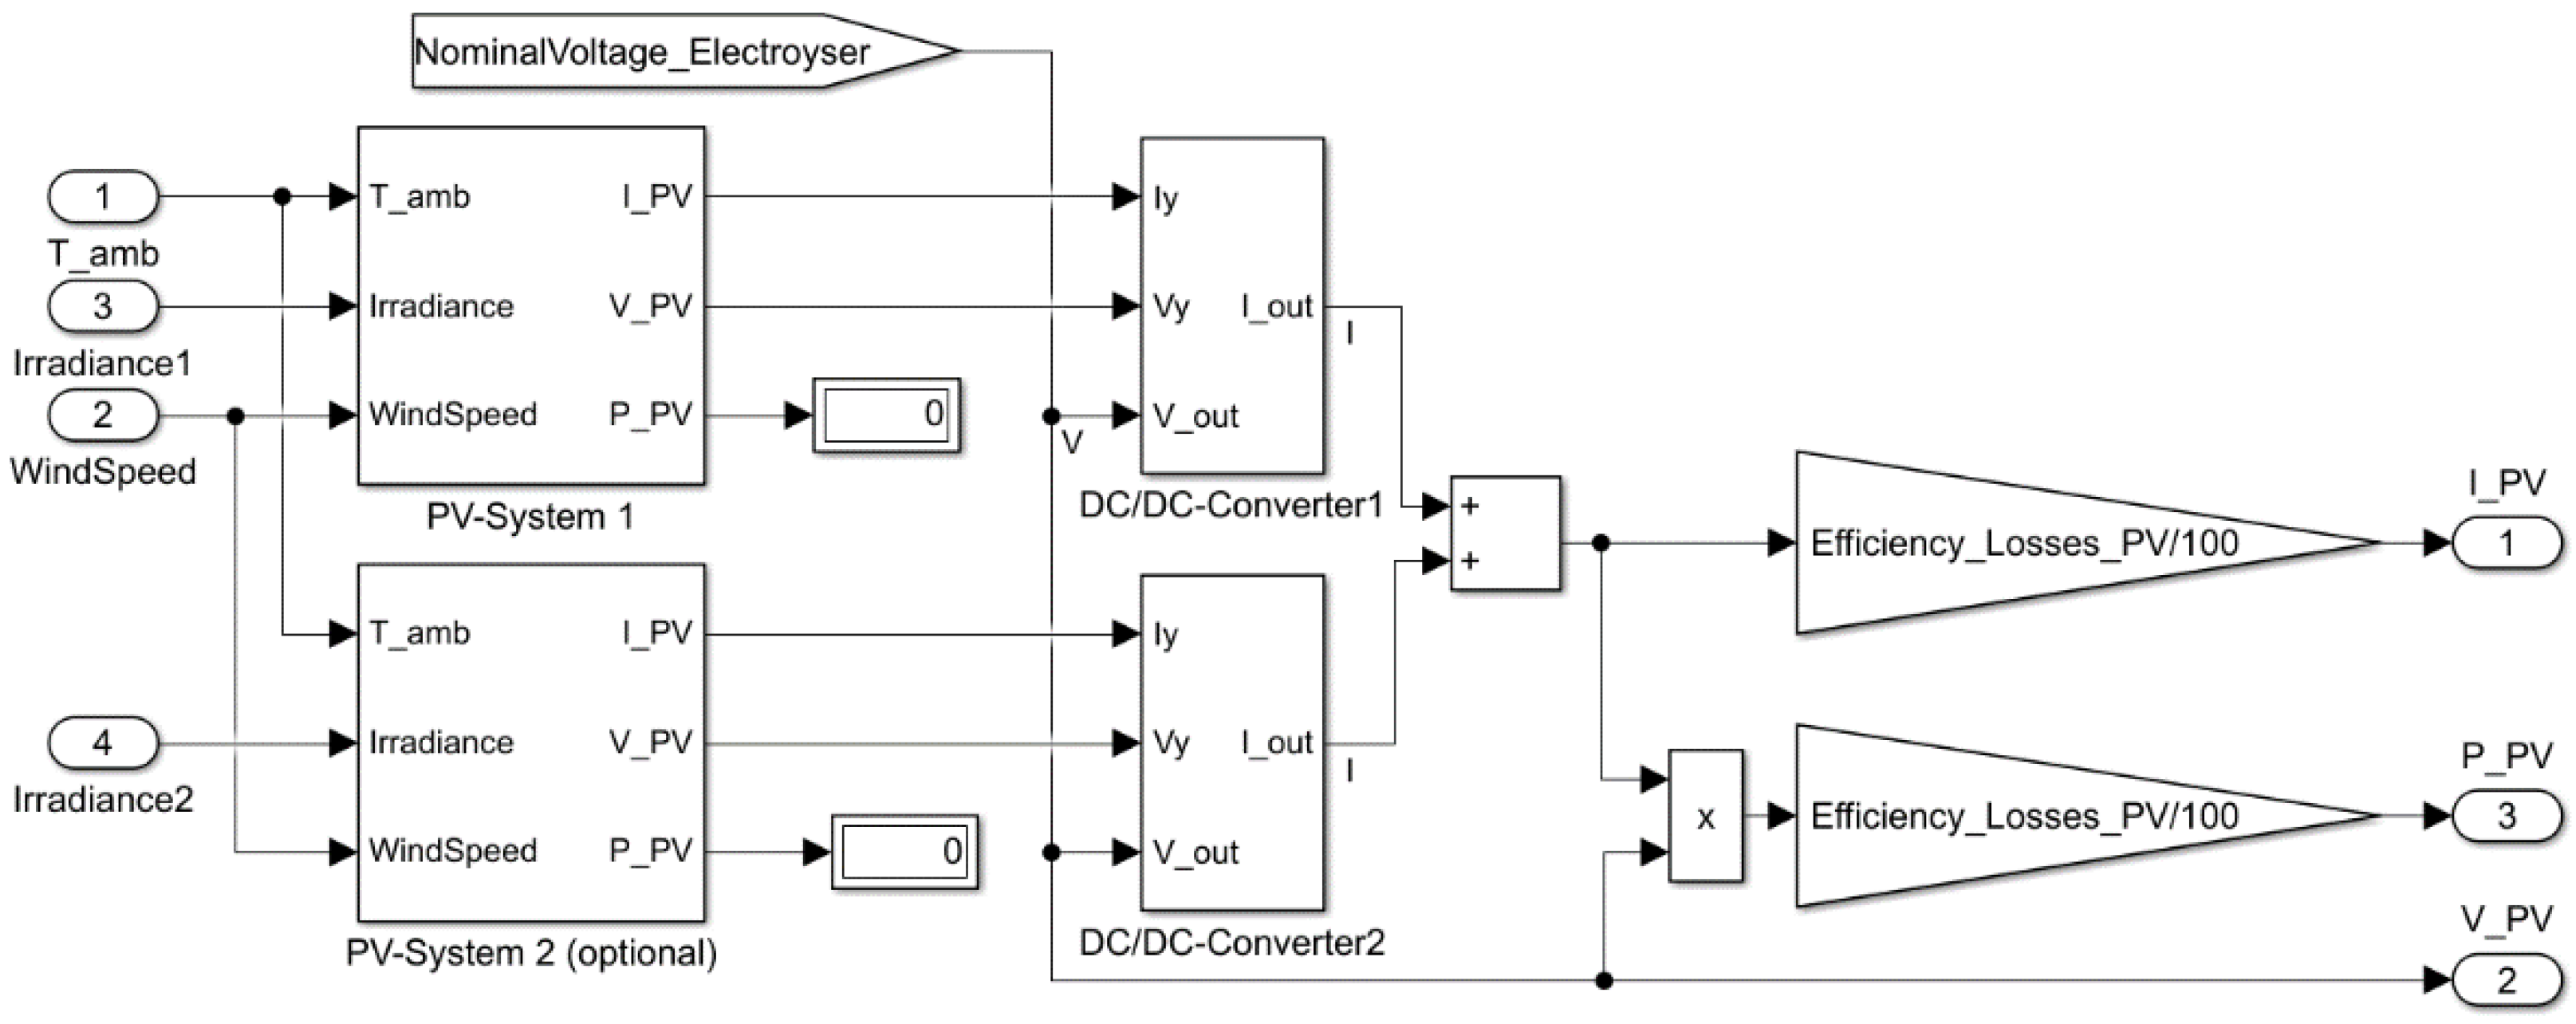
For the initial verification of the data, a PV system with rated power of 6820 kW p (22 modules of which 11 modules were in series connection 2 parallel strings) and the characteristics described in Table 1 was used. Wuerzburg (Germany) was employed as the model location due to the availability of a one-year weather and irradiation profile in hourly time resolution provided by the DWD [
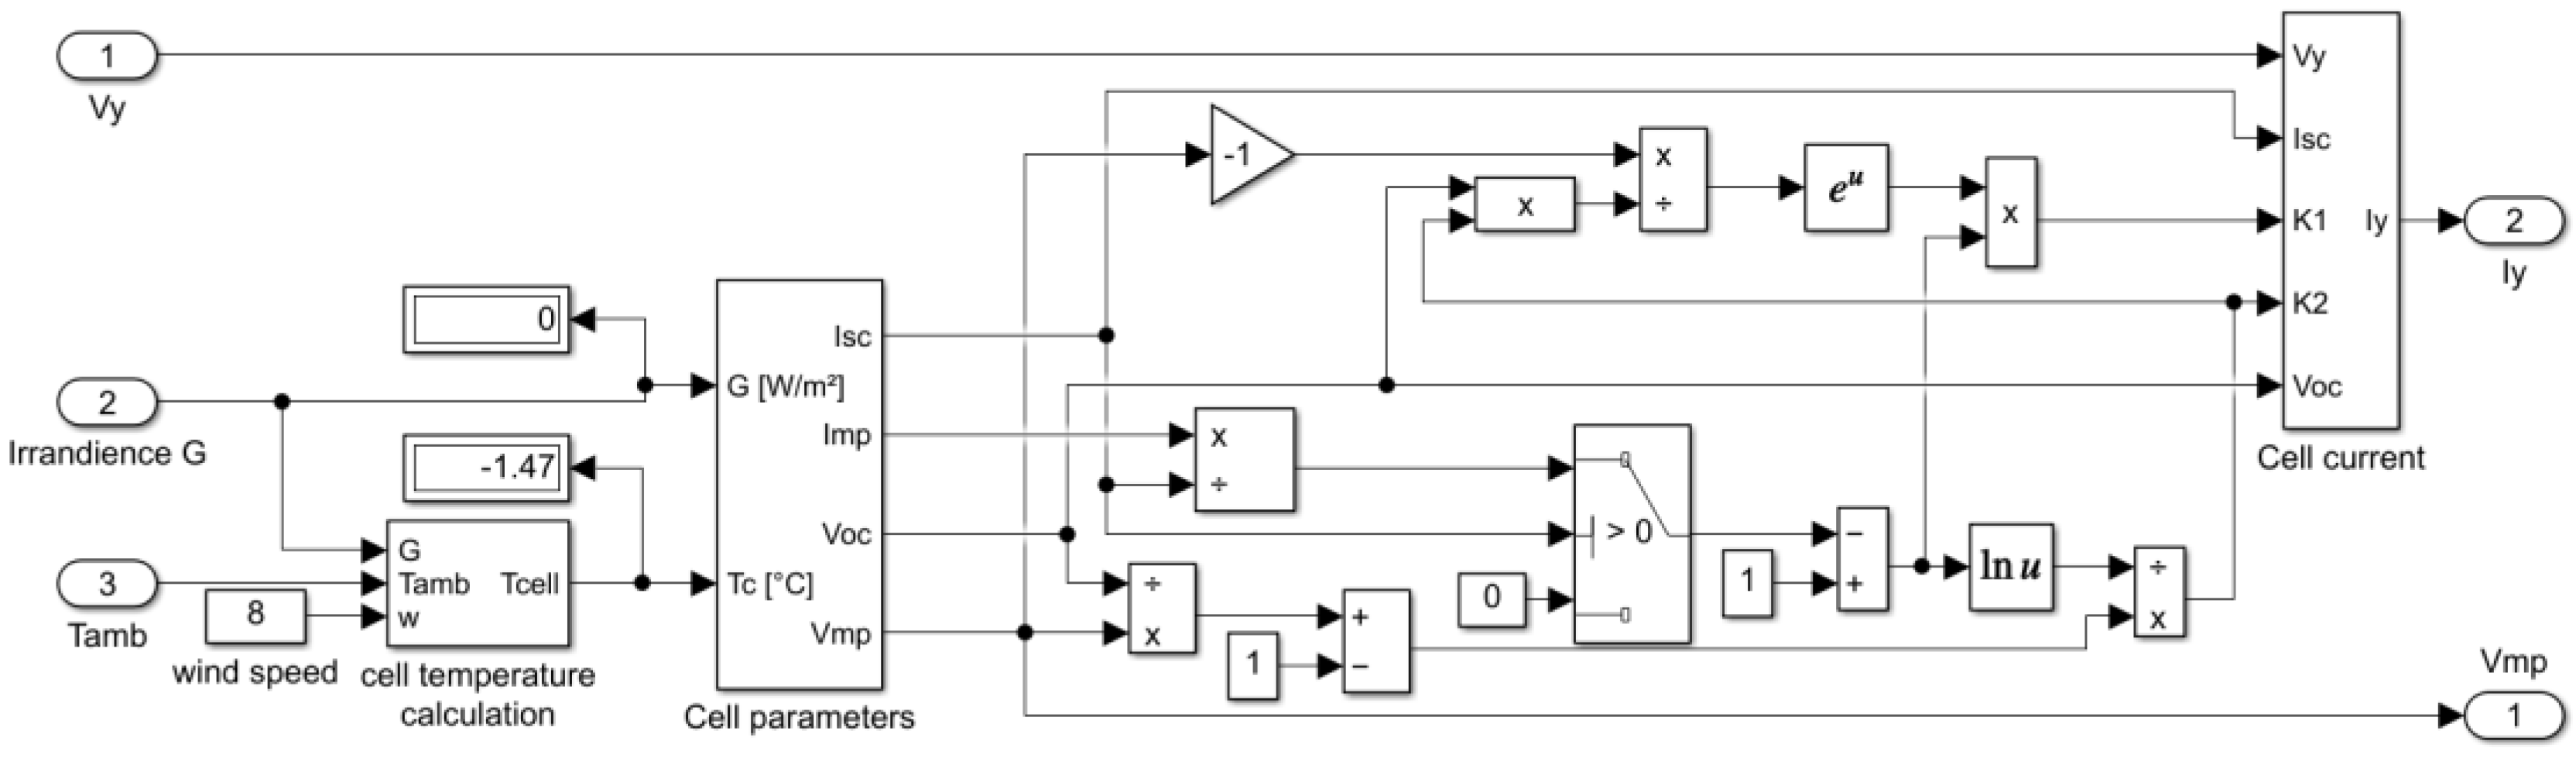
19]. The year 2015 was taken as the year of interest. The elevation angle was set to 45° with a direct orientation towards the south (azimuth angle = 0°). DWD provides global and diffuse irradiation profiles measured for a horizontal plane only. Due to this, the irradiation profile for an inclined plane had to be calculated first, using the formulas described by Quaschning [52]. The positioning of the PV system was assumed as ideally, having no shadowing during the whole year. To generate realistic data, losses due to pollution, conduction losses, etc. have been considered by introducing an efficiency parameter, which was set to 90%.
For evaluation, the overall load of the household system for each month and a 1 h resolution for an average day within this month were recorded by running the simulation. This profile has been taken as input profile at HE for achieving an equal load within both models. In total, 3832 kWh has been calculated as the overall load during one year. A 6.8   kW p PV system, a 5   kW electrolyser and a 1.24   kW fuel cell have been integrated into the HE model. With these assumptions, the Simulink model calculated PV energy production of 7314.60 kWh for the whole year whereas HE calculated 7538 kWh.
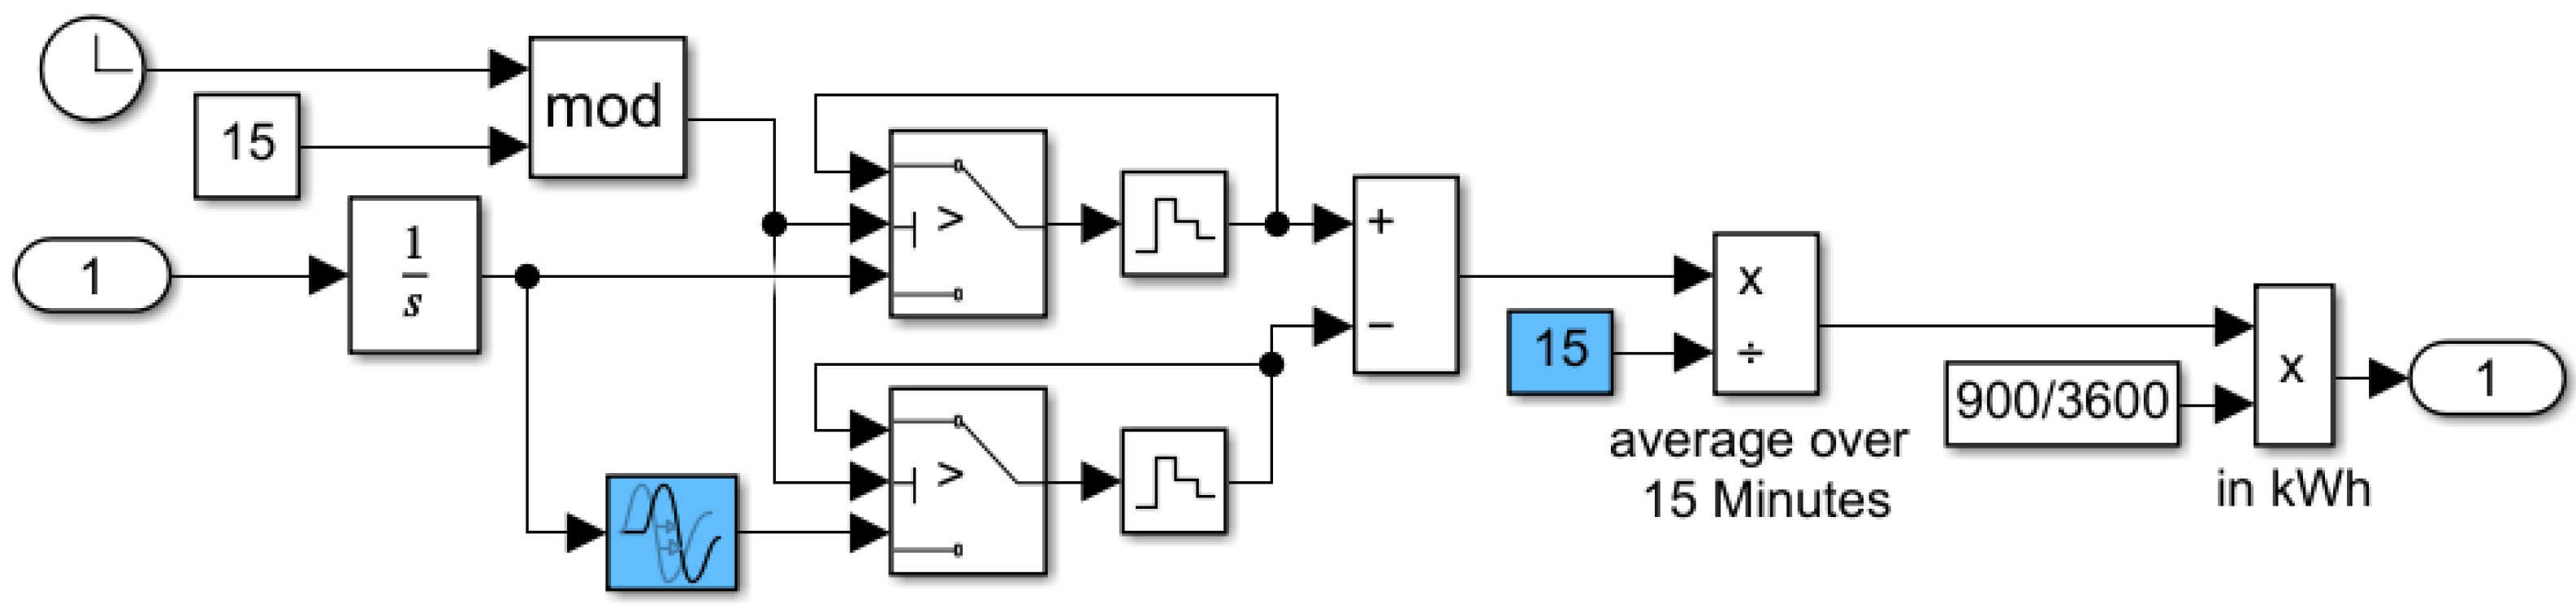
Figure 14 shows the produced energy within each month (left bar) compared to the energy demand for every month (right bar). From October to March, the energy produced by the fuel cell is relatively high, while the energy required in these months is unneglectably higher than during the summer because of the higher heating demand. The green bar shows the surplus energy which is used in the electrolyser to produce hydrogen.
Simulink calculated that 4283.55 kWh energy was used inside the electrolyser for production of hydrogen, which leads to 80.50 kg (equal to 895.48 m3 at 1 bar, or 2.985 m³ at 300 bar) produced hydrogen within one year. In return, the fuel cell required 73.52 kg hydrogen for production of 1009.86 kWh energy.
The compression of hydrogen required a yearly energy demand of 268.14 kWh, while the heating demand was 1208.66 kWh. The heating demand was reduced by 643.69 kWh by using the waste heat produced within the electrolyser and the fuel cell. At the start of the simulation, which was set to the 1st of January, a hydrogen tank SoC of 45% by a tank volume of 4 m3 at 300 bar was assumed, which corresponds to 135 bar, as 300 bar was considered to be 100% SoC.
HE, in contrast, calculated an energy requirement of 684 kWh delivered by the fuel cell with a hydrogen requirement of 61.6 kg. This is much less energy than the value calculated by Simulink, which is caused by the averaging behaviour used by HE. Within HE, 3590 kWh energy has been used inside the electrolyser for production of 68.3 kg hydrogen. As calculated in HE, 52.6 kWh energy was required for the production of 1 kg hydrogen while Simulink calculated a necessity of 53.21 kWh, which is in good agreement.
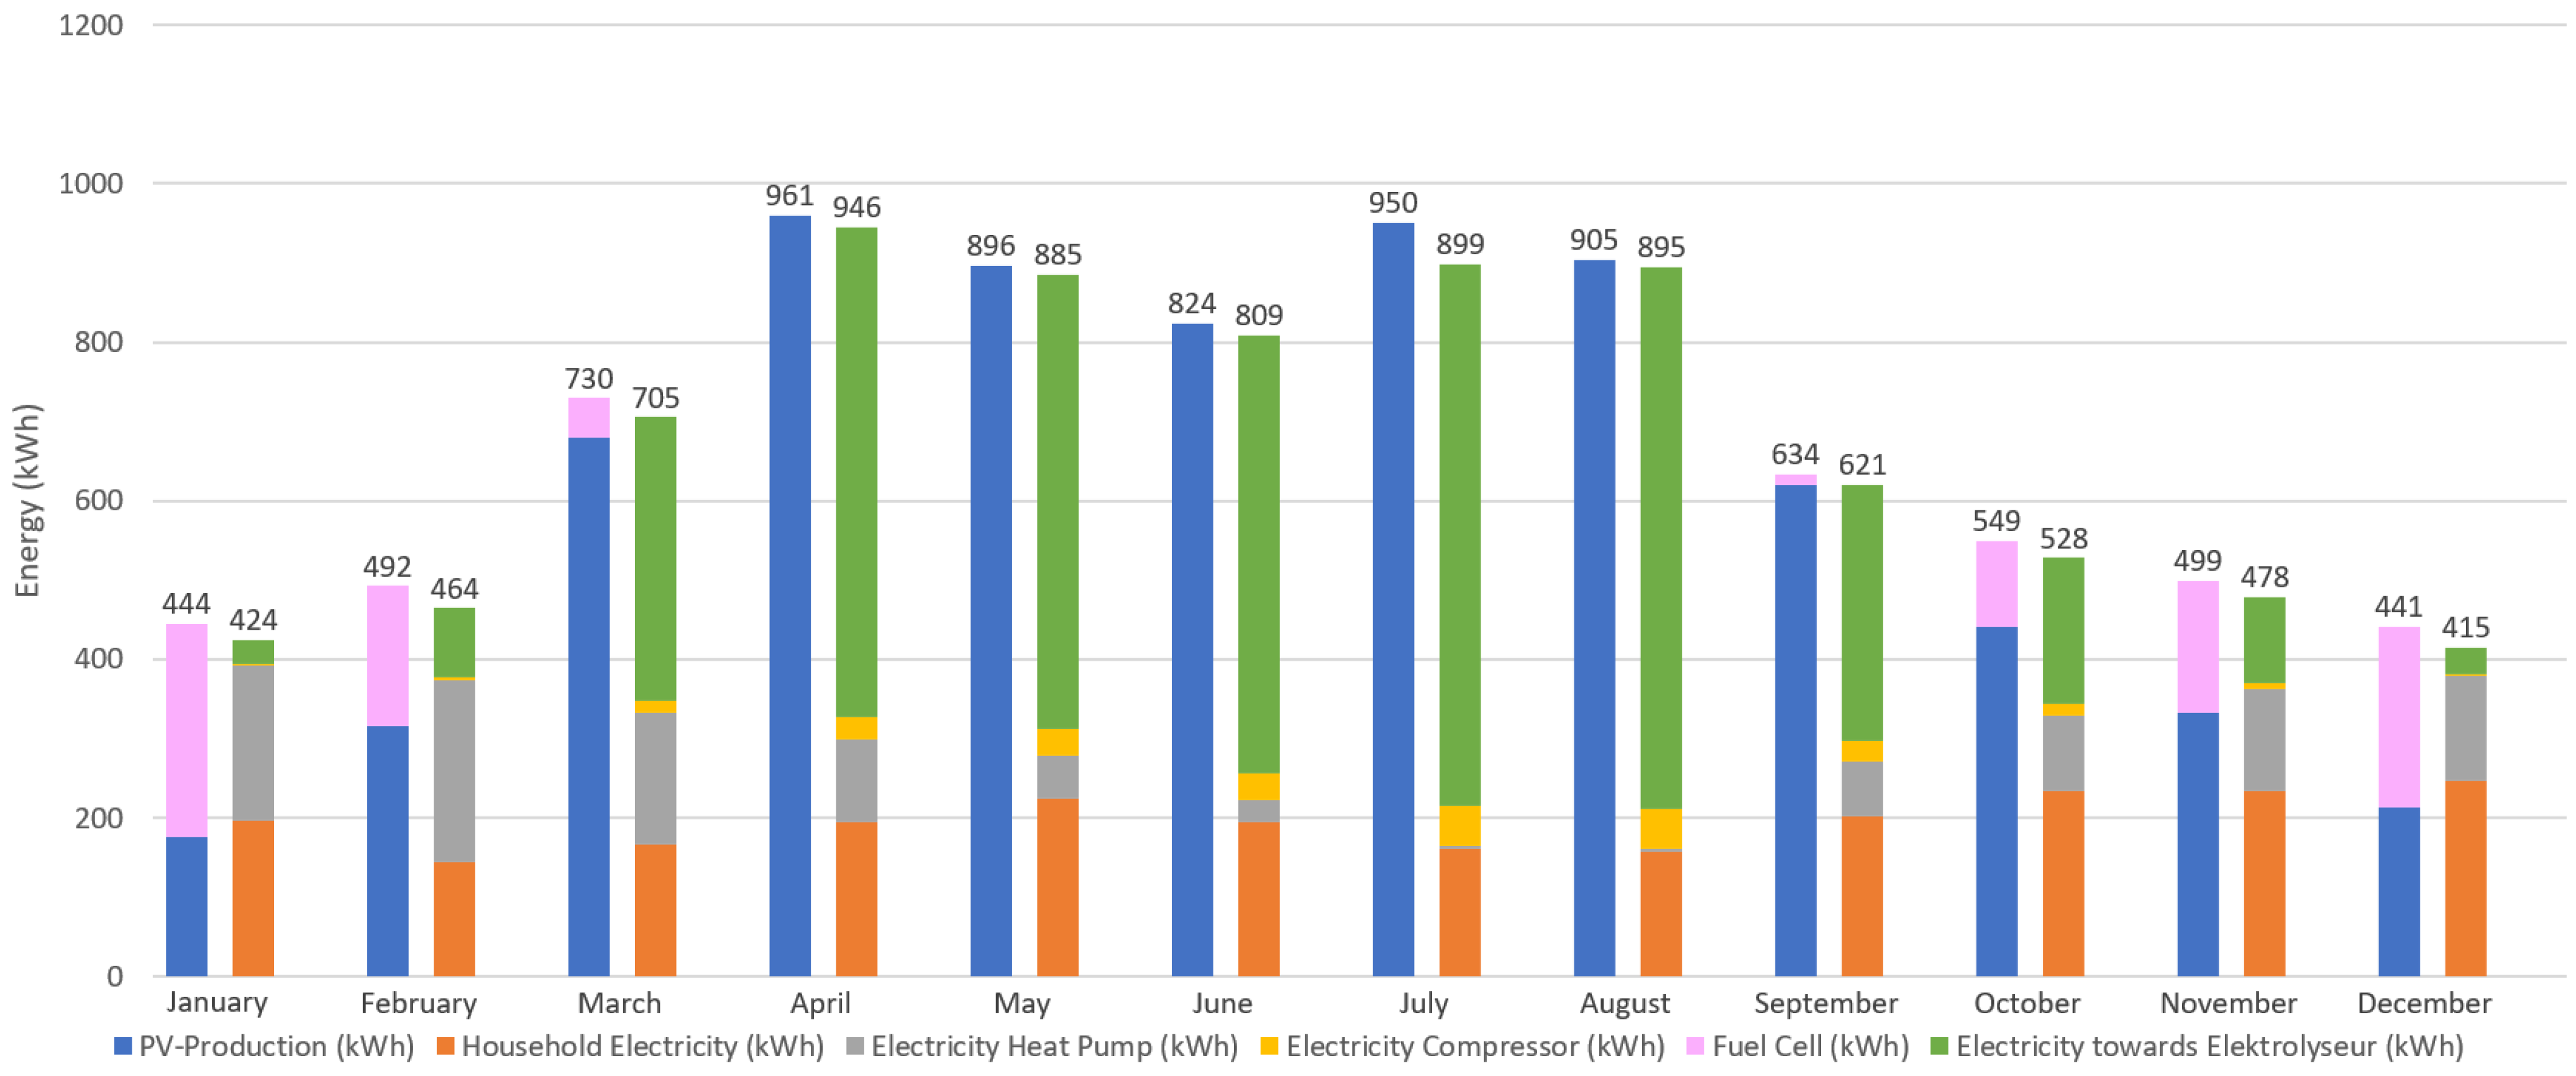
Figure 15 shows that the energy produced and consumed (which has been calculated using the same dimensioning of components within Simulink as well as HE) coincides very well. Only the produced PV energy and fuel cell energy differ due to the fact that in Simulink real data instead of averaged data were used.
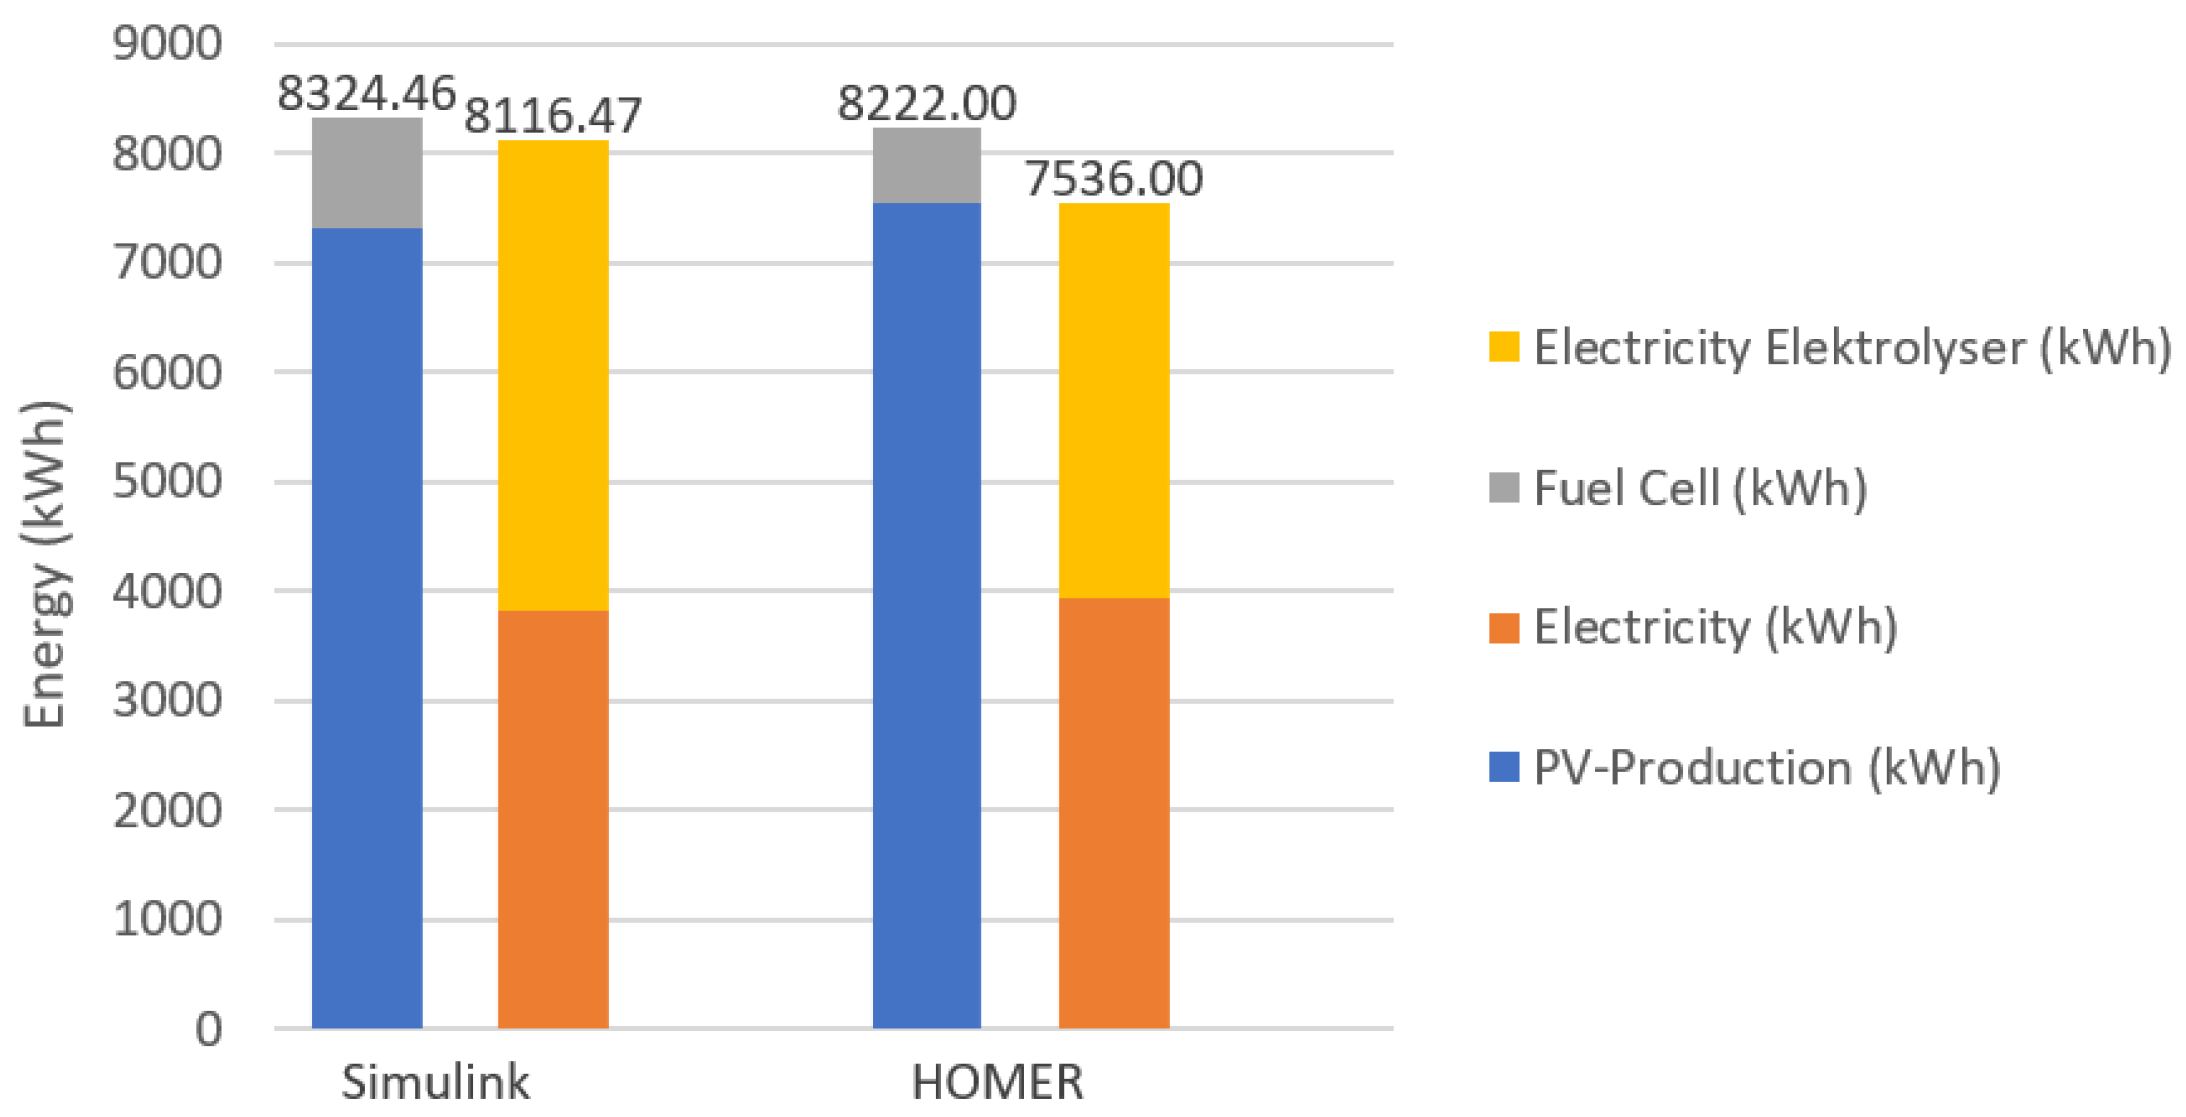
Figure 16 shows the energy flows over one year recorded by simulation. In the first diagram, the overall energy demand (yellow curve) and the energy produced by the PV system (blue curve) are shown. As can be seen, during the winter months the yellow curve is more dominant since the energy demand is higher than the energy provided by the PV system, while in summer the trend is reversed. In the second diagram, the SoC curves of hydrogen (blue curve) and the Li-ion battery (yellow curve) are depicted. The third diagram shows the moments of time when the electrolyser (yellow curve) and the fuel cell (blue curve) are switched on. The last diagram contains three curves: The orange curve represents the energy used inside the electrolyser for hydrogen production while the blue curve displays the energy provided by the fuel cell. Finally, the yellow curve represents the energy flow towards the Li-ion battery (negative value) and the energy supplied by the Li-ion battery (positive value), respectively.
Figure 16 shows that during summer the Li-ion battery with a capacity of 16 kWh has been sufficient to meet the energy demand (this also includes night demand). In contrast, in winter the Li-ion battery often has a low SoC and has been mainly charged by the fuel cell.
Within the Simulink simulation, the electrolyser has been switched on 303 times with an overall operation time of 1781.5 h while the fuel cell was switched on 168 times with an operation time of 801.5 h during the whole year. In contrast, HE calculated an operation time of the electrolyser of 1771 h and 43 starts of the fuel cell over one year with an operation time of 588 h.
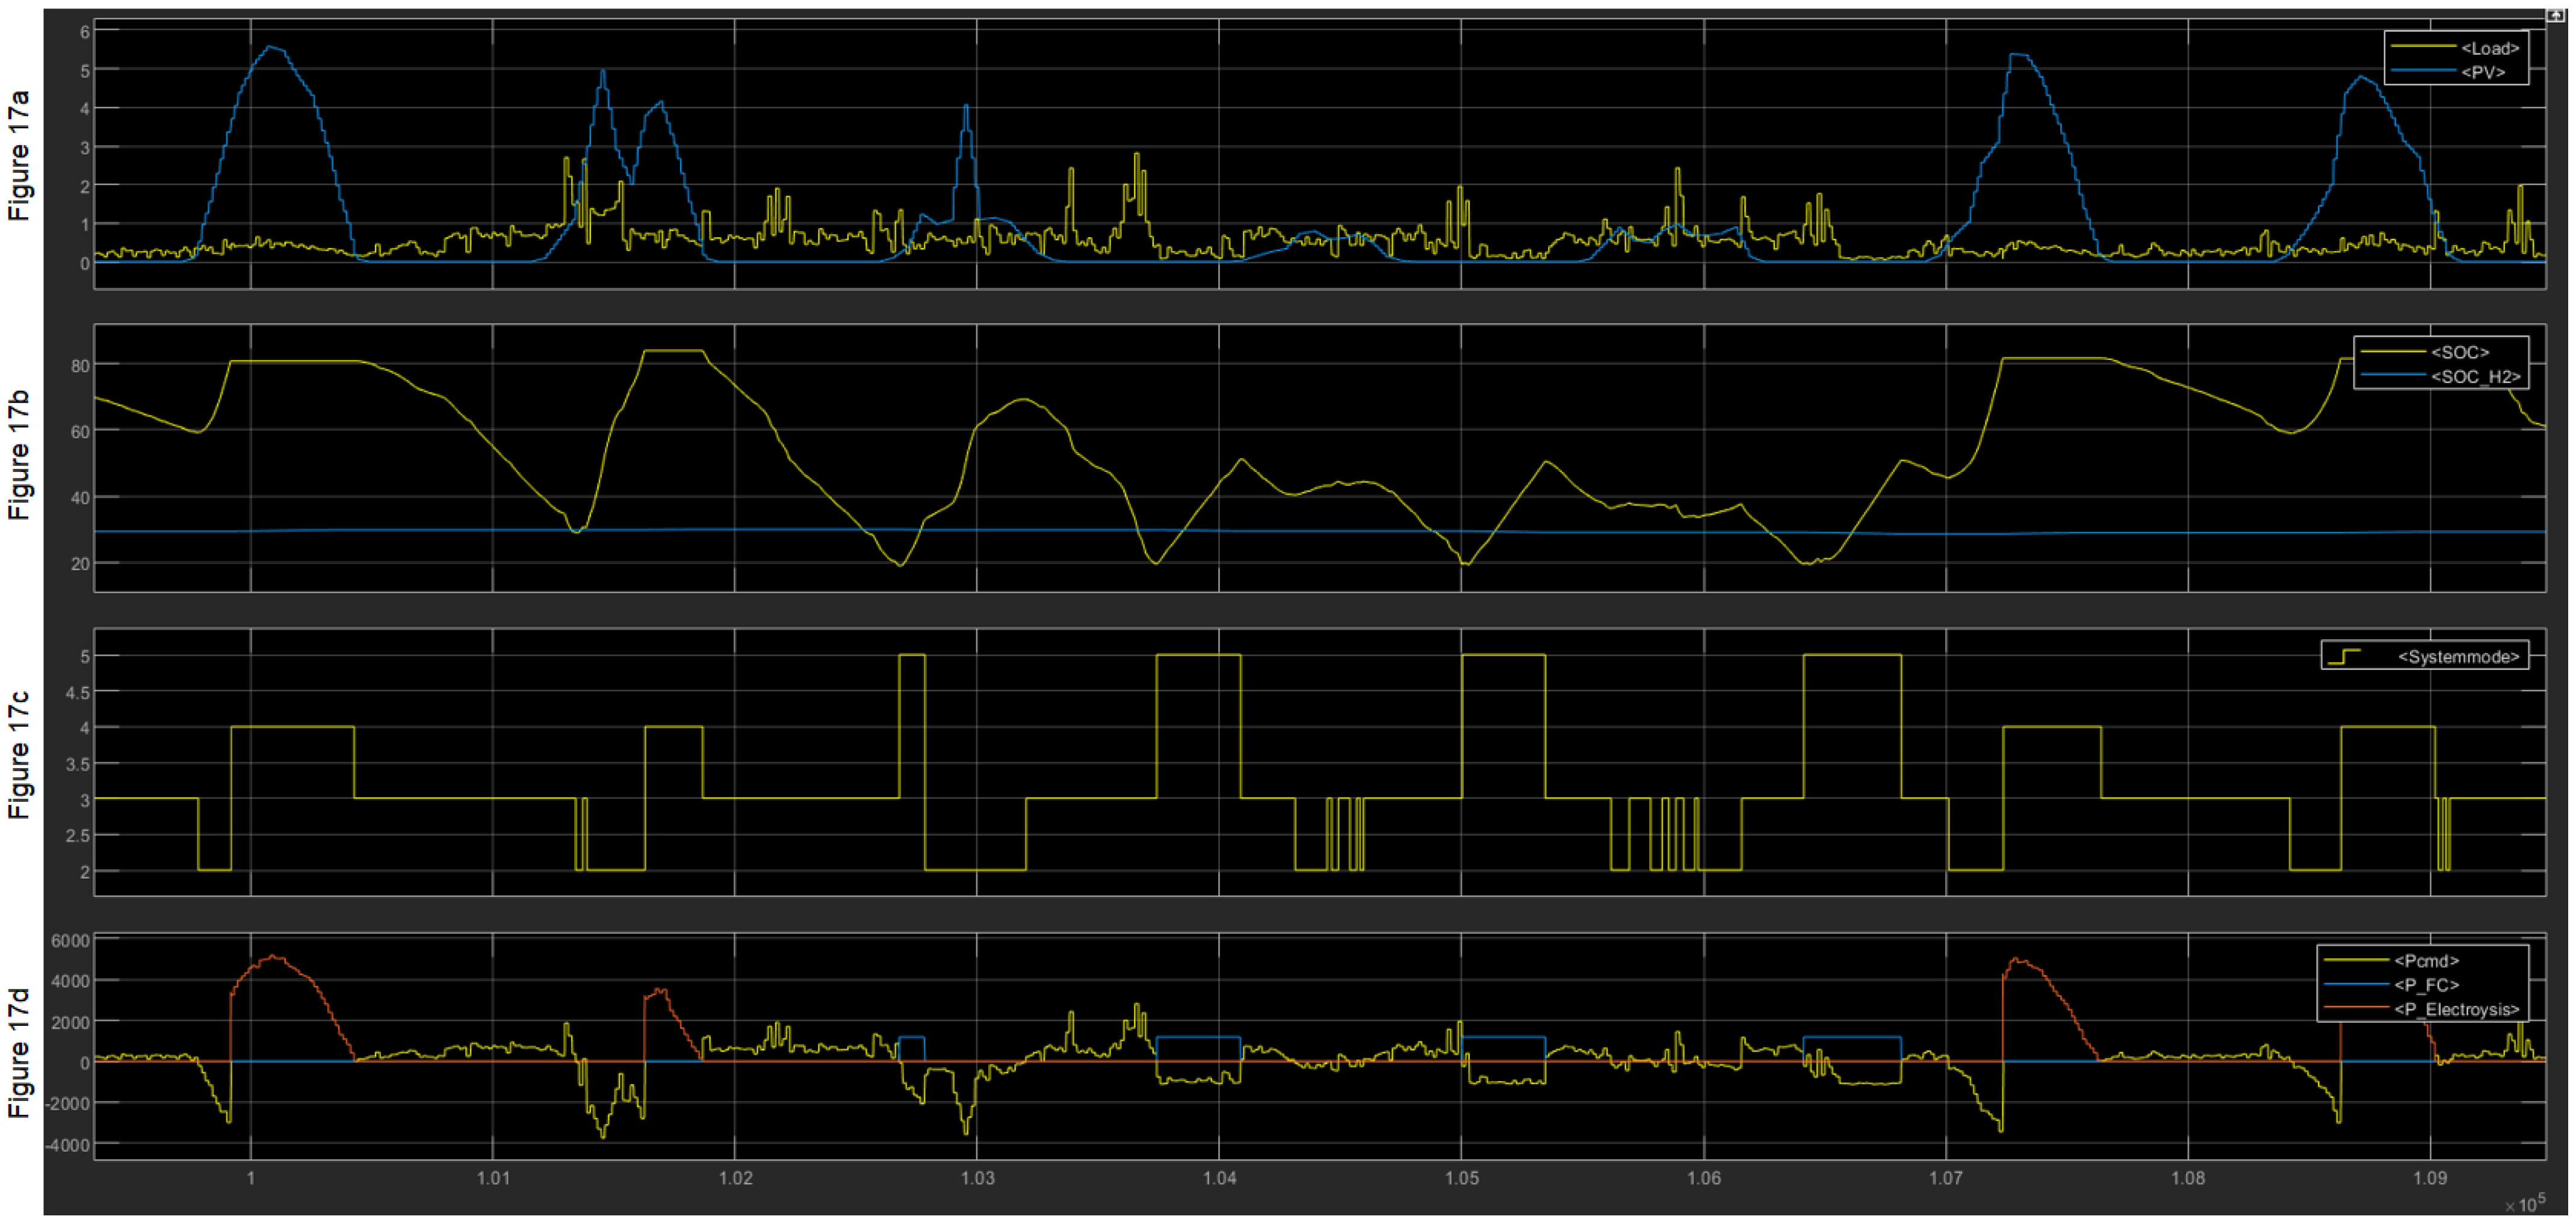
Figure 17 illustrates how the control system in this simulation approach works. The figure shows a section of the week starting on 10 March and ending on 16 March. This week includes days providing sufficient PV generation to operate the electrolyser as well as days when the fuel cell has to be switched on to cover the remaining energy demand. The system mode (Figure 17c) has five different stages:
  • Stage 1: Initial stage (only occurs at the beginning of the simulation);
  • Stage 2: Li-ion battery charging;
  • Stage 3: Li-ion battery discharging;
  • Stage 4: Electrolyser switched on;
  • Stage 5: Fuel cell switched on.
As can be seen in the first graph of the figure, during the sunshine hours of the first day of the week, the PV power is significantly higher than the power of the load. First, the Li-ion battery is fully charged up to the specified maximum SoC until late morning (Figure 17b). The electrolyser is then switched on to produce hydrogen using surplus PV energy. The electrolyser operates until the load exceeds the PV generation (Figure 17a). The power supplied to the electrolyser can be seen in Figure 17d. During the evening and night hours, the load is covered by the Li-ion battery. On the second day, the procedure is the same. Due to high loads in the night from the second to the third day, the Li-ion battery is discharged down to the specified minimum SoC, which causes the fuel cell to start up at mid-morning on the third day. However, this is only in operation until the PV generation exceeds the actual load. On the fourth day, the Li-ion battery is discharged to the specified minimum SoC and the fuel cell is activated again. On this day, however, the FC is only activated until the Li-ion battery is recharged to a predefined SoC of around 50%. At the bottom part of Figure 17, the power into and out of the Li-ion battery is shown. If the Li-ion battery is being discharged, the power P c m d is positive, and during charging the Li-ion battery, the power P c m d is negative. P c m d is zero as long as the electrolyser is switched on. If the fuel cell is switched on, the power into the Li-ion battery is calculated by:
P c m d = P L o a d P P V P F C
When the heat demand of a household is covered by electricity (heat pumps), a high impact on the load of the household is caused. Assuming future trends, the heat demand will be increasingly covered via electricity [53], which would again lead to a burden on the electricity grid which should be reduced within the context of the energy system approach. When endeavouring for energy autonomy of households, the heat demand should be considered as is it has been done in this approach. However, taking the heat demand into account leads to a significant increase in hydrogen storage and production requirements. The hydrogen demand increases from 24.07 kg to 73.52 kg (205% increase) when the heat demand of 4000 kWh/a is considered. In return, 91.07 kg hydrogen instead of 80.50 kg hydrogen has been produced when neglecting the heat demand. In the example presented, a well-insulated house with a correspondingly low heat demand of 4000 kWh/a was selected. If the heat demand of the household has to be doubled to 8000 kWh/a, the hydrogen demand would increase to 161.23 kg, which corresponds to an increase of 119% (in comparison to a heat demand of 4000 kWh/a).

7. Conclusions

The scope of this study was to present a verified hybrid energy system model created in Simulink which can be used to prospectively size future similar energy systems where hydrogen in combination with a Li-ion battery shall be used as the energy storage type. The comparison with HOMER Energy shows that the Simulink model developed calculates realistic solutions and therefore can be used to give profound suggestions for the sizing of such energy systems. With such a Simulink model, profitability analyses and lifetime analyses are possible. The consideration of 365 days plays an important role in order to make statements about the system sizing. Since the system components influence each other, it is only possible to analyse the direct influence of different parameter variations on the basis of such a simulation via the implementation of complex parameter studies. These studies will be focussed in future research work.
The energy system was verified by usage of an energy balance which is typical for a single-family house but can be individually scaled up by combining different input datasets and appropriately adjusting the component sizing, assuming that a common electrolyser, fuel cell and hydrogen tank are used. The simulation via Simulink showed that the consideration of the household heat demand greatly enlarges the required amount of decentralised stored hydrogen when aiming for an energy-independent operation.

8. Discussion

The simulation based on the presented Simulink model allows a more detailed and meaningful analysis of energy systems due to its significantly higher resolution compared to HOMER Energy. Due to the usually strong fluctuating load, temperature and irradiation profiles, a simulation with a resolution of 15 min allows a more precise statement about the suitability and sizing of various components than is possible using monthly averaged values such as the commonly used modelling approach in HOMER Energy. The Simulink model is therefore preferable for analysing the system behaviour. Furthermore, Simulink enables the introduction of direct component dependencies such as the integration of the waste heat generated by the FC and the electrolyser into the heating system and the direct conjunction of the FC and the hydrogen storage, which are not considered in HOMER Energy. Moreover, with Simulink, a more precise and specifically tailored control algorithm for every component which has a significant impact on the energy balance is feasible.
By simulation using Simulink, it can be seen whether the chosen component dimensioning and key parameters are suitable for guaranteeing off-grid operation. Therefore, the input parameters can be changed according to their own energy usage preferences and the designated location.
The simulation was performed by usage of a 15 min resolution, whereby the input datasets had to be averaged, and, as a result, sudden rapid changes in the datasets have been neglected. Ramp-up and start-up times of the components thereby have not been considered, while they are neglectable in the considered time scale. A higher resolution of the entire input data failed due to the weather and solar irradiance datasets that were only available in hourly resolution. Therefore, input datasets with a much higher resolution recorded by us will be involved in future research to achieve more realistic solutions.

9. Outlook

Future research has to focus on optimising the control system and on analysing which component dimensioning under which scenarios is preferable in terms of energy and resource efficiency and in terms of lifetime increase. An enhancement of the control algorithm is planned in the future to improve the lifetime of the FC by reducing the number of starts and stops of the FC. A lifetime behaviour simulation of the complete energy system is planned in future research which also includes degradation effects. In this context, a profitability analysis for this kind of energy system shall also be included in future research. Furthermore, comparison of the simulation results with a real system is planned.

Author Contributions

Methodology, software, validation, formal analysis, investigation, data curation, writing—original draft preparation, writing—review and editing and visualisation, M.C.M.; supervision, project administration, editing S.K. All authors have read and agreed to the published version of the manuscript.

Funding

This research received no external funding.

Data Availability Statement

Data are available in a publicly accessible repository. The data presented in this study are openly available in https://rossa-prod-ap21.ethz.ch:8443/delivery/DeliveryManagerServlet?dps_pid=IE594964 at https://doi.org/10.1145/2750858.2807538 (accessed on 13 February 2022).

Conflicts of Interest

The second author is the guest editor of this special issue.

Nomenclature

GeneralLi-ion battery
DCdirect currentSoCstate of charge
DWDDeutscher Wetterdienst P n o r m rated power of the Li-ion battery
FCfuel cell P m i n , L i I o n maximum discharge power of Li-ion battery
HEHOMER Energy
MTTFmean time to failure P m a x , L i I o n maximum charge power of Li-ion battery
PEMFCproton exchange membrane fuel cell
P r a t e d power towards or out of the Li-ion battery
PVphotovoltaic
RESRenewable Energy Source
VDIVerein Deutscher Ingenieure
PV systemElectrolyser
STCstandard test conditionsPEMProton Exchange Membrane
I y actual current of the PV system H 2 Hydrogen
I S C short circuit current V ( T , p ) electrolyser voltage
I M P maximum power point current e r e v ( T , p ) reverse voltage (V)
V y actual voltage of the PV system I electrolyser input current
V M P maximum power point voltage R i ( T , p ) initial PEM cell resistance
V O C open circuit voltage n s cells in series within a stack
I S C S short circuit current under STC n p rows of cells in parallel within a stack
I M P S maximum power point current under ST
e r e v 0 reference reverse voltage (at 20 °C and 1 bar)
G actual irradiance
G s irradiance under STC R universal gas constant
T c actual cell temperature T actual electrolyser temperature
T s cell temperature under STC F Faraday constant
V O C S open circuit voltage under STC p working pressure inside the electrolyser
V M P S maximum power point voltage under STC
p 0 ambient pressure
α Temperature coefficient of the current R i 0 reference cell resistance (at 20 °C and 1 bar)
β temperature coefficient of the voltage v H 2 hydrogen production rate inside the electrolyser
ω wind speed v m molar volume
k r PV module technology dependent coefficient N c number of cells of the electrolyser stack
k derived curve fitting parameter
Hydrogen storageHeat exchanger electrolyser
LOHCLiquid Organic Hydrogen Carrier C t h , S t a c k thermal capacitance of the electrolyser
P b actual hydrogen tank pressure Q ˙ H e a t , S t a c k total emerging waste heat powerproduced inside the electrolyser
P b i initial hydrogen tank pressure
N H 2 flow rate of the produced hydrogen Q ˙ L o s s total heat loss due to natural convection and radiation
T b operating temperature during hydrogen storage procedure Q ˙ C o o l i n g heat extracted from the stack by the cooling system
M H 2 molar mass of hydrogen Q ˙ H e a t , C e l l emerging waste heat inside one electrolyser cell
V B hydrogen tank volume
z compressibility factor N c e l l s E L Y number of electrolyser cells
V m molar volume V C e l l cell voltage of the electrolyser
ρ H 2 density of hydrogen V t n reversible voltage of the electrolyser
P e l , c o m p power for the compression of hydrogen I C e l l cell current of the electrolyser
k heat transfer coefficient between the air and the stack surface area
η e l electrical efficiency
η c o m p compressor efficiency A s lateral surface of the electrolyser
κ capacity ratio T a ambient temperature
m ˙ i n l e t flow   rate   of   H 2 towards the compressor m ˙ s t a c k mass   of   the   electrolyser   stack  
c p , s t a c k specific heat of the electrolyser stack
R j specific   gas   constant   of   H 2
T 1 temperature   of   H 2 at entrance T P E M E electrolyser stack temperature
p 1 pressures before the compression
p 2 pressures after the compression
Heat exchanger fuel cellHeat pump
N c e l l s F C number of FC cells W H P energy demand of the heat pump
P H e a t heat power generated in the fuel cell stack Q r e m a i n i n g remaining energy demand covered by the heat pump
P o v e r a l l total power available in the fuel towards the FC C O P Coefficient of Performance
P e l electrical power output of the FC
I S t a c k FC stack current
V S t a c k FC stack voltage
V C e l l s FC cell voltage
P H E F C exchanged heat power by the heat exchanger
U c o o l global heat transfer coefficient
A c o o l coolant contact area
T P E M F C FC stack temperature
T o u t coolant cycle output temperature
T i n coolant cycle input temperature

References

  1. Sarita, K.; Devarapalli, R.; Rai, P. Modeling and control of dynamic battery storage system used in hybrid grid. Energy Storage 2020, 2, e146. [Google Scholar] [CrossRef] [Green Version]
  2. Hydrogen Council. How Hydrogen Empowers the Energy Transition. Available online: https://hydrogencouncil.com/wp-content/uploads/2017/06/Hydrogen-Council-Vision-Document.pdf (accessed on 13 February 2022).
  3. Heusser, D.; Klebsch, W.; Appel, A. VDE Faktencheck—Wasserstoff in der Mobilität. Available online: https://www.vde.com/resource/blob/2026534/7034547d679353fd570b79bd96a2286e/vde-faktencheck-wasserstoff-in-der-mobilitaet-data.pdf (accessed on 13 February 2022).
  4. Umweltbundesamt. Energieverbrauch Privater Haushalte. Available online: https://www.umweltbundesamt.de/daten/private-haushalte-konsum/wohnen/energieverbrauch-privater-haushalte#hochster-anteil-am-energieverbrauch-zum-heizen (accessed on 7 December 2021).
  5. Umweltbundesamt. Energieverbrauch Nach Energieträgern und Sektoren. Available online: https://www.umweltbundesamt.de/daten/energie/energieverbrauch-nach-energietraegern-sektoren#allgemeine-entwicklung-und-einflussfaktoren (accessed on 7 December 2021).
  6. Wirth, H. Aktuelle Fakten zur Photovoltaik in Deutschland. Fraunhofer ISE, 2021. Available online: https://www.ise.fraunhofer.de/de/veroeffentlichungen/studien/aktuelle-fakten-zur-photovoltaik-in-deutschland.html (accessed on 13 February 2022).
  7. Luthander, R.; Lingfors, D.; Munkhammar, J.; Widén, J. Self-consumption enhancement of residential photovoltaics with battery storage and electric vehicles in communities. In Proceedings of the ECEEE Summer Study on Energy Efficiency, Hyères, France, 11 May 2015. [Google Scholar]
  8. Krauter, S. Simple and effective methods to match photovoltaic power generation to the grid load profile for a PV based energy system. Sol. Energy 2018, 159, 768–776. [Google Scholar] [CrossRef]
  9. Brisbois, M.C. Decentralised energy, decentralised accountability? Lessons on how to govern decentralised electricity transitions from multi-level natural resource governance. Glob. Transit. 2020, 2, 16–25. [Google Scholar] [CrossRef]
  10. Boulmrharj, S.; Khaidar, M.; Bakhouya, M.; Ouladsine, R.; Siniti, M.; Zine-dine, K. Performance Assessment of a Hybrid System with Hydrogen Storage and Fuel Cell for Cogeneration in Buildings. Sustainability 2020, 12, 4832. [Google Scholar] [CrossRef]
  11. Bose, T.K.; Agbossou, K.; Kolhe, M.; Hamelin, J. Case study—Stand-alone energy systems based on hydrogen production. In Hydrogen Implementing Agreement; International Energy Agency: Paris, France, 2003. [Google Scholar]
  12. Villa Londono, J.E.; Mazza, A.; Pons, E.; Lok, H.; Bompard, E. Modelling and Control of a Grid-Connected RES-Hydrogen Hybrid Microgrid. Energies 2021, 14, 1540. [Google Scholar] [CrossRef]
  13. Albarghot, M.; Sasi, M.; Rolland, L. MATLAB/Simulink modelling and experimental results of a PEM electrolyzer powered by a solar panel. In Proceedings of the IEEE Electrical Power and Energy Conference (EPEC), Ottawa, ON, Canada, 12–14 October 2016; pp. 1–6. [Google Scholar]
  14. Mohseni, S.; Brent, A.C.; Burmester, D. A comparison of metaheuristics for the optimal capacity planning of an isolated, battery-less, hydrogen-based micro-grid. Appl. Energy 2019, 259, 114224. [Google Scholar] [CrossRef]
  15. Trifkovic, M.; Sheikhzadeh, M.; Nigim, K. Modeling and control of a renewable hybrid energy system with hydrogen storage. IEEE Trans. Control Syst. Technol. 2013, 22, 169–179. [Google Scholar] [CrossRef]
  16. Bonitz, S. Zur Lebensdauerabschätzung von Brennstoffzellen mit den Methoden der Betriebsfestigkeit. Ph.D. Dissertation, Technische Universität Clausthal, Clausthal-Zellerfeld, Germany, 2016. [Google Scholar]
  17. MATLAB; Version 9.11 (R2021b); The MathWorks Inc.: Natick, MA, USA, 2021.
  18. Kleiminger, W.; Beckel, C. ECO data set (Electricity Consumption & Occupancy)—A Research Project of the Distributed Systems Group. 2016. ETH Zürich. Available online: https://rossa-prod-ap21.ethz.ch:8443/delivery/DeliveryManagerServlet?dps_pid=IE594964 (accessed on 7 December 2021).
  19. Deutscher Wetterdienst (DWD)—Climate Data Center. Available online: https://opendata.dwd.de/climate_environment/CDC/ (accessed on 7 December 2021).
  20. Energiewandlung, V.F. VDI 4655—Reference load profiles of single-family and multi-family houses for the use of CHP systems. Tech. Guidel. 2008, 11, 123. [Google Scholar]
  21. Heesen, H. Synthese von Strom-und Wärmeprofilen nach VDI 4655. Hochschule Trier. 2020. Available online: umwelt-campus.de/energietools (accessed on 7 December 2021).
  22. HOMER Energy LLC. HOMER (Hybrid Optimization of Multiple Energy Resources) Software. Version 3.14.5. Available online: https://www.homerenergy.com/products/pro/index.html (accessed on 13 February 2022).
  23. Matthes, I. Brandenburger Erzeugt Eigenen Strom Mit Wasserstoff. Available online: https://www.moz.de/nachrichten/wirtschaft/energie-brandenburger-erzeugt-eigenen-strom-mit-wasserstoff-50383121.html (accessed on 6 February 2022).
  24. Bellini, A.; Bifaretti, S.; Iacovone, V.; Cornaro, C. Simplified model of a photovoltaic module. In Proceedings of the Applied Electronics, Pilsen, Czech Republic, 9–10 September 2009; pp. 47–51. [Google Scholar]
  25. Ayaz, R.; Nakir, I.; Tanrioven, M. An Improved Matlab-Simulink Model of PV Module considering Ambient Conditions. Int. J. Photoenergy 2014, 11, 315893. [Google Scholar] [CrossRef] [Green Version]
  26. Tamizhmani, G.; Ji, L.; Tang, Y.; Petacci, L.; Osterwald, C. Photovoltaic module thermal/wind performance: Long-term monitoring and model development for energy rating. In Proceedings of the NCPV and Solar Program Review Meeting, Denver, CO, USA, 1 June 2003; pp. 936–939. [Google Scholar]
  27. Kalogirou, S. Photovoltaik Systems. Solar Energy Engineering: Processes and Systems; Academic Press: New York, NY, USA, 2009; pp. 481–538. [Google Scholar]
  28. Al-Refai, M.A. Matlab/Simulink Simulation of Solar Energy Storage System. World Academy of Science, Engineering and Technology. Int. J. Electr. Comput. Eng. 2014, 8, 297–302. [Google Scholar]
  29. Wang, C. Modeling and Control of Hybrid Wind/Photovoltaic/Fuel Cell Distributed Generation Systems. Ph.D. Thesis, The Montana State University, Bozeman, MT, USA, 2006. [Google Scholar]
  30. Smith, A.F.G.; Newborough, M. Low-cost polymer electrolysers and electrolyser implementation scenarios for carbon abatement. Rep. Carbon Trust. ITM-Power 2004, 11, 451. [Google Scholar]
  31. Beainy, A.; Karami, N.; Moubayed, N. Simulink Model for a PEM Electrolyzer Based on an Equivalent Electrical Circuit. In Proceedings of the International Conference on Renewable Energies for Developing Countries, Beirut, Lebanon, 26–27 November 2014; pp. 145–149. [Google Scholar]
  32. Atlam, O.; Kolhe, M. Equivalent electrical model for a proton exchange membrane (PEM) electrolyser. Energy Convers. Manag. 2011, 52, 2952–2957. [Google Scholar] [CrossRef]
  33. Stolzenburg, K. Speicheroptionen für Wasserstoff, 7. In Energie-Effizienz-Netzwerktreffen “Wasserstofftechnologien—Entwicklung und Perspektiven”; Mariko/Leer: Oldenburg, Germany, 2019. [Google Scholar]
  34. Rudow, F. Wasserstoffspeicherung im Metallhydrid. Zürich, Rämibühl Mathematisch-Naturwissenschaftliches Gymnasium. Available online: http://fdchemie.pbworks.com/f/Wasserstoffspeicherung%20im%20Metallhydrid%20-%20Florian%20Rudow.pdf (accessed on 3 March 2022).
  35. TüV Süd—Speicherung von Wasserstoff. Available online: https://www.tuvsud.com/de-de/indust-re/wasserstoff-brennstoffzellen-info/wasserstoff/speicherung-von-wasserstoff (accessed on 3 March 2022).
  36. Brückner, N.; Obesser, K.; Bösmann, A.; Teichmann, D.; Arlt, W.; Dungs, J.; Wasserscheid, P. Evaluation of Industrially applied heat-transfer fluids as liquid organic hydrogen carrier systems. ChemSusChem 2014, 7, 229–235. [Google Scholar] [CrossRef] [PubMed]
  37. Jordan, T. Skript zur Vorlesung über Wasserstofftechnologie; Institut für Kern-und Energietechnik, Forschungszentrum Karlsruhe GmbH: Karlsruhe, Germany, 2007. [Google Scholar]
  38. Ingenieurkurse.de. Isentrope Zustandsänderung. Available online: https://www.ingenieurkurse.de/thermodynamik/uebungsaufgaben/2-hauptsatz-der-thermodynamik/einfache-zustandsaenderungen-des-idealen-gases/isentrope-zustandsaenderung.html (accessed on 7 December 2021).
  39. Motapon, S.N.; Dessaint, L.A.; Al-Haddad, K. A robust H2-consumption-minimization-based energy management strategy for a fuel cell hybrid emergency power system of more electric aircraft. IEEE Trans. Ind. Electron. 2014, 61, 6148–6156. [Google Scholar] [CrossRef]
  40. LeSage, J. Microgrid Energy Management System (EMS) Using Optimization. Available online: https://github.com/jonlesage/Microgrid-EMS-Optimization (accessed on 7 December 2021).
  41. MathWorks. Fuel Cell Stack. Available online: https://de.mathworks.com/help/physmod/sps/powersys/ref/fuelcellstack.html (accessed on 7 December 2021).
  42. Hausjournal. Die Optimale Temperatur für Heizung und Warmwasser. Available online: https://www.hausjournal.net/heizung-warmwasser-temperatur (accessed on 7 December 2021).
  43. Ottosson, A. Integration of Hydrogen Production via Water Electrolysis at a CHP Plant. Master’s Thesis, Luleå University of Technology, Department of Engineering Sciences and Mathematics, Luleå, Sweden, 2021. [Google Scholar]
  44. Rincon-Castrillo, E.D.; Bermudez-Santaella, J.R.; Vera-Duarte, L.E.; Garcia-Pabon, J.J. Modeling and simulation of an electrolyser for the production of HHO in Matlab-Simulink. Respuestas 2018, 24, 6–15. [Google Scholar] [CrossRef]
  45. Martinez, P.; Serra, M.; Costa-Castellò, R. Modeling and control of HTPEMFC based Combined Heat and Power for confort control. In Proceedings of the 22nd IEEE International Conference on Emerging Technologies and Factory Automation (ETFA), Turin, Italy, 12–15 September 2017; pp. 1–6. [Google Scholar]
  46. Lombardi, P.; Arendarski, B.; Suslov, K.; Shamarova, N.; Sokolnikova, P.; Pantaleo, A.M.; Komarnicki, P. A Net-Zero Energy System Solution for Russian Rural Communities. In Proceedings of the E3S Web of Conference, Online, 5 May 2018; p. 69. [Google Scholar]
  47. Sunman. Datasheet eArc SMA310M-6X10DW. Available online: https://greenakku.de/download/Datenblatt_Sunman_310.pdf (accessed on 7 December 2021).
  48. BYD. Datasheet BATTERY-BOX PREMIUM LVS 16.0. Available online: https://cdn.webshopapp.com/shops/264724/files/383278967/byd-b-box-lvs-datenblatt-2-0-de-inutec.pdf (accessed on 7 December 2021).
  49. H-Tec Systems. Datasheet H-TEC Series-S. Available online: https://www.hannovermesse.de/apollo/hannover_messe_2021/obs/Binary/A1089304/H-TEC%20SYSTEMS%20Datenblatt%20SERIES%20S30%20DE.PDF (accessed on 7 December 2021).
  50. ElringKlinger Kommt Mit Neuen Produkten Zur IAA. Available online: https://www.electrive.net/2018/09/14/elringklinger-kommt-mit-neuen-produkten-zur-iaa/ (accessed on 6 January 2022).
  51. H-Tec Systems. Elektrolyse-Stacks SERIES S30. Available online: https://www.h-tec.com/produkte/ (accessed on 6 January 2022).
  52. Quaschning, V. Regenerative Energiesysteme. Technologie—Berechnung—Klimaschutz; Updated and Extended Circulation; Hanser: München, Germany, 2019. [Google Scholar]
  53. Fraunhofer IWES/IBP. Wärmewende 2030. In Schlüsseltechnologien zur Erreichung der Mittel-und Langfristigen Klimaschutzziele im Gebäudesektor; Auftrag von Agora Energiewende: Kassel, Germany, 2017. [Google Scholar]
Figure 1. Input temperature and wind speed data (daily averaged values) (left) and input global and diffuse irradiance (daily averaged values) (right).
Energies 15 02201 g001
Figure 2. Input heat demand profile (left) and electrical load curve (right) over one year.
Energies 15 02201 g002
Figure 3. System architecture of the household energy system (image sources: [23]).
Energies 15 02201 g003
Figure 4. Input and output parameters for the control algorithm realised in Simulink chart.
Energies 15 02201 g004
Figure 5. Simulink model of the PV system (own figure based on [25]).
Energies 15 02201 g005
Figure 6. Layout of PV system in Simulink.
Energies 15 02201 g006
Figure 7. Simulink model of the electrolyser (own figure based on [13,29]).
Energies 15 02201 g007
Figure 8. Simulink model of hydrogen storage including a compressor (own figure based on [13]).
Energies 15 02201 g008
Figure 9. Simulink model of the lithium-ion battery (own figure based on [40]).
Energies 15 02201 g009
Figure 10. Calculation of waste heat generated by the electrolyser including coolant flow rate control and operating temperature calculation of the electrolyser (some parts based on [41,42,43]).
Energies 15 02201 g010
Figure 11. Calculation of waste heat energy supplied by the heat exchanger.
Energies 15 02201 g011
Figure 12. Calculation of residual heating demand and the required heat pump power and energy.
Energies 15 02201 g012
Figure 13. Simulink model of the overall household energy system (image sources: [50,51]).
Energies 15 02201 g013
Figure 14. Energy production (left bar) and energy consumption (right bar) calculated by Simulink simulation for each month.
Energies 15 02201 g014
Figure 15. Comparison of the energy produced and consumed by Simulink and HE (in kWh/a).
Energies 15 02201 g015
Figure 16. Different curves recorded by simulation of one year using Simulink model (first diagram (top (a)): PV power (blue) and overall load (yellow); second diagram (b): SoC of Li-ion battery (yellow) and SoC of hydrogen storage (blue); third diagram (c): electrolyser turned on (yellow) and fuel cell turned on (blue); fourth diagram (bottom (d)): energy provided by the fuel cell (blue), energy used by the electrolyser (orange) and energy flow towards the Li-ion battery (negative value) and energy supplied by the Li-ion battery (positive value) (yellow), respectively. (x-Axis: data points (1 data point for every minute within 1 year = ^ 525 , 600 data points)).
Energies 15 02201 g016
Figure 17. Simulation results for the week from 10 March to 16 March. First diagram (top (a)): PV power (blue) and overall load (yellow); second diagram (b): SoC of Li-ion battery (yellow) and SoC of hydrogen storage (blue); third diagram (c): electrolyser turned on (yellow) and fuel cell turned on (blue); fourth diagram (bottom (d)): energy provided by the fuel cell (blue), energy used inside the electrolyser (orange) and energy flow towards the Li-ion battery (negative value) and energy supplied by the Li-ion battery (positive value) (yellow), respectively.
Energies 15 02201 g017
Table 1. PV system characteristics (Type: SMA310M-6X10DW).
PV System CharacteristicsValue
Maximum Power Point at STC ( P mpp )310 W p
Maximum Power Point Voltage ( V mpp )33.3 V
Maximum Power Point Current ( I mpp )9.31 A
Open Circuit Voltage ( V O C )40.5 V
Short Circuit Current ( I S C )9.81 A
Temperature Coefficient V O C −0.28%/K
Temperature Coefficient I S C −0.02%/K
Number of modules in series11
Number of parallel strings2
Table 2. Electrolyser characteristics (Type: H-Tec S30/50).
Electrolyser CharacteristicsValue
Nominal hydrogen production rate1.10 Nm3/h
Hydrogen production range0.31–1.57 Nm3/h
Operating pressure0–20 bar
Nominal efficiency75%
Nominal power consumption5.00 kW
Max. power consumption9.38 kW
Nominal operating temperature62 °C
Current15–75 A
Voltage max.125 VDC
Number of cells50
Table 3. Li-ion battery characteristics (LVS 16.0 f. BYD).
Li-ion Battery CharacteristicsValue
Capacity (usable)16 kWh
Rated power12.8 kW
Rated peak power18.4 kW, 5 s
Efficiency95%
UsageOn/Off Grid
Ambient temperature−10 °C to 50 °C
Table 4. Fuel cell characteristics.
FC CharacteristicsValue
Type of Fuel CellPEM
Rated power1240 W
Maximum power2000 W
Voltage at maximum performance24.23 V at 52 A
H 2 pressure1.5 bar
Nominal operating temperature55 °C
Nominal efficiency35%
Number of Cells35
Table 5. Household characteristics.
Household CharacteristicsValue
Electricity demand2350 kWh/a
Heat demand4000 kWh/a
Living area160 m2
Dimensions surface area9 m × 9 m
KfW efficiency 40   ( 25 kWh m 2 · a )
Table 6. Hydrogen tank characteristics.
Hydrogen Tank CharacteristicsValue
Maximum tank pressure300 bar
Tank volume (at 1 bar)5 m3
Initial SoC60%
Publisher’s Note: MDPI stays neutral with regard to jurisdictional claims in published maps and institutional affiliations.

