
Waveguide Concentrator Photovoltaic with Spectral Splitting for Dual Land Use


Abstract
:1. Introduction
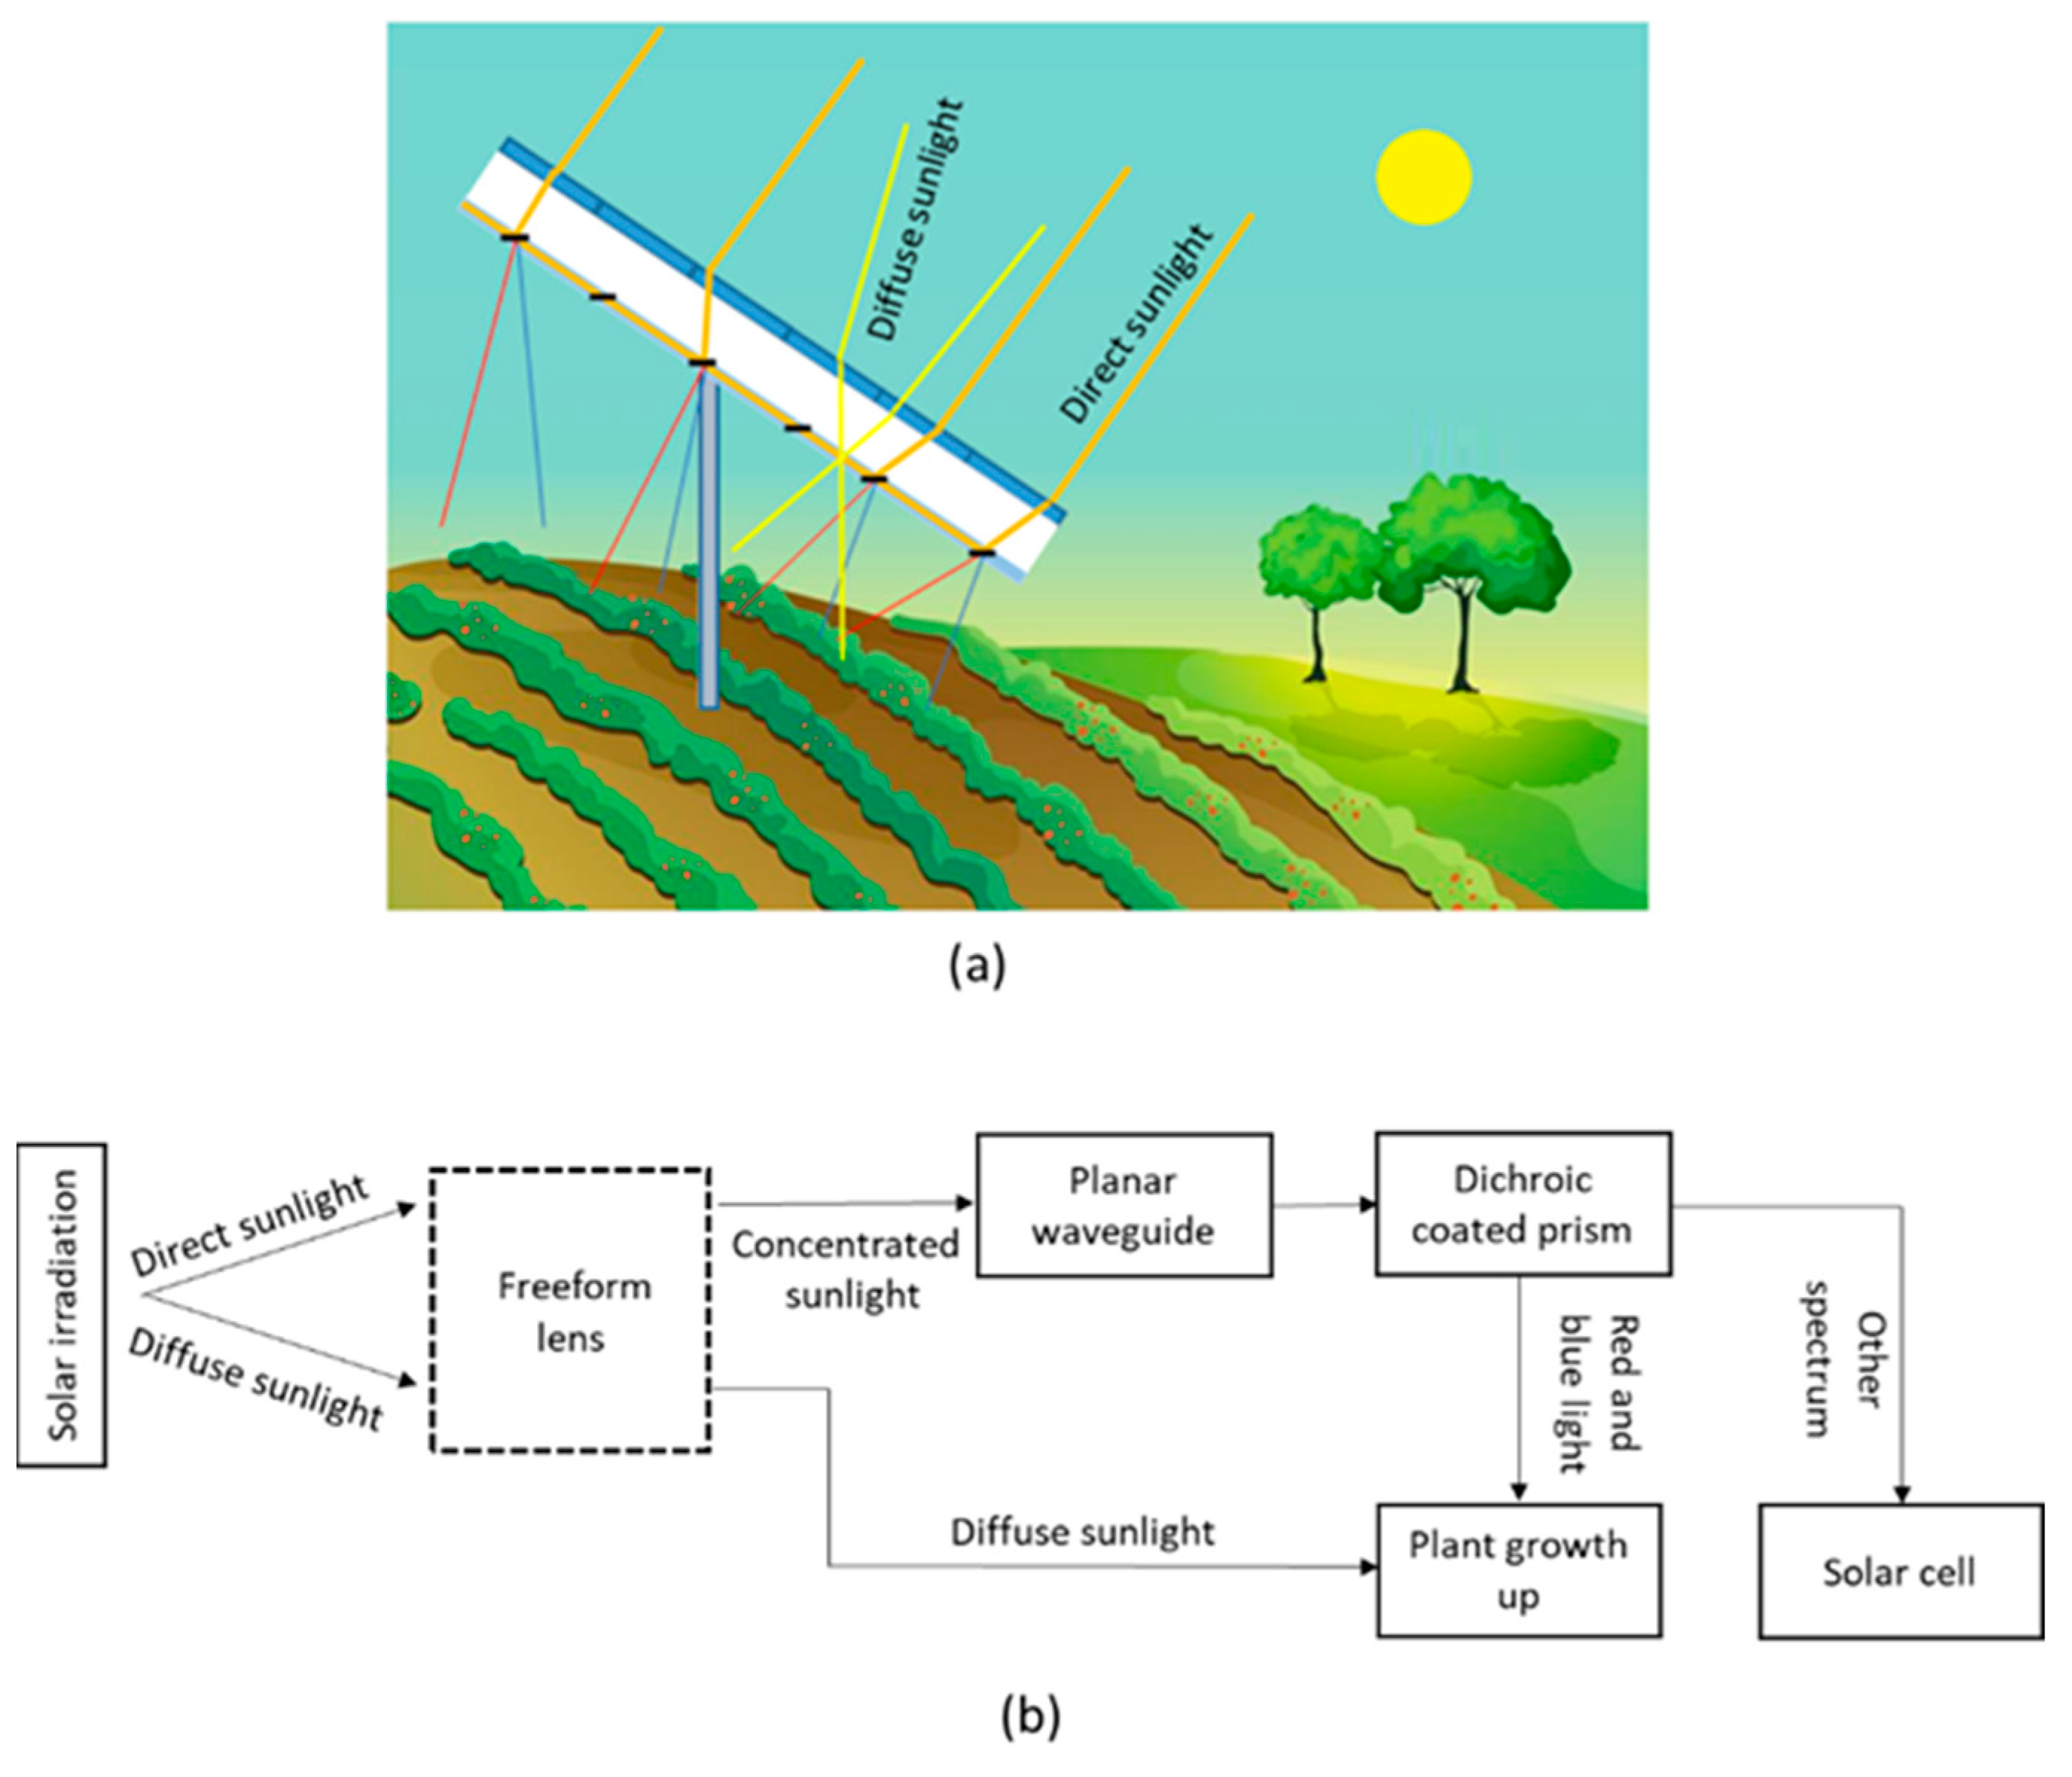
2. System Concept
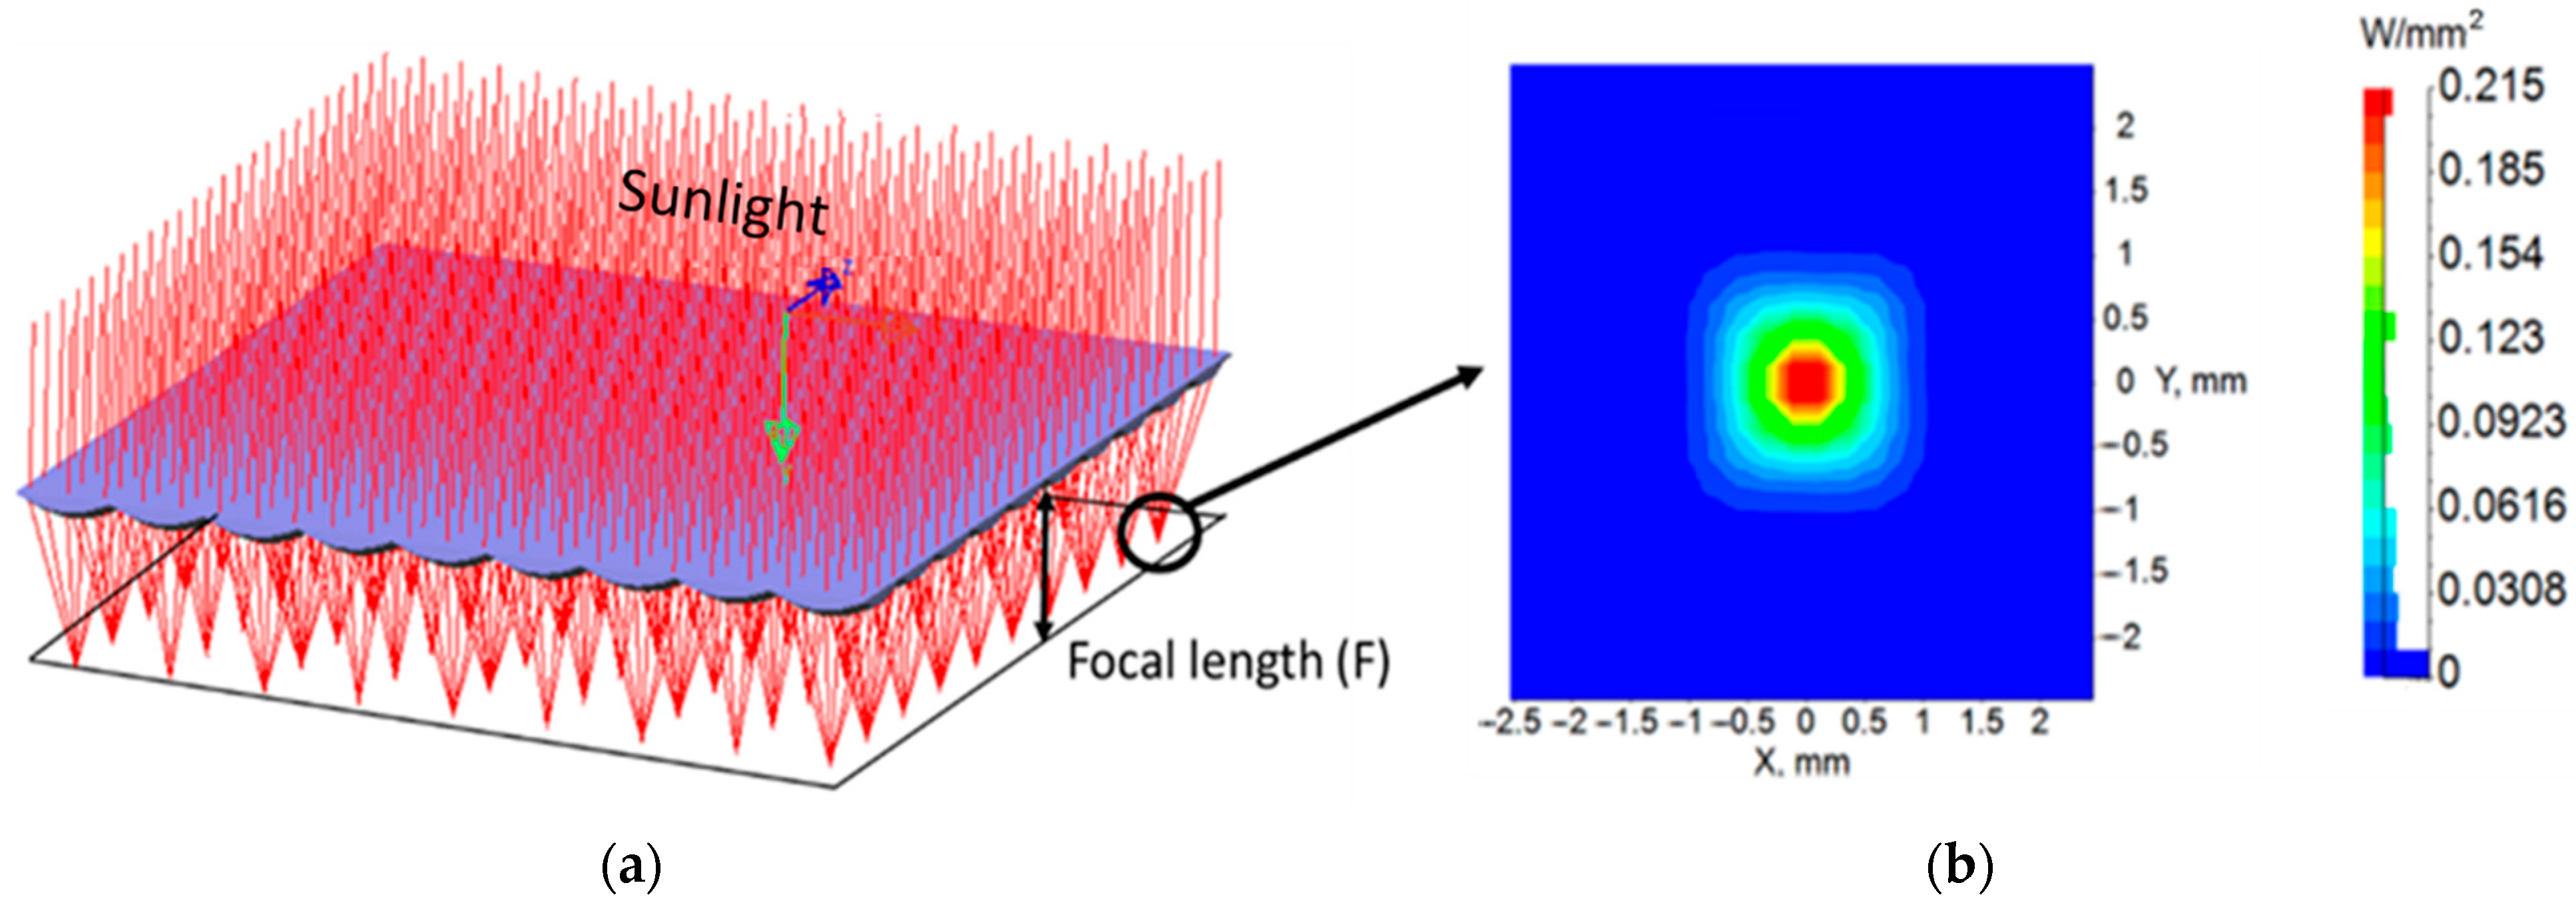
2.1. Freeform Lens Array
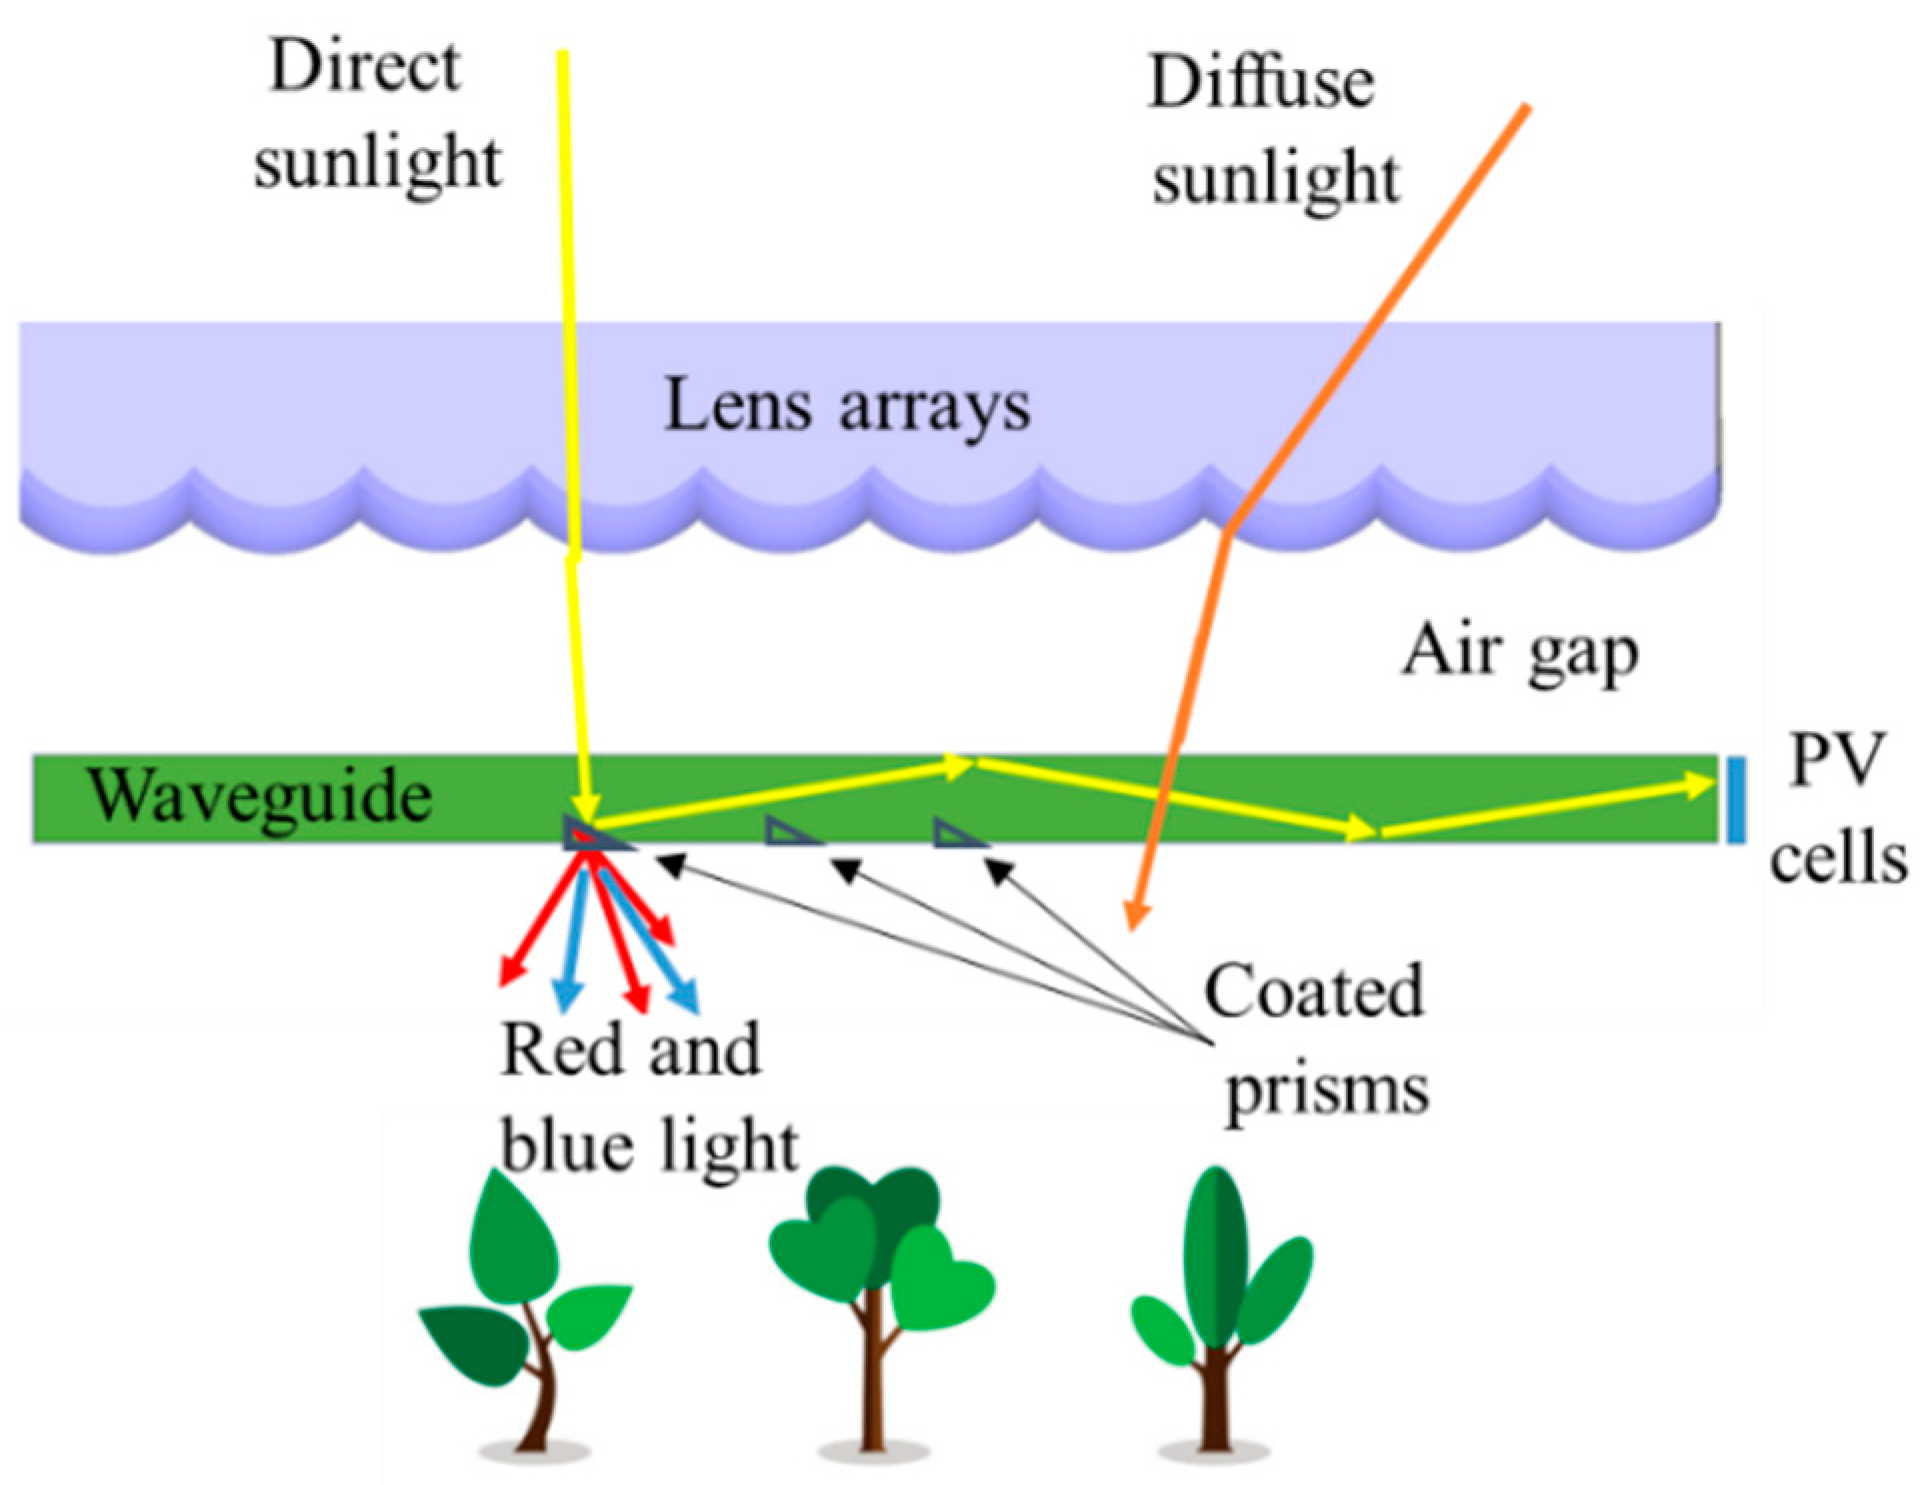
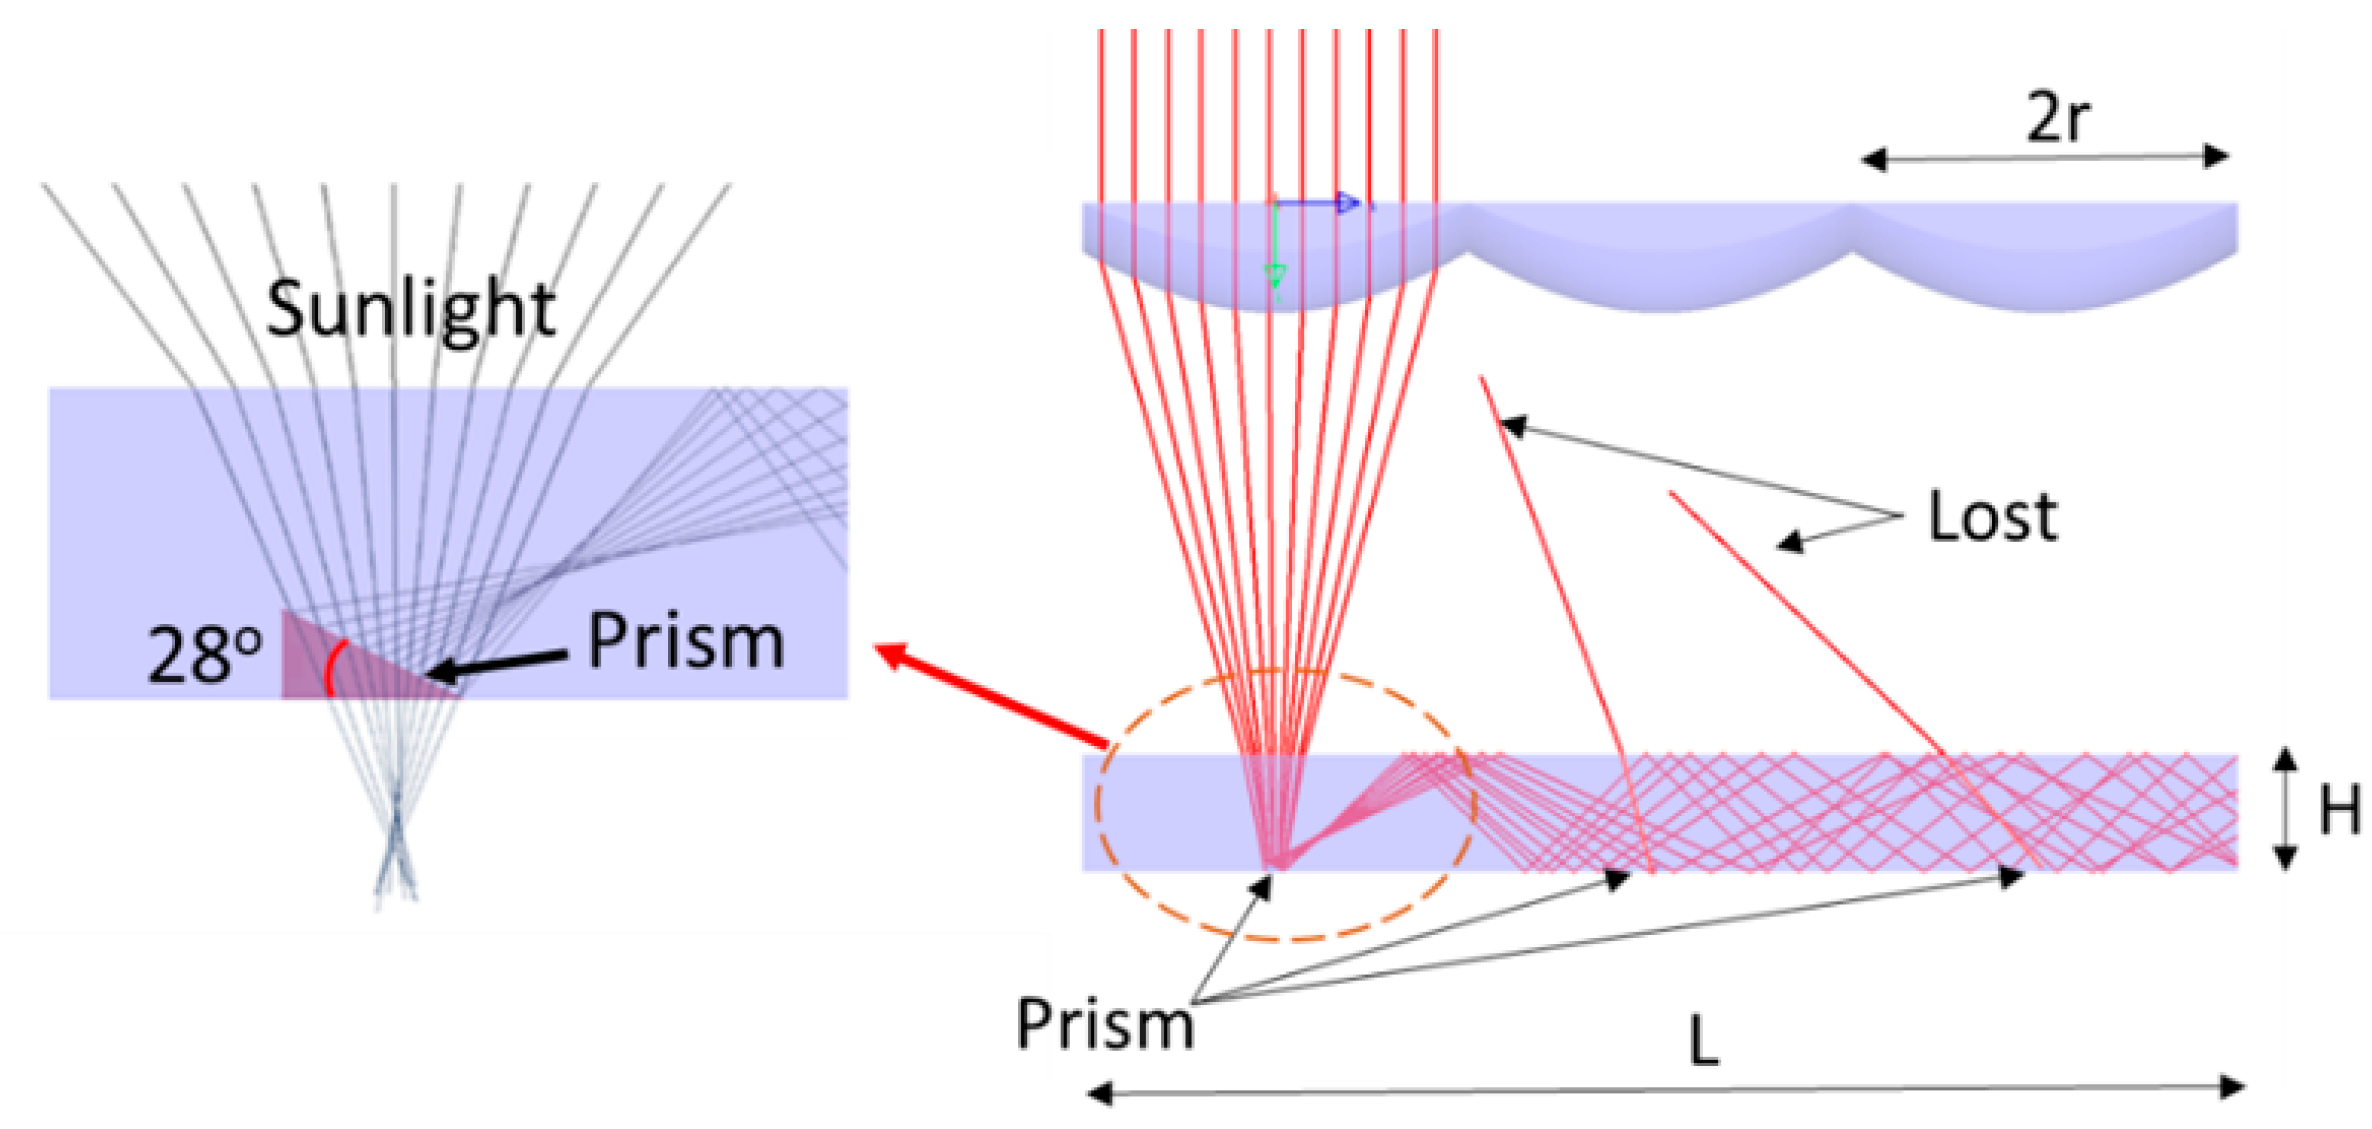
2.2. Flat Waveguides
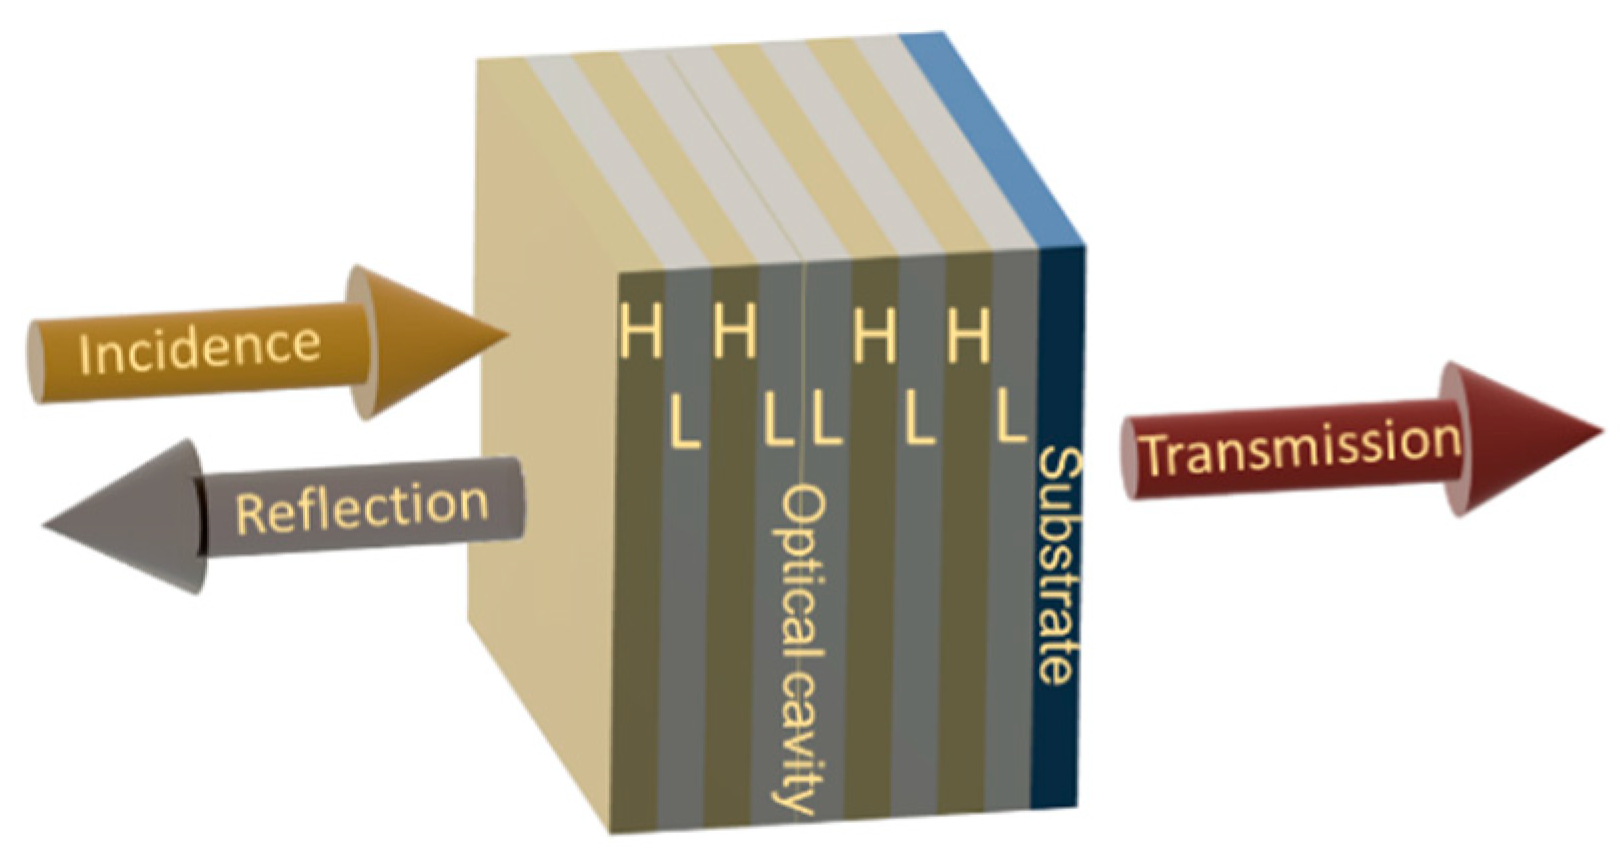
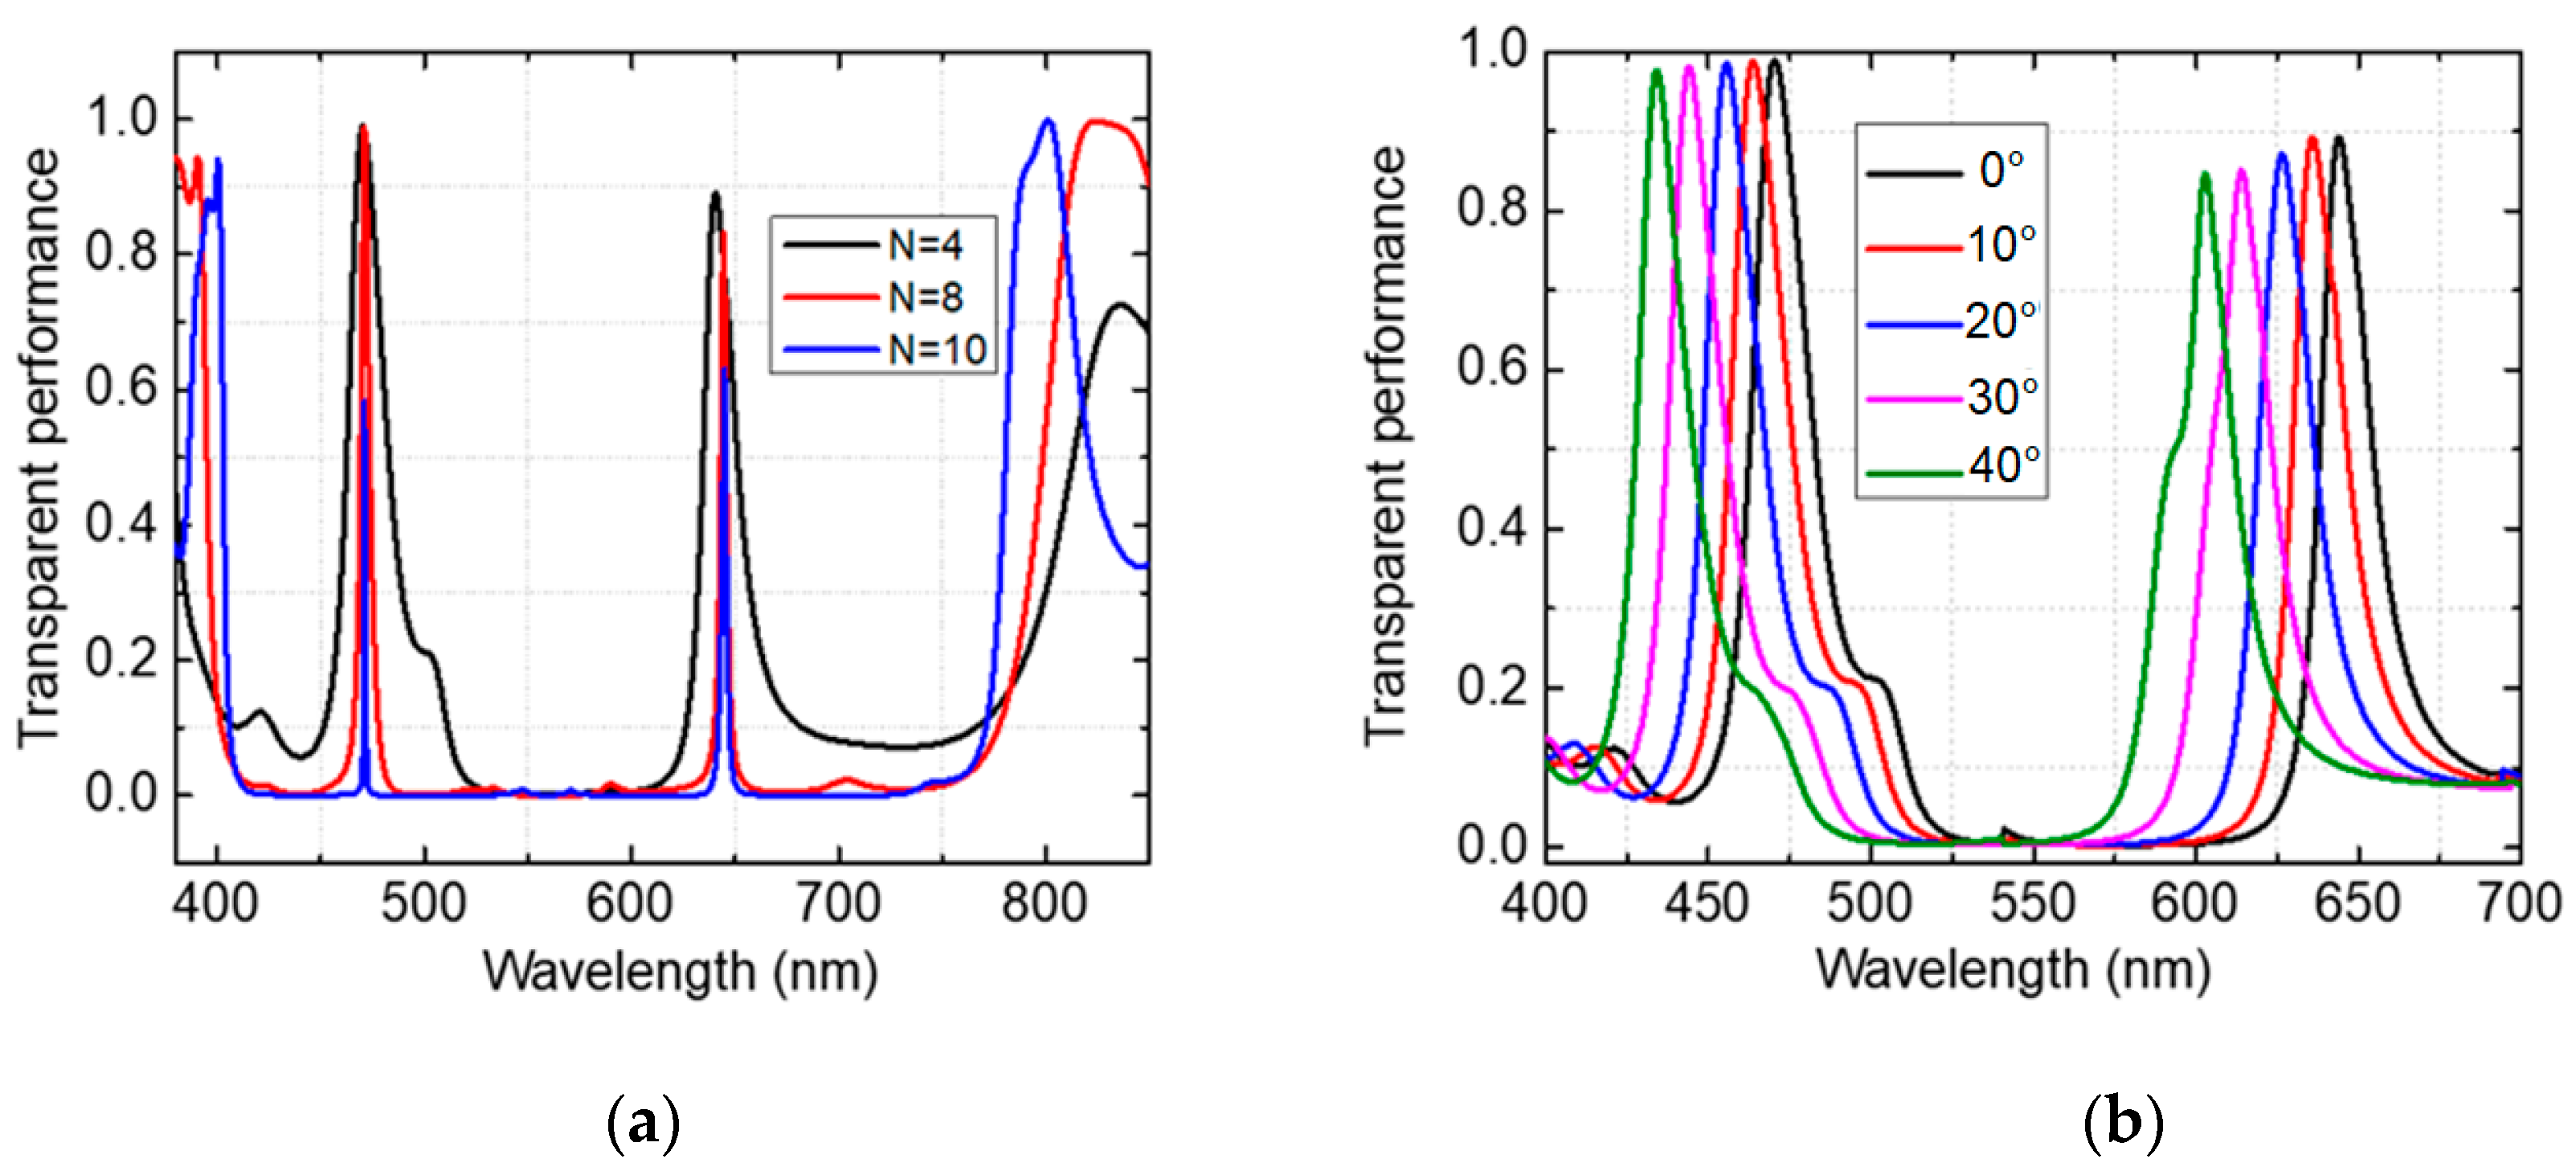
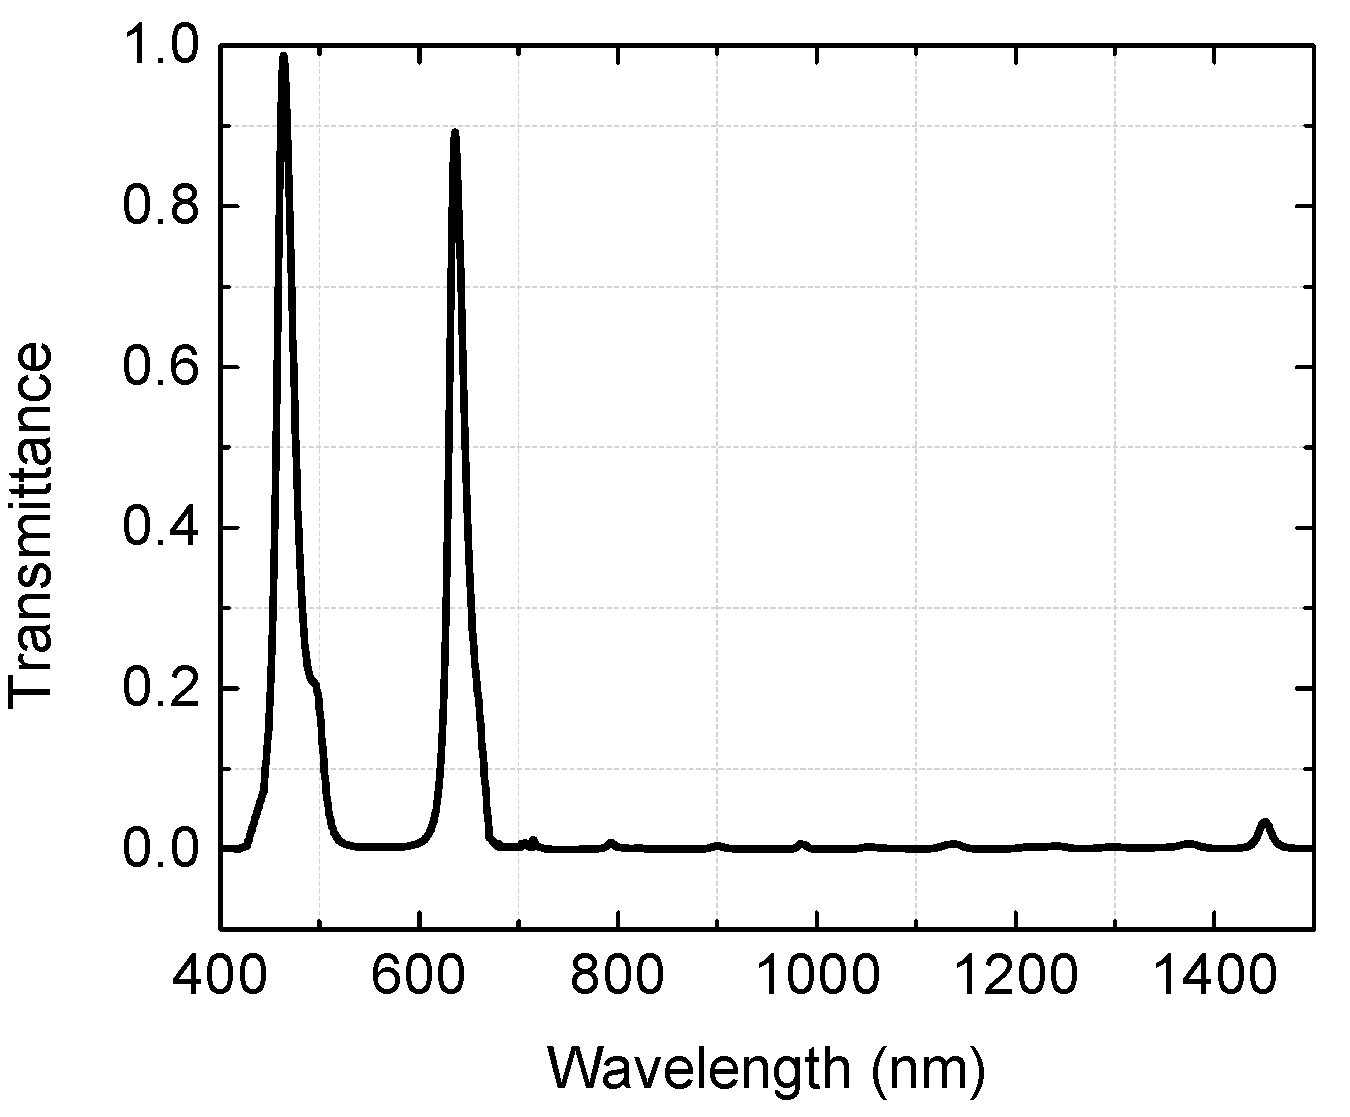
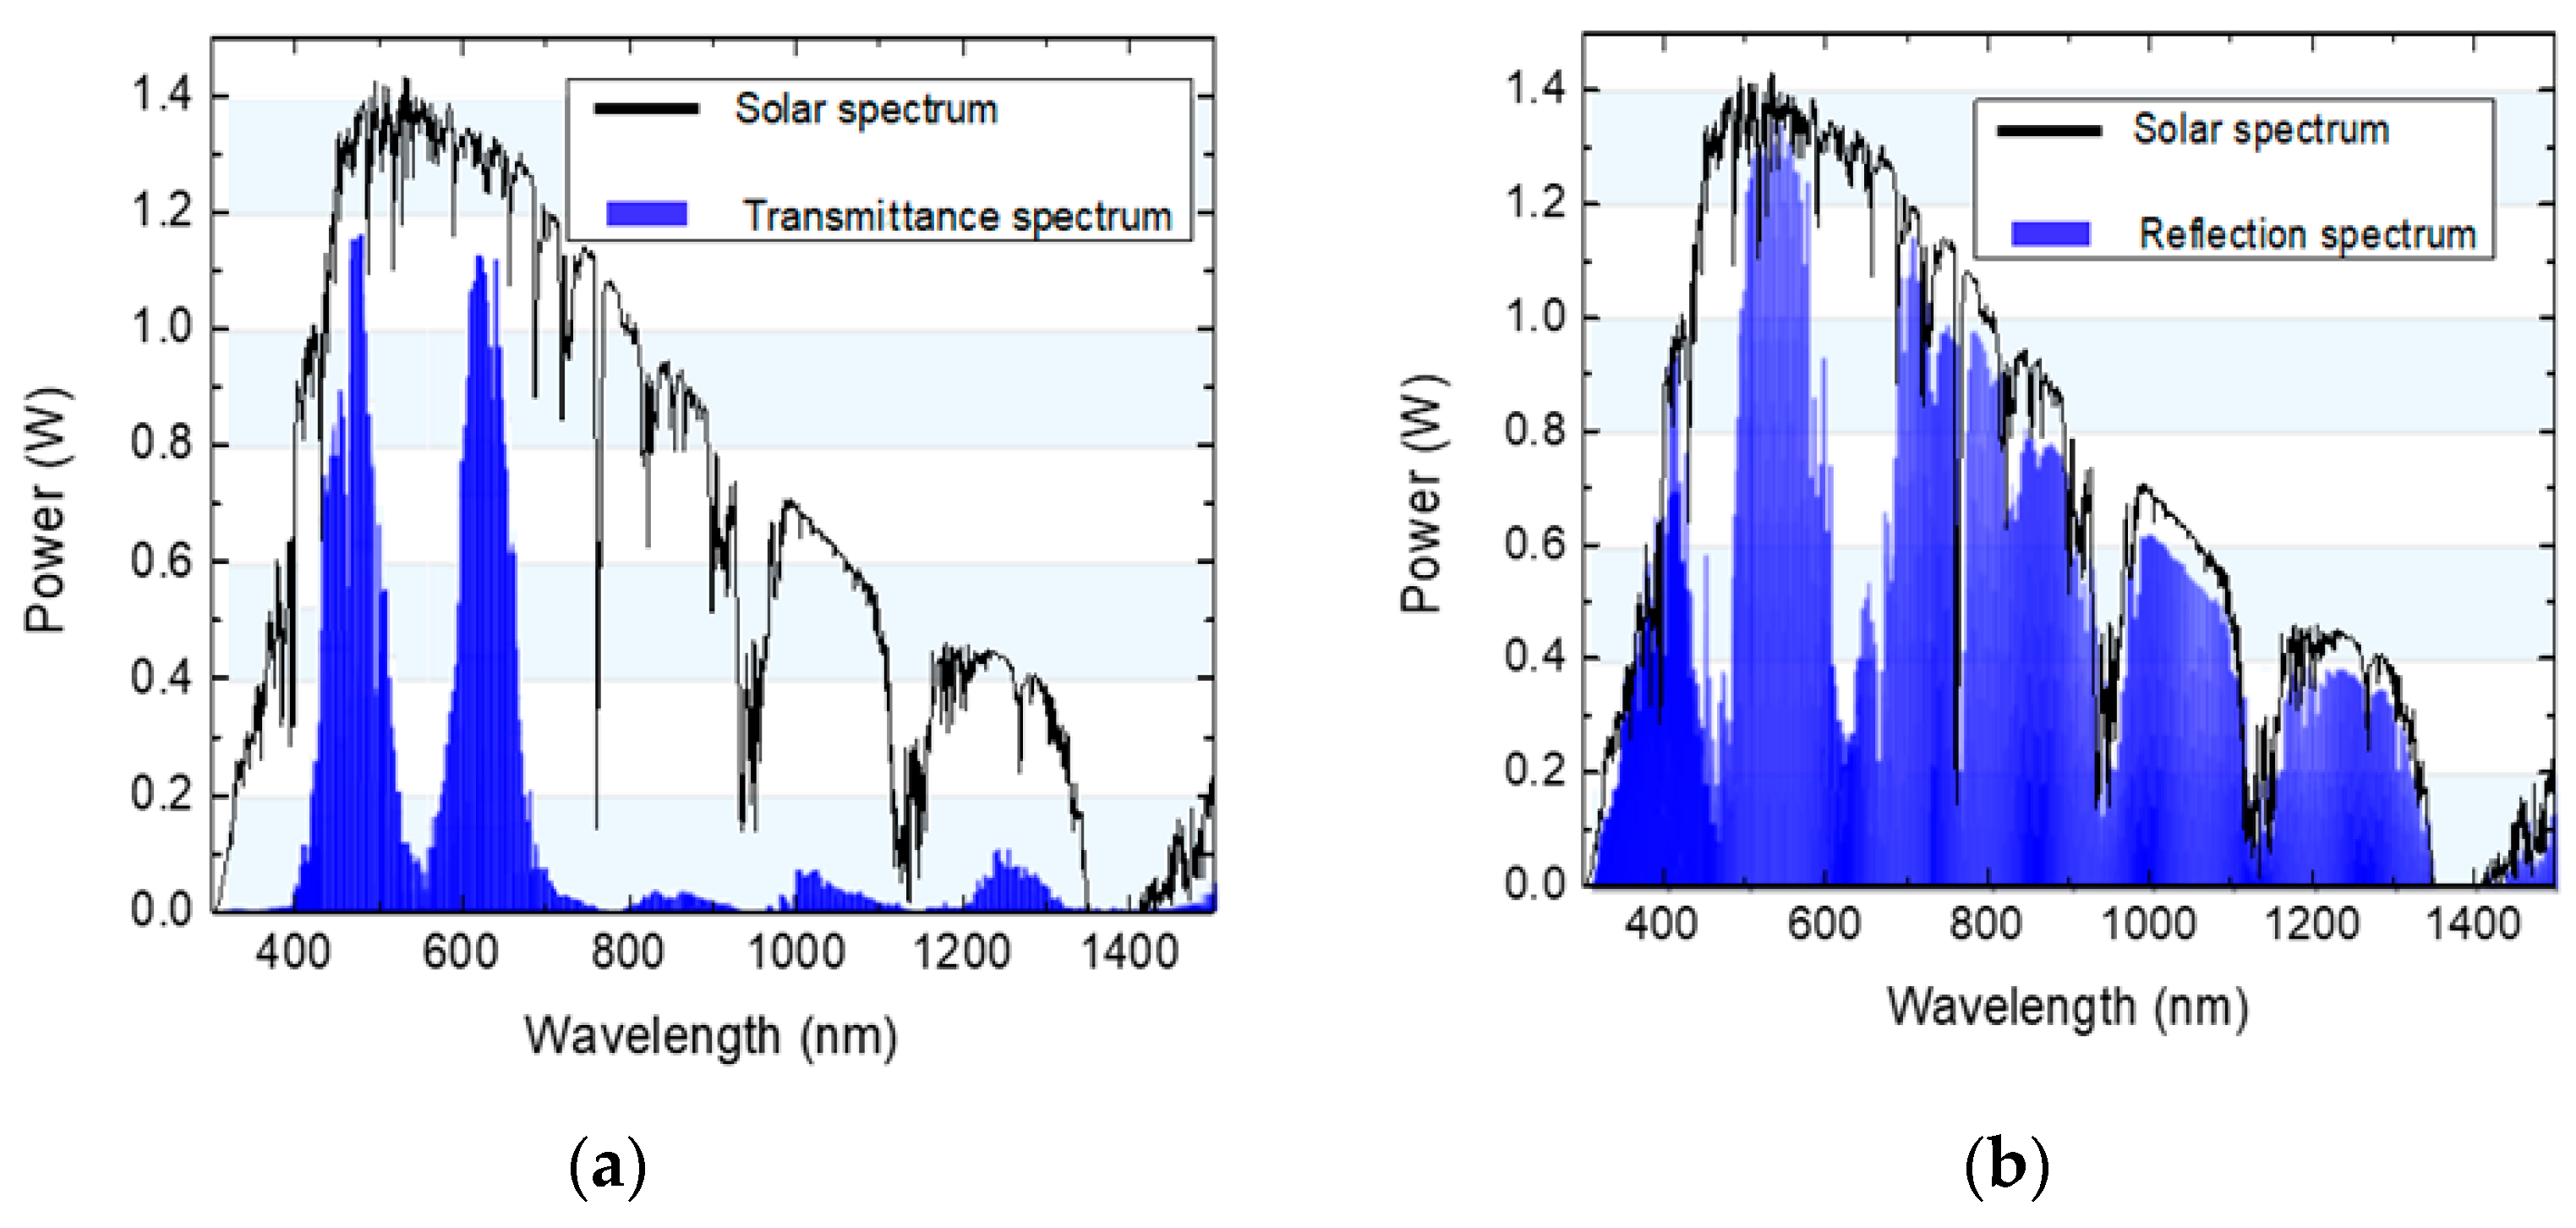
2.3. Dichroic Mirror Designs
3. System Design and Simulation Results
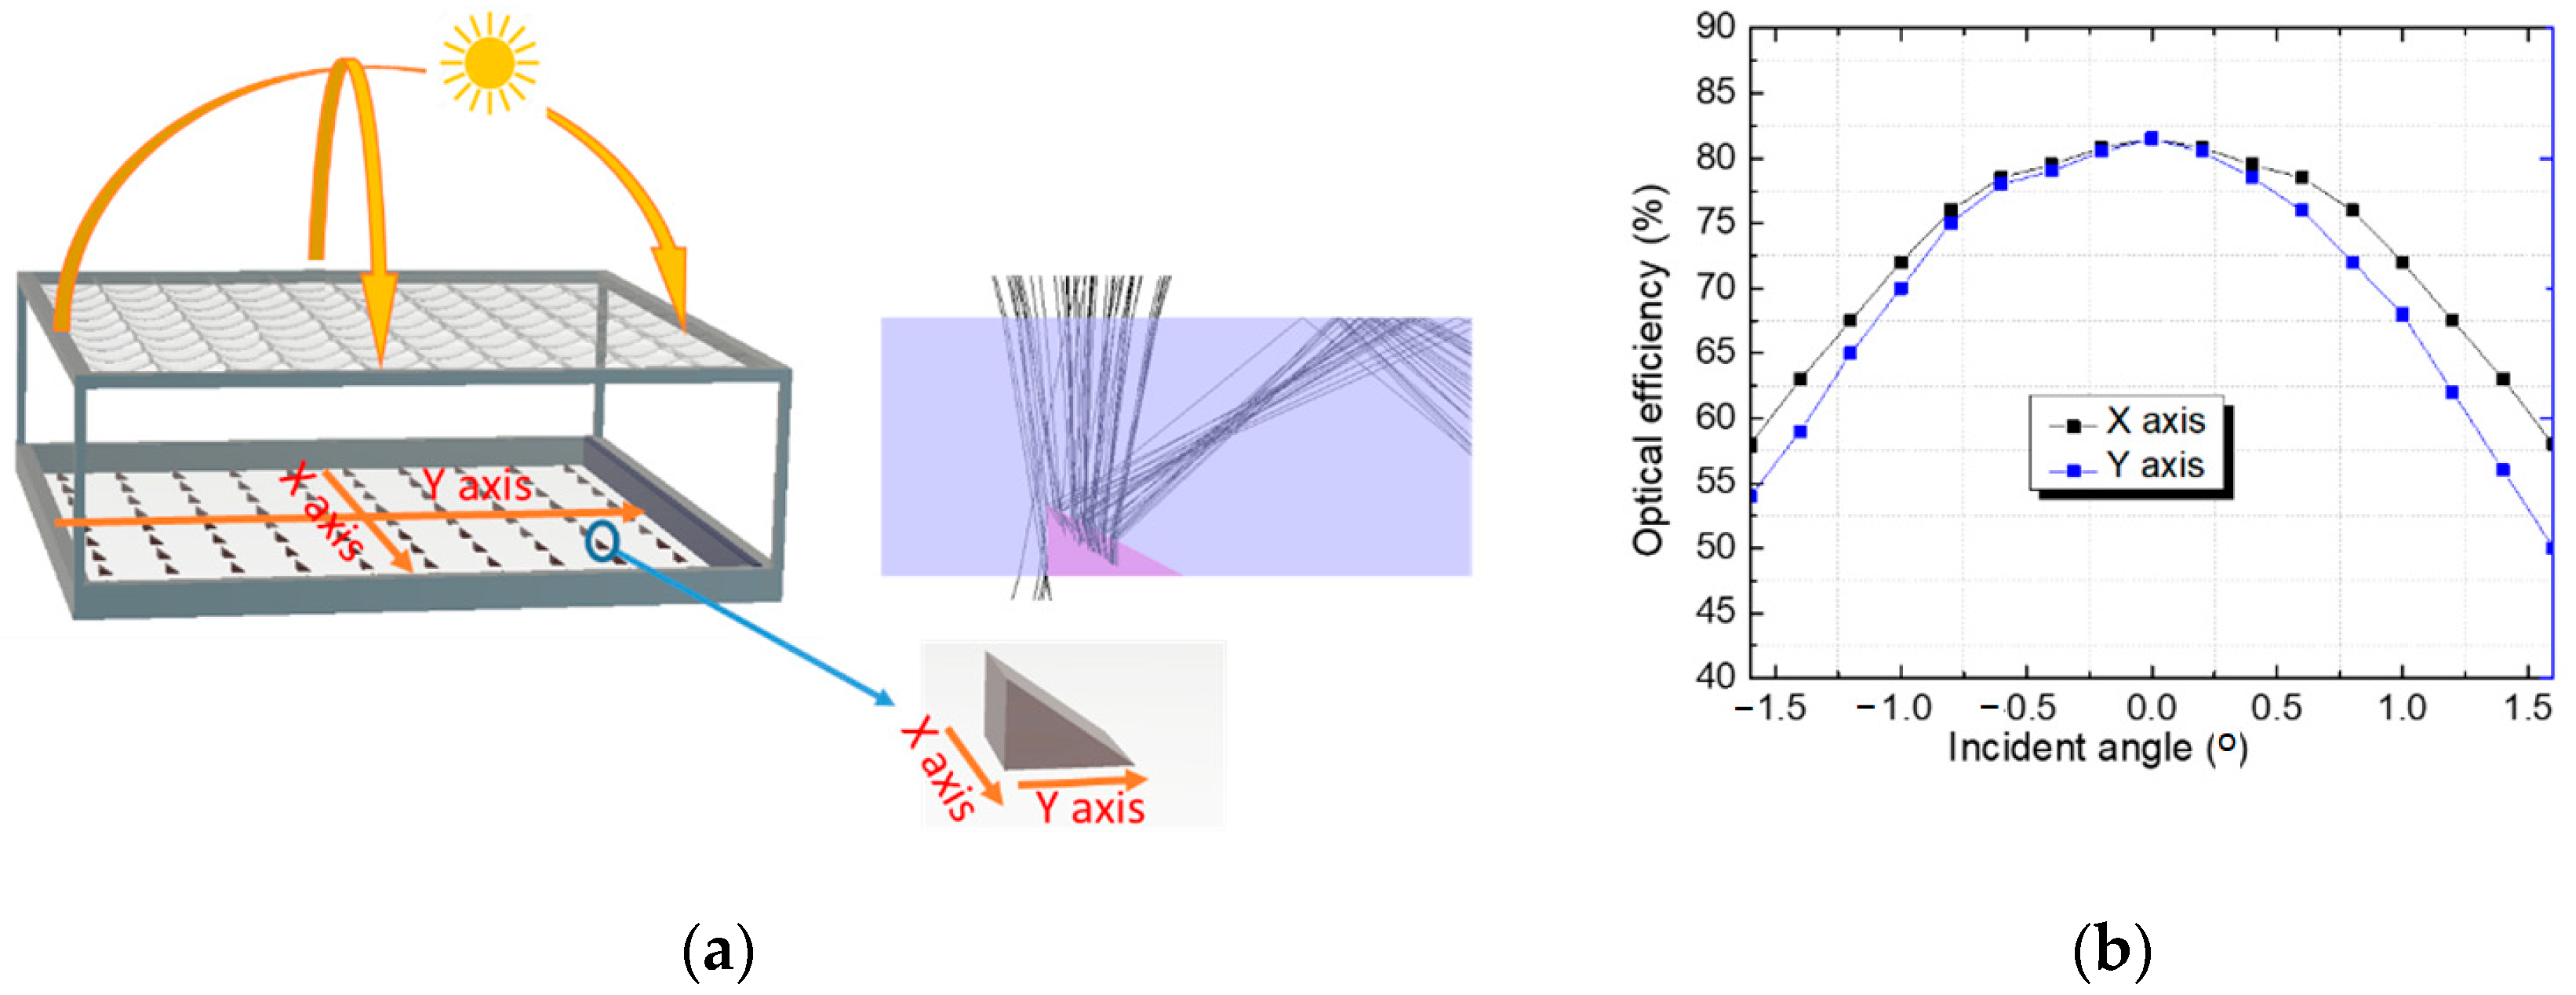
3.1. System Design
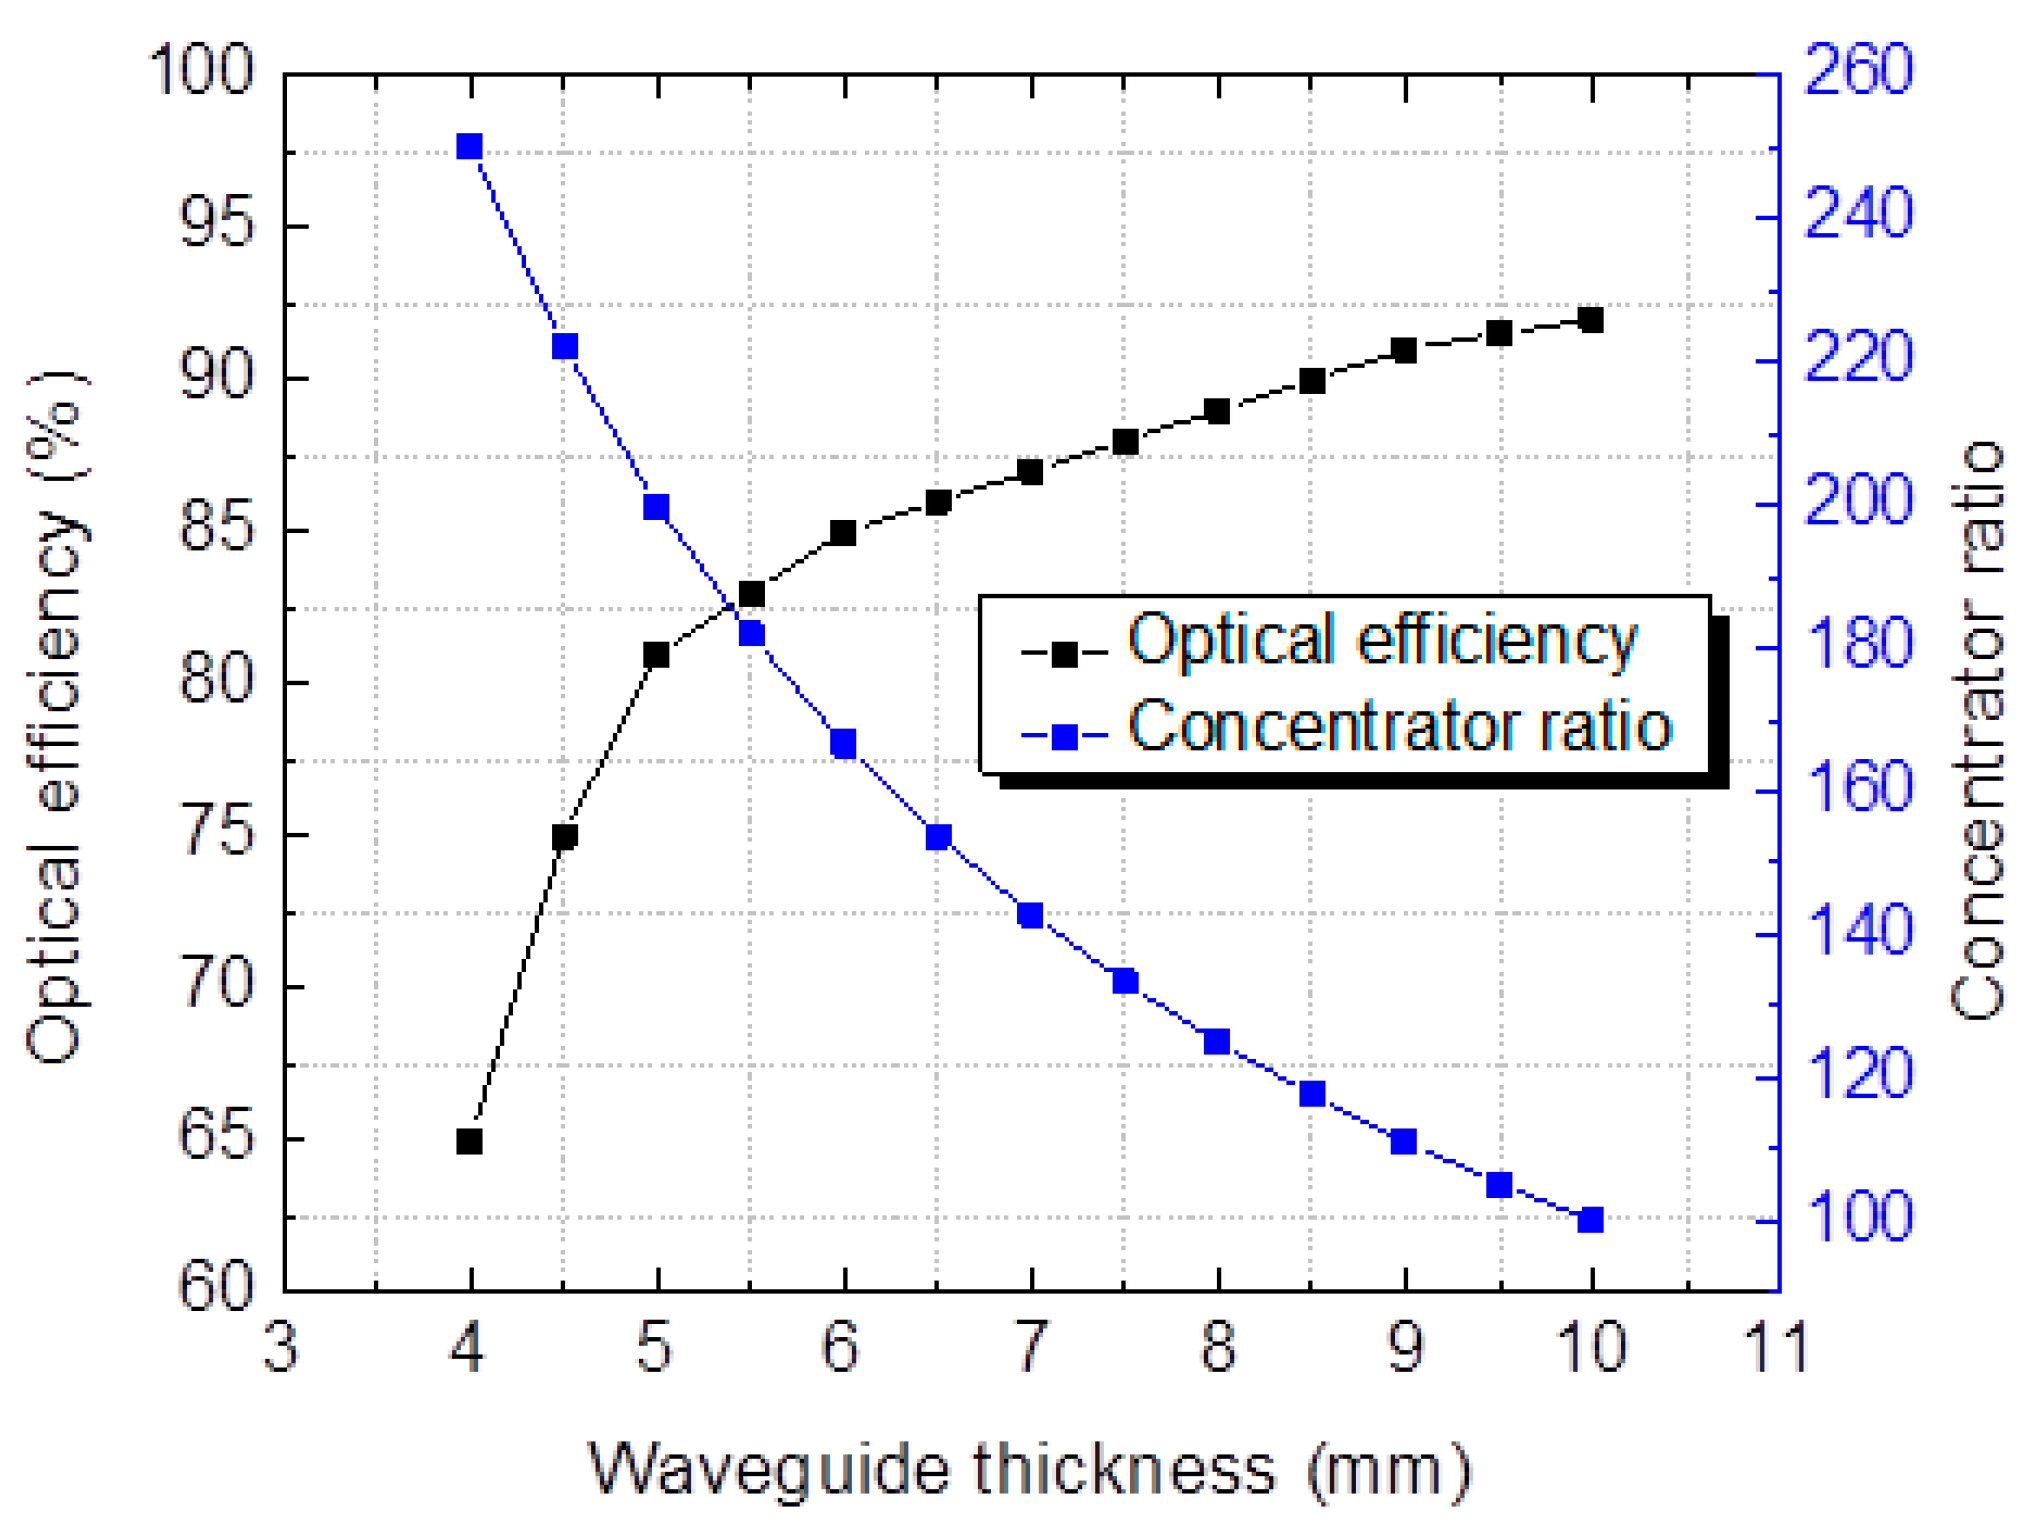
3.2. Simulation Results
4. System Performance and Discussion
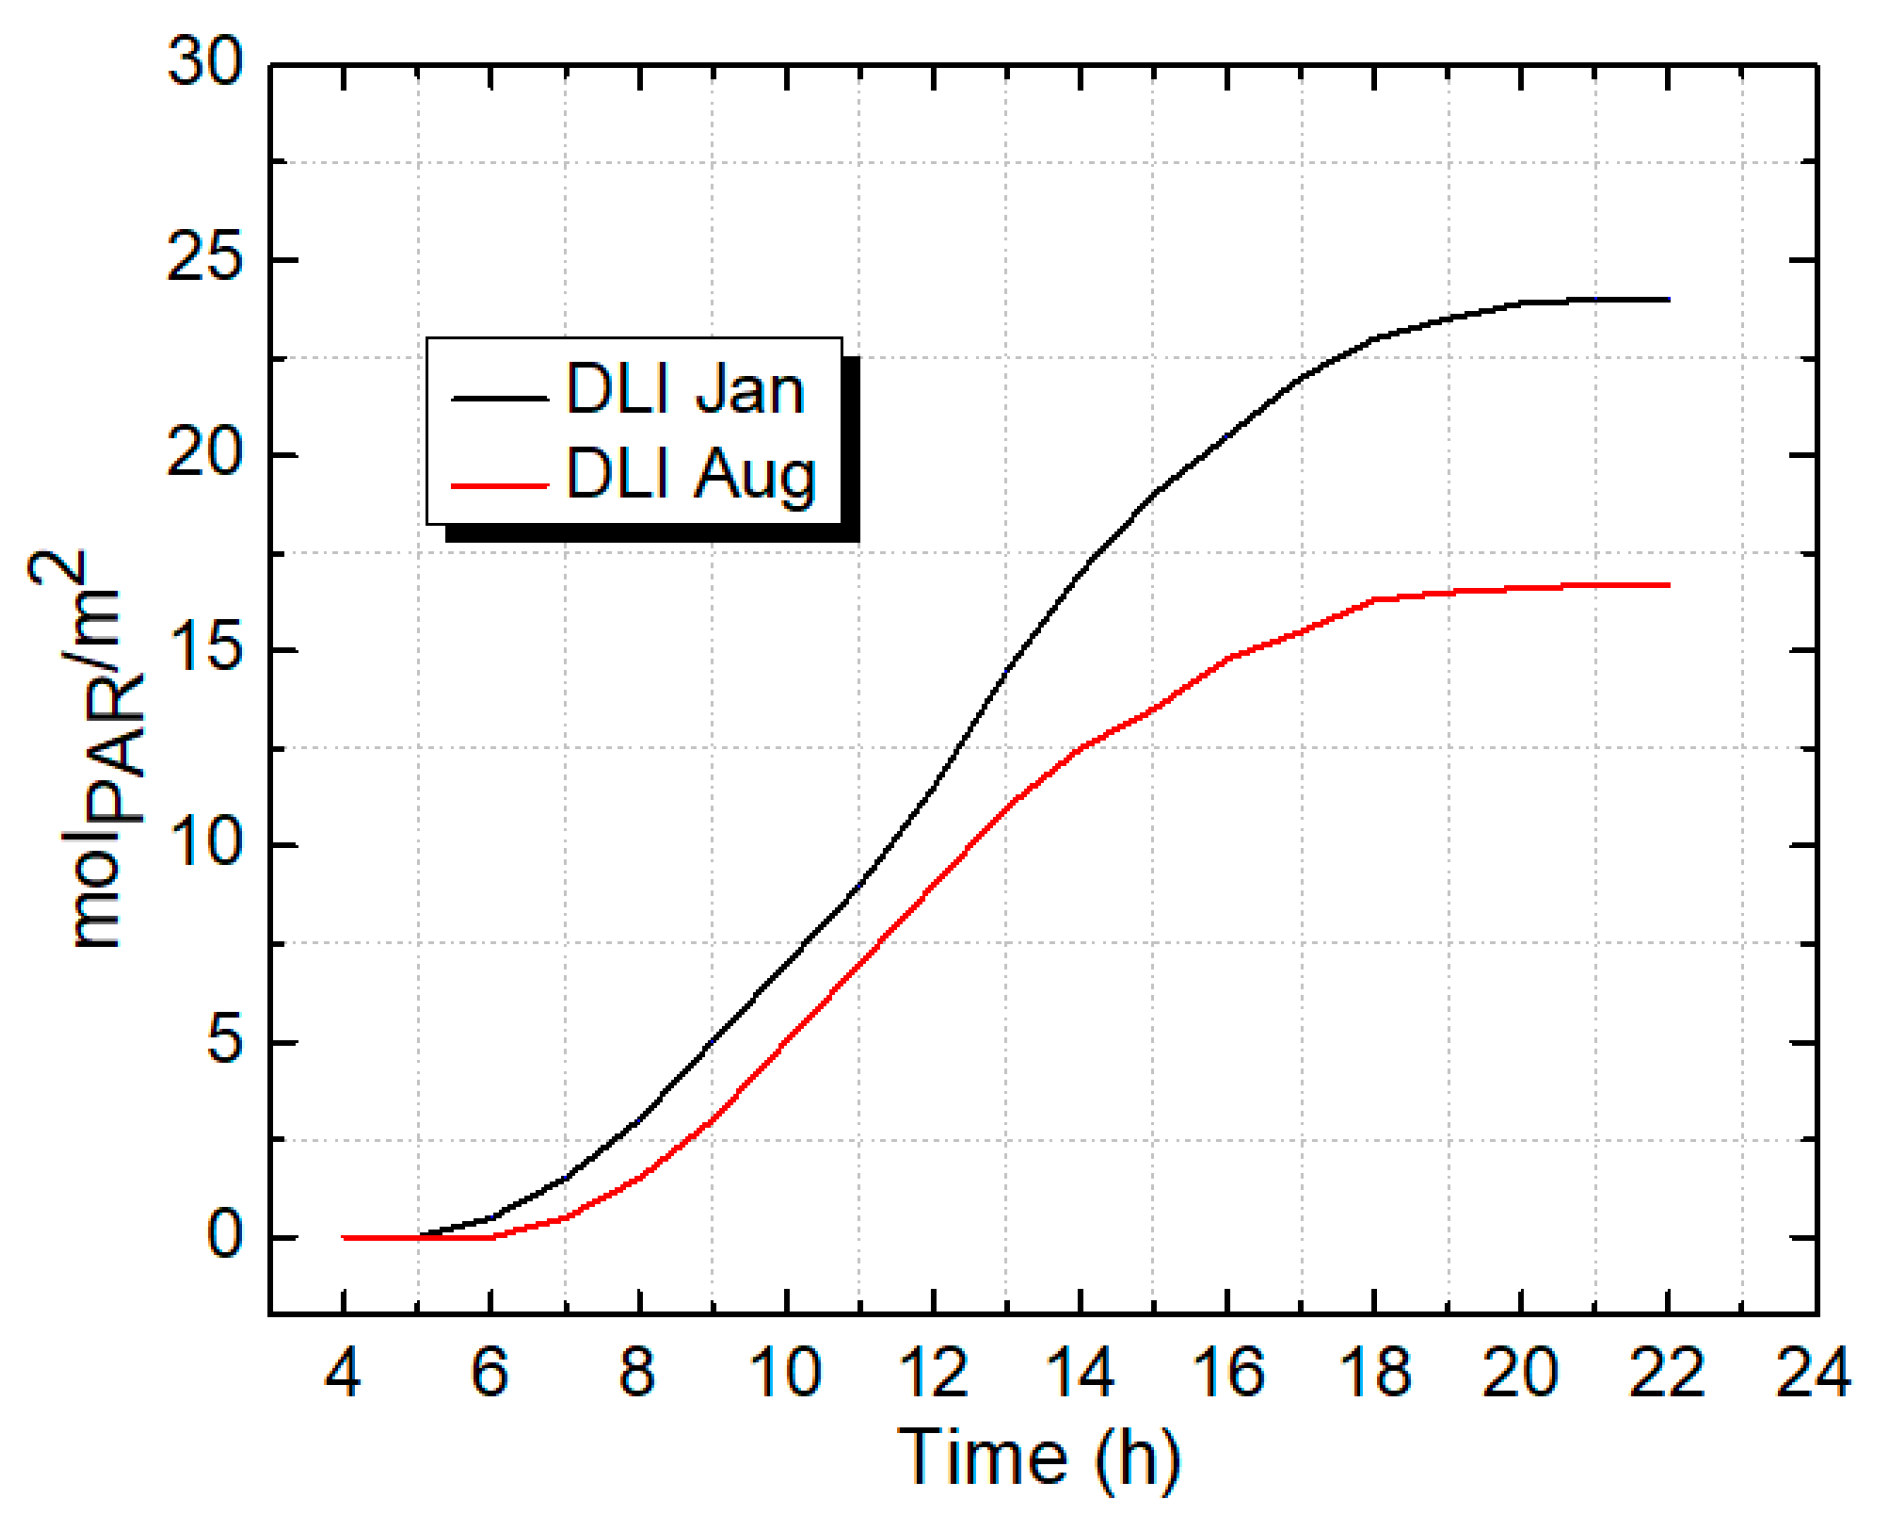
4.1. Solar Energy for Growing Plants
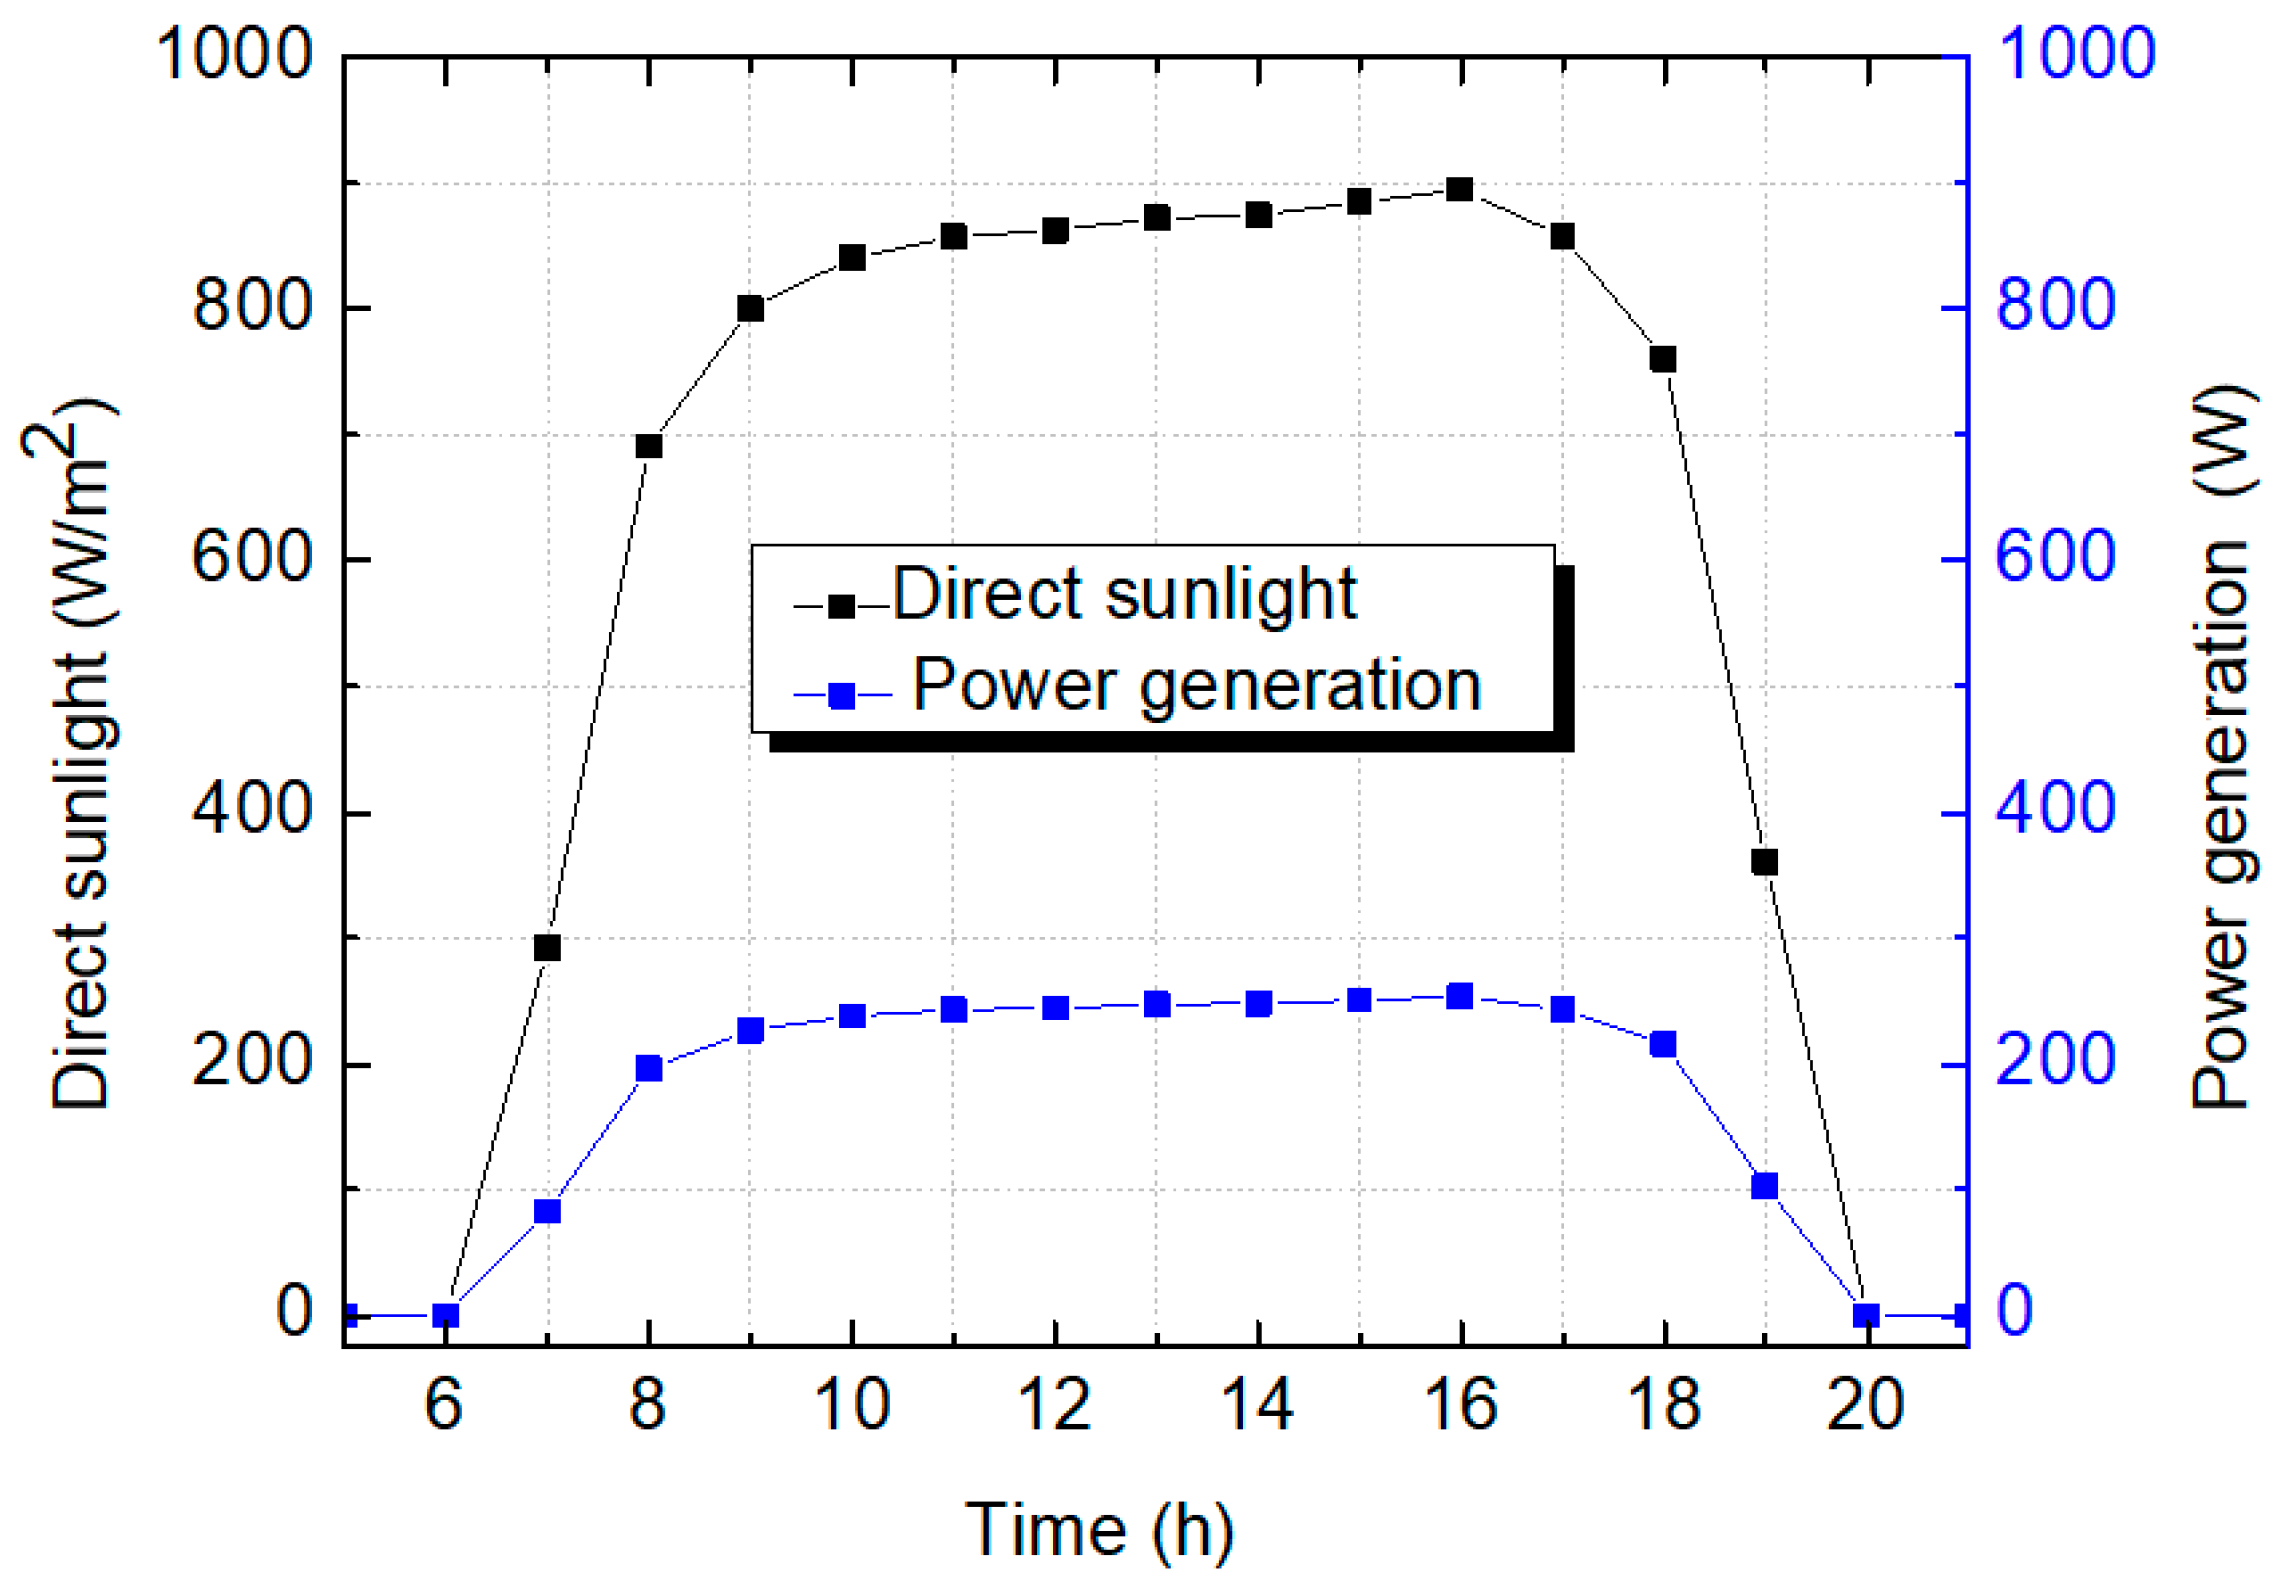
4.2. Electricity Generation
5. Conclusions
Author Contributions
Funding
Institutional Review Board Statement
Informed Consent Statement
Data Availability Statement
Conflicts of Interest
References
- Layton, B.E. A comparison of energy densities of prevalent energy sources in units of joules per cubic meter. Int. J. Green Energy 2008, 5, 438–455. [Google Scholar] [CrossRef]
- Vu, T.N.; Tran, Q.T.; Tong, Q.C.; Nguyen, M.H.; Kieu, N.M.; Vu, N.H.; Vu, H.; Seoyong, S. Development of a solar/LED lighting system for a plant tissue culture room. J. Vietnamese Environ. 2020, 12, 142–147. [Google Scholar] [CrossRef]
- Armstrong, A.; Ostle, N.J.; Whitaker, J. Solar Park microclimate and vegetation management effects on grassland carbon cycling. Environ. Res. Lett. 2016, 11, 074016. [Google Scholar] [CrossRef] [Green Version]
- Santra, P.; Pande, P.C.; Kumar, S.; Mishra, D.; Singh, R.K. Agri-voltaics or solar farming: The concept of integrating solar PV based electricity generation and crop production in a single land use system. Int. J. Renew. Energy Res. 2017, 7, 694–699. [Google Scholar]
- Sekiyama, T.; Nagashima, A. Solar sharing for both food and clean energy production: Performance of agrivoltaic systems for corn, a typical shade-intolerant crop. Environments 2019, 6, 65. [Google Scholar] [CrossRef] [Green Version]
- Sato, D.; Yamada, N. Design and testing of highly transparent concentrator photovoltaic modules for efficient dual-land-use applications. Energy Sci. Eng. 2020, 8, 779–788. [Google Scholar] [CrossRef]
- Liu, W.; Liu, L.; Guan, C.; Zhang, F.; Li, M.; Lv, H.; Yao, P.; Ingenhoff, J. A novel agricultural photovoltaic system based on solar spectrum separation. Sol. Energy 2018, 162, 84–94. [Google Scholar] [CrossRef]
- Chory, J.; Chatterjee, M.; Cook, R.K.; Elich, T.; Fankhauser, C.; Li, J.; Nagpal, P.; Neff, M.; Pepper, A.; Poole, D.; et al. From seed germination to flowering, light controls plant development via the pigment phytochrome. Proc. Natl. Acad. Sci. USA 1996, 93, 12066–12071. [Google Scholar] [CrossRef] [PubMed] [Green Version]
- Pisani, G. Correzione Delle Deformita Del Piede Post-Allungamento. Chir. Piede 1994, 18, 235–240. [Google Scholar] [CrossRef]
- Belyaev, B.A.; Tyurnev, V.V.; Shabanov, V.F. Design of optical bandpass filters based on a two-material multilayer structure. Opt. Lett. 2014, 39, 3512. [Google Scholar] [CrossRef] [PubMed]
- Orfanidis, S.J. Electromagnetic Waves and Antennas; Rutgers University: New Brunswick, NJ, USA, 2016; Volume 6, pp. 335–370. [Google Scholar]
- Vu, N.H.; Pham, T.T.; Shin, S. Large scale spectral splitting concentrator photovoltaic system based on double flat waveguides. Energies 2020, 13, 2360. [Google Scholar] [CrossRef]
- Vu, N.H.; Shin, S. A large scale daylighting system based on a stepped thickness waveguide. Energies 2016, 9, 71. [Google Scholar] [CrossRef] [Green Version]
- Pérez-Higueras, P.; Ferrer-Rodríguez, J.P.; Almonacid, F.; Fernández, E.F. Efficiency and acceptance angle of High Concentrator Photovoltaic modules: Current status and indoor measurements. Renew. Sustain. Energy Rev. 2018, 94, 143–153. [Google Scholar] [CrossRef]
- Sun Tracking System. Available online: http://www.solar-motors.com/gb/solar-trackers/dual-axis-sun-trackers-g78.shtml (accessed on 4 June 2021).
- Apostoleris, H.; Chiesa, M. High-concentration photovoltaics for dual-use with agriculture. AIP Conf. Proc. 2019, 2149, 050002. [Google Scholar] [CrossRef]
- Song, X.P.; Tan, H.T.W.; Tan, P.Y. Assessment of light adequacy for vertical farming in a tropical city. Urban For. Urban Green. 2018, 29, 49–57. [Google Scholar] [CrossRef]
- Sabnis, V.; Yuen, H.; Wiemer, M. High-efficiency multijunction solar cells employing dilute nitrides. AIP Conf. Proc. 2012, 1477, 14–19. [Google Scholar] [CrossRef] [Green Version]
- Tranparent Solar Panel. Available online: https://www.ertex-solar.at/en/products/semi-transparent-modules/ (accessed on 24 November 2021).


| Specifications | ||
|---|---|---|
| Module | Module size | 1 m × 1 m |
| Module thickness | 180 mm | |
| Concentration ratio | × | |
| Freeform lens array | Number of lenses | ) |
| Size of lens | mm × 100 mm | |
| Focal length | 170 mm | |
| Material | PMMA | |
| Planar waveguide | Thicknesses | 5 mm |
| Material | PMMA | |
| Prism’s parameters | mm/28° | |
| Prism’s material | Glass | |
| Solar cell | Type | Triple-junction (GaInP/GaInAs/Ge) |
| Cell size | cm × 100 cm (200 cells) | |
| Efficiency | 35% | |
| Climates | Parameter | Our Proposed System | Transparent CPV | Transparent PV |
|---|---|---|---|---|
| Solar cell | 3-junction cells with eff. of 35% | 3-junction cells with eff. of 35% | Si cell with efficiency of 18% | |
| 20% diffuse sunlight | Power generation | 2.84 kWh | 3.45 kWh | 1.42 kWh |
| DLI | ||||
| 30% diffuse sunlight | Power generation | 2.44 kWh | 3.01 kWh | 1.41 kWh |
| DLI | ||||
| 50% diffuse sunlight | Power generation | 1.8 kWh | 2.15 kWh | 1.4 kWh |
| DLI |
Publisher’s Note: MDPI stays neutral with regard to jurisdictional claims in published maps and institutional affiliations. |
© 2022 by the authors. Licensee MDPI, Basel, Switzerland. This article is an open access article distributed under the terms and conditions of the Creative Commons Attribution (CC BY) license (https://creativecommons.org/licenses/by/4.0/).
Share and Cite
Vu, H.; Tien, T.Q.; Park, J.; Cho, M.; Vu, N.H.; Shin, S. Waveguide Concentrator Photovoltaic with Spectral Splitting for Dual Land Use. Energies 2022, 15, 2217. https://doi.org/10.3390/en15062217
Vu H, Tien TQ, Park J, Cho M, Vu NH, Shin S. Waveguide Concentrator Photovoltaic with Spectral Splitting for Dual Land Use. Energies. 2022; 15(6):2217. https://doi.org/10.3390/en15062217
Chicago/Turabian StyleVu, Hoang, Tran Quoc Tien, Jongbin Park, Meeryoung Cho, Ngoc Hai Vu, and Seoyong Shin. 2022. "Waveguide Concentrator Photovoltaic with Spectral Splitting for Dual Land Use" Energies 15, no. 6: 2217. https://doi.org/10.3390/en15062217