Abstract
The COVID pandemic has caused a major exodus of passengers who chose urban and suburban transport. In many countries, especially in the European Union, there is a tendency to choose individual means of transport, causing damage to the environment and contributing significantly to greenhouse gas emissions. One method to promote urban transport is replacing bus fleets with newer ones, thus making public transport more attractive and reducing the emission of harmful exhaust fume components into the atmosphere. The aim of this study was to show a methodology for calculating CO2e for bus fleets. When determining CO2e, the principal greenhouse gases, such as CO2, CH4, and N2O, are usually considered. However, CO emissions also have indirect effects on climate through enhanced levels of tropospheric O3 and increased lifetime of CH4; therefore, CO2, CH4, N2O, and CO emissions were determined for CO2e emission calculations. Two bus fleet variant scenarios were analysed; the first non-investment variant assumed passenger transport using the old fleet without any P&R parking zones. The second scenario was based on the current state, which includes the purchase of new low-emission buses and the construction of P&R infrastructure. The calculations were performed using the COPERT emission model with real data from 52 buses running on 13 lines. For the analysed case study of the Rzeszow agglomeration and neighbouring communes, implementing the urban and suburban transport modernisation project resulted in a reduction in estimated CO2e emissions of about 450 t. The methodology presented, which also considers the impact of CO emissions on the greenhouse effect, is a new element of the study that has not been presented in previous works and may serve as a model for other areas in the field of greenhouse gas emission analyses. The future research scope includes investigation of other fuels and powertrain supplies, such as hydrogen and hybrid vehicles.
1. Introduction
The European Green Deal (EGD) is intended to cut greenhouse gases emission by at least 55% by 2030 compared to emissions in 1990 [1]. Its main goal is to achieve carbon neutrality by 2050, which can only be achieved if the economy and the development sector evolve correctly, where transportation is a key element [2]. Although recent economic developments in Europe have started to orient mobility towards transit, especially with an increased share of bus travel, most city dwellers still prefer to use passenger cars. This situation has also been amplified by the COVID-19 pandemic period, with people unwilling to travel with others due to the risk of infection; in addition, COVID-19 restrictions in some countries strictly limited the number of people who could travel by buses [3]. Car-based lifestyles are still dominant and are connected with the growing urbanisation of cities (i.e., a lack of suburban buses). This issue influences air quality, as well as noise, climate change, and environmental concerns in general [4,5].
One of the countermeasures against this phenomenon is the promotion of clean urban and suburban bus transportation and the use of clean emission bus systems. Buses are one of the most widespread public transport modes, carrying approximately half of all public transport passengers, representing a total of 30 billion passengers per year in the EU [6]. In small and medium cities where there are no other means of public transport, bus systems can reach a 100% share of urban transport mobility [7]. Most modern buses are carefully designed to meet sustainability constraints in terms of emissions, space occupancy, energy efficiency, and not requiring heavy infrastructure [8]. The EU plays an important role in promoting and funding the development of sustainable urban mobility, with numerous projects funded since the 1990s [9,10]. Significant emphasis is placed on promoting new implementations and solutions to meet more sustainable requirements in local transport systems.
One of the EU projects is based in Rzeszow, Poland, titled “Development of low-carbon economy and improvement of inhabitants’ mobility through the improvement of sustainable public transport in ROF area”, focused on replacing the old bus fleet with new buses that meet standards for low emissions. The project is related to the area of the Rzeszow Functional Area and the nine municipalities involved. This project involved the purchase of 54 new low-emission passenger bus units, reconstruction of 233.3 km of public transport lines (by building new road links and bridges and reconstructing road infrastructure), construction of bus stops, bus bays, pavements, and bus shelters with accompanying infrastructure, construction of 11 Park & Ride car parks with 481 parking spaces, including 31 for the disabled, reconstruction of the bus and train stations and the transfer centre to provide an interchange function, construction of bicycle paths with a total length of 12.45 km and 13 “Bike & Ride” car parks, as well as the construction of technical facilities (workshop buildings, bus washing facilities, and accompanying infrastructure).
The purpose of this study is to show the methodology for calculating the carbon dioxide equivalent (CO2e) reduction that occurs as a result of the project. The term CO2e means the number of metric tons of CO2 emissions with the same global warming potential as one metric ton of another greenhouse gas. CO2e is a standard unit for measuring carbon footprints, designed to express the impact of different greenhouse gases in terms of the equivalent amount of CO2 that would create the same amount of warming at a specific point of time in the future. To calculate the change in greenhouse gas emissions, the work methodology assumed the average speed of buses, average mileages, and ambient conditions, as well as data for P&R passenger car users in the case of one of the analysed scenario variants. For the CO2e calculation, the methodology included calculations of CO, N2O, CO2, and CH4—including CO in greenhouse gas calculations is rare in the existing literature. Thus, this element represents a novel aspect of the proposed methodology. Moreover, most existing work concerning CO2e calculations is related to passenger cars, not buses. This work is one of the first studies that presents a methodology for CO2e emission calculation for bus fleets that encompasses CO, N2O, CO2, and CH4 emissions. For example, study [11] investigates modelling of the calculation of CO2e emissions for passenger cars with different powertrains and energy sources, considering a total of 790 different vehicle variants. Study [12] also shows the results for CO2e emissions for passenger cars, with a particular focus on direct real-world CO2e emissions of both diesel and petrol cars newly registered in Europe between 1995 and 2015. One of the main findings of the work was that diesel cars had much higher CO2e emissions than petrol cars until 2001. An example of a study related to CO2e for buses is [13], where the authors researched the impact of introducing LNG buses with EURO VI compared to the old EURO II fleet. The work compares two different methodological approaches; the first is according to the European Standard EN 16258:2012, while the second is according to the Handbook of Emission Factors for Road Transport. Another example of the calculation for buses is work [14], where the authors analyse CO2e for buses fuelled with diesel, LNG, LPG, hydrogen energy, and electricity. However, the key limitation of this work is that the authors only analyse one bus line; in addition, they use a carbon emission model that only takes into account the activity data and the carbon emission factor. Their study found that the use of hydrogen fuel cell buses would make it possible to reduce 1,244,081 t CO2e emissions in Tainan City.
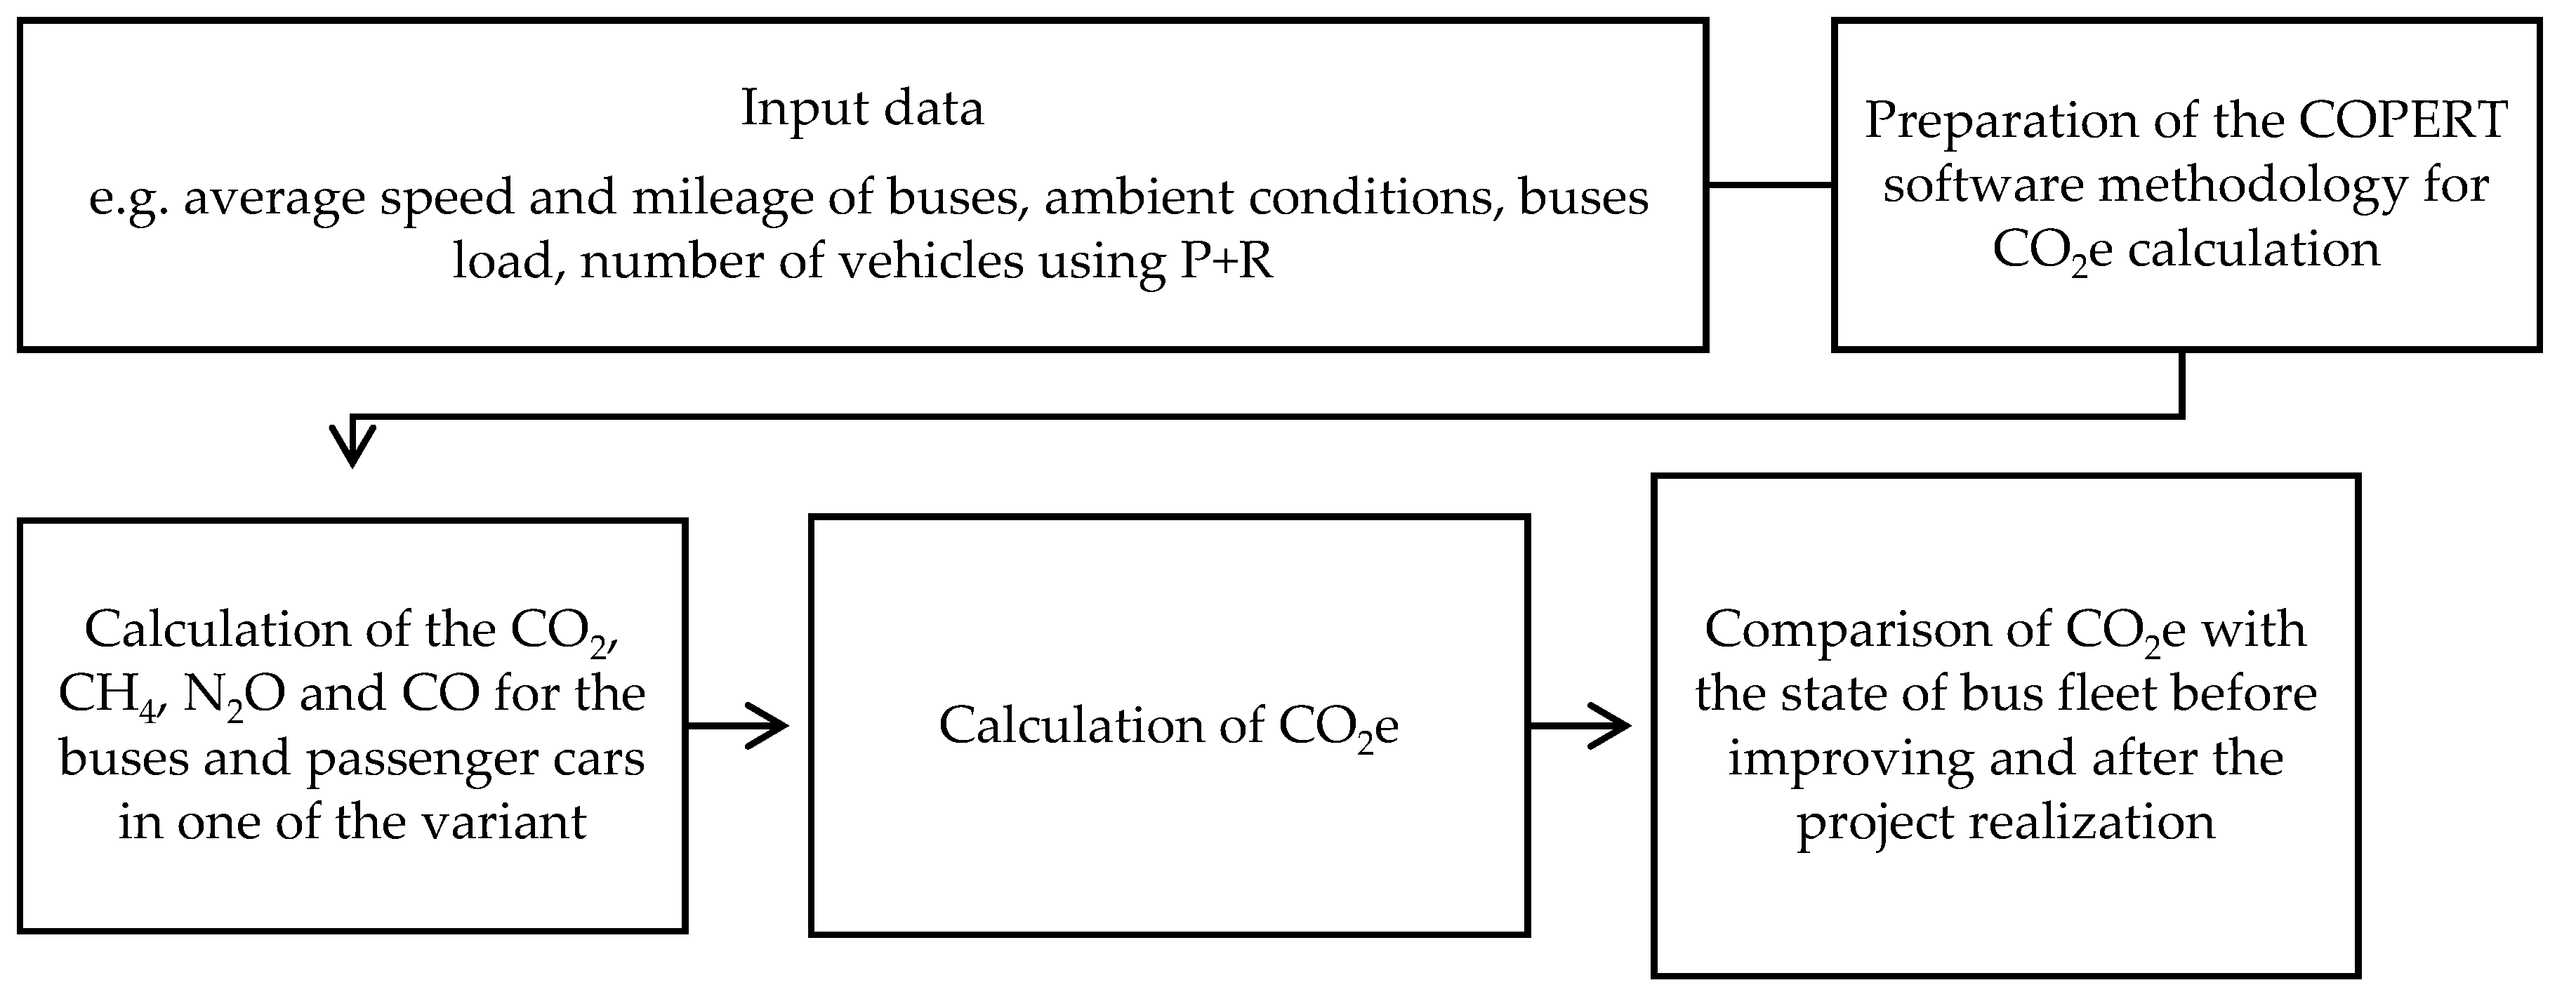
For this work, all the calculations for bus movements are based on real-world data, with the emission calculations performed in the COPERT software package. The work presents an original methodology to assess the impact of replacing the old fleet of buses with a new one, which can also be applied to case studies of other European cities. The simplified work schema is presented in Figure 1.
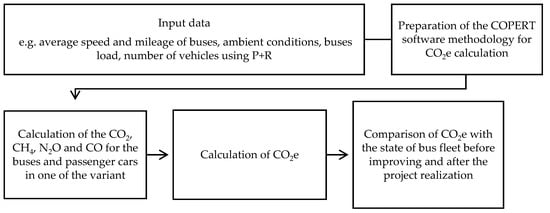
Figure 1.
General scheme showing the procedure for the proposal of CO2e calculation methodology for buses.
2. Research Methodology
Several emission models can be used to calculate emissions. Traffic and exhaust emission models are classified according to the scale of accuracy into macroscopic (regional), mesoscopic (local), and microscopic (intersections, street sections) models.
Existing emission models fall into two categories:
- -
- models that use traffic parameters, such as acceleration, braking, continuous driving, and idling (micro and meso scales),
- -
- models that are based on the average speed parameter (macro).
Macroscopic models are mainly based on the average speed parameter of the analysed road section(s) [15]. These models are used to estimate the fuel consumption and environmental impacts of road transport. They allow the impact of the total energy consumption by projects and road infrastructure development strategies to be determined, as well as assessment of the impacts of greenhouse gas emissions on the study area. Some environmental impacts are local, regional, or global and can be both short and long-term. Macroscale emission models allow the impact of transport to be determined on a large scale (e.g., regional or in a transport corridor). A limiting factor in emissions modelling is the parameters sought from the model; for example, to calculate CO2e, emissions data for CO2, CH4, N2O, and CO are required. For emission calculation purposes, for project assessment, the most common method is to use the COPERT software [16,17]. COPERT is a model for the calculation of macroscale emissions that is based on European data using mileage, vehicle structure, driving speed, and air humidity and temperature. Emission factors are calculated for the following vehicle categories [18]: passenger cars, vans (<3.5 t), trucks (>3.5 t), mopeds, and motorbikes.
Emissions in the COPERT model are calculated according to Equation (1):
where:
Ei—emissions of exhaust component i (g),
FCj,m—fuel consumption of a given vehicle category j, using fuel m (kg),
EFi,j,m—emission factor of component i for vehicle category j and fuel m (g/kg fuel).
Petrol, diesel, LPG, and CNG can be considered as fuels in this model. The current approach used in macroscale emission models to determine the amounts of harmful exhaust gas components is based on two calculations. The first consists of the selection of a set of emission factors, which determines the emissions for given traffic conditions, while the second stage involves the assessment of vehicle activity in the analysed area. The emissions are calculated by multiplying these two steps.
Given the above, the COPERT emission calculator was chosen to assess the impact of replacing the old fleet of buses with a new one. The analysed region was the Rzeszow municipality. The project also includes the construction of P&R spaces located in suburban areas.
The work assumed two analysed variants:
- -
- V0, as a counterfactual scenario, including emissions from the old fleet of buses (no P&R service, additional travel of passenger cars included),
- -
- V1, as a current situation scenario, including emissions from the new low-emission fleet of buses (no additional passenger cars included due to the existing P&R service).
For the V0 variant, a no-investment scenario, the pre-replacement bus emissions were calculated, as well as the emissions estimated for the passenger cars that would be driven in the absence of the project and its associated P&R parking. The analysis covered the period from 3 January 2021 to 2 January 2022. The data adopted for the calculations are actual data obtained from the Rzeszow Communes Association. The emission calculations were conducted based on the EMEP/EEA methodology [19,20] contained in the COPERT 5 program. A general scheme of the work is presented in Figure 2.
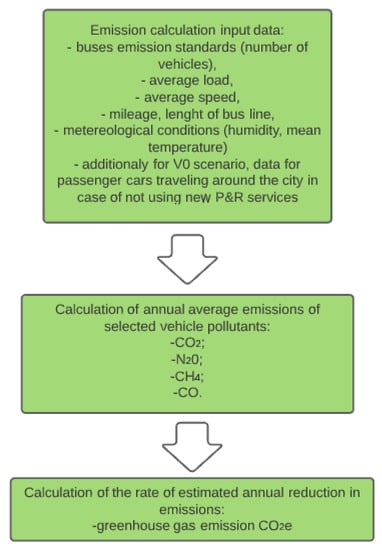
Figure 2.
Diagram showing author’s logic for CO2e emission calculation methodology for buses.
2.1. Description of the Researched Area
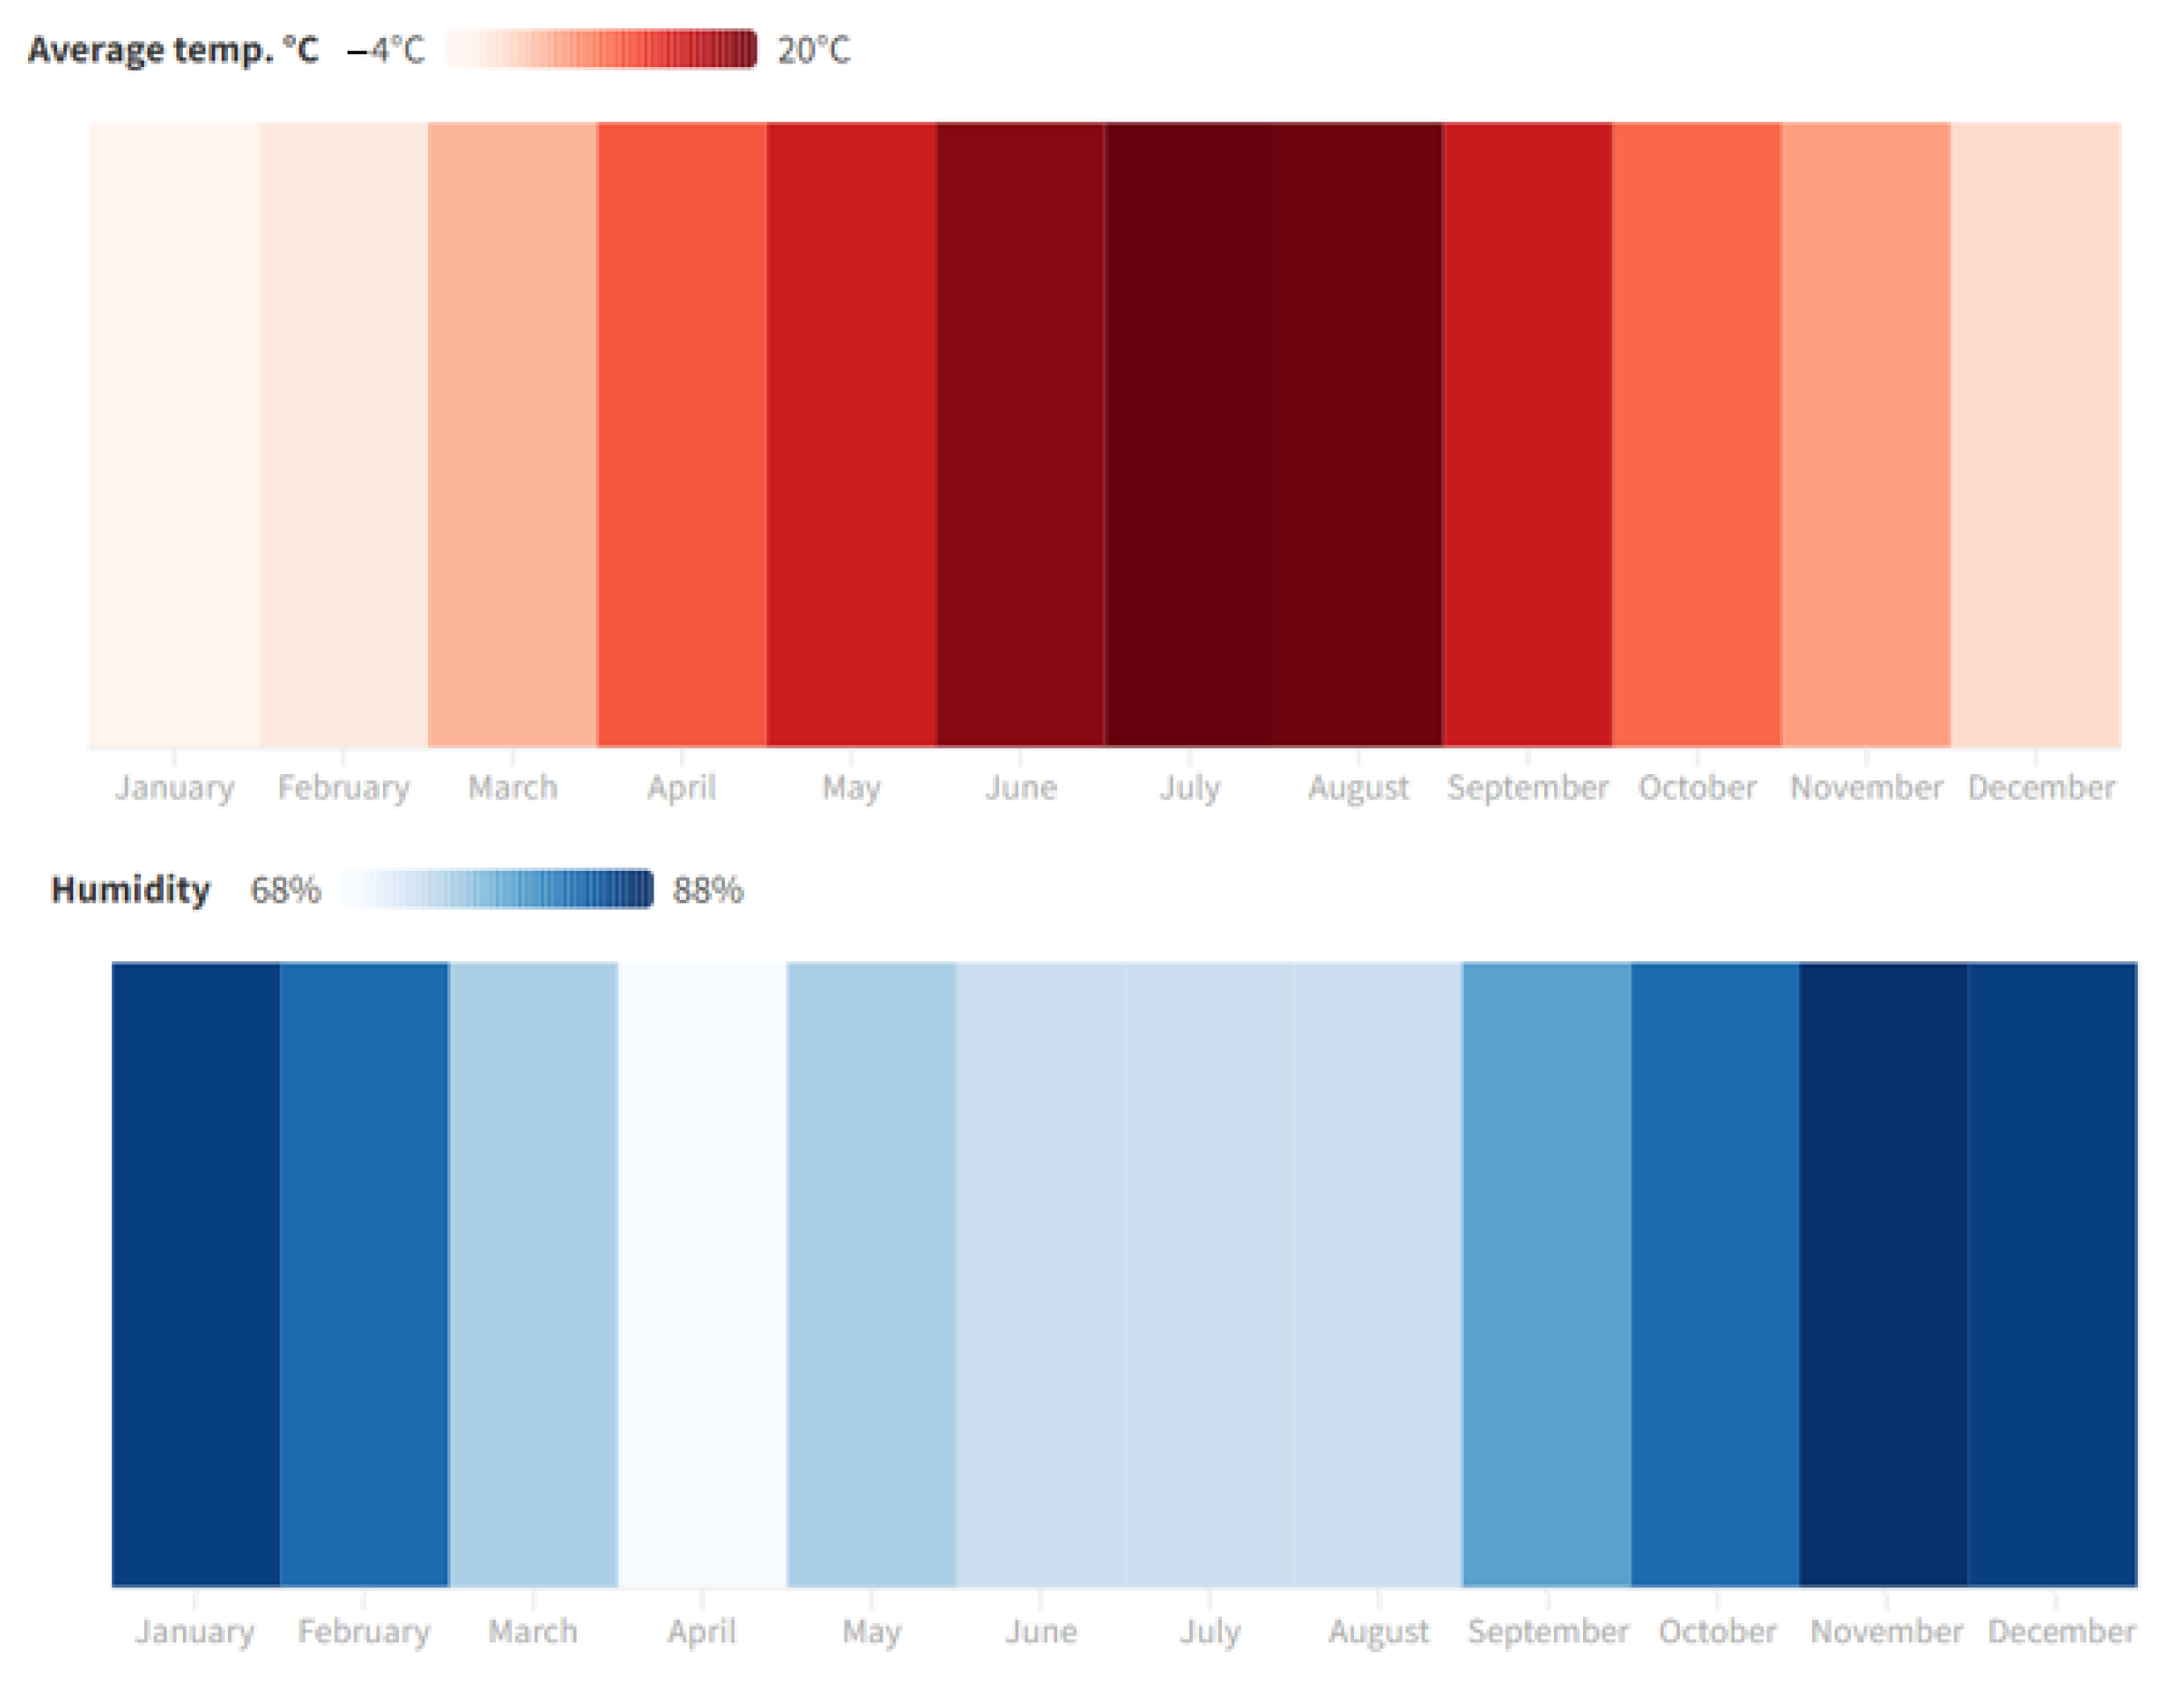
The region analysed was the municipality of Rzeszow, Poland. Rzeszow is the capital of the Subcarpathian province and the central city of the Rzeszow agglomeration, with a population of approximately 200,000 citizens [21]. The city contains six higher education universities, with an international airport situated near to the city in Jasionka. For the purposes of the COPERT emission calculations, data related to the weather conditions in the analysed area are required (i.e., annual temperature and humidity). Data related to the Rzeszow agglomeration’s weather conditions are presented in Figure 3.
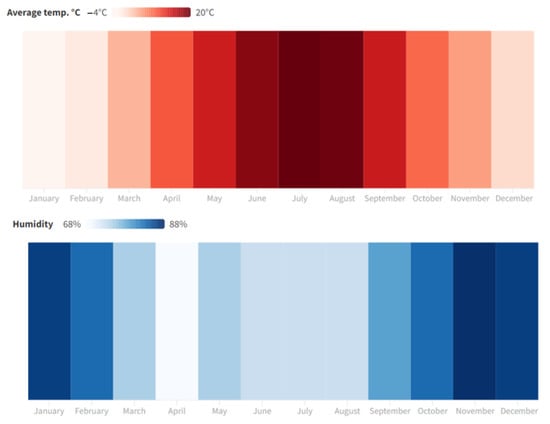
Figure 3.
Annual average temperature and humidity in the region analysed.
The area’s urban transport includes 63 bus lines. In 2015, a system was introduced to integrate public transport from the city of Rzeszów and its surroundings. The entire system consists of a traffic light control to prioritise public transport vehicles, including an online vehicle location system, information system, introduction of electronic ticketing, and stationary ticket machines. To complete the above improvements, Rzeszow obtained additional financial resources from EU funds. Many buses have also been purchased, including modern diesel and CNG vehicles, as well as hybrid and electric models. The city also benefits from train transport, connecting the suburban areas of Rzeszow with the city centre, with rural and international train connections. In recent years, P&R spaces have also been created in suburban areas. Figure 4 shows the research area of Rzeszow city and its municipality, including the approximate location of the P&R sites.
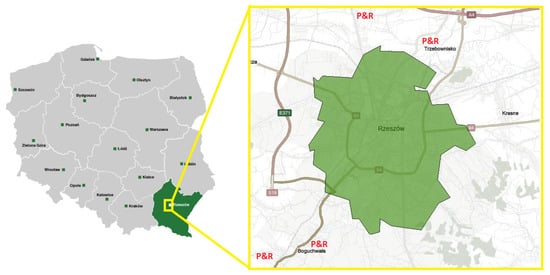
Figure 4.
Overview map of the research area showing the locations of P&R spaces.
2.2. Description of the Analysed Fleet of Vehicles
The fleet of buses in this study comprised 52 vehicles across 13 lines. As a result of the project’s realisation, the old bus fleet has been completely replaced with newly purchased modern vehicles. The old fleet of buses comprised 29 buses with no emission class, and the remaining 23 buses were in compliance with EURO II. The buses were replaced with new EURO VI buses, which were mostly manufactured after 2019. The general table summarising the bus fleet’s vehicle list is presented in Table 1. More detailed information regarding the bus fleet as an input to COPERT is presented in Appendix A (Table A1).

Table 1.
The list of the bus fleet before replacement (left side) with the new replaced buses (right side), including basic parameters, such as the number and EURO standard, input to COPERT.
The input data for the COPERT emission calculator also include the average mileage per vehicle, which were delivered from the transport operator. These data were separately adjusted for each bus line. The other necessary parameters were the average speed and load of each of the researched bus lines. The average speed and load values of the buses were calculated from real-world data delivered from the transport operator. The above parameters assumed for later emission calculations are presented in Table 2. Based on these parameters, the CO2, CH4, N2O, and CO emissions were calculated to later estimate the CO2e emissions; these values were calculated separately for each line, and the average was then calculated for each analysed variant.
Table 2.
Input real-world data of bus fleet for the emission calculation for the researched bus lines.
The emission analyses also include passenger car emissions. Since the project includes the replacement of the old fleet of buses with newly manufactured buses, as well as the construction of new P&R spaces, the analyses also assumed some passenger cars travelling on roads in the variant where there are no P&R spaces. There are four P&R locations, which were used by more than 70,000 vehicles during the analysed one-year period. Data on the number of vehicles using P&R parking zones were obtained from the road managers for the locations where these parking lots are located. In the V0 scenario, where there were no P&R spaces, this study assumed that the passenger cars travelled approximately the same mileage as the buses starting from the point of the existing P&R spaces. The average distances of each driver were multiplied by the overall number of vehicles using the P&R. The numbers of vehicles in the P&R spaces are presented in Table 3.
Table 3.
The data for passenger cars of the P&R sites.
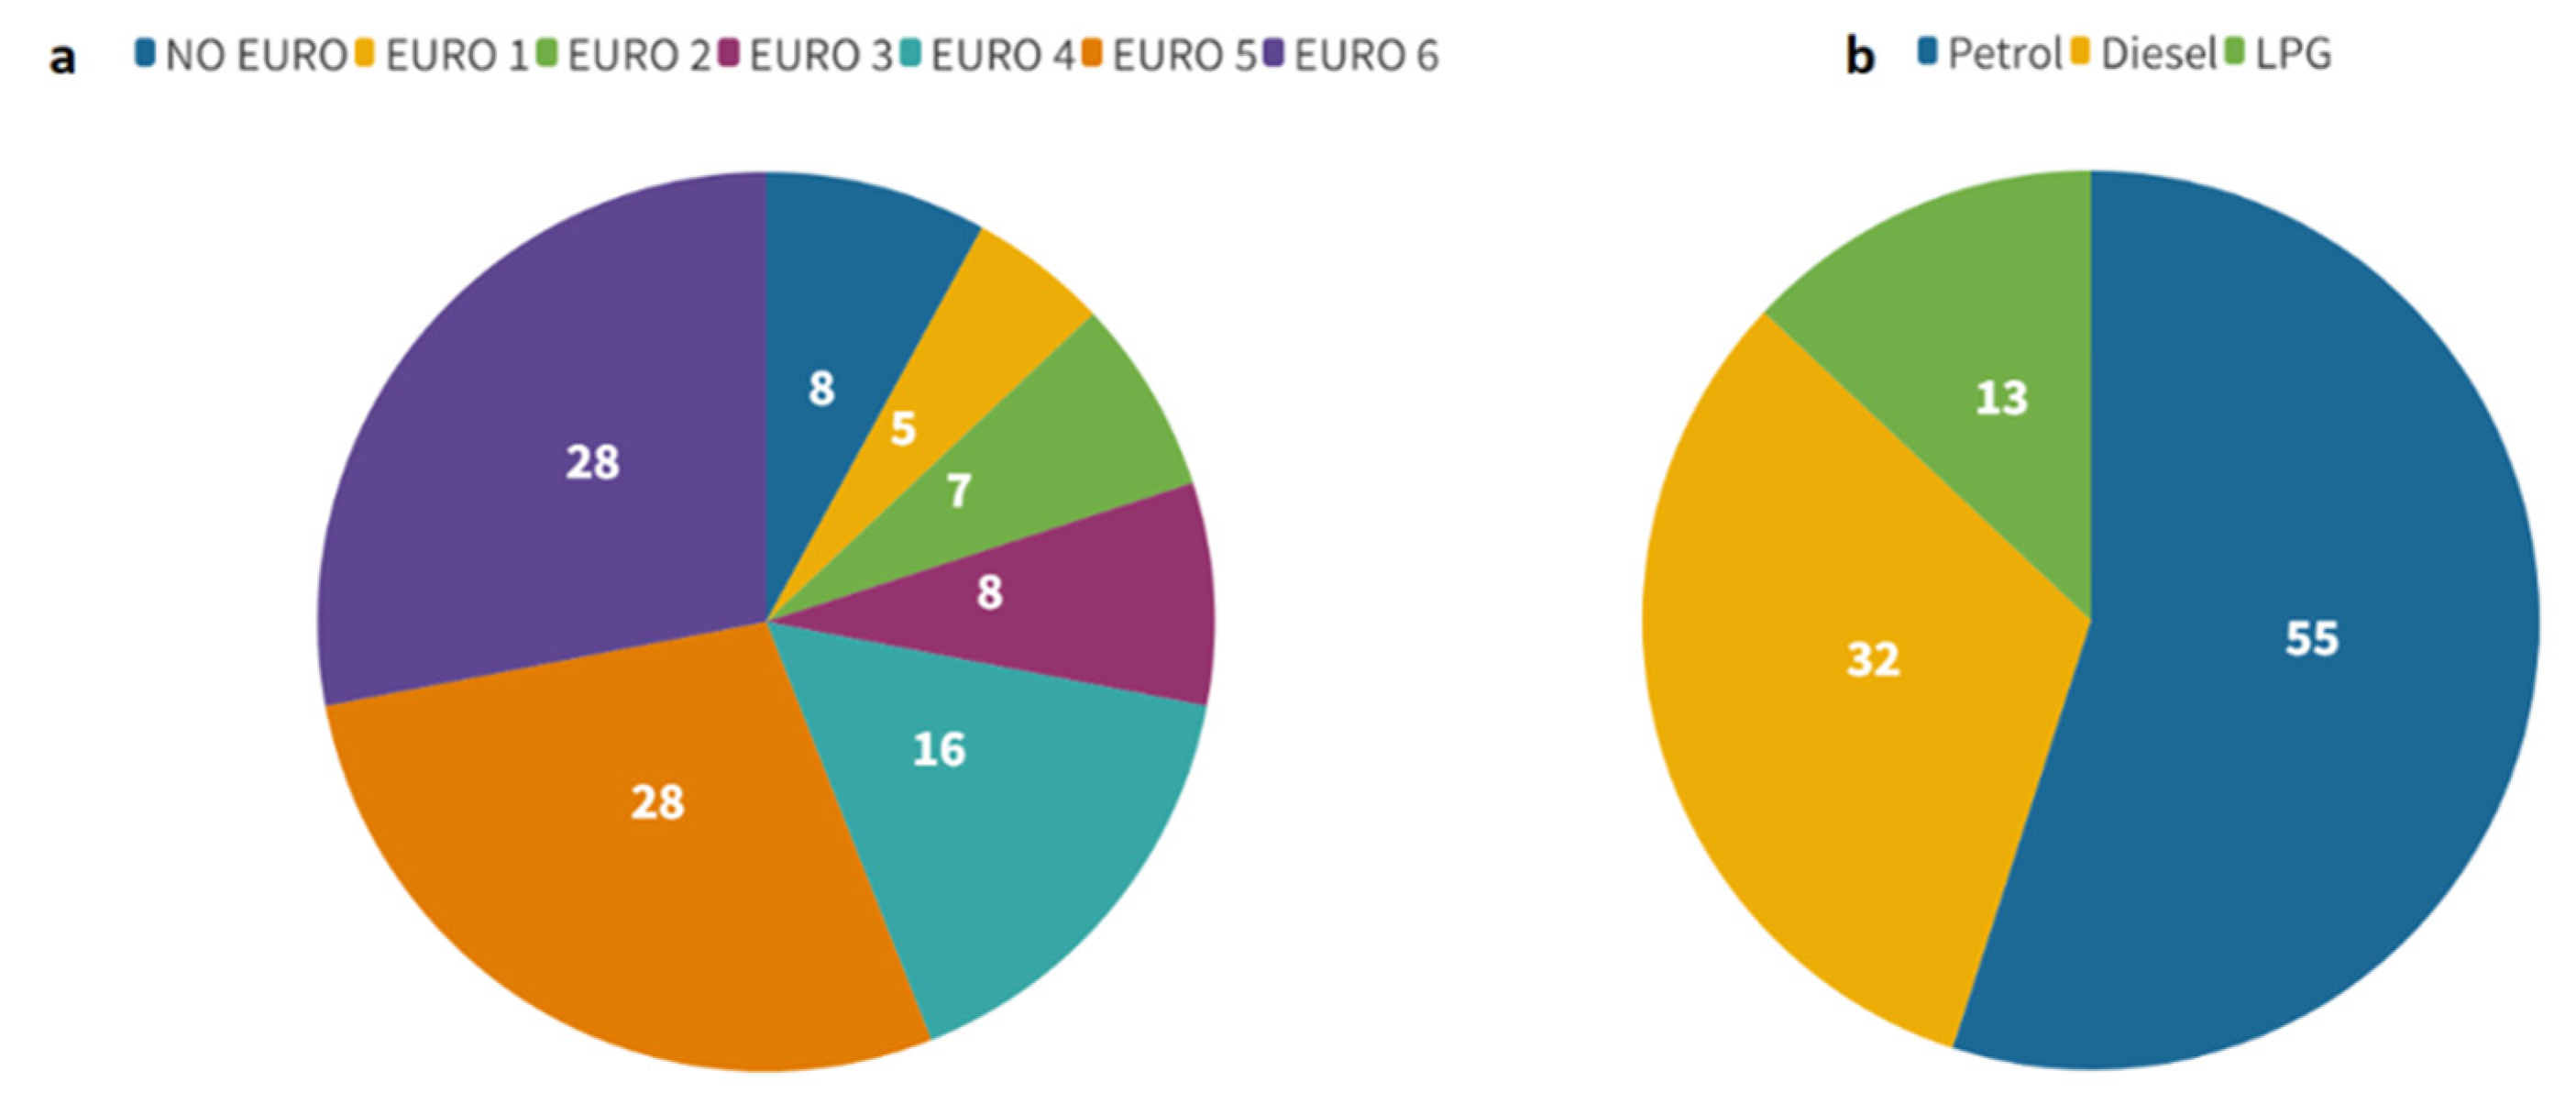
The assumed emission standards and fuel parameters of the vehicles analysed in the COPERT calculator are presented in Figure 5.

Figure 5.
Data for passenger cars (%) according to the (a) EURO standard and (b) fuel used.
The passenger car emissions for variant V0 were calculated considering the data on the number of cars in the individual P&R parking lots and the estimated average travel distances for buses used by the drivers of the cars left at P&R parking lots (Table 3). It was assumed that the distance travelled by drivers leaving cars at the parking lots is equal to half the distance travelled by the buses on each line from the stops located near the parking lots to their final stops. Data on the number of cars with respect to fuel type and emission class [21] adopted for the calculations are presented in Table 4.
Table 4.
Number of passenger cars fuelled with specific fuel types and emission standards used as inputs to COPERT.
Data on the number of vehicles parked on the parking lots were obtained from the municipality management, while statistical data on vehicle emission classes and fuel used were obtained from the local data bank for the municipality of Rzeszow [21].
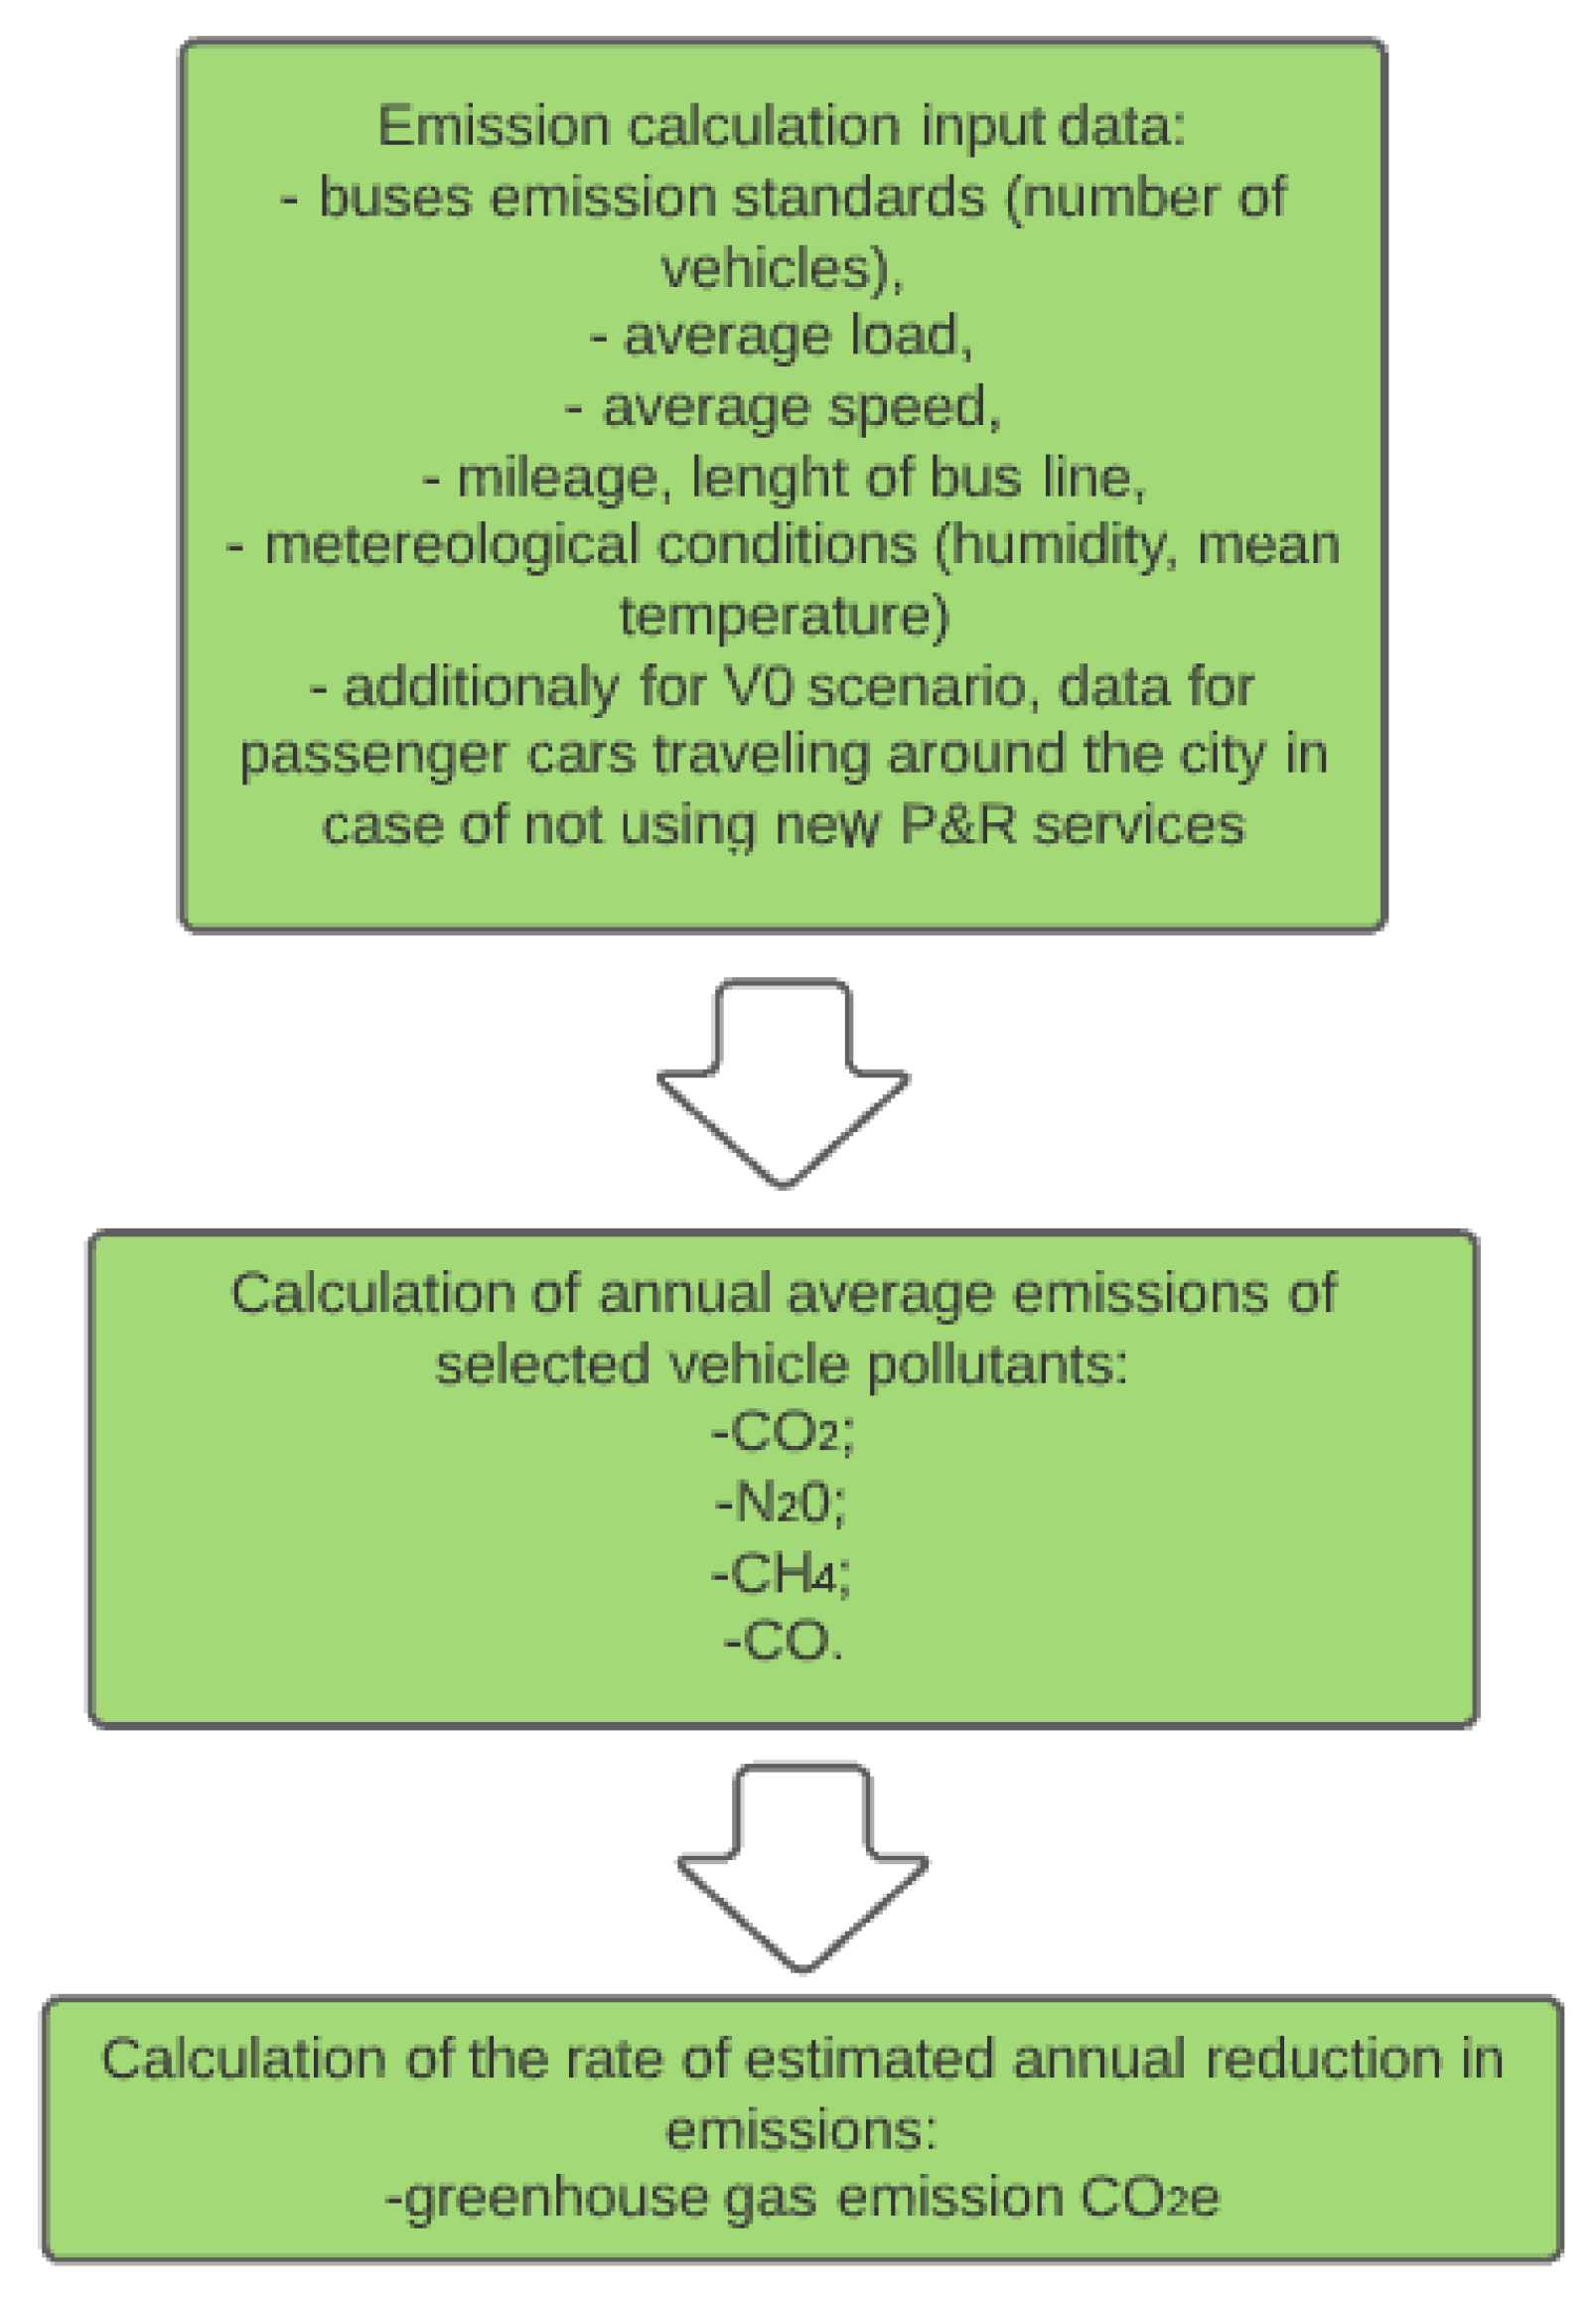
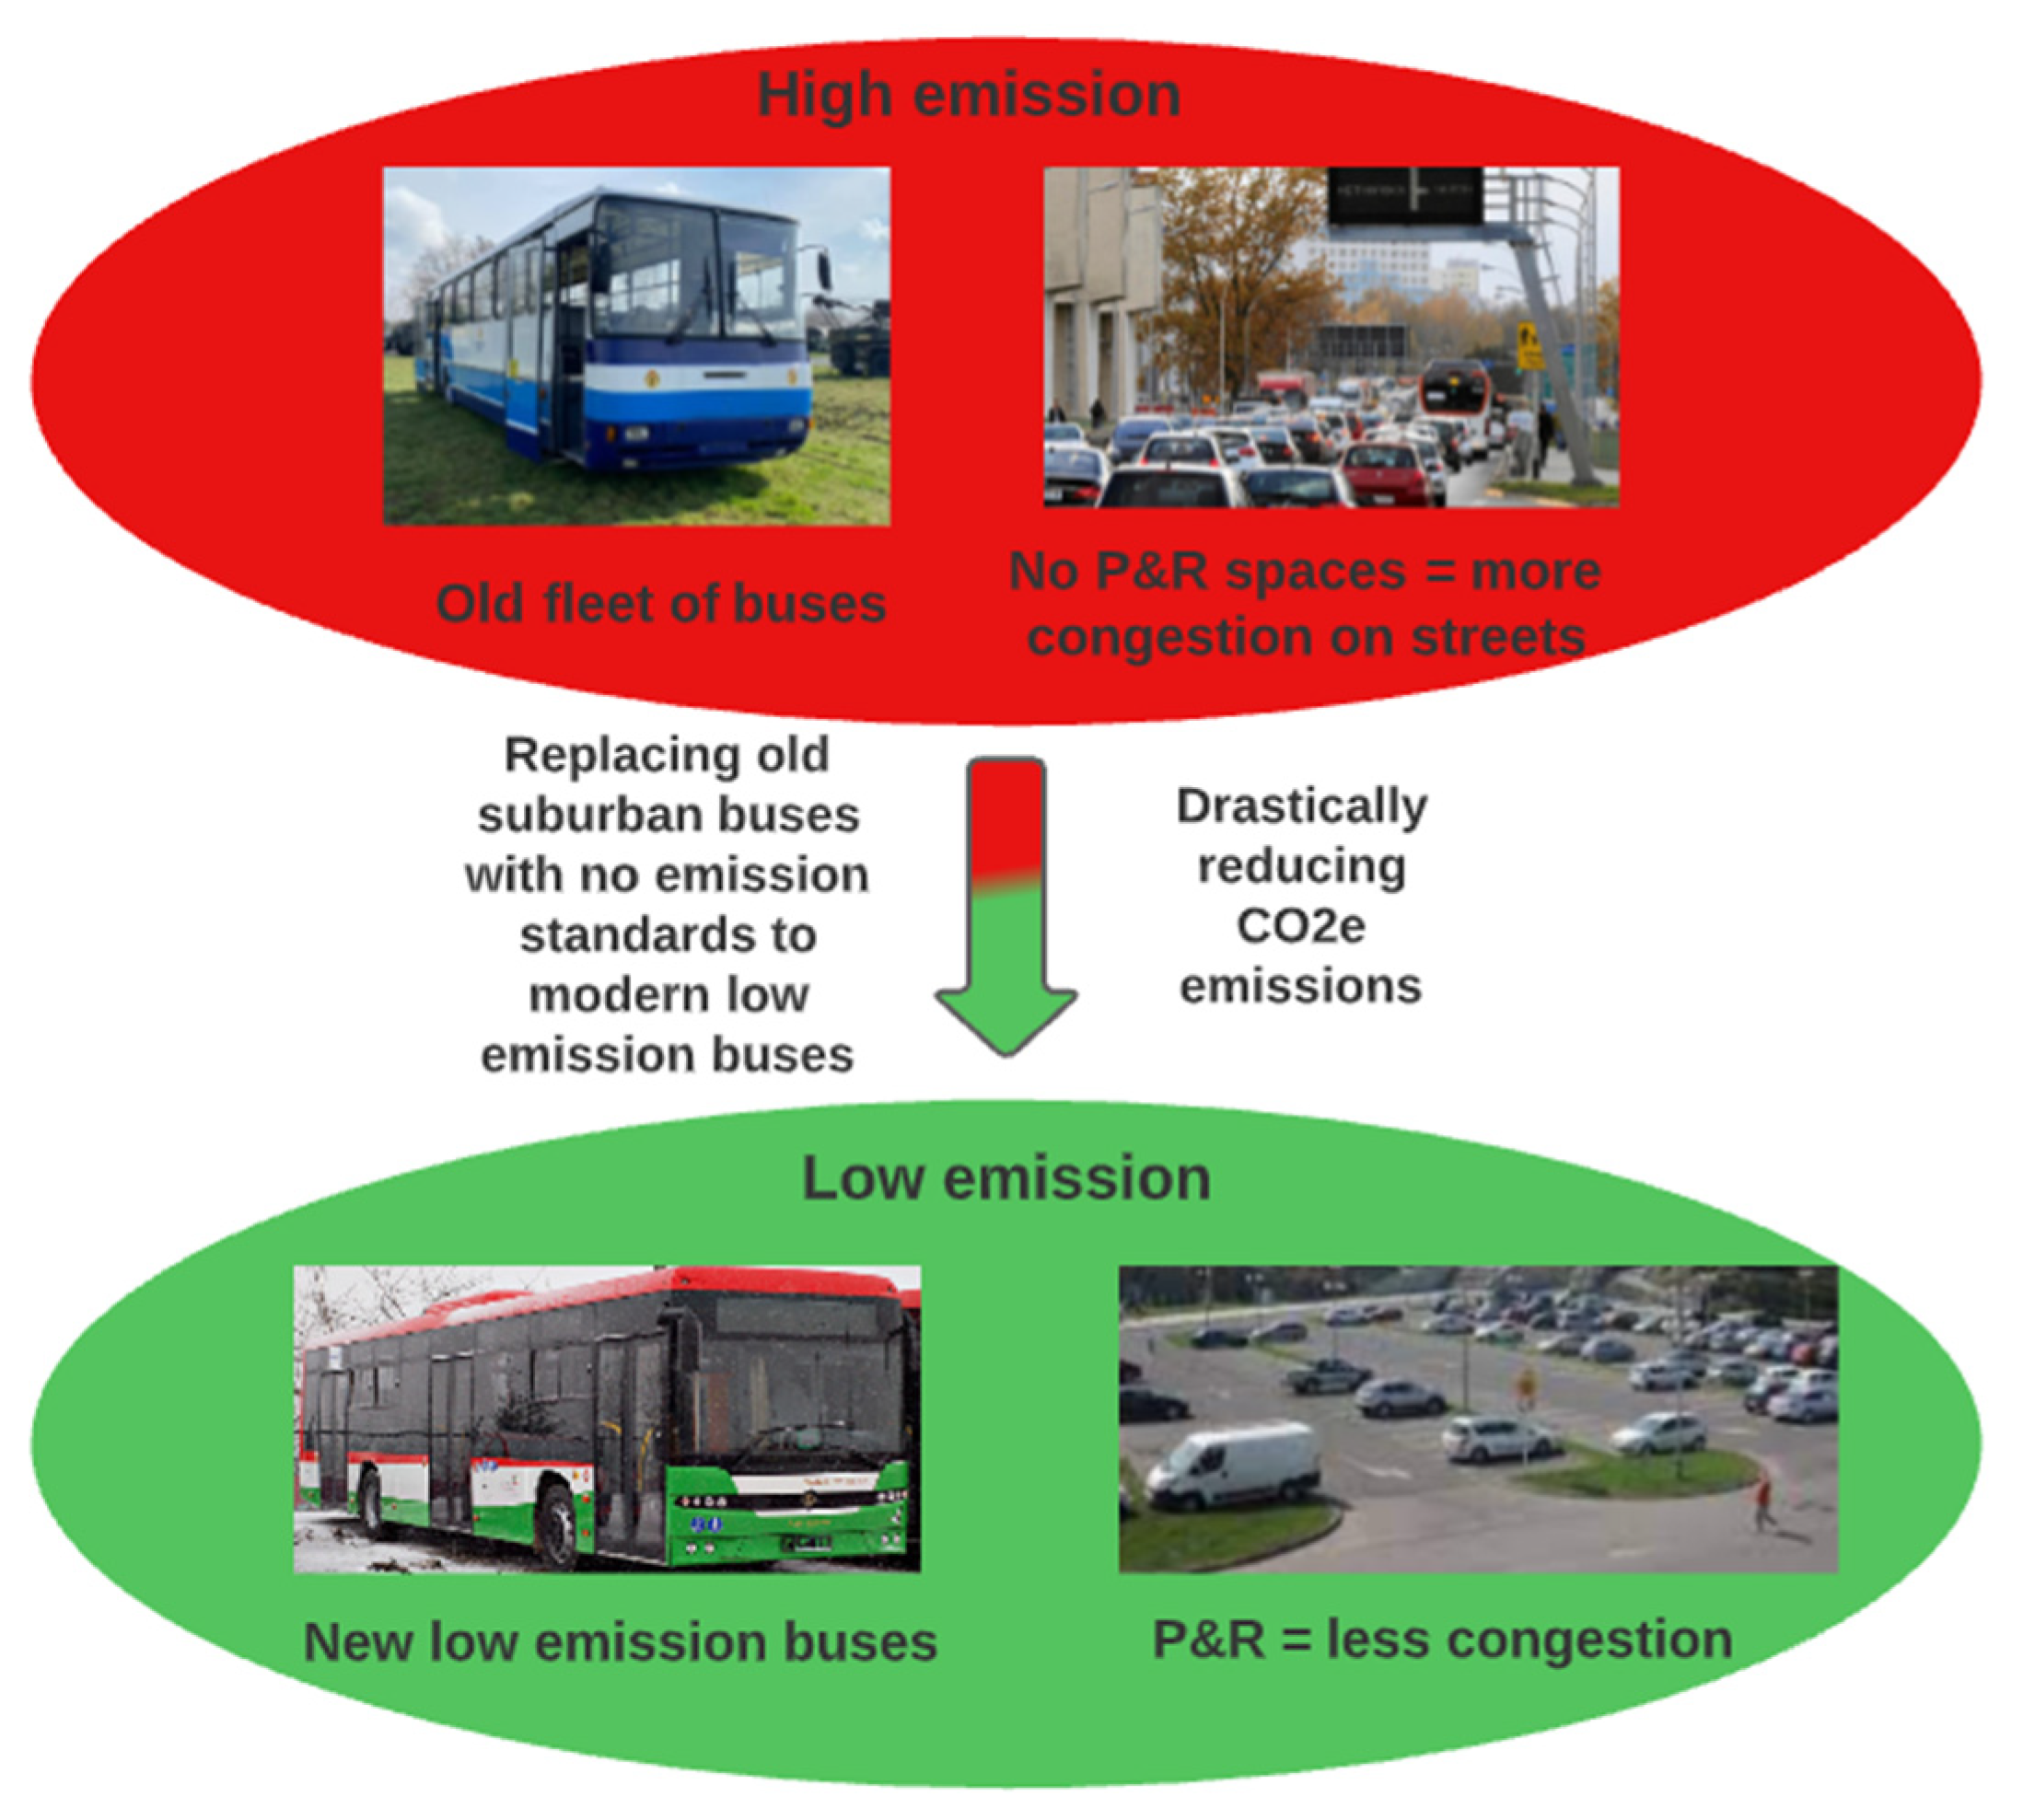
To summarise the above issues and the research methodology, Figure 6 presents the main objectives of the work.
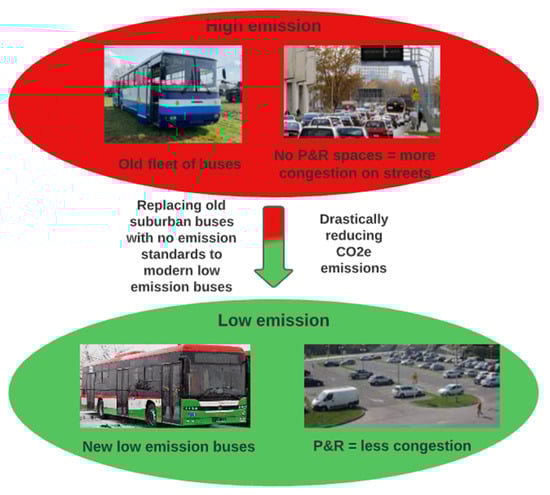
Figure 6.
Overview of the researched buses with the general objectives of the work.
3. Results
The proposed methodology and its applicability are demonstrated by comparing two bus fleet variants in terms of CO2e emissions. As noted above, V0 includes the old bus fleet and additional trips made by the passengers’ cars due to the lack of P&R spaces in this scenario. Variant V1 was based on the new low-emission bus fleet and the construction of new P&R spaces in the suburban areas. The data used for the emission calculation were for the one-year period from the start of 2021 to the start of 2022. The data used for the emission calculations were real-world data obtained from bus trips and road infrastructure.
The value of the annual decrease in pollutant emissions GHG and CO2e was determined from Formula (2) [22]:
where:
ΔE—annual decrease in pollutant emissions resulting from project implementation,
Eo—pre-project emissions (non-investment scenario variant V0),
E1—pollutant emissions after project implementation (scenario variant V1).
The main GHGs emitted by the vehicles’ internal combustion are CO2, CH4, N2O, and CO. Therefore, when analysing the impact of greenhouse gases from the transport sector, the total emissions are expressed in equivalent CO2e, taking into account the greenhouse potential values of the constituent gases. The CO2e emission value was calculated from Formula (3):
where:
CO2e—carbon dioxide equivalent emission,
ECO2—emission of CO2,
EN2O—emission of N2O,
ECH4—emission of CH4,
ECO—emission of CO,
—global warming potential (GWP) N2O = 298,
—GWP CH4 = 25,
—GWP CO = 3.0.
Global warming potential (GWP) is generally considered a vital indicator for the effects of GHG emissions, with the GWP of CO2 defined as 1 [23,24,25]. The GWP values chosen for CH4 and N2O are values over a 100-year time horizon relative to CO2. These values were adapted from the IPCC Fourth Assessment Report [26]. For CO, the indirect GWP value for a 100-year time horizon was adopted according to [27].
The results of GHG emission calculations for the V0 variant (i.e., old fleet of vehicles, no P&R parking lots) for each of the analysed lines are summarised in Table 5.
Table 5.
Greenhouse gas emission calculation results for the old fleet of buses in variant V0.
The calculated GHG emissions from passenger cars for scenario variant V0 are shown in Table 6.
Table 6.
Greenhouse gas emission calculation results from passenger cars in variant V0.
The calculated GHG emissions values for new buses under scenario variant V1 per bus line are shown in Table 7.
Table 7.
Greenhouse gas emission calculation results for new EURO VI buses in variant V1.
The estimated annual decrease in CO2e emissions associated with project implementation over the 2021–2022 period is listed in Table 8.
Table 8.
Annual estimated decrease in greenhouse gas emissions CO2e for the analysed period.
As shown, due to the project realisation, i.e., replacement of 52 old buses with low emission standards and construction of new P&R spaces, there is a total reduction of 448.3 t of CO2e. Of this value, the bus replacement accounts for a reduction in GHG emissions of 201.9 t. Thus, the GHG emission reduction was more than doubled when the P&R spaces were included, demonstrating the joint importance of creating P&R zones and using buses instead of individual cars. Study [28] shows similar results but only in relation to one bus line. The aim of [28] was to measure the environmental benefits of replacing diesel buses with four types of alternative energy city buses. The authors analysed the CO2e footprint of buses powered with diesel, LNG, LPG, plug-in electric, and hydrogen and found that the use of hydrogen fuel cell buses would eliminate 1244.1 t of CO2e emissions in Tainan City. The analyses performed were adjusted to the whole fleet of buses and show that, at a country scale, using hydrogen fuel would result in a reduction of 227,000 t annually in Taiwan. The authors used the carbon footprint model to calculate CO2e and did not separately calculate CO2, N2O, CH4, and CO for CO2e assessment. Another similar example is study [29], where the authors applied a multiscale regional chemistry–transport model to calculate CO2e in the city of London. The work particularly analysed the environmental impact of diesel-fuelled buses, lean-burn compressed natural gas, and hybrid–electric buses. The authors, as in [28], did not calculate the emissions for the gases constituting CO2e, which represents a limitation of their study. Similarly, at Columbia University in New York [30], the authors show how implementing diesel and CNG buses can reduce CO2e; however, the calculations are still limited and do not show details of the calculation process itself. Based on the above, the study presented in this paper is one of the first to show a full methodology for assessing the impact of implementing a new fleet of buses and new parking infrastructure on CO2e.
4. Conclusions
The purpose of the study was to demonstrate a methodology for calculating CO2e for bus fleets. The analysis concerned the real case study for the area of the Rzeszów municipality. Real data for 52 buses for 13 suburban bus lines were used for the analysis. Based on the prepared methodology, a comparative analysis was performed for CO2e emissions for a scenario before replacing the bus fleet with a new fleet. A new bus fleet scenario was also modelled, which included the construction of P&R parking places.
In Central and Eastern European countries, old bus fleets are common [31,32]. The CO2e emissions calculations based on the replacement of the bus fleet with a new one show a significant reduction in GHG emissions. Thus, implementing projects of this type plays a crucial role in addressing the ever-increasing problem of GHG emissions and the resulting greenhouse effect. Based on the methodology presented in this study, the replacement of the fleet of 52 buses and the construction of P&R zones reduced the CO2e emissions by more than 448 t over the one-year study period. This amount of GHG reduction corresponds to 150 t of waste recycled instead of landfilled.
The methodology presented is a new approach for analysing CO2e emissions for buses—this approach also takes into account emissions of CO, which is also a greenhouse gas but is often overlooked in calculations. CO is a very weak direct greenhouse gas, but it has an important indirect effect on global warming. Carbon monoxide reacts with OH radicals in the atmosphere, reducing their abundance. Since these radicals contribute to shortening the lifetimes of potent greenhouse gases, such as CH4, carbon monoxide indirectly increases the global warming potential of other gases. The review presented in this study also shows that the current state of the literature does not include a demonstration of this type of methodology on the scale of a bus fleet over a longer-term period of analysis. A limitation of the current work and an area for future research is the incorporation of other exhaust gas components in the analysis, e.g., PM10, and an analysis of emissions for other bus propulsion configurations, e.g., electric or hydrogen buses.
Author Contributions
Conceptualisation, A.J., M.M. and H.K.; methodology, A.J. and M.M.; software, M.M.; validation, H.K. and A.J.; formal analysis, A.J., M.M. and H.K.; investigation, A.J. and H.K.; resources, A.J. and M.M.; data curation, A.J. and M.M.; writing—original draft preparation, A.J. and M.M.; writing—review and editing, A.J., M.M. and H.K.; visualisation, M.M.; supervision, H.K. All authors have read and agreed to the published version of the manuscript.
Funding
This research received no external funding. The APC was funded by Rzeszow University of Technology.
Institutional Review Board Statement
Not applicable.
Informed Consent Statement
Not applicable.
Data Availability Statement
Data are contained within the article.
Acknowledgments
The authors would like to thank the Association of Municipalities “Podkarpacka Komunikacja Samochodowa” in Rzeszów for participating in the described research and to allowing the presentation of the results of the project. The authors wish to acknowledge the Polish Ministry of Education and Science and the Rzeszow University of Technology for supporting this research.
Conflicts of Interest
The authors declare no conflict of interest.
Abbreviations
| CH4 | Methane |
| CNG | Compressed natural gas |
| CO | Carbon monoxide |
| CO2 | Carbon dioxide |
| CO2e | Carbon dioxide equivalent |
| ΔE | Annual decrease in pollutant emissions resulting from project implementation |
| E0 | Pre-project emissions |
| E1 | Pollutant emissions after project implementation |
| Ei | Emissions of exhaust component i |
| EFi,j,m | Emission factor of component i for vehicle category j and fuel m |
| EGD | European Green Deal |
| FCj,m | Fuel consumption of a given vehicle category j, using fuel m |
| GWP | Global warming potential |
| LPG | Liquefied petroleum gas |
| N2O | Nitrous oxide |
| O3 | Ozone |
| P&R | Park & Ride |
| PM10 | Particulate matter with a diameter of 10 μm or less |
Appendix A
Table A1.
Input to COPERT emission model—the list of the old fleet buses (left side) with the new replaced buses (right side), including basic parameters, such as EURO standard, production year, and curb weight.
Table A1.
Input to COPERT emission model—the list of the old fleet buses (left side) with the new replaced buses (right side), including basic parameters, such as EURO standard, production year, and curb weight.
| Lp. | Old Bus Type | Production Year | EURO Standard | Curb Weight (t) | Replaced New Bus Type | Production Year | EURO Standard | Curb Weight (t) |
|---|---|---|---|---|---|---|---|---|
| 1 | Bus type 1 | 1996 | - | 10.5 | Bus type 7 | 2018 | VI | 10.6 |
| 2 | Bus type 1 | 2000 | - | 10.5 | Bus type 7 | 2018 | VI | 10.6 |
| 3 | Bus type 1 | 2000 | - | 10.5 | Bus type 7 | 2018 | VI | 10.6 |
| 4 | Bus type 1 | 2000 | - | 10.5 | Bus type 7 | 2018 | VI | 10.6 |
| 5 | Bus type 1 | 2000 | - | 10.5 | Bus type 7 | 2018 | VI | 10.6 |
| 6 | Bus type 1 | 1997 | - | 10.5 | Bus type 7 | 2018 | VI | 10.6 |
| 7 | Bus type 1 | 1995 | - | 10.5 | Bus type 7 | 2018 | VI | 10.6 |
| 8 | Bus type 1 | 1995 | - | 10.5 | Bus type 7 | 2018 | VI | 10.6 |
| 9 | Bus type 1 | 2000 | - | 10.5 | Bus type 7 | 2018 | VI | 10.6 |
| 10 | Bus type 1 | 2000 | - | 10.5 | Bus type 7 | 2018 | VI | 10.6 |
| 11 | Bus type 1 | 1997 | - | 10.5 | Bus type 7 | 2018 | VI | 10.6 |
| 12 | Bus type 1 | 2001 | - | 10.5 | Bus type 7 | 2018 | VI | 10.6 |
| 13 | Bus type 1 | 2001 | - | 10.5 | Bus type 7 | 2018 | VI | 10.6 |
| 14 | Bus type 1 | 1997 | - | 10.5 | Bus type 7 | 2018 | VI | 10.6 |
| 15 | Bus type 1 | 1999 | - | 10.5 | Bus type 7 | 2018 | VI | 10.6 |
| 16 | Bus type 1 | 1998 | - | 10.5 | Bus type 7 | 2018 | VI | 10.6 |
| 17 | Bus type 1 | 2001 | - | 10.5 | Bus type 7 | 2018 | VI | 10.6 |
| 18 | Bus type 1 | 1998 | - | 10.5 | Bus type 7 | 2018 | VI | 10.6 |
| 19 | Bus type 1 | 2001 | - | 10.5 | Bus type 7 | 2018 | VI | 10.6 |
| 20 | Bus type 1 | 1995 | - | 10.5 | Bus type 7 | 2018 | VI | 10.6 |
| 21 | Bus type 1 | 1998 | - | 10.5 | Bus type 7 | 2018 | VI | 10.6 |
| 22 | Bus type 1 | 1999 | - | 10.5 | Bus type 7 | 2018 | VI | 10.6 |
| 23 | Bus type 1 | 1998 | - | 10.5 | Bus type 7 | 2018 | VI | 10.6 |
| 24 | Bus type 1 | 1998 | - | 10.5 | Bus type 7 | 2018 | VI | 10.6 |
| 25 | Bus type 1 | 2001 | - | 10.5 | Bus type 7 | 2019 | VI | 10.6 |
| 26 | Bus type 1 | 2002 | - | 10.5 | Bus type 7 | 2019 | VI | 10.6 |
| 27 | Bus type 1 | 2002 | - | 10.5 | Bus type 7 | 2019 | VI | 10.6 |
| 28 | Bus type 1 | 2002 | - | 10.5 | Bus type 7 | 2019 | VI | 10.6 |
| 29 | Bus type 1 | 2002 | - | 10.5 | Bus type 7 | 2019 | VI | 10.6 |
| 30 | Bus type 2 | 1999 | II | 7.7 | Bus type 7 | 2019 | VI | 10.6 |
| 31 | Bus type 2 | 1999 | II | 7.7 | Bus type 7 | 2019 | VI | 10.6 |
| 32 | Bus type 2 | 1999 | II | 7.7 | Bus type 7 | 2019 | VI | 10.6 |
| 33 | Bus type 2 | 1999 | II | 7.7 | Bus type 7 | 2019 | VI | 10.6 |
| 34 | Bus type 2 | 1999 | II | 7.7 | Bus type 7 | 2019 | VI | 10.6 |
| 35 | Bus type 3 | 1999 | II | 11.8 | Bus type 7 | 2019 | VI | 10.6 |
| 36 | Bus type 3 | 2000 | II | 11.8 | Bus type 7 | 2019 | VI | 10.6 |
| 37 | Bus type 3 | 1999 | II | 11.8 | Bus type 7 | 2019 | VI | 10.6 |
| 38 | Bus type 3 | 1999 | II | 11.8 | Bus type 7 | 2019 | VI | 10.6 |
| 39 | Bus type 3 | 2000 | II | 11.8 | Bus type 7 | 2019 | VI | 10.7 |
| 40 | Bus type 3 | 1999 | II | 11.8 | Bus type 7 | 2019 | VI | 10.7 |
| 41 | Bus type 3 | 2000 | II | 11.8 | Bus type 7 | 2019 | VI | 10.7 |
| 42 | Bus type 3 | 2000 | II | 11.8 | Bus type 7 | 2019 | VI | 10.7 |
| 43 | Bus type 3 | 1999 | II | 11.8 | Bus type 7 | 2019 | VI | 10.7 |
| 44 | Bus type 3 | 2000 | II | 11.8 | Bus type 7 | 2019 | VI | 10.7 |
| 45 | Bus type 4 | 2001 | II | 8.5 | Bus type 7 | 2019 | VI | 10.7 |
| 46 | Bus type 4 | 2001 | II | 8.5 | Bus type 7 | 2019 | VI | 10.7 |
| 47 | Bus type 4 | 2001 | II | 8.5 | Bus type 7 | 2019 | VI | 10.7 |
| 48 | Bus type 4 | 2001 | II | 8.5 | Bus type 7 | 2019 | VI | 10.7 |
| 49 | Bus type 4 | 2001 | II | 8.5 | Bus type 7 | 2019 | VI | 10.7 |
| 50 | Bus type 5 | 2000 | II | 10.9 | Bus type 7 | 2019 | VI | 10.7 |
| 51 | Bus type 6 | 2000 | II | 10.9 | Bus type 7 | 2019 | VI | 10.7 |
| 52 | Bus type 6 | 2000 | II | 10.9 | Bus type 7 | 2019 | VI | 10.7 |
References
- Nazarko, Ł.; Žemaitis, E.; Wróblewski, Ł.K.; Šuhajda, K.; Zajączkowska, M. The Impact of Energy Development of the European Union Euro Area Countries on CO2 Emissions Level. Energies 2022, 15, 1425. [Google Scholar] [CrossRef]
- Wałdykowski, P.; Adamczyk, J.; Dorotkiewicz, M. Sustainable Urban Transport—Why a Fast Investment in a Complete Cycling Network Is Most Profitable for a City. Sustainability 2022, 14, 119. [Google Scholar] [CrossRef]
- Mądziel, M.; Campisi, T.; Jaworski, A.; Kuszewski, H.; Woś, P. Assessing Vehicle Emissions from a Multi-Lane to Turbo Roundabout Conversion Using a Microsimulation Tool. Energies 2021, 14, 4399. [Google Scholar] [CrossRef]
- Andrych-Zalewska, M.; Chlopek, Z.; Merkisz, J.; Pielecha, J. Research on Exhaust Emissions in Dynamic Operating States of a Combustion Engine in a Real Driving Emissions Test. Energies 2021, 14, 5684. [Google Scholar] [CrossRef]
- Liu, Y.; Sheng, H.; Mundorf, N.; Redding, C.; Ye, Y. Integrating Norm Activation Model and Theory of Planned Behavior to Understand Sustainable Transport Behavior: Evidence from China. Int. J. Environ. Res. Public Health 2017, 14, 1593. [Google Scholar] [CrossRef] [Green Version]
- Csonka, B. Optimization of Static and Dynamic Charging Infrastructure for Electric Buses. Energies 2021, 14, 3516. [Google Scholar] [CrossRef]
- Corazza, M.; Musso, A.; Guida, U.; Tozzi, M. From EBSF to EBSF_2: A Compelling Agenda for the Bus of the Future. A decade of research for more attractive and sustainable buses. In Proceedings of the 2016 IEEE 16th International Conference on Environment and Electrical Engineering (EEEIC), Florence, Italy, 7–10 June 2016. [Google Scholar]
- UITP—Union International des Transports Public. Position Paper–A Comprehensive Approach for Bus Systems and CO2 Emission Reduction. Available online: http://www.uitp.org/sites/default/files/cck-focus-papersfiles/20111122_UITP%20EU%20position%20paper_comprehensive%20approach%20for%20bus%20systems%20and%20CO2%20emission%2 (accessed on 25 December 2021).
- Bristow, A.; Nellthorp, J. Transport project appraisal in the European Union. Transp. Policy 2000, 7, 51–60. [Google Scholar] [CrossRef]
- Eckhause, J.; Herolds, J. Using real options to determine optimal funding strategies for CO2 capture, transport and storage projects in the European Union. Energy Policy 2014, 66, 115–134. [Google Scholar] [CrossRef]
- Buberger, J.; Kersten, A.; Kuder, M.; Eckerle, R.; Weyh, T.; Torbjorn, T. Total CO2-equivalent life-cycle emissions from commercially available passenger cars. Renew. Sustain. Energy Rev. 2022, 159, 112158. [Google Scholar] [CrossRef]
- Helmers, E.; Leitao, J.; Butler, T. CO2-equivalent emissions from European passenger vehicles in the years 1995–2015 based on real-world use: Assessing the climate benefit of the European “diesel boom”. Atmos. Environ. 2019, 198, 122. [Google Scholar] [CrossRef]
- Jurkovič, M. Environmental impacts of introducing LNG as alternative fuel for urban buses–case study in Slovakia. Prome Traffic Transp. 2020, 32, 837–847. [Google Scholar] [CrossRef]
- Chang, C.; Liao, Y.; Chang, Y. Life Cycle Assessment of Carbon Footprint in Public Transportation—A Case Study of Bus Route NO. 2 in Tainan City, Taiwan. Procedia Manuf. 2019, 30, 388–395. [Google Scholar] [CrossRef]
- Mądziel, M.; Campisi, T.; Jaworski, A.; Tesoriere, G. The Development of Strategies to Reduce Exhaust Emissions from Passenger Cars in Rzeszow City—Poland. A Preliminary Assessment of the Results Produced by the Increase of E-Fleet. Energies 2021, 14, 1046. [Google Scholar] [CrossRef]
- Mądziel, M.; Jaworski, A.; Kuszewski, H.; Woś, P.; Campisi, T.; Lew, K. The Development of CO2 Instantaneous Emission Model of Full Hybrid Vehicle with the Use of Machine Learning Techniques. Energies 2022, 15, 142. [Google Scholar] [CrossRef]
- Li, F.; Zhuang, J.; Cheng, X.; Li, M.; Wang, J.; Yan, Z. Investigation and Prediction of Heavy-Duty Diesel Passenger Bus Emissions in Hainan Using a COPERT Model. Atmosphere 2019, 10, 106. [Google Scholar] [CrossRef] [Green Version]
- Ali, M.; Kamal, M.D.; Tahir, A.; Atif, S. Fuel Consumption Monitoring through COPERT Model—A Case Study for Urban Sustainability. Sustainability 2021, 13, 11614. [Google Scholar] [CrossRef]
- EMEP/EEA Air Pollutant Emission Inventory Guidebook 2019–Update October 2020. Available online: https://www.google.com/url?sa=t&rct=j&q=&esrc=s&source=web&cd=&cad=rja&uact=8&ved=2ahUKEwjzqYzjlOruAhXSxIsKHRrvCaYQFjAJegQIEBAC&url=https%3A%2F%2Fwww.eea.europa.eu%2Fds_resolveuid%2FSHNJDK8413&usg=AOvVaw3BehO2yHr4qJMuN70yvPal (accessed on 15 January 2022).
- Guide to Calculating Air Pollutant Emissions EMEP/EEA. Available online: https://www.eea.europa.eu/themes/air/emep-eea-air-pollutant-emission-inventory-guidebook/emep (accessed on 18 January 2022).
- Polish Local Data Bank. Available online: https://bdl.stat.gov.pl (accessed on 21 January 2022).
- Emission Factors for Greenhouse Gases, Environmental Protection Agency, Department of Transportation. Available online: https://www.epa.gov/sites/production/files/2018-03/documents/emission-factors_mar_2018_0.pdf (accessed on 18 January 2022).
- Tang, H.; Li, C.; Shi, L.; Cheng, K.; Wen, L.; Li, W.; Xiao, X. Effects of Short-Term Tillage Managements on CH4 and N2O Emissions from a Double-Cropping Rice Field in Southern of China. Agronomy 2022, 12, 517. [Google Scholar] [CrossRef]
- Arrigoni, A.; Arosio, V.; Basso Peressut, A.; Latorrata, S.; Dotelli, G. Greenhouse Gas Implications of Extending the Service Life of PEM Fuel Cells for Automotive Applications: A Life Cycle Assessment. Clean Technol. 2022, 4, 132–148. [Google Scholar] [CrossRef]
- Wei, X.; Ye, M.; Yuan, L.; Bi, W.; Lu, W. Analyzing the Freight Characteristics and Carbon Emission of Construction Waste Hauling Trucks: Big Data Analytics of Hong Kong. Int. J. Environ. Res. Public Health 2022, 19, 2318. [Google Scholar] [CrossRef]
- Global Warming Potential Values. Available online: https://www.ghgprotocol.org/sites/default/files/ghgp/Global-Warming-Potential-Values%20%28Feb%2016%202016%29_1.pdf (accessed on 20 January 2022).
- Fuglestvedt, J.S.; Isaksen, I.S.A.; Wang, W.C. Estimates of Indirect Global Warming Potentials for CH4, CO and NOx. Clim. Chang. 1996, 34, 405–437. [Google Scholar] [CrossRef]
- Chang, C.; Liao, Y.; Chang, Y. Life cycle assessment of alternative energy types–including hydrogen–for public city buses in Taiwan. Int. J. Hydrog. Energy 2022, 44, 18742. [Google Scholar] [CrossRef]
- Chong, U.; Tim, S.; Barrett, S.; Boises, A. Air Quality and Climate Impacts of Alternative Bus Technologies in Greater London. Environ. Sci. Technol. 2014, 48, 4613–4622. [Google Scholar] [CrossRef] [PubMed]
- Aber, J. Electric Bus Analysis for New York City Transit. Report. Columbia University, 2016. Available online: http://www.columbia.edu/~ja3041/Electric%20Bus%20Analysis%20for%20NYC%20Transit%20by%20J%20Aber%20Columbia%20University%20-%20May%202016.pdf (accessed on 2 February 2022).
- Niemczyk, J.; Sus, A.; Borowski, K.; Jasiński, B.; Jasińska, K. The Dominant Motives of Mergers and Acquisitions in the Energy Sector in Western Europe from the Perspective of Green Economy. Energies 2022, 15, 1065. [Google Scholar] [CrossRef]
- Gatta, V.; Marcucci, E.; Nigro, M.; Patella, S.M.; Serafini, S. Public Transport-Based Crowdshipping for Sustainable City Logistics: Assessing Economic and Environmental Impacts. Sustainability 2019, 11, 145. [Google Scholar] [CrossRef] [Green Version]

Publisher’s Note: MDPI stays neutral with regard to jurisdictional claims in published maps and institutional affiliations. |
© 2022 by the authors. Licensee MDPI, Basel, Switzerland. This article is an open access article distributed under the terms and conditions of the Creative Commons Attribution (CC BY) license (https://creativecommons.org/licenses/by/4.0/).