
Assessment of Retention System Effects of Level III Armored Vehicles

 ,
,  ,
,
Abstract
:1. Introduction
2. Materials and Methods
- Inquired about the European and American regulations related to collision tests.
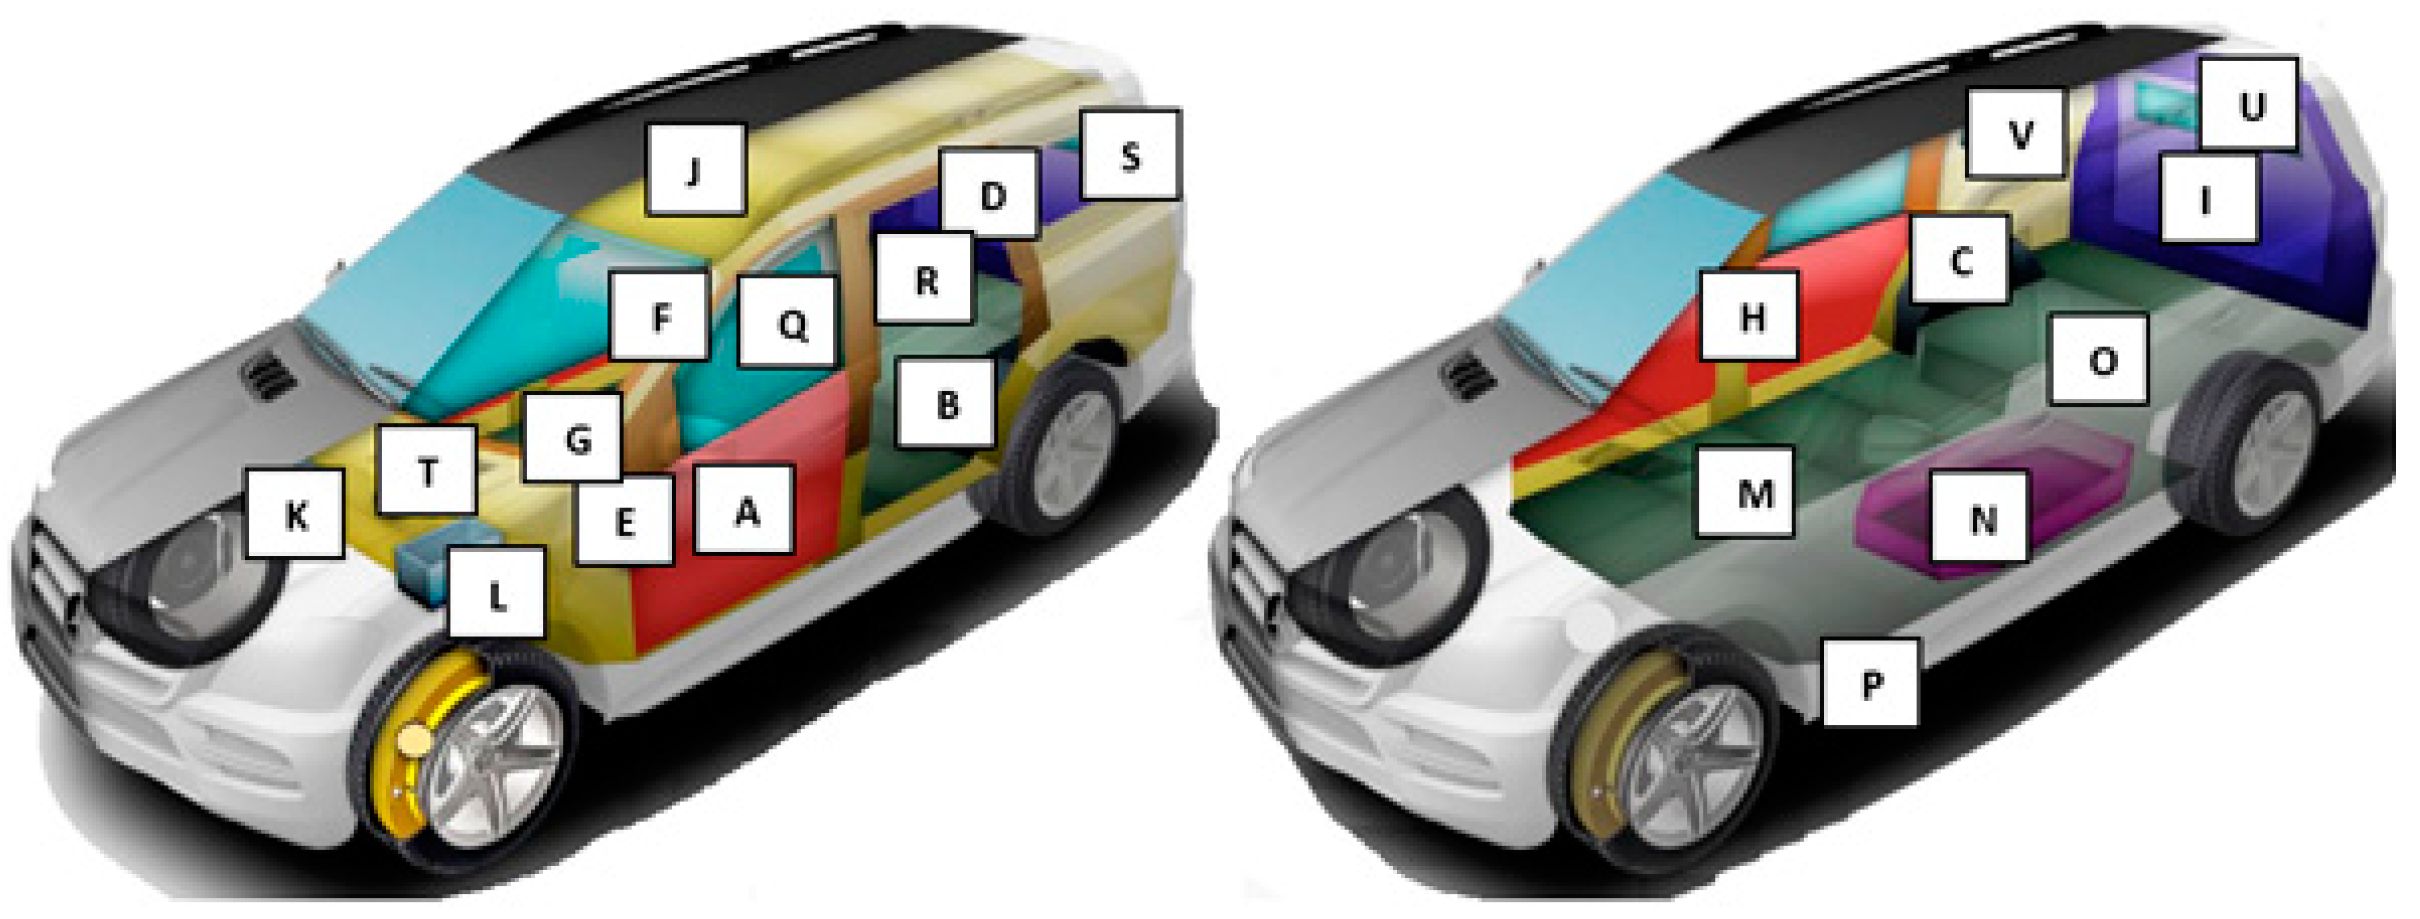
- Shielding process in the virtual model—the extra weight due to armoring process is added.
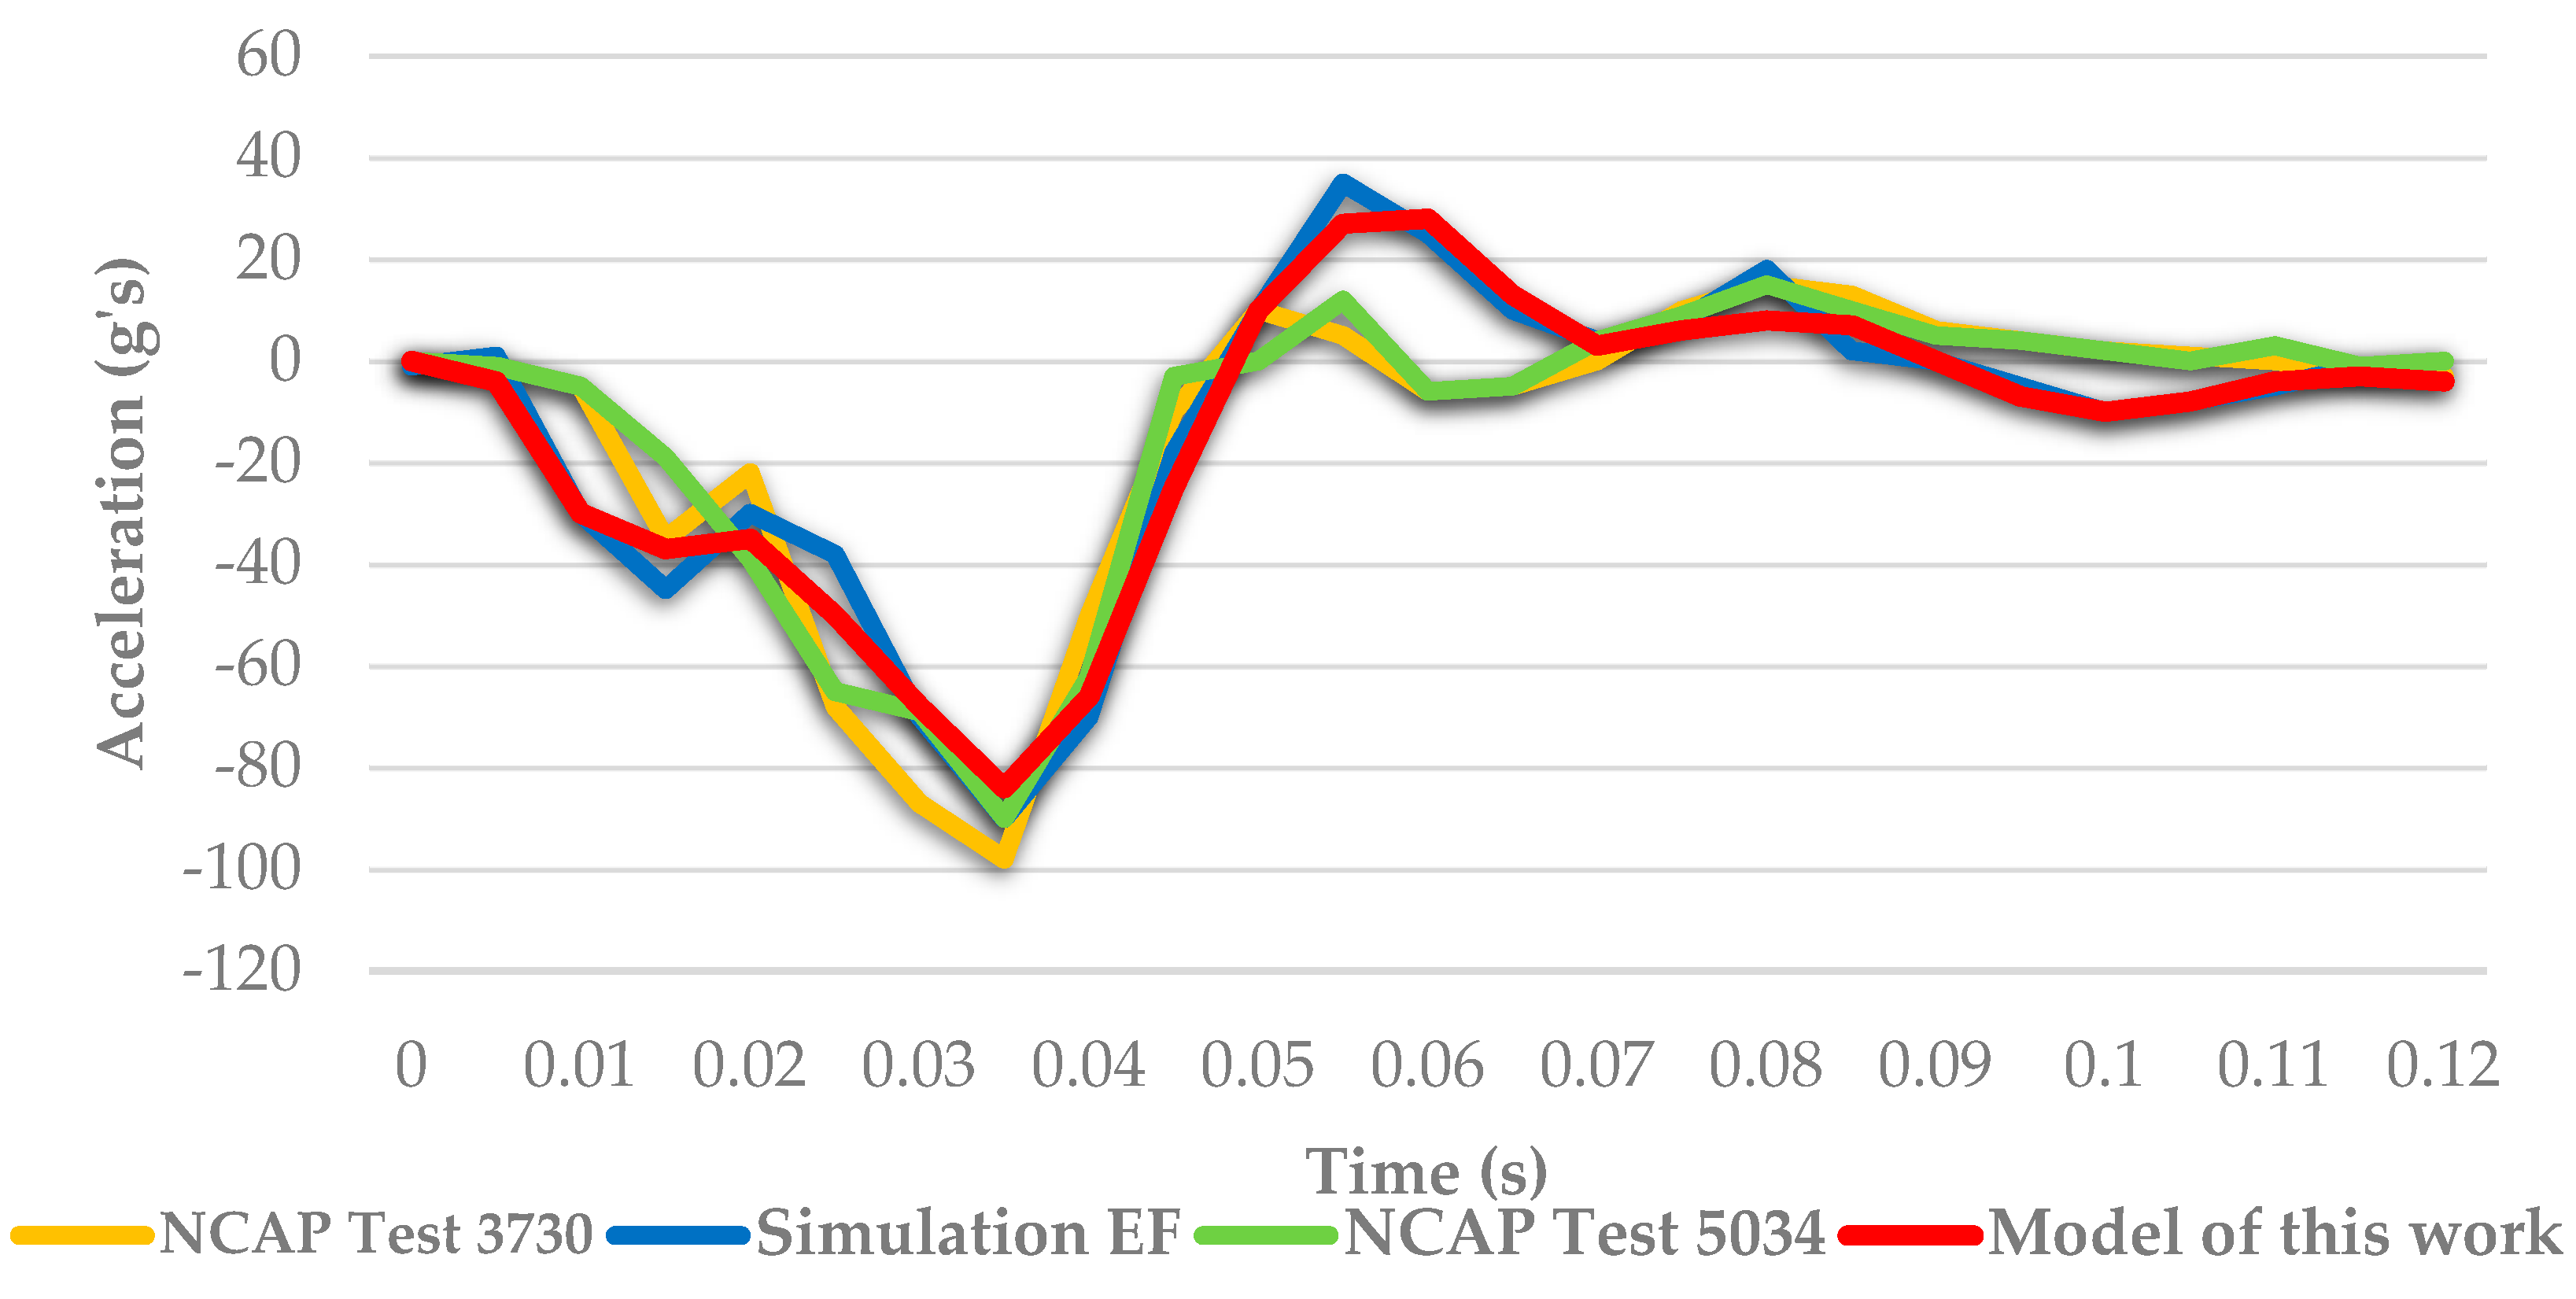
- Numerical analysis of the frontal collision of the modified vehicle using LS-DYNA® software (Canonsburg, PA, USA)—a virtual test is generated to obtain the acceleration severity index and assess the forces concentrated in the driver due to a sudden deceleration during a crash.
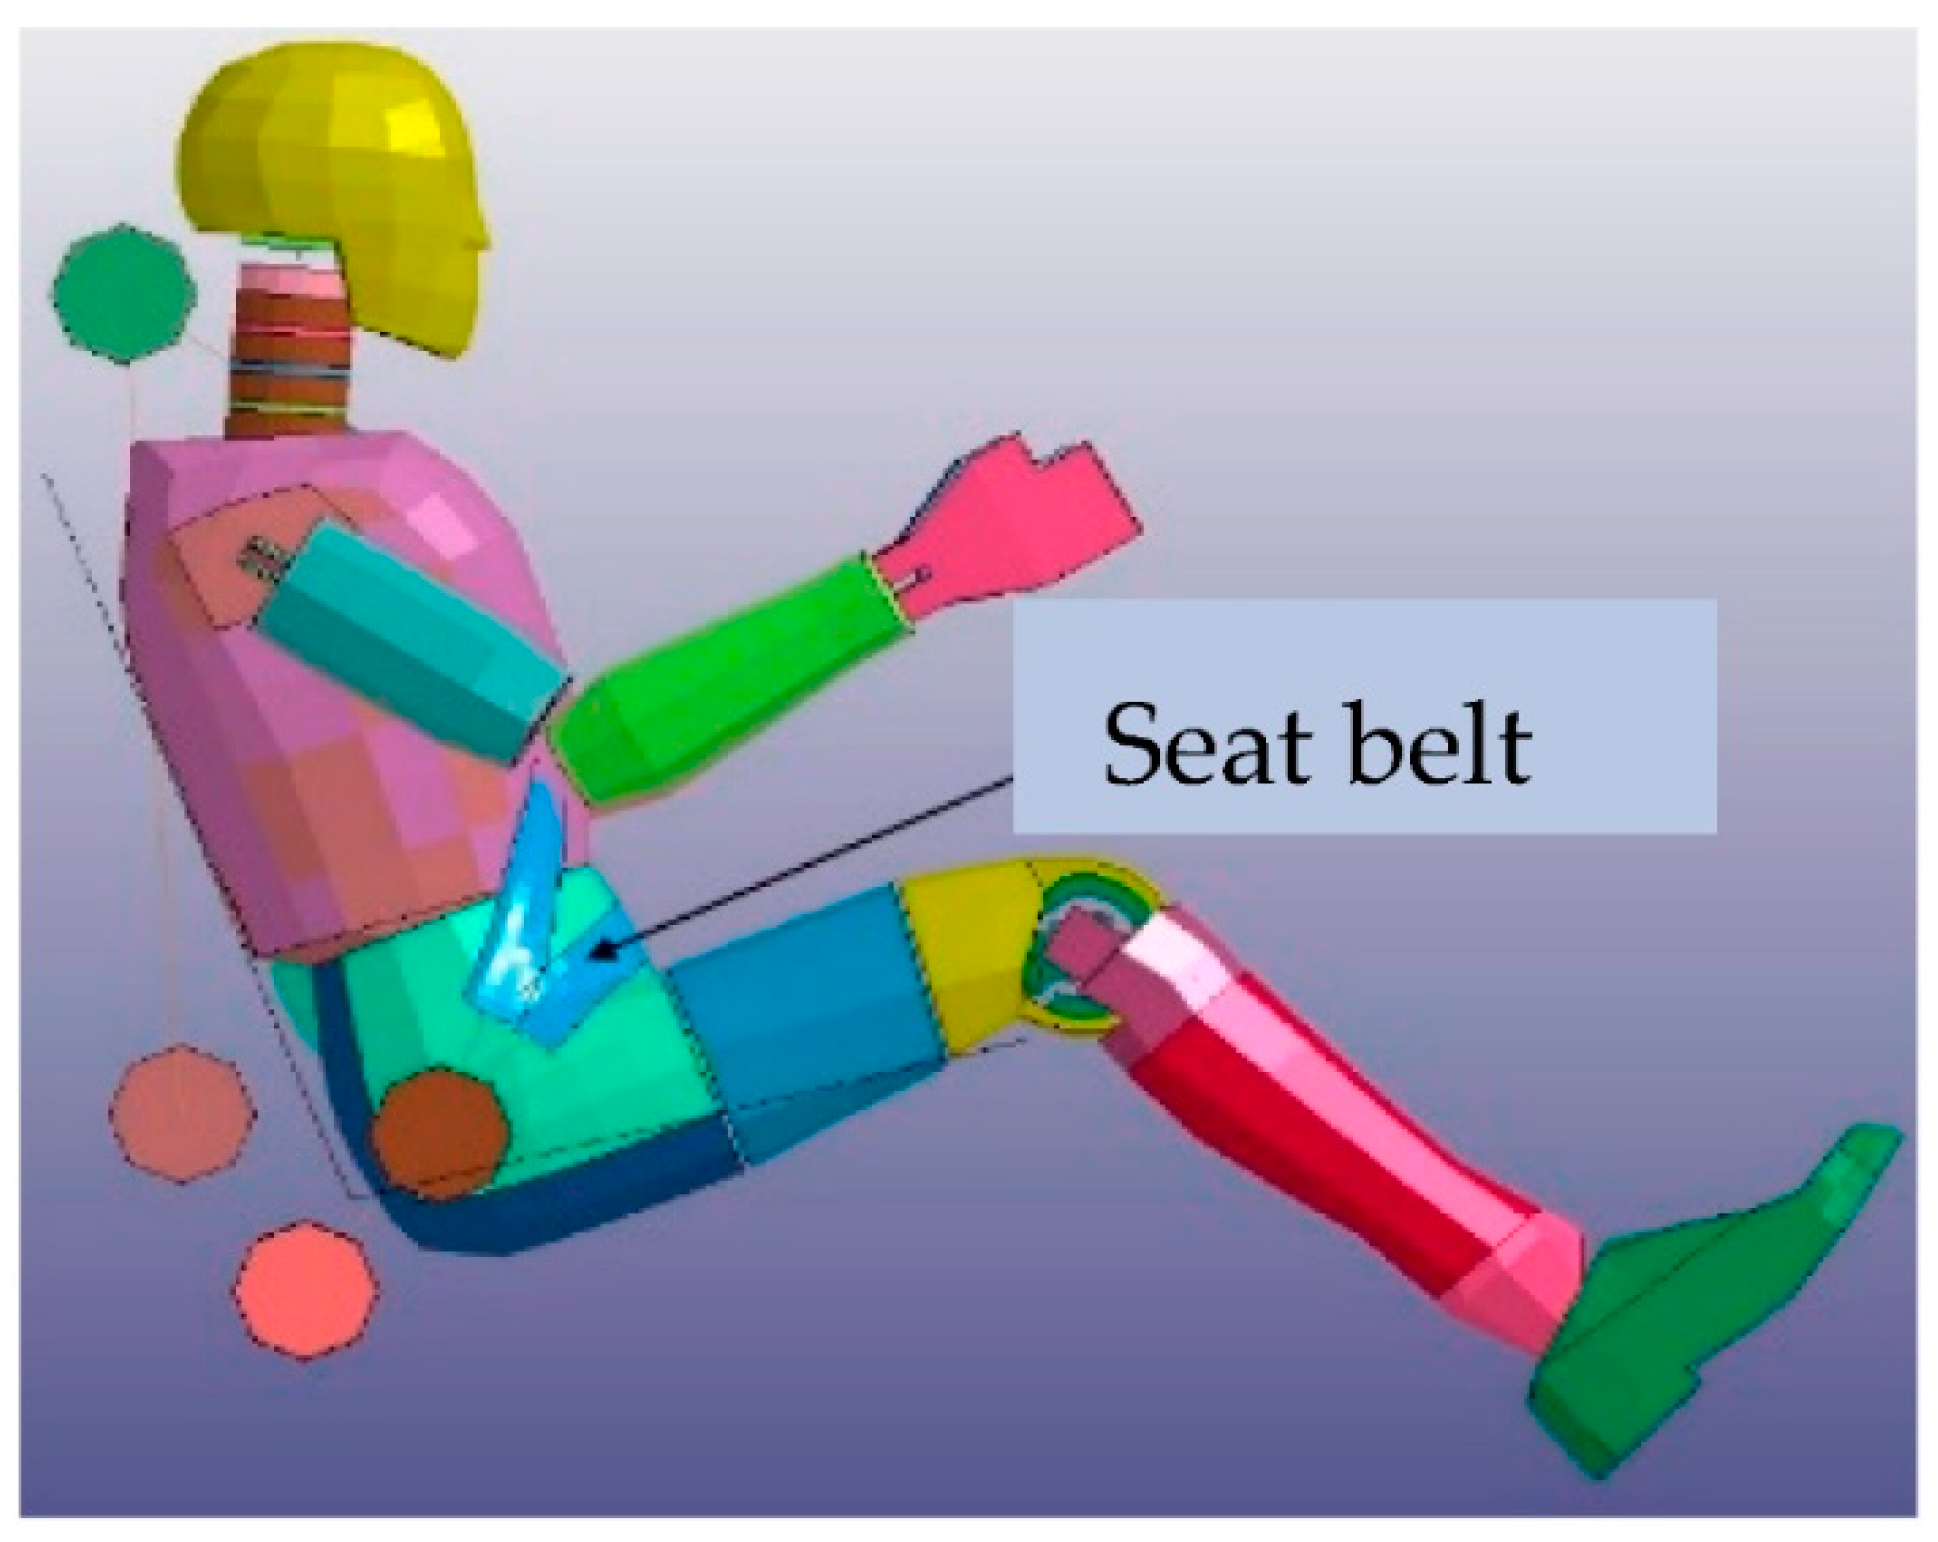
- Implement border conditions for the frontal collision test in the armored vehicle. A numerical crash simulation with a 50th percentile virtual dummy is generated with LS-DYNA® to obtain the dummy damage during impact on an armored vehicle.
- Results, discussions, and conclusions. The simulation of the restraint system performance (seatbelt) on a 50th percentile dummy during an impact on an armored vehicle and an unshielded vehicle. In the end, a conclusion will be presented on whether it is safe to use restraint systems, such as the seatbelt inside of an armored vehicle at the time of a collision.
2.1. Development
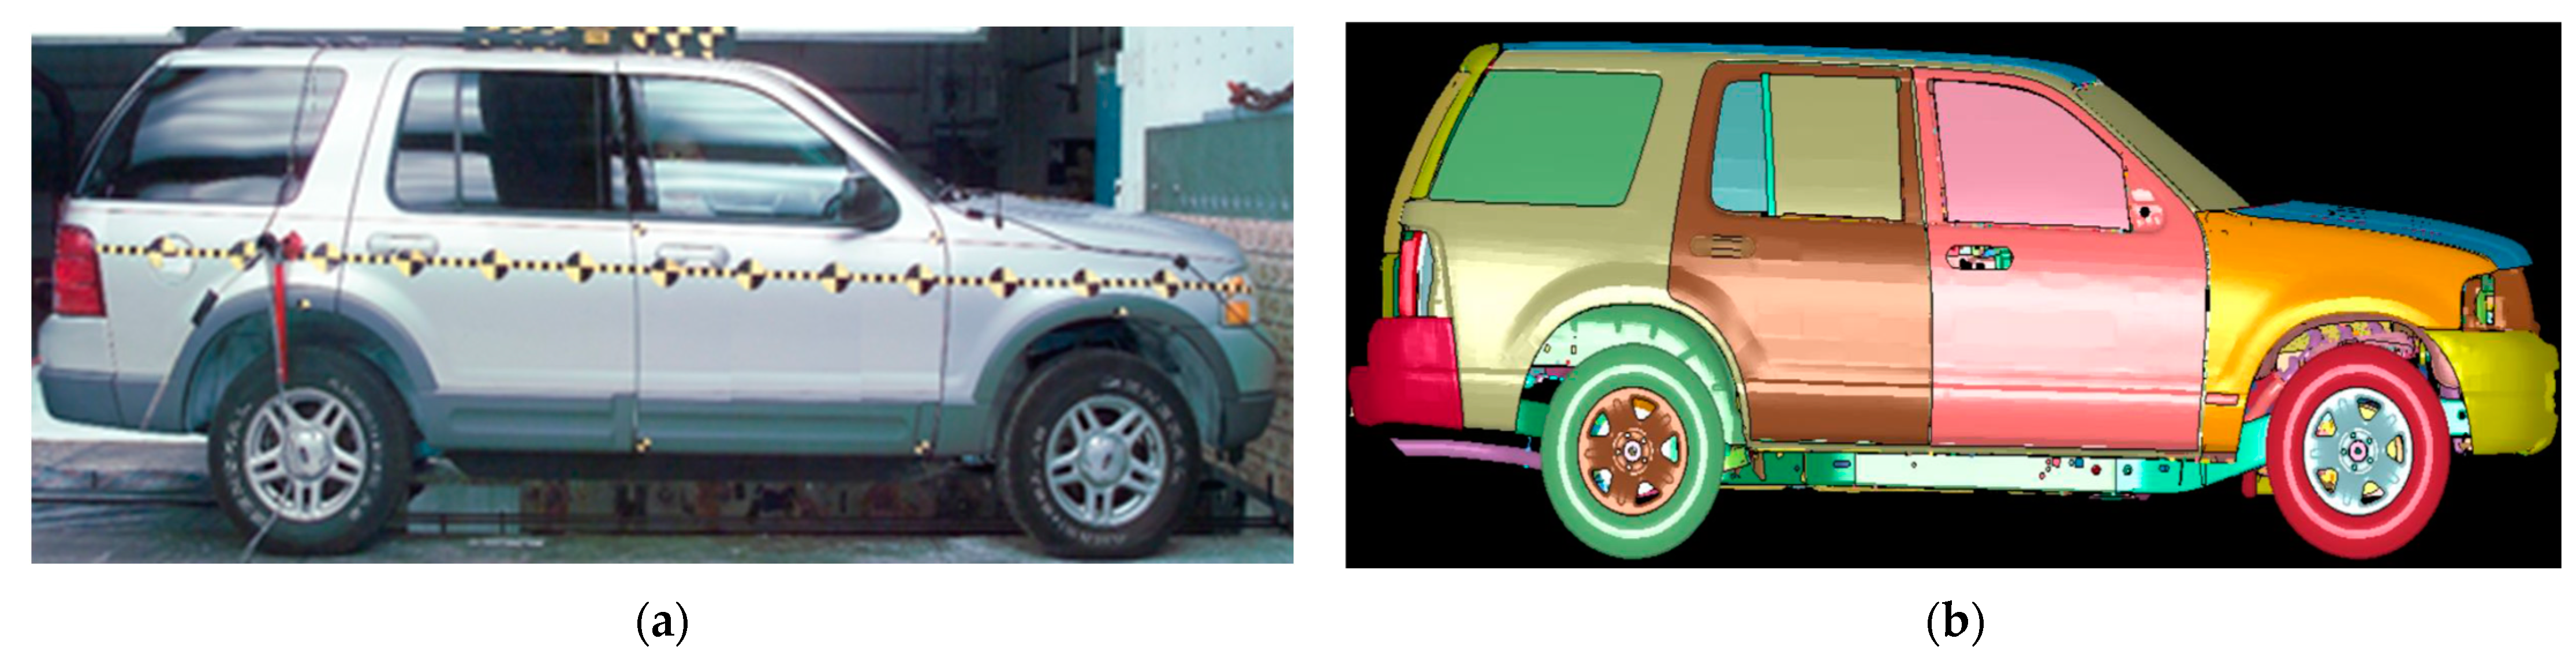
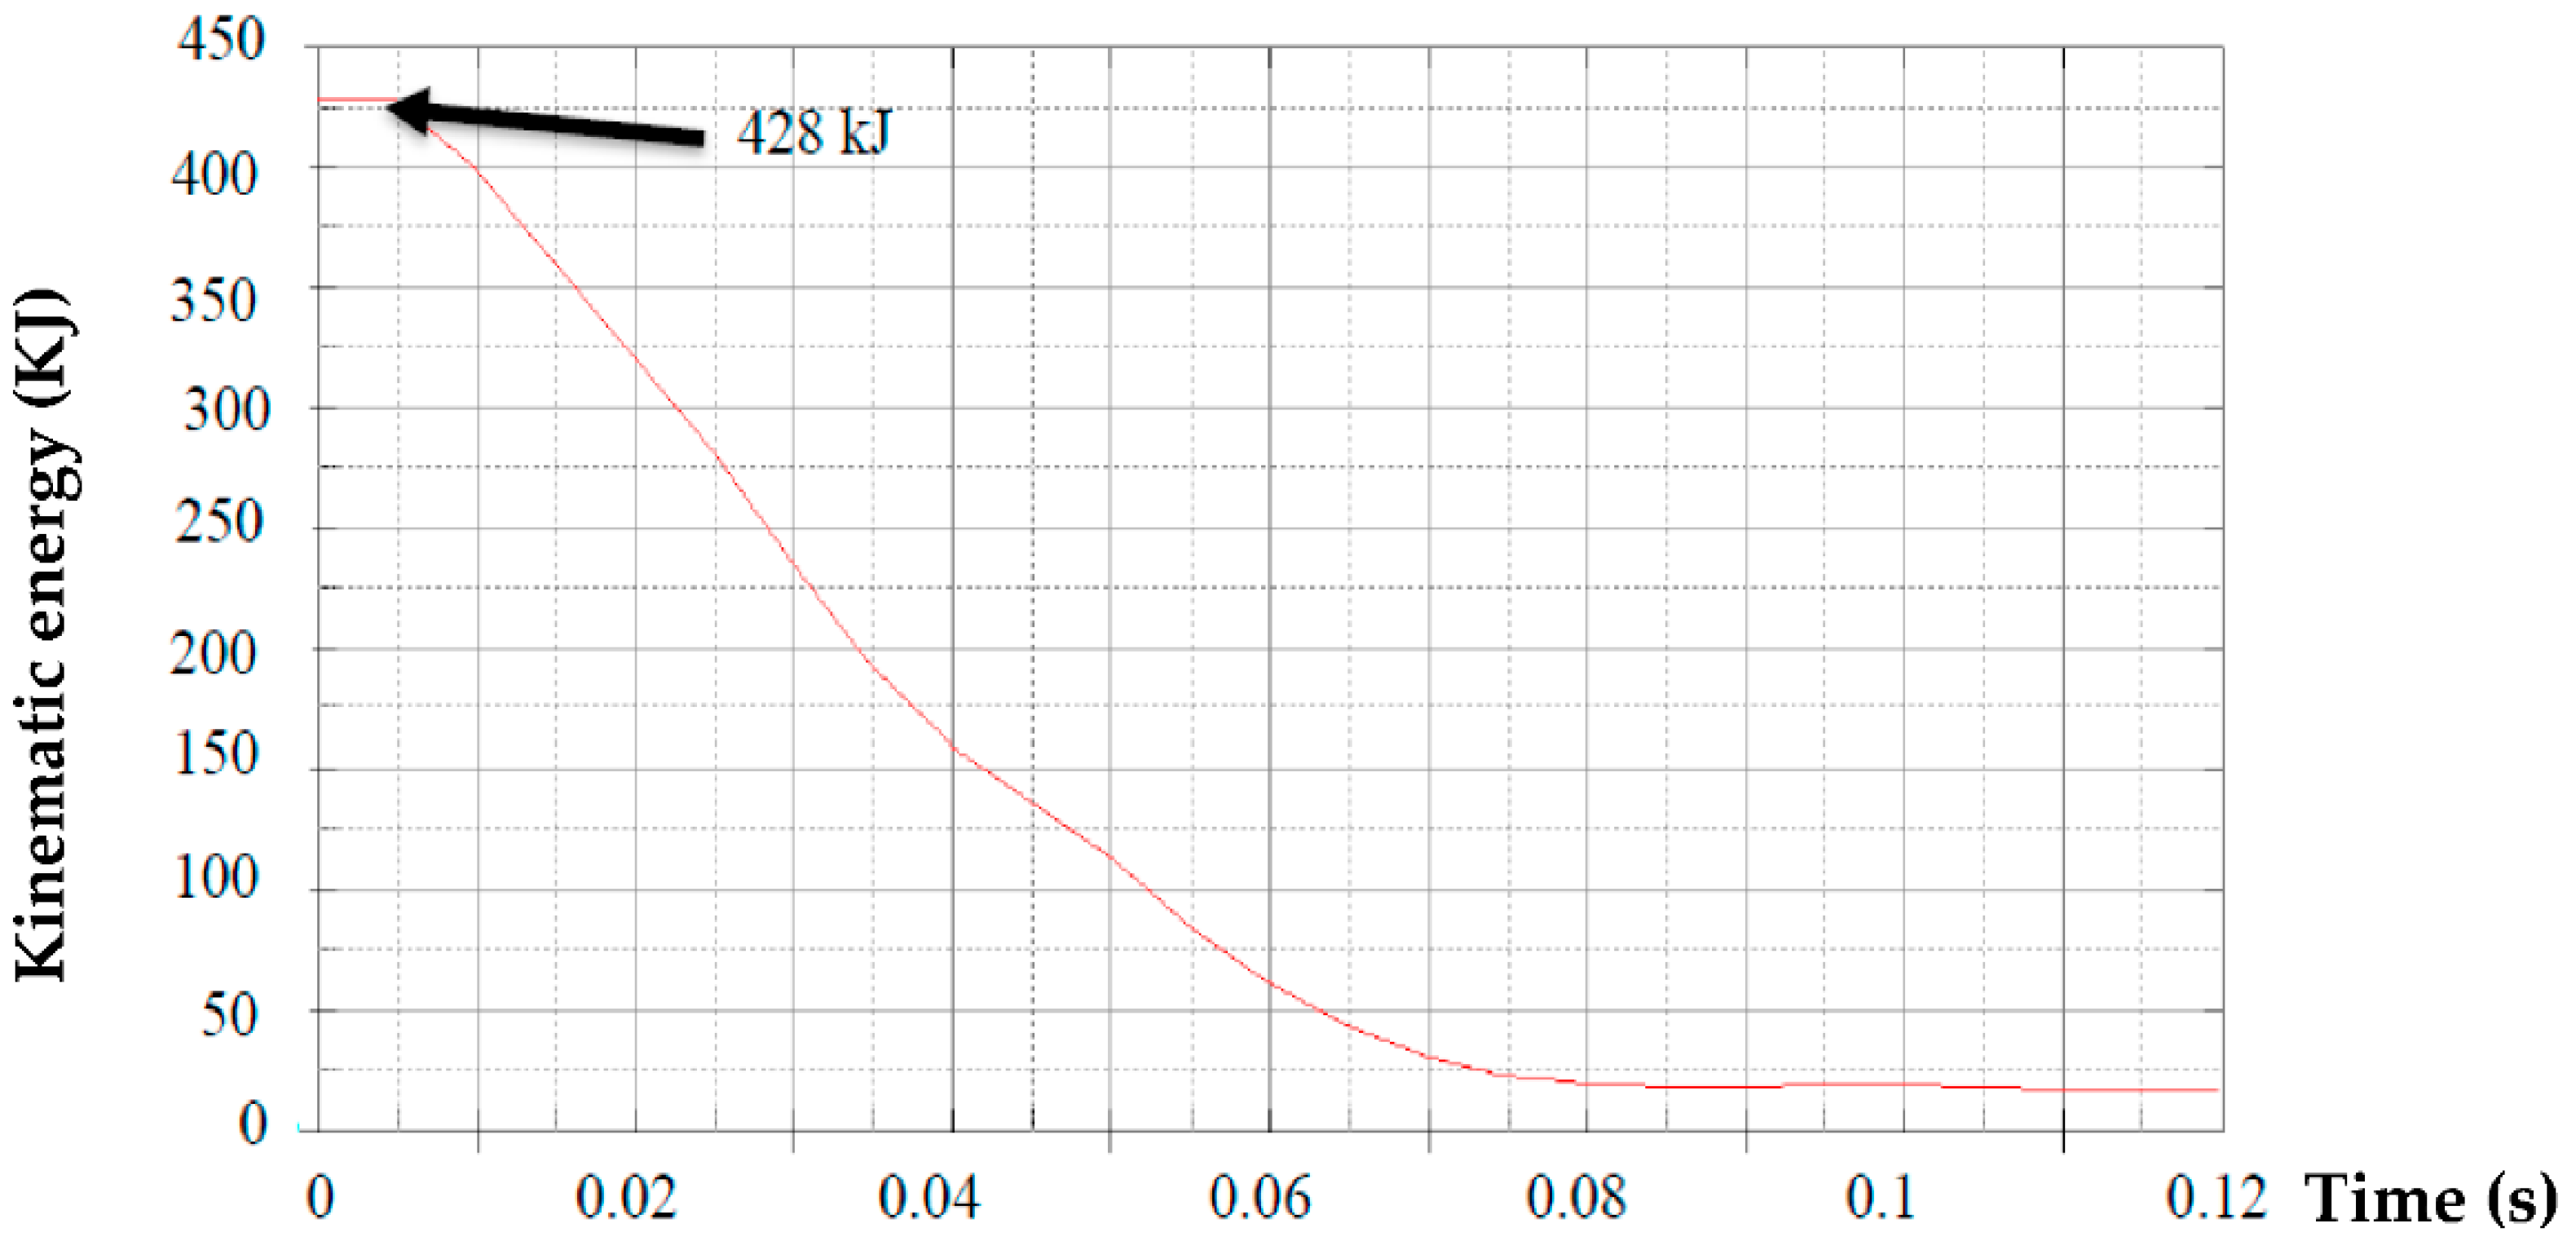
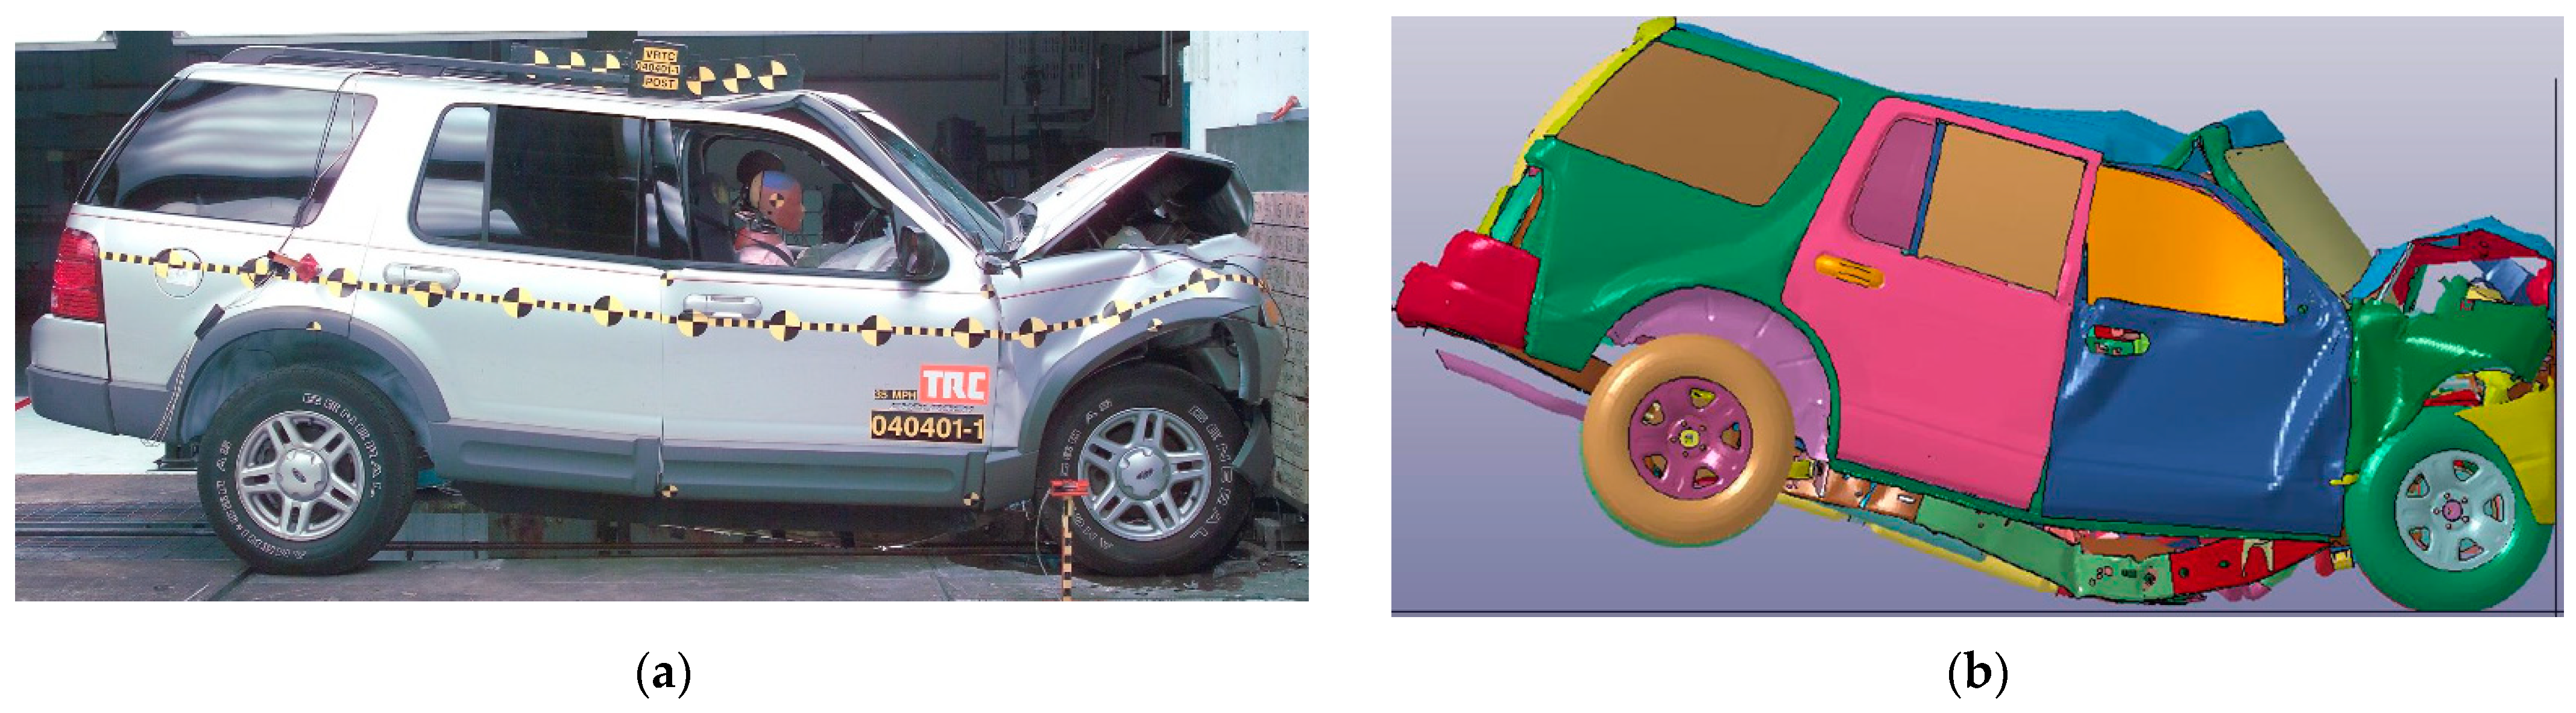
2.2. Impact Analysis of the SUV
2.3. Impact Analysis of the Dummy
3. Results
4. Discussion
5. Conclusions
Author Contributions
Funding
Data Availability Statement
Acknowledgments
Conflicts of Interest
References
- Portal Automotriz. Comercializa AMBA 675 Vehículos, Industria en General Vende 1050|PortalAutomotriz.com. Available online: https://www.portalautomotriz.com (accessed on 20 July 2021).
- Protecto. Protecto Glass International|México. Available online: https://www.blindajes.com.mx (accessed on 21 July 2021).
- Audi Producirá autos Blindados en Puebla. Available online: https://www.milenio.com/negocios/audi-producira-autos-blindados-en-puebla (accessed on 6 July 2021).
- Durán, J.A. Blindaje de Autos un Negocio Atractivo: Mercedes Benz. Available online: https://www.elfinanciero.com.mx/empresas/blindaje-de-autos-un-negocio-atractivo-mercedes-benz/ (accessed on 10 July 2021).
- Vicencio, A. La Industria Automotriz en México; Antecedentes, Situación Actual y Perspectivas, La Incidencia de la Calidad y la Productividad en la Competitividad de las Organizaciones: El caso de dos Empresas Automotrices en México. Ph.D. Thesis, Instituto Politécnico Nacional, Zapopan, México, 2009; pp. 1–38. [Google Scholar]
- Hryciów, Z.; Sławiński, G. Investigation of armoured personnel carrier crew subjected to impact load Investigation of Armoured Personnel Carrier Crew Subjected to Impact Load. AIP Conf. Proc. 2019, 2078, 020013. [Google Scholar]
- Kamel, H.; Harraz, O.; Yacoub, M.; Ali, A. Developing a custom Anthropomorphic Test Device for measuring blast effects on occupants inside armored vehicles. J. Eng. Sci. Mil. Technol. 2019, 3, 70–76. [Google Scholar] [CrossRef]
- Jouvencel, M.R.; Moreno, C. Latigazo cervical y colisiones a baja velocidad. Fisioterapia 2013, 26, 186. [Google Scholar] [CrossRef]
- Giancoli, C.D. Física, Principios con Aplicaciones, 6th ed.; Pearson: Mexico City, Mexico, 2006. [Google Scholar]
- ASIS. Materiales Balísticos y Sus Aplicaciones Para Áreas de Máxima Seguridad 1; Camara Mexicana de la Industria de la Construcción: Mexico City, Mexico, 2009. [Google Scholar]
- Eid, H.E.; Zidan-Abu, F.M. Biomechanics of road traffic collision injuries: A clinician’s perspective. Singap. Med. J. 2007, 48, 693–700. [Google Scholar]
- Onusic, H. HIC (head injury criterion) and SI (severity index) of impacts with different pulse shapes. Int. J. Veh. Des. 1995, 16, 194–202. [Google Scholar] [CrossRef]
- Cheng, G.; Cheng, R.; Pei, Y.; Xu, L.; Qi, W. Severity assessment of accidents involving roadside trees based on occupant injury analysis. PLoS ONE 2020, 15, e0231030. [Google Scholar] [CrossRef] [PubMed]
- Hollowell, W.T.; Gabler, H.C.; Stucki, S.L.; Summers, S.; Hackney, J.R. Updated review of potentential test procedures for FMVSS No. 208. NHTSA Docket 1999, 6407, 6. [Google Scholar]
- ECE16-05. Status of United Nations Regulation; OICA: Geneva, Switzerland, 1999; Available online: https://op.europa.eu/en/publication-detail/-/publication/d13b01c3-4962-478b-a710-215ee6dae2cb/language-en (accessed on 26 August 2021).
- Molina-Cortez, J.A. Diseño de Una Plataforma Móvil y un Sistema de Desaceleración para Pruebas de Seguridad Pasiva. Master’s Thesis, Instituto Politécnico Nacional, Mexico City, México, 2017. [Google Scholar]
- Prochowski, F.L.; Mateusz, S.; Ski, Z.Ń.; Miros, T. Experimental and Analytic Determining of Changes in Motor Cars’ Positions in Relation to Each Other During A Crash Test Carried Out to the FMVSS 214. In Proceedings of the 2018 XI International Science-Technical Conference Automotive Safety, Častá, Slovakia, 18–20 April 2018; pp. 2–6. [Google Scholar]
- García, A.O. Energía Disponible y Restitución Durante la Colisión; UBA: Buenos Aires, Argentina, 2006; pp. 2–3. [Google Scholar]
- Gordon, S.; Lemanski, P. Crash Test Facility Upgrade for NHTSA Oblique Test with Residual Energy Control and Advanced Barrier Force Measurement; SAE International: Warrendale, PA, USA, 2018; pp. 1–8. [Google Scholar] [CrossRef]
- Auto123. 2003 Ford Explorer|Specifications—Car Specs|Auto123. Available online: www.auto123.com/en/new-cars/technical-specs/ford/explorer/2003/base/xlt (accessed on 26 August 2021).
- Marzougui, D.; Samaha, R.R.; Tahan, F.; Cui, C. Extended Validation of the Finite Element Model for the 2002; NCAC: Ashburn, VA, USA, July 2012. [Google Scholar]
- Ly, H.A.; Thuong, P.; Nguyen, L.; Tran, D.N.; Nguyen, T.P. Reconstruction finite element model of cars. Sci. Technol. Dev. 2021, 4, 680–696. [Google Scholar]
- National Highway Traffic Safety Administration. Available online: https://www.nhtsa.gov/research-data/research-testing-databases#/vehicle/5034 (accessed on 16 September 2021).
- Glass, I. Blindaje Antibalas—Iron Glass. Available online: https://ironglassweb.com/antibalas/ (accessed on 2 February 2022).
- Díaz Hernández, D.R. Caracterización del Acero Utilizado en la Carrocería con Protección Pasiva de los Vehículos Blindados PANHARD AML-90 del CICTE. Master’s Thesis, Universitaria San Mateo, Bogotá, Colombia, 2014; p. 11. [Google Scholar]
- Chandran, S.; Verleysen, P. Crashworthiness assessment considering the dynamic damage and failure of a dual-phase automotive steel. In Proceedings of the DYMAT Winter School 2020—Experimental Testing and Modelling of Materials at High-Strain Rates, Les Houches, France, 9–14 February 2020; pp. 186–191. [Google Scholar]
- Büyük, M.; Atahan, A.O. Impact Performance Evaluation of a Crash Cushion Design Using Finite Element Simulation and Full-Scale Crash Testing. Safety 2018, 4, 48. [Google Scholar] [CrossRef] [Green Version]
- Rodríguez, J.I. Cómo Sentarse y Regular el Asiento, el Volante y los Espejos; La Mejor Postura, Ed.; Conducir Mejor: Mexico City, Mexico, 2000; pp. 8–9. [Google Scholar]
- McHenry, B. Head Injury Criterion and the ATB, ATB Users’ Gr., No. pp. 1–8. Available online: http://www.mchenrysoftware.com (accessed on 16 September 2021).
- Summers, S.; Prasad, A. Nhtsa’ S Recent Compatibility Test Program Abstract. In Proceedings of the Nineteenth International Conference on Enhanced Safety of Vehicles, Washington, DC, USA, 6–9 June 2005; Volume 5, pp. 1–15. [Google Scholar]
- Shorten, M.R.; Himmelsbach, J. Sports Surfaces and the Risk of Traumatic Brain Injury; Sports Surf: Calgary, AB, Canada, 2003; pp. 49–69. Available online: https://citeseerx.ist.psu.edu/viewdoc/download?doi=10.1.1.610.8529&rep=rep1&type=pdf (accessed on 26 August 2021).
- Zurich, M.; Shojaati, E.T.H. Correlation between injury risk and impact severity indez ASI. In Proceedings of the 3rd Swiss Transport Research Conference, Swiss, Ascona, Switzerland, 19–21 March 2003; pp. 19–21. [Google Scholar]
- Ren, Z.; Vesenjak, M. Computational and experimental crash analysis of the road safety barrier. Eng. Fail. Anal. 2005, 12, 963–973. [Google Scholar] [CrossRef]


| Material Properties | Ballistic Steel AML-90 | Laminated Glass |
|---|---|---|
| Thickness (mm) | 3.175 | 38 |
| Density (kg/m3) | 7850 | Glass = 2500 |
| Yield strength (MPa) | 1265 | 98 |
| Ultimate tensile strength (MPa) | 1337.1 | 98.2 |
| Part | Amount | Original Mass (kg) | Armoring Mass (kg) |
|---|---|---|---|
| Front door (A) | 2 | 11.75 | 39.2 |
| Back door (B) | 2 | 10.14 | 34.91 |
| Rear fender (C) | 2 | 3.29 | 16.19 |
| Rear window frame (D) | 2 | 1.36 | 5.7 |
| Door frame (E) | 2 | 4.49 | 19.51 |
| Upper front post (F) | 2 | 1.34 | 4.91 |
| Lower front post (G) | 2 | 3.11 | 10.72 |
| Door divider post (H) | 2 | 3.87 | 12.92 |
| Trunk (I) | 1 | 3.61 | 30.82 |
| Awning (J) | 1 | 20.28 | 91.86 |
| Firewall (K) | 1 | 3.35 | 22.71 |
| Lateral firewall (L) | 2 | 1.99 | 7.21 |
| Front floor (M) | 1 | 13.6 | 58.5 |
| Central floor (N) | 1 | 11.75 | 47.03 |
| Back floor (O) | 1 | 8.07 | 39.21 |
| Floor lower part of the door (P) | 2 | 4.31 | 14.68 |
| Front window (Q) | 2 | 3.73 | 35.73 |
| Back window (R) | 2 | 2.93 | 28.41 |
| Rear wing (S) | 2 | 0.93 | 8.94 |
| Windshield (T) | 1 | 11.32 | 105.69 |
| Trunk window (U) | 2 | 3.61 | 34.63 |
| Rear window (V) | 1 | 9.15 | 85.44 |
| Front side window | 2 | 3.73 | 35.73 |
| Passenger side window | 2 | 2.93 | 28.41 |
| Side mirrors | 2 | 0.93 | 8.94 |
| Windshield | 1 | 11.32 | 105.69 |
| Rear side window | 2 | 3.61 | 34.63 |
| Rear window | 1 | 9.15 | 85.44 |
| Armored Vehicle | Vehicle without Armoring |
|---|---|
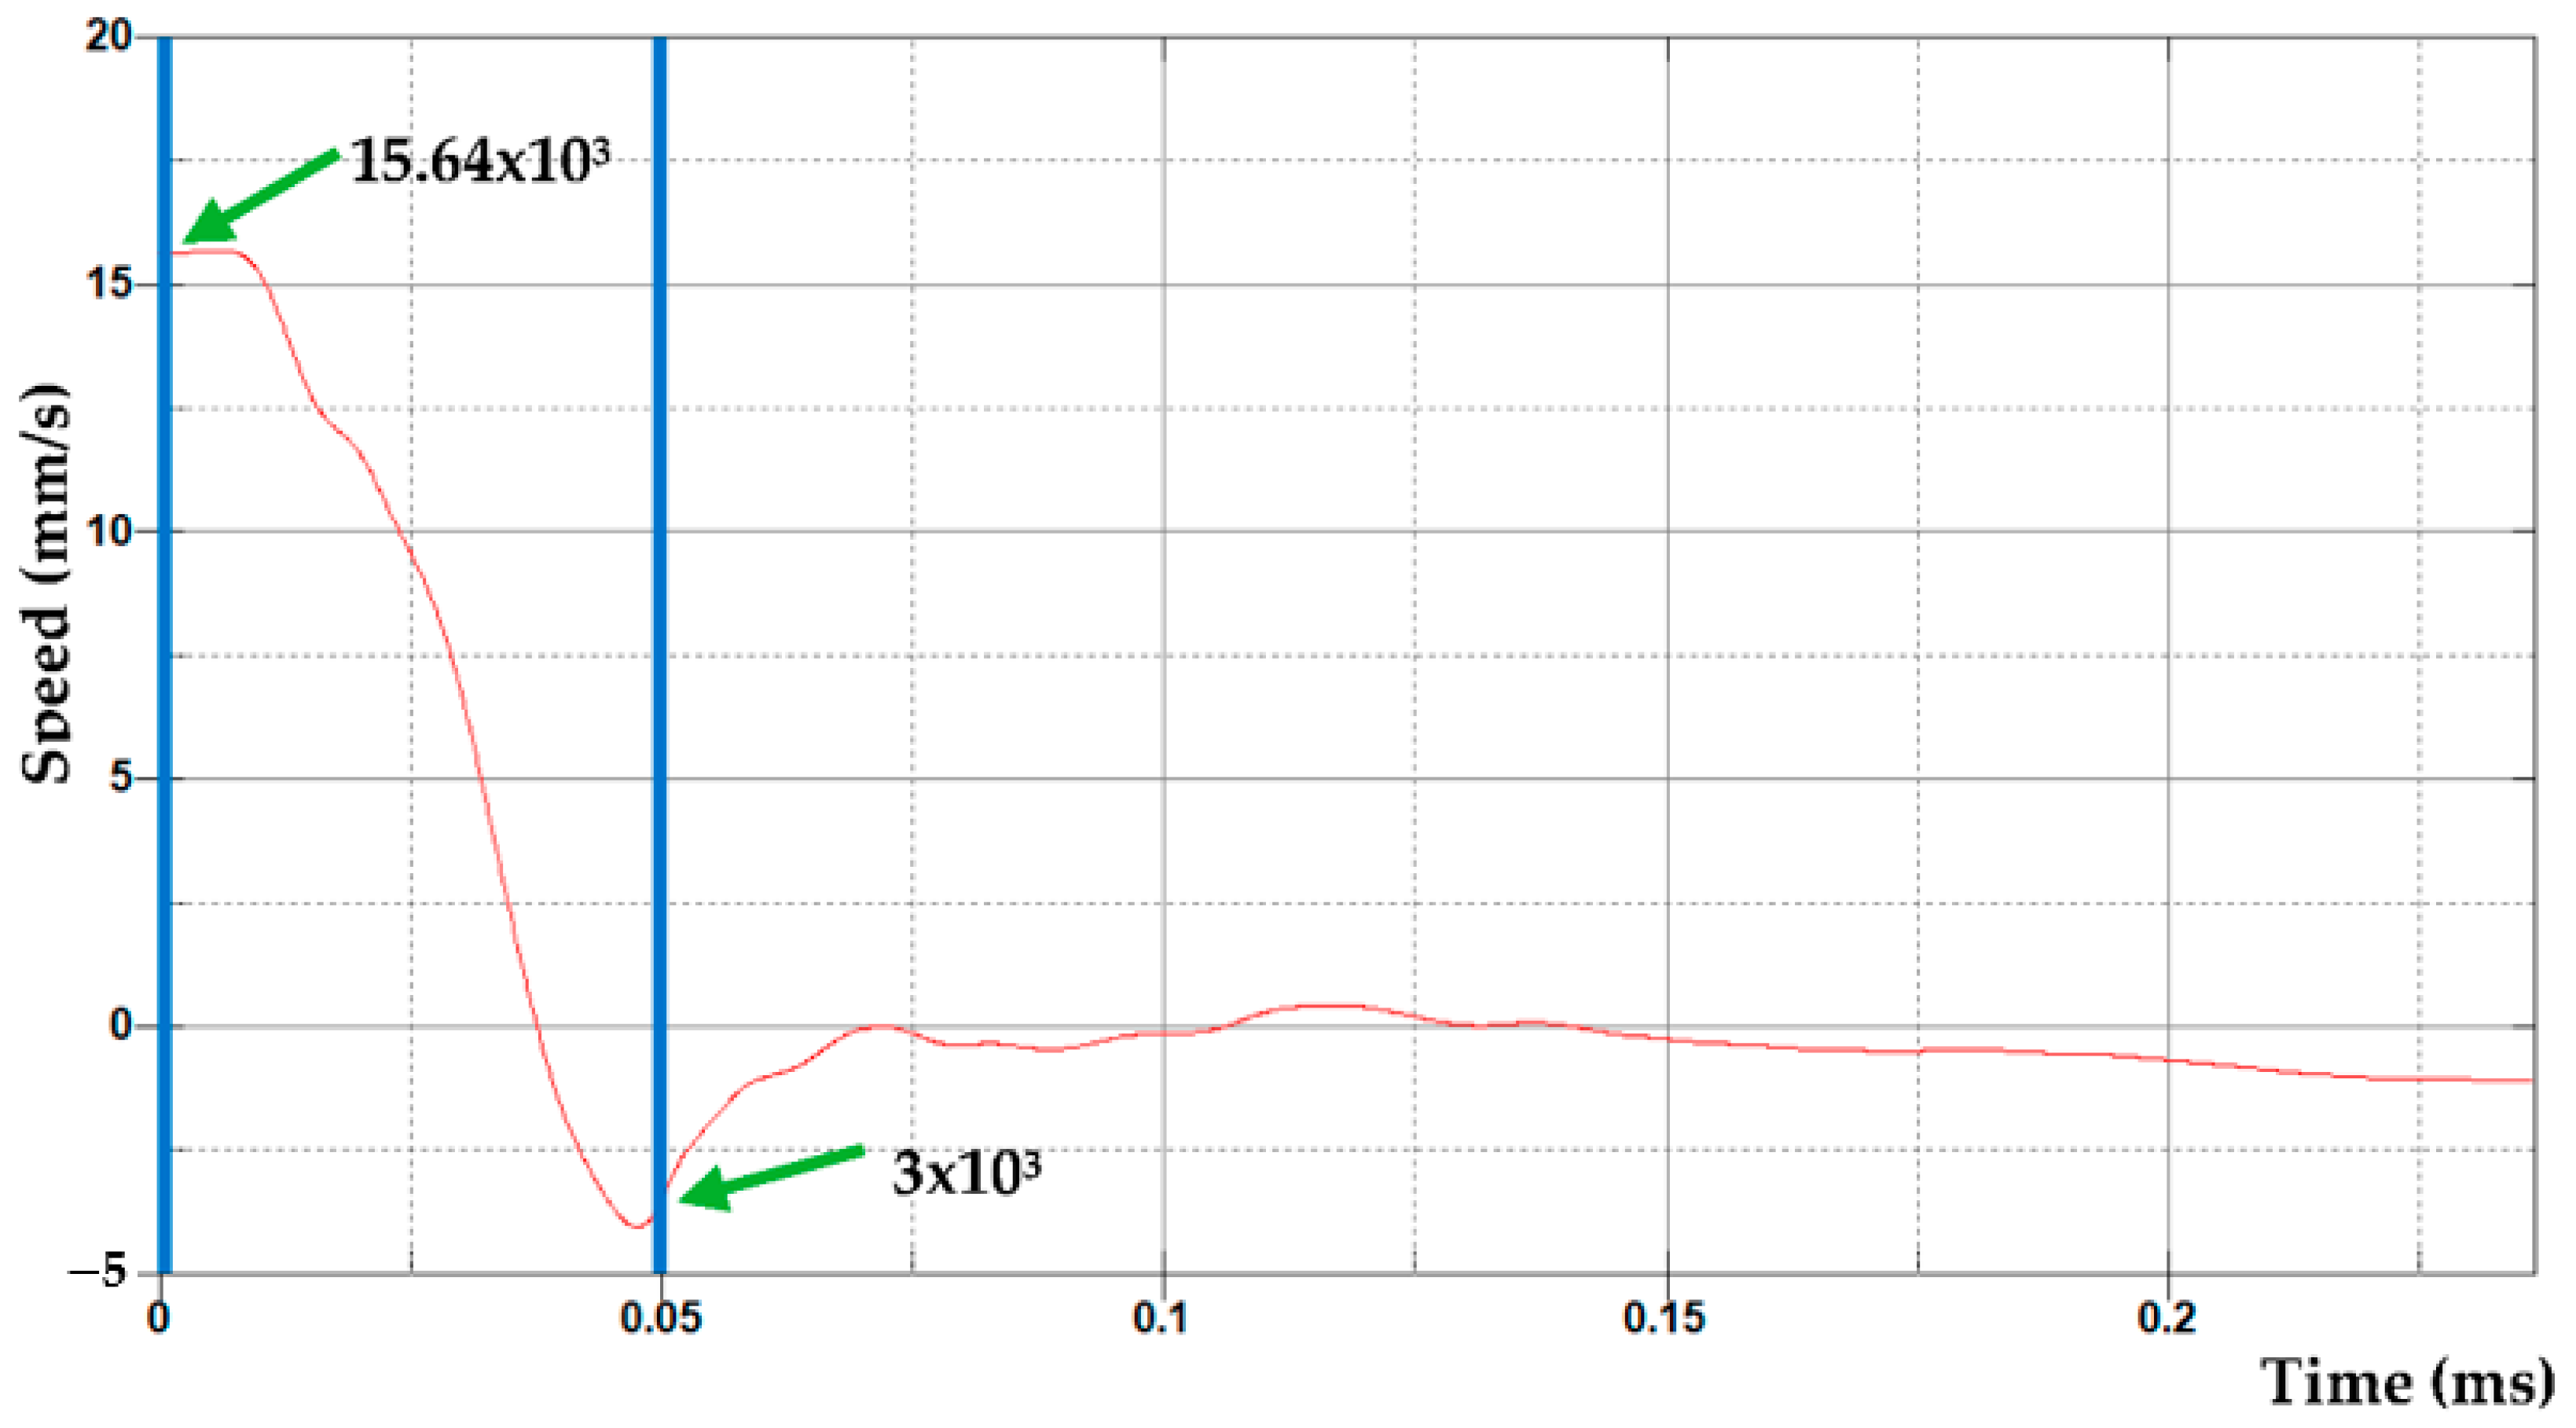
| Ek = 1/2 (3508) (15.64)2 | Ek = 1/2 (2253) (15.64)2 |
| Ek = 429 × 103 J | Ek = 307 × 103 J |
| Time | Collision Simulation from 0 to 120 ms of the Explorer 2002—without Armoring | Collision Simulation from 0 to 120 ms of the Explorer 2002—Armored | Time | Collision Simulation from 0 to 120 ms of the Explorer 2002—without Armoring | Collision Simulation from 0 to 120 ms of the Explorer 2002—Armored |
|---|---|---|---|---|---|
| 0 ms |  |  | 70 ms |  |  |
| 10 ms |  | 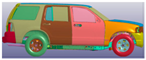 | 80 ms |  | 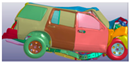 |
| 20 ms | 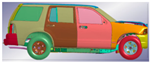 | 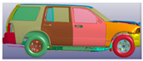 | 90 ms |  |  |
| 30 ms |  | 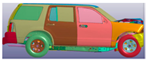 | 100 ms | 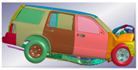 | 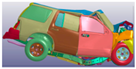 |
| 40 ms |  | 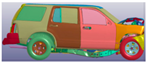 | 110 ms |  | 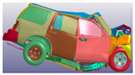 |
| 50 ms | 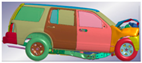 |  | 120 ms | 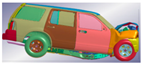 | 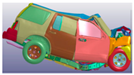 |
| 60 ms | 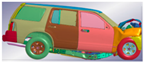 | 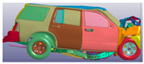 |
| Time | Impact Simulation of the Dummy | Time | Impact Simulation of the Dummy |
|---|---|---|---|
| 0–40 ms | 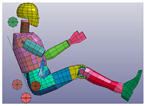 | 50 ms | 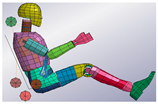 |
| 60 ms | 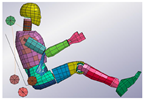 | 70 ms |  |
| 80 ms | 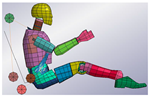 | 90 ms |  |
| 100 ms |  | 110 ms |  |
| 120 ms |  |
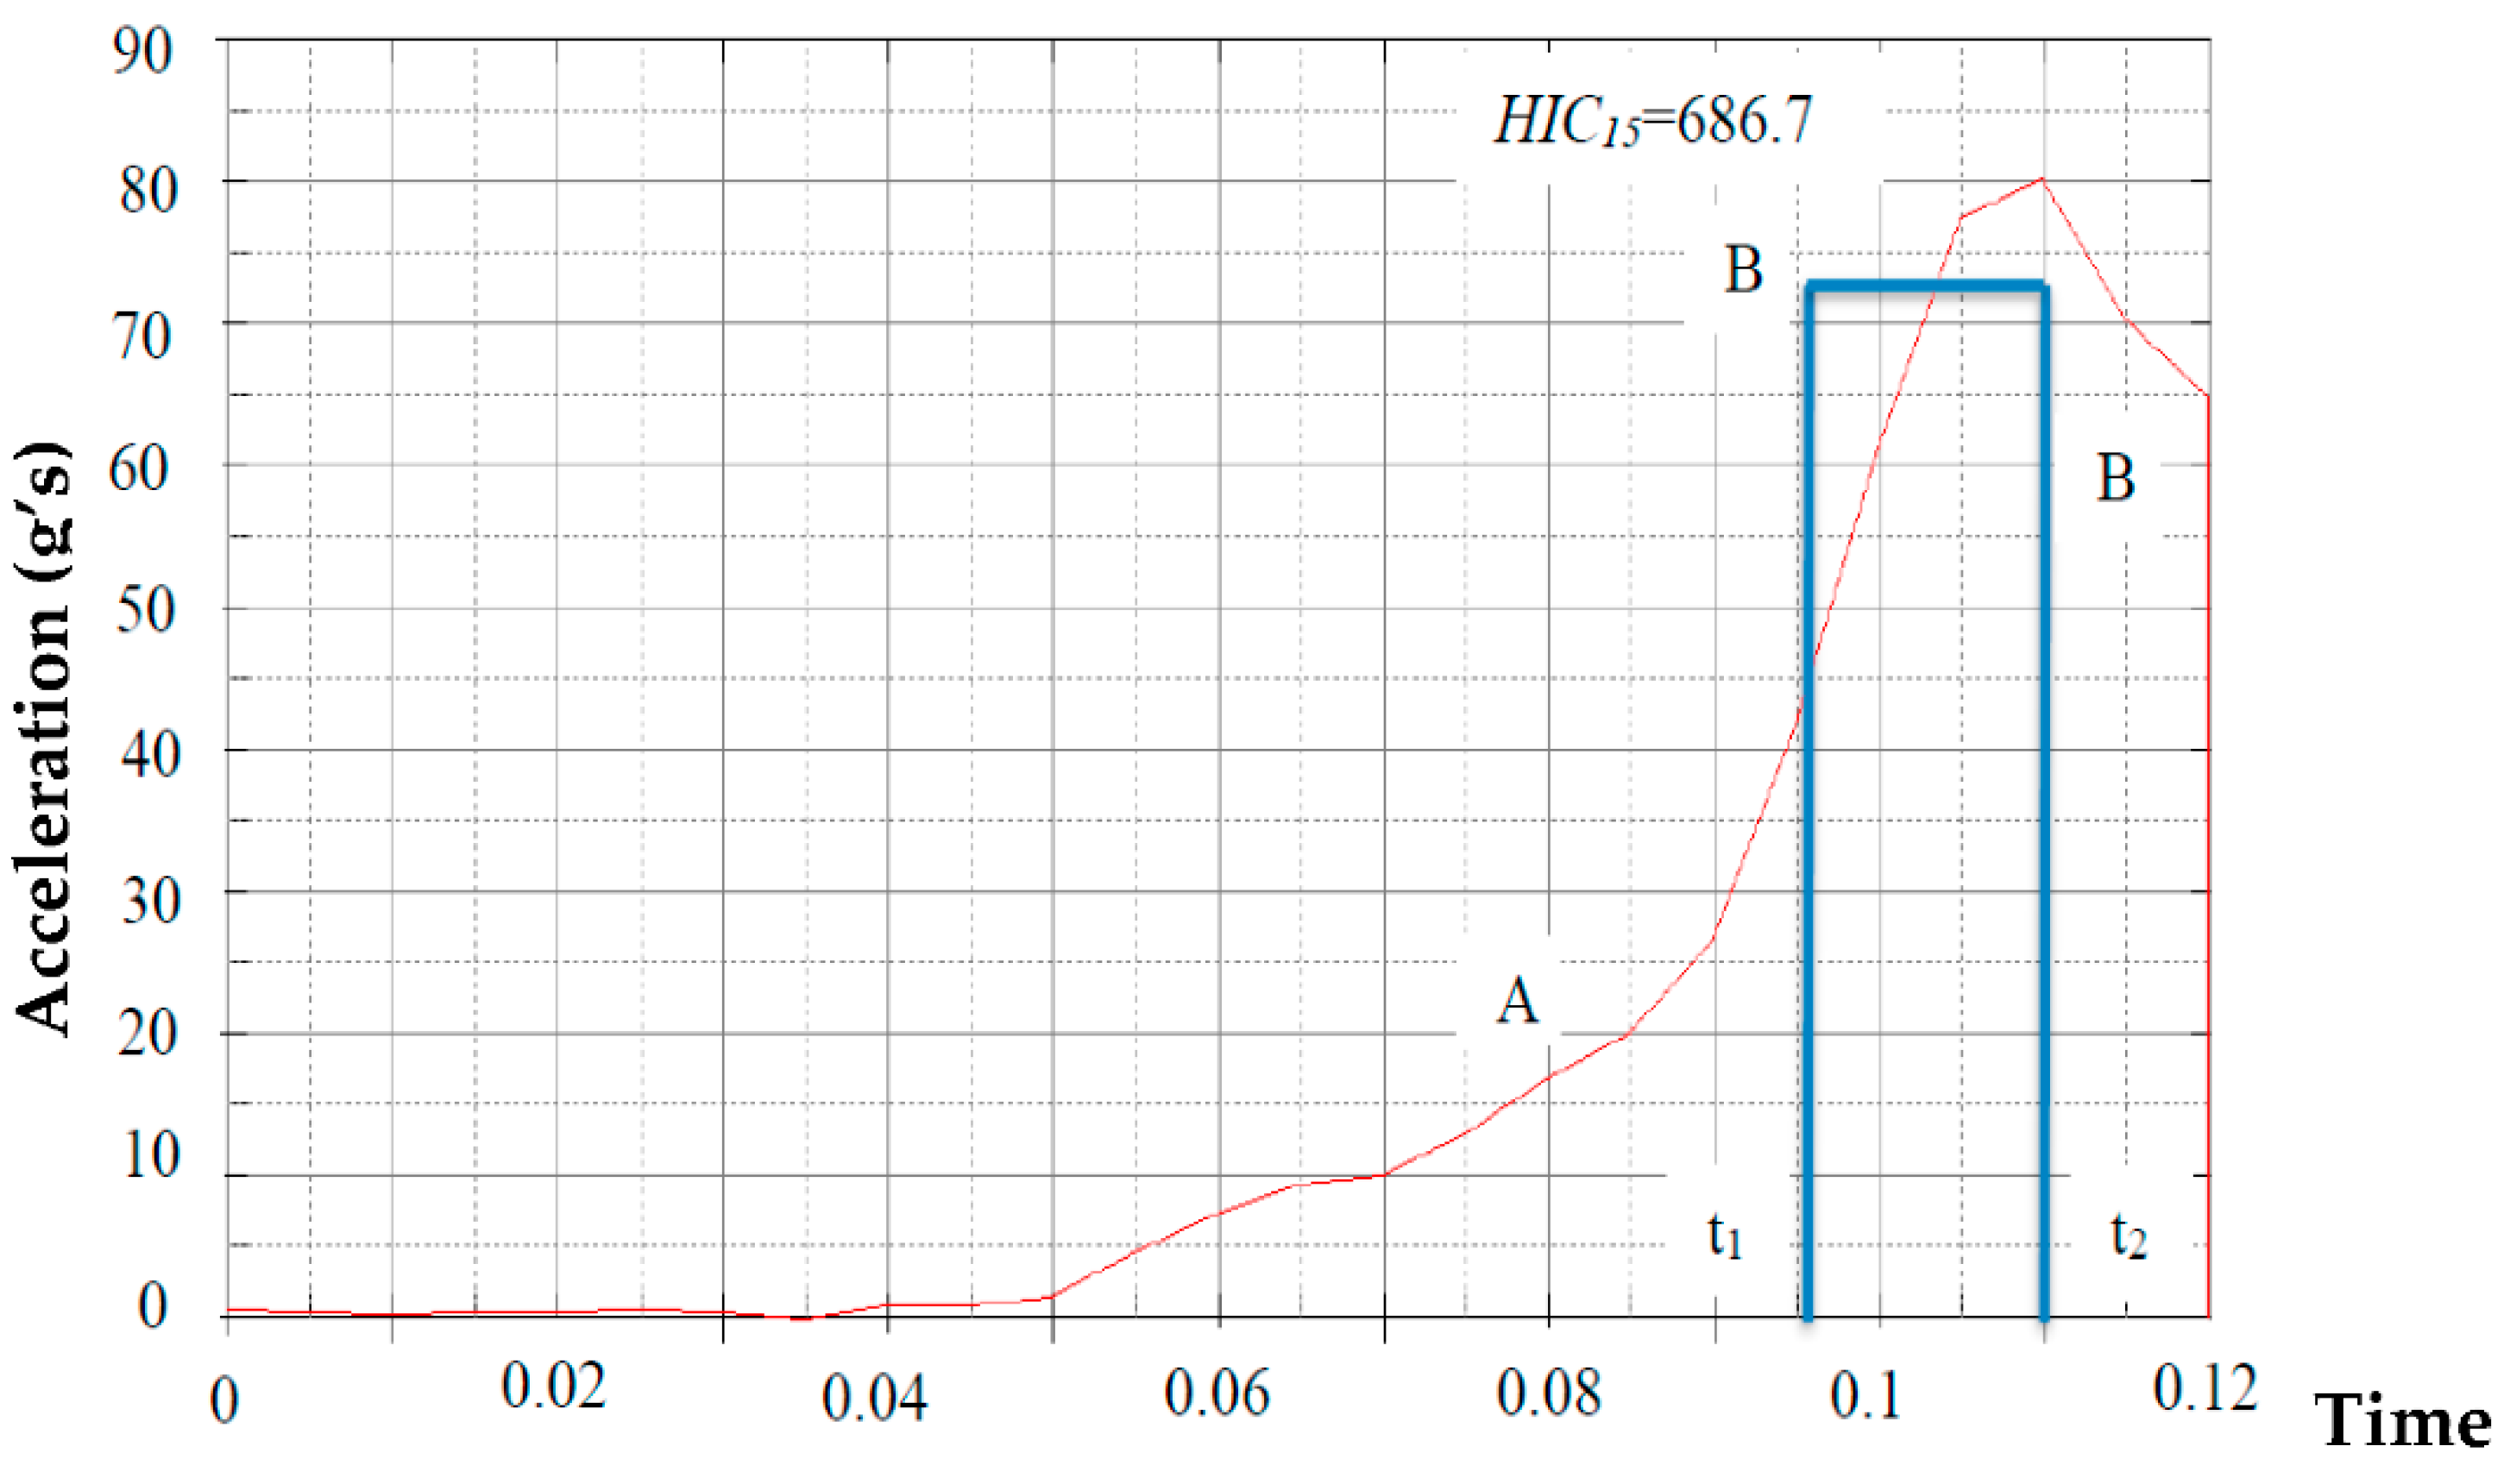
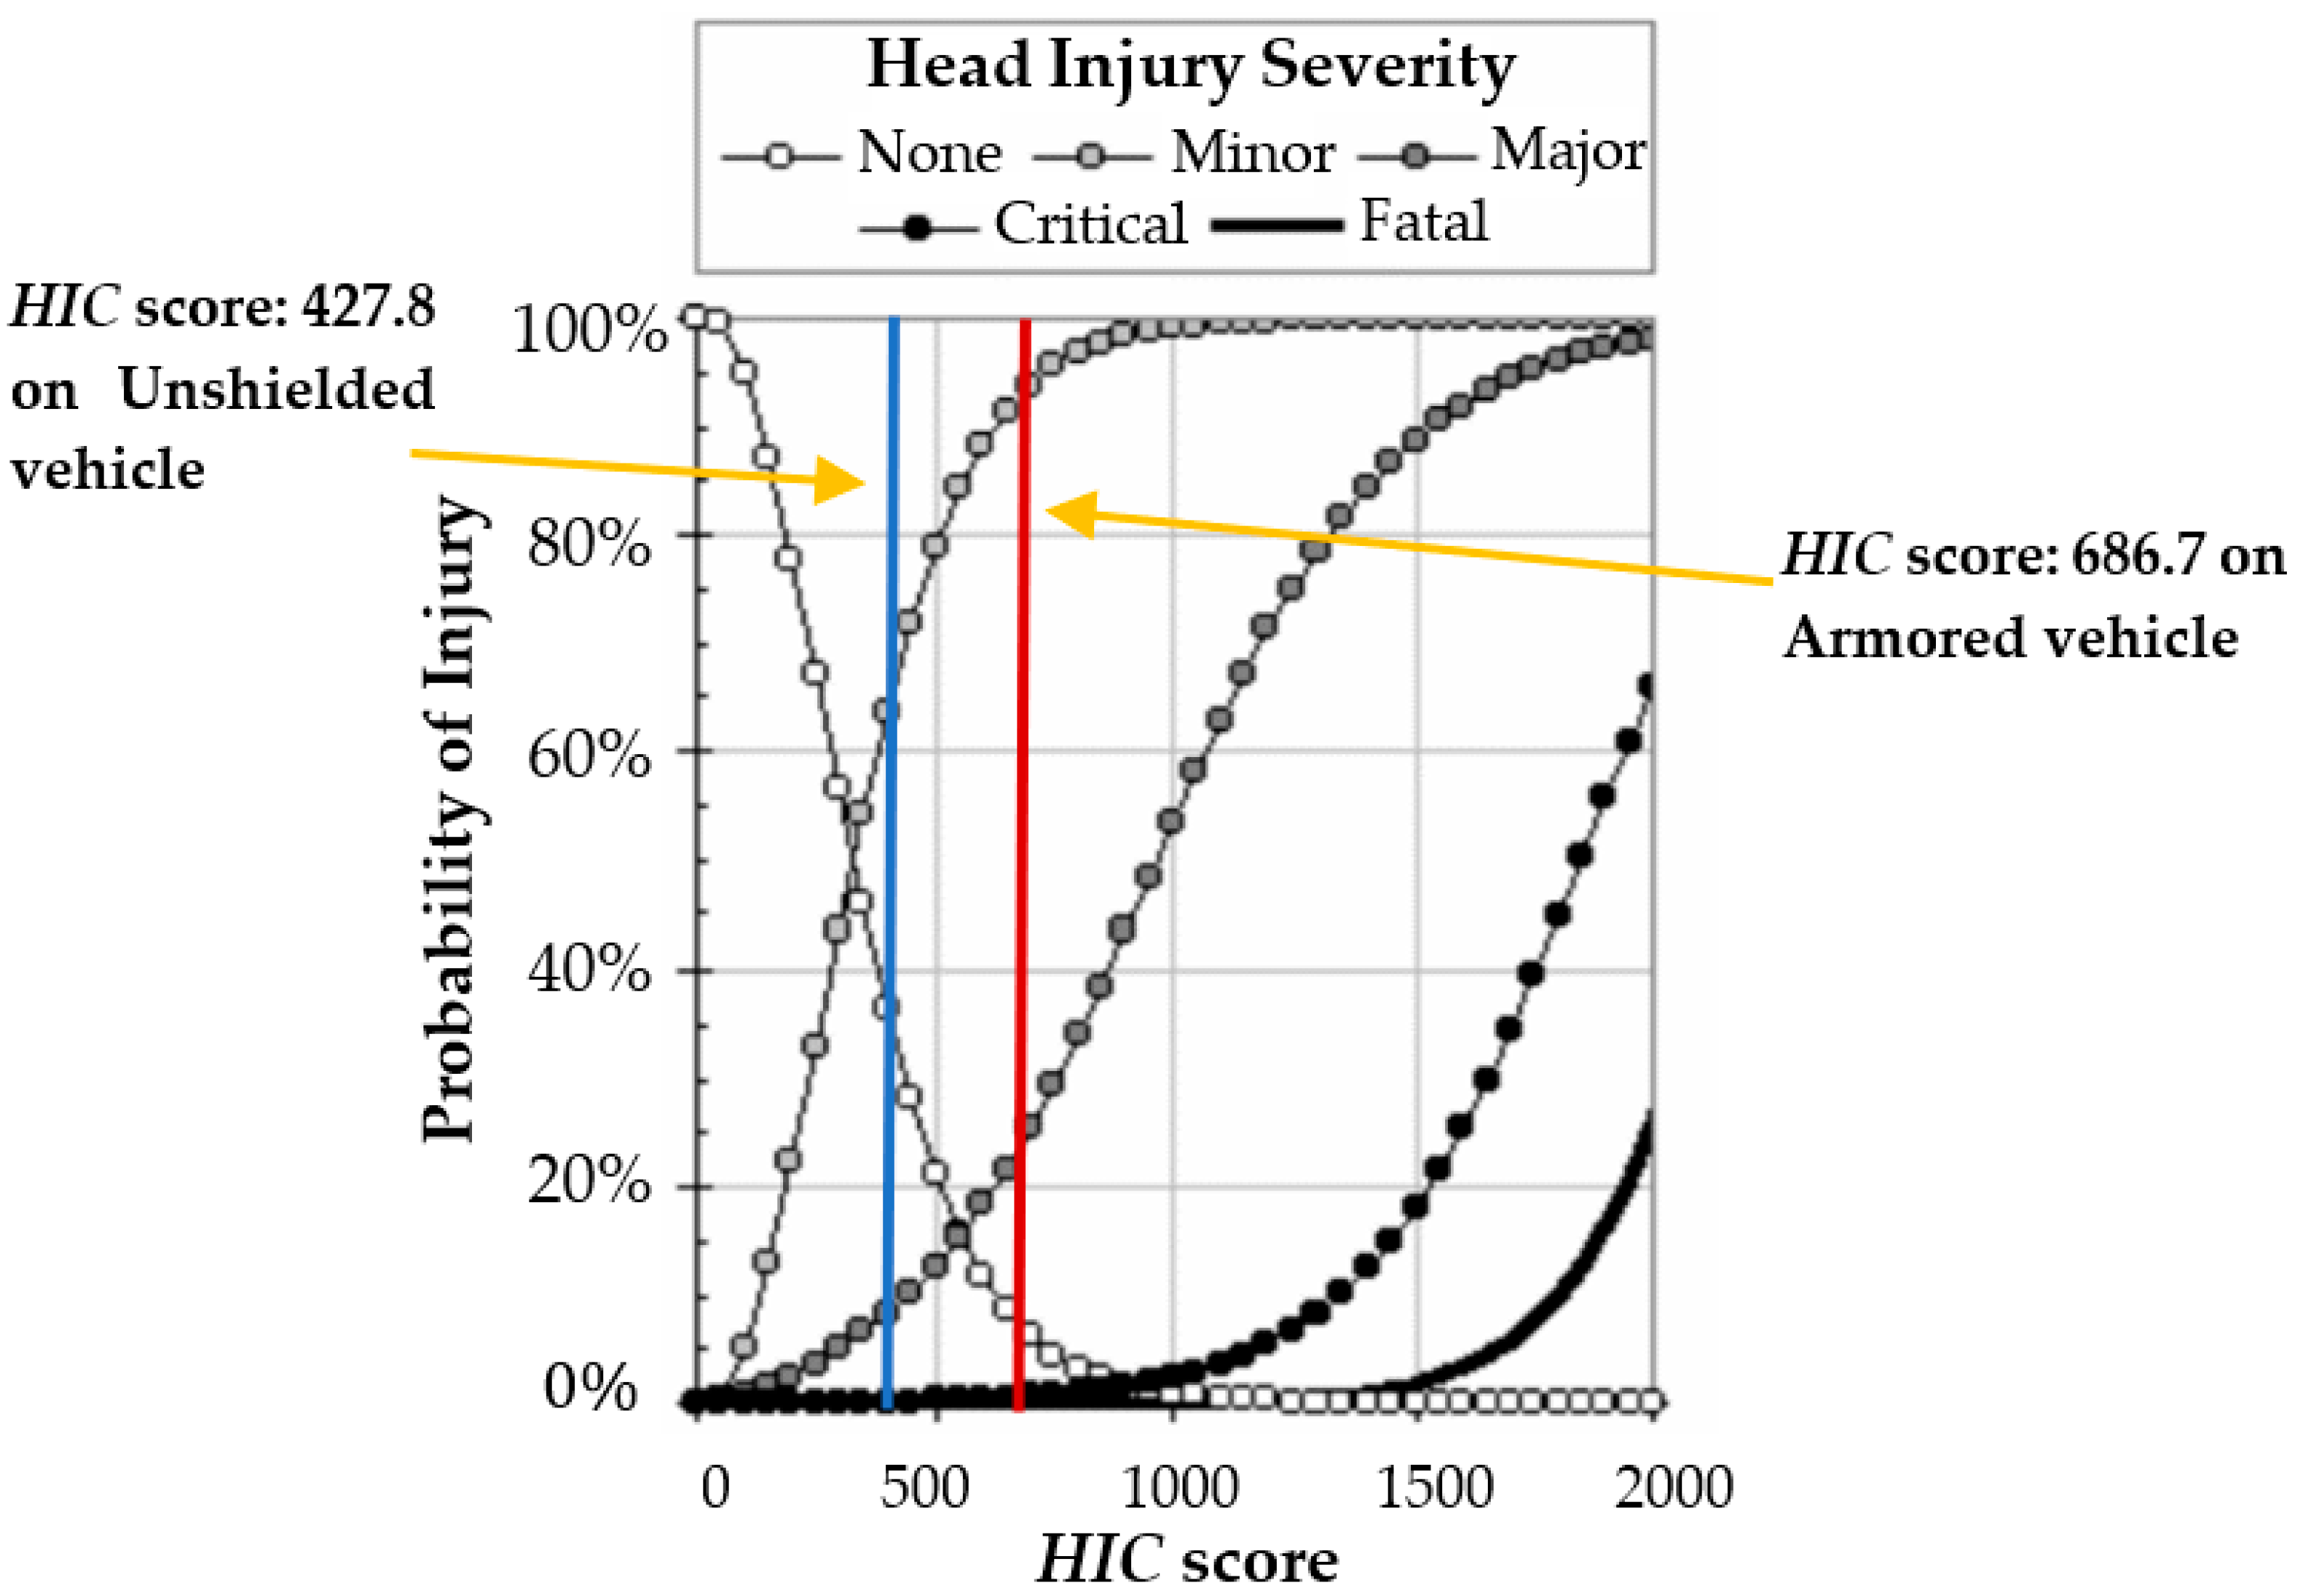
| HIC Score | 427.8 Unshielded SUV | 686.7 Armored SUV |
|---|---|---|
| None—injury probability | 37% | 8% |
| Minor—injury probability | 64% | 93% |
| Major—injury probability | 9% | 24% |
| Critical—injury probability | 0% | 0% |
| Fatal—injury probability | 0% | 0% |
| Class | ASI Level | Injuries |
|---|---|---|
| A | ≤1.0 | Minor injuries |
| B | ≤1.4 | Fractures and short-term memory loss |
| C | ≤1.9 | Lethal |
Publisher’s Note: MDPI stays neutral with regard to jurisdictional claims in published maps and institutional affiliations. |
© 2022 by the authors. Licensee MDPI, Basel, Switzerland. This article is an open access article distributed under the terms and conditions of the Creative Commons Attribution (CC BY) license (https://creativecommons.org/licenses/by/4.0/).
Share and Cite
Islas-Lara, E.; Torres-SanMiguel, C.R.; Paredes-Rojas, J.C.; Cuautle-Estrada, A.; De La Cruz-Alejo, C.; Urriolagoitia-Calderón, G.M. Assessment of Retention System Effects of Level III Armored Vehicles. Energies 2022, 15, 2247. https://doi.org/10.3390/en15062247
Islas-Lara E, Torres-SanMiguel CR, Paredes-Rojas JC, Cuautle-Estrada A, De La Cruz-Alejo C, Urriolagoitia-Calderón GM. Assessment of Retention System Effects of Level III Armored Vehicles. Energies. 2022; 15(6):2247. https://doi.org/10.3390/en15062247
Chicago/Turabian StyleIslas-Lara, Erick, Christopher René Torres-SanMiguel, Juan Carlos Paredes-Rojas, Alejandro Cuautle-Estrada, Carlos De La Cruz-Alejo, and Guillermo Manuel Urriolagoitia-Calderón. 2022. "Assessment of Retention System Effects of Level III Armored Vehicles" Energies 15, no. 6: 2247. https://doi.org/10.3390/en15062247