Article

Collaborative Charging Scheduling of Hybrid Vehicles in Wireless Rechargeable Sensor Networks

1
College of Physics and Mechanical & Electrical Engineering, Longyan University, Longyan 364000, China
2
Department of Computer Science and Information Engineering, Chung Hua University, Hsinchu 30012, Taiwan
*
Author to whom correspondence should be addressed.
Energies 2022, 15(6), 2256; https://doi.org/10.3390/en15062256
Submission received: 11 February 2022 / Revised: 8 March 2022 / Accepted: 18 March 2022 / Published: 19 March 2022
(This article belongs to the Special Issue Wireless Rechargeable Sensor Networks 2020-2022)

Abstract

:
Wireless rechargeable sensor networks (WRSN) are utilized in environmental monitoring, traffic video surveillance, medical services, etc. In most existing schemes, WRSNs provide sustainable energy for sensor nodes by employing one or more wireless charging vehicles (WCVs). However, two essential drawbacks, regional limitations and traveling speed limitations, constrain these schemes when applied in hostile and large-scale environments. On the other hand, benefiting from the intrinsic flexibility, high flight speed, low cost, and small size of drones, some works have used drones to charge sensor nodes. However, suffering from limited battery capacities, it is also hard to only use drones in large-scale WRSNs. To overcome the drawbacks of WCVs and drones, we proposed a novelty wireless charging system that deploys WCV, WCV-carried drones, and wireless charging pads (pads) in a large-scale wireless sensor network. Based on this new wireless charging system, we first formulated a pad deployment problem for minimizing the total number of pads subject to each sensor in the pad region that only can be charged by drones. In this work, three near-optimal algorithms, i.e., greedy, K-mean, and static, for the pad deployment problem are proposed. Then, to form a sustainable WRSN, we elucidated the collaborative charging scheduling problem with the deadlines of sensors. To guarantee the maximum number of sensors to be charged before the deadlines, we also presented an approximation algorithm to find the collaborative charging scheduling of WCV and WCV-carried drones with the help of pads based on the three deployment pad schemes. Through extensive simulations, we demonstrate the effectiveness of the proposed deployment pad schemes. and that the number of pads obtained by the greedy and K-mean scheme was generally lower than that of the static scheme with respect to network density, WCV region, and flight range. Then, we also examined the proposed collaborative charging scheduling scheme by extensive simulations. The results were compared and showed the effectiveness of the proposed schemes in terms of lifetime, the percentage of nodes being charged in time, the average move time of drones, the percentage of nodes being charged late by the drones, and the charge efficiency of all vehicles under different traffic loads. Related statistical analyses showed that the percentage of nodes being charged in time and the percentage of nodes being charged late based on the greedy and K-mean schemes were slightly better than those of the static scheme, but the charge efficiency of drones of the static scheme was significantly superior to that of the K-mean scheme under a busy network.

1. Introduction

As a key technology in the Internet of Things, wireless sensor networks (WSNs) play an important role in many fields, such as continuous environmental monitoring and traffic video surveillance applications [1,2]. Sensor nodes are usually powered by limited-capacity batteries; therefore, energy is a crucial problem in WSN. Many works to prolong the lifetime of WSN have been based on balancing power consumption [3], mobile sensors [4,5], multiple routes [6], mobile sinks [7,8], and multiple sinks [9,10,11].
For providing sustainable energy for sensors, wireless rechargeable sensor networks (WRSN) are equipped with wireless chargers to charge the sensors by wireless power transfer. However, sensor networks deployed in hostile and inapproachable environments, such as those for analyzing precipitation in mountain areas [12] and supervising water quality [13], may have increased costs of deployment and maintenance of static or dynamic wireless chargers. Some works have used radio and energy management [14] in harvesting energy from the environment in renewable energy-powered wireless networks. However, in many sensing fields, including monitoring the structure of bridges [15] and soil quality [16], it is hard to harvest solar and wind energy.
Sensors can be charged by a wireless charger embedded in a drone [17,18,19] or be carried by a wireless charging vehicle (WCV) [20,21,22,23] that can store the energy as part of its capacity. By carrying a high-capacity battery, WCVs can charge a set of sensors during one charging trip in an accessible region. However, in inaccessible regions, some researchers have explored the practicability of charging sensors with drones. Drones carrying dedicated chargers can fly over a WRSN region and charge sensors. WRSNs with a wireless charging system using drones can sustainably provide energy for sensors deployed in hostile areas.
However, due to the limited battery capacity, the flight range of a drone is limited, which makes it difficult to replenish sensors deployed in a large area. It is worth studying how to apply charging drones efficiently.
Most existing works have studied WCV wireless charging [20,21,22,23] and drone-enabled wireless charging for WRSN [17,18] separately. Previous works that used WCV were limited to hazardous environments that included obstacles such as ravines, mountains, or lakes. These works also suffered due to the limited battery capacities of drones, so could not be applied to large-scale WRSNs.
Some works have used hybrid and electric vehicles in reality, such as existing hybrid bus systems and drones for sustainable WRSNs in the Xianlin Campus of NJUPT [17]. However, in some large and hostile areas, this kind of hybrid scheme still cannot satisfy all charging demands. Recently, the development of wireless charging pads (pads) has brought a new element to this kind of problem [24]. By using pads, a drone can not only charge itself by landing on pads, but also widen its range of charging services [24].
Thus, in this work, we propose a new charging system that uses one WCV, multiple drones, and several drone-assisting pads for WRSN in large and/or hostile areas. The WRSN and novel charging system together form a complicated network that includes sensors, a base station (BS), a WCV, a set of drones, and several pads. The introduction of pads to the proposed system can accelerate the energy replenishment of drones and extend the charging service range of drones. Meanwhile, the WCV-carried drones are close to the inaccessible region, which can not only reduce the flying energy consumption of drones, but also overcome terrain limitations.
An example of the proposed WRSN is illustrated in Figure 1. There is one WCV, a set of drones, and several pads deployed in the proposed charging system. The sensing region is divided into the WCV region and drone-pad region. In the WCV region, the WCV can move freely to charge the sensors or release drones. Additionally, the drones carried by the WCV start from BS and travel to the nearest releasing point in the WCV region to the target sensors when they have sufficient energy. In the drone-pad region, the drones charge sensors or fly to the deployed pads to replenish their energy. The pads can then charge the drones when the drones land on them. With the assistance of the pads, the drones obtain additional energy after launching from the WCV and fly to any target sensor with the help of the charging trip of WCV. Note that. after charging the requested sensor, the drone flies back to the nearest pad for energy replenishment. Hence, in this complicated network, the drones can obtain energy from BS or pads and consume energy when charging sensors or on their flight.
In the proposed system, the deployment of pads and the scheduling of vehicles (WCV and drones) determines the total charging efficiency of vehicles and the sustainability of WRSN. To the best of our knowledge, no ready-made pad deployment scheme or vehicle scheduling can be used for the new WRSN. However, WCV scheduling is constrained by terrain and the deadlines of sensors. In addition, drone scheduling is limited by the energy of drones and the deadlines of sensors charged by the drones. Consequently, it is very challenging to design optimal pad deployment schemes and scheduling of vehicles for sustainable charging of large WRSNs. Firstly, it is difficult to determine the optimal number and locations of pads because the associated problems are basically NP-hard. Secondly, it is almost impossible to find the optimal traveling route of WCV efficiently by solving the traveling salesman path and its variants that model the scheduling problem of WCV and is limited not only by terrain and the deadlines of sensors, but also by the releasing point of drones. It is also not easy to compute the optimal schedule of drones because the flight of drones is restricted by terrain, their energy, the deadline of sensors, and the locations of pads. More than that, the scheduling of drones must make sure that each flight segment meets the energy constraints of drones; that is, the remaining energy of drones at the beginning (a release point or a sensor) of the flight segment is not exceeding the consumed energy flying through the segment.
In this work, we first considered designing three pad-deployment schemes, i.e., modified K-mean, greedy, and static, constrained by the flight distance of drones so that the WCV-carried drones can be charged anywhere in time. The modified K-mean and greedy schemes deploy pads by designing efficient algorithms, while the third scheme (called the static scheme) works by placing pads according to the geometric properties of the pad region and the relationship between the drone-pad region and the WCV region. The main contributions of this work are summarized as follows:
  • We propose a novel charging system for WRSN that uses one WCV, a set of WCV-carried drones, and wireless charging in large and/or hostile areas. As far as we know, we are the first to explore the collaborative charging scheduling problem for the complicated wireless charging system.
  • We elaborate the problem of pad deployment to minimize the pad cost for charging all sensors considering the energy limitation of drones, locations of sensors, and terrain of the sensing region, and propose three near-optimal schemes to solve the problem.
  • Taking the nonstop sensing tasks of WRSN into account, we then elucidate the charging schedule problem to serve the maximum number of charged sensors under the limitations of both the energy of drones and the deadlines of sensors with the help of pads. Meanwhile, we design an approximation scheduling algorithm to solve the problem.
  • We also conduct extensive simulation for the proposed algorithms. The first part of the simulation results demonstrates that a greedy scheme can reduce the number of pads compared with the other two schemes. The second part of the simulation results shows that the scheduling of vehicles leads to better performance of the WRSN.
The rest of the paper is as follows: Section 2 describes the literature review. We present the proposed system model and discuss regional division in Section 3. Next, Section 4 formulates the pad deployment problem, designs three approximation schemes for it, and presents the vehicle scheduling problem and the approximation algorithm, followed by extensive simulations in Section 5. Finally, the conclusion of this work is provided in Section 6.

2. Related Work

The previous research on wireless charging for WRSN has mainly focused on using WCVs [20,21,22,23] or drones [17,18,19,25,26,27,28,29].
Extensive studies have paid attention to charging sensors by WCVs. Nguyen et al. [20] proposed a novel on-demand charging scheme named Fuzzy Q-charging, which uses Q-learning in its charging scheme to assure the target coverage and connectivity. In addition, their proposed scheme adjusts the energy level charged to the sensors dynamically according to the network condition. To minimize the network energy consumption, Zhong et al. [21] designed an energy-minimization path construction algorithm based on dual-function vehicles for data collection and wireless charging. Their proposed algorithm constructs a vehicle mobile path with anchors for collecting data and charging sensor nodes. Chawra et al. [22] proposed a novel algorithm for the scheduling of multiple mobile vehicles with a hybrid meta-heuristic technique that combines the best features of Cuckoo Search and the Genetic Algorithm to maximize the utility of energy and minimize the average charging delay. Li et al. [23] explored charging sensor nodes with non-deterministic mobility. Based on the network mechanism, they proposed Predicting–Scheduling–Tracking to perform the charging task.
With the development of a wireless charging drone, some studies have considered using the drone to charge sensors. In [18], Chen et al. considered using one drone to charge sensors with the help of pads. They proposed a new WRSN model that includes one drone, with several pads deployed to provide an available flight path for the drone. The proposed model solves charging issues effectively by overcoming the energy limitations of drones. Then, in [19], Chen et al. investigated the problem of introducing the minimal number of pads in unmanned aerial vehicle (UAV)-based WRSNs. They proposed a novel and adaptive pad deployment scheme that can adapt to arbitrary locations of the base station, arbitrary geographic distributions of sensor nodes, and arbitrary sizes of network areas. Wu et al. [25] applied multiple drones to charge sensors in a vast WRSN. They optimized the route association to maximize the total charging coverage utility. Wang et al. [26] focused on an UAV to charge multiple sensors. They optimized the trajectory of the UAV and scheduling of sensors to maximize the minimum energy received by all sensors. Wu et al. [27] studied the trajectory of the UAV optimization problem to maximize the energy utilization efficiency of the UAV. In [17], Jin et al. designed a novel wireless charging system that deploys bus network-assisted drones in urban areas, which is a new scheme that hybridizes the mobile vehicle and drones. Liang et al. [28] formulated a charging UAV deployment optimization problem to jointly increase the number of sensor nodes within the charging scopes of charging UAVs. Their solution improved the minimum charging efficiency in the network and reduced the motion energy consumption of charging UAVs. Lin et al. [29] addressed the application of UAV in a 3-D WRSN. They developed a spatial discretization scheme to construct a finite feasible set of charging spots for the UAV and a temporal discretization scheme to determine the appropriate charging duration for each charging spot.
This work is essentially different from the existing research. Based on a comprehensive network, our wireless charging system hybridizes different vehicles, including one WCV, multiple drones, and several pads. To the best of our knowledge, we are the first to consider this kind of hybrid charging problem. In order to overcome the battery limitation of a drone, we have it carried on the WCV and replenishing energy through pads. Next, we designed cooperative scheduling for the WCV and drones to charge more sensors before their deadlines. The comparison of using heterogeneous vehicles to charge sensors with related works is summarized in Table 1.

3. Preliminaries

3.1. System Model

We consider a novel hybrid WRSN consisting of one BS (located in the center), a set of sensor nodes, several pads, and one WCV, together with WCV-carried drones, as shown in Figure 1. The network assumptions are described as follows.
  • The sensing region is vast and complex, and the WCV can move freely in its safe middle area (the white area in Figure 1), but cannot access its surrounding hazardous area (the blue area in Figure 1). Therefore, the sensors located in the middle area are charged by the WCV, while those located in the surrounding area are only charged by the drones, assisted by the pads.
  • The BS is located in the center of the region and serves as a data sink and the service station of the WCV and drones. The WCV carrying several drones starts to charge sensors from BS along a predefined path. When the WCV reaches the release point, a drone is launched to charge the assigned sensors, assisted by the pads. After finishing the assignment, the WCV carried by drones returns to the BS, waiting for the next charging task.
  • The drones charge only one sensor at a time through direct flight. However, when their residual energy cannot take them to the next sensors or return them to a safe area, the drones need to fly to the nearest pads to replenish their energy.
  • The pads considered here are stationary and located in the given deployed region. These pads connect with the drones automatically and charge them wirelessly when the drones land on them. It is assumed that every pad only supports the landing of only one drone at one time.
The symbols and notations used throughout this work are listed in Table 2.

3.2. Region Division

This subsection presents an efficient and simple dividing scheme that divides the area of interest into two sub-regions: the WCV region and the drone-pad region.

3.2.1. WCV Region

In addition to the terrain constraint, the capacity of the WCV to support the range of its movement is a factor we considered for regional division. We can estimate the range of the WCV region according to the capacity of the WCV and the average estimated number of nodes with charging requests.
Therefore, firstly, according to the capacity of the WCV, we can estimate the total maximum moving distance of the WCV through Equation (1):
C t o t a l = e max _ w c v n max × ( e max _ s n e min _ s n ) p W C V
Suppose the deployed area of the WCV region can be covered by the smallest circle. The radius of the WCV region is defined as the radius of the circle. Then, we present a roughly mathematical model for estimating the radius of the WCV region. To understand the mathematical model, imagine that the WCV region is divided into roughly nmax equal-size cells. Each cell is approximately circular, with each sensor (including BS) as the center and equal radii, and, as shown in Figure 2, the radius r of each cell is approximately equal to Ctotal/(2 × (nmax + 1)). Therefore, the area of the WCV region is roughly estimated as (nmax + 1) × π r 2, and the radius of the WCV region can be roughly estimated with Equation (2):
R W C V = ( n max + 1 ) × π ( C t o t a l 2 ( n max + 1 ) ) 2 π = C t o t a l 2 n max + 1

3.2.2. Drone-Pad Region

The sensors located in the drone-pad region are only charged by drones carried by the WCV. For some sensors far away from the WCV region, the drones cannot reach them directly when launching from the edge of the WCV region. Thus, several pads need to be deployed in the subregion for charging the drones. The details of the pad deployment will be discussed in Section 4.

4. Proposed Schemes

In the proposed WRSN model, the deployment of pads has a significant effect on the performance of the new WRSN. Therefore, the arrangement of the minimum number of pads in the drone-pad region becomes the essential problem in our work. Four formal definitions of the problem will be shown in the following subsections.

4.1. Definition of Pad Deployment Problem

The pad deployment problem tries to select k locations in the drone-pad region and places one pad on every location selected to support at least one flying path from a releasing stop sapi in the WCV region to each sensor in the drone-pad region for drones, since they may need to fly to each node assisted by these pads. The formal definition can be found in Definition 1 (in Appendix A).
Due to the limitation on drones’ flight distances, the residual energy of the drones must guarantee that they can reach at least one nearby pad to replenish their energy. Ddmax is set as the maximum flight distance for every drone. An available charging flight path is defined in Definition 2 (in Appendix A).
Available paths ensure that drones can finish their assigned charging missions when each non-stop flight of a drone is bounded by Ddmax. In this work, we aim to deploy the minimum number k of pads in the drone-pad region so that, for every sensor node s with charging requesting in the drone-pad region, there always exists an available flight path from a releasing stop sapi to the sensor s.
Clearly, the pad deployment with the flight distance limit problem (defined in Definition 3) is a simplified version of the pad deployment problem. At first glance, it seems hard to model the pad deployment with the flight distance limit problem, because there are many available paths for a specific requested sensor and the drone-pad region may include several areas. However, the pad cover problem (in Definition 4) can solve it indirectly and efficiently.
Then, according to Definitions 1 to 4 (in Appendix A), the pad deployment with the flight distance limit problem can be solved by finding a solution to the pad cover problem. Then, the pad deployment problem is associated with the relationship between the WCV region and the drone-pad region, which needs to be considered in the pad deployment scheme.
In general, there are three possibilities when determining an available flight path for drones according to the target sensor node location in the drone-pad region:
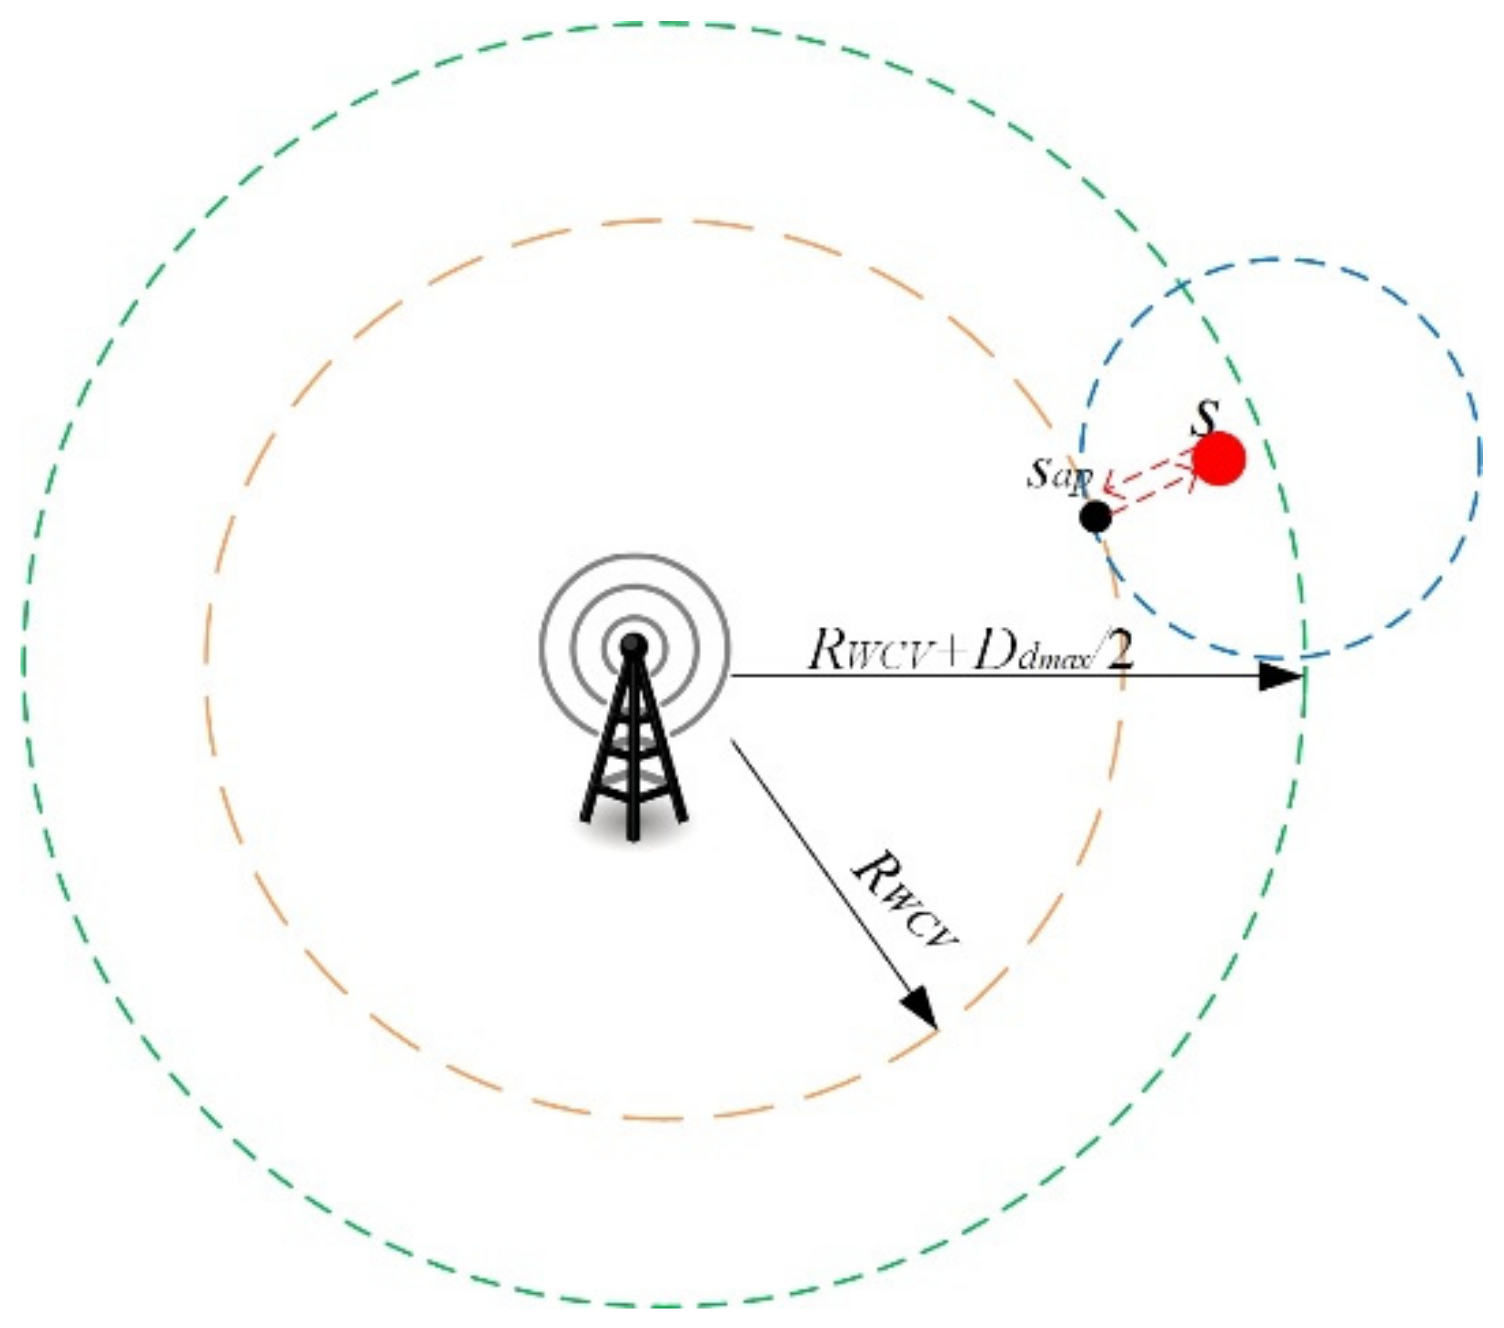
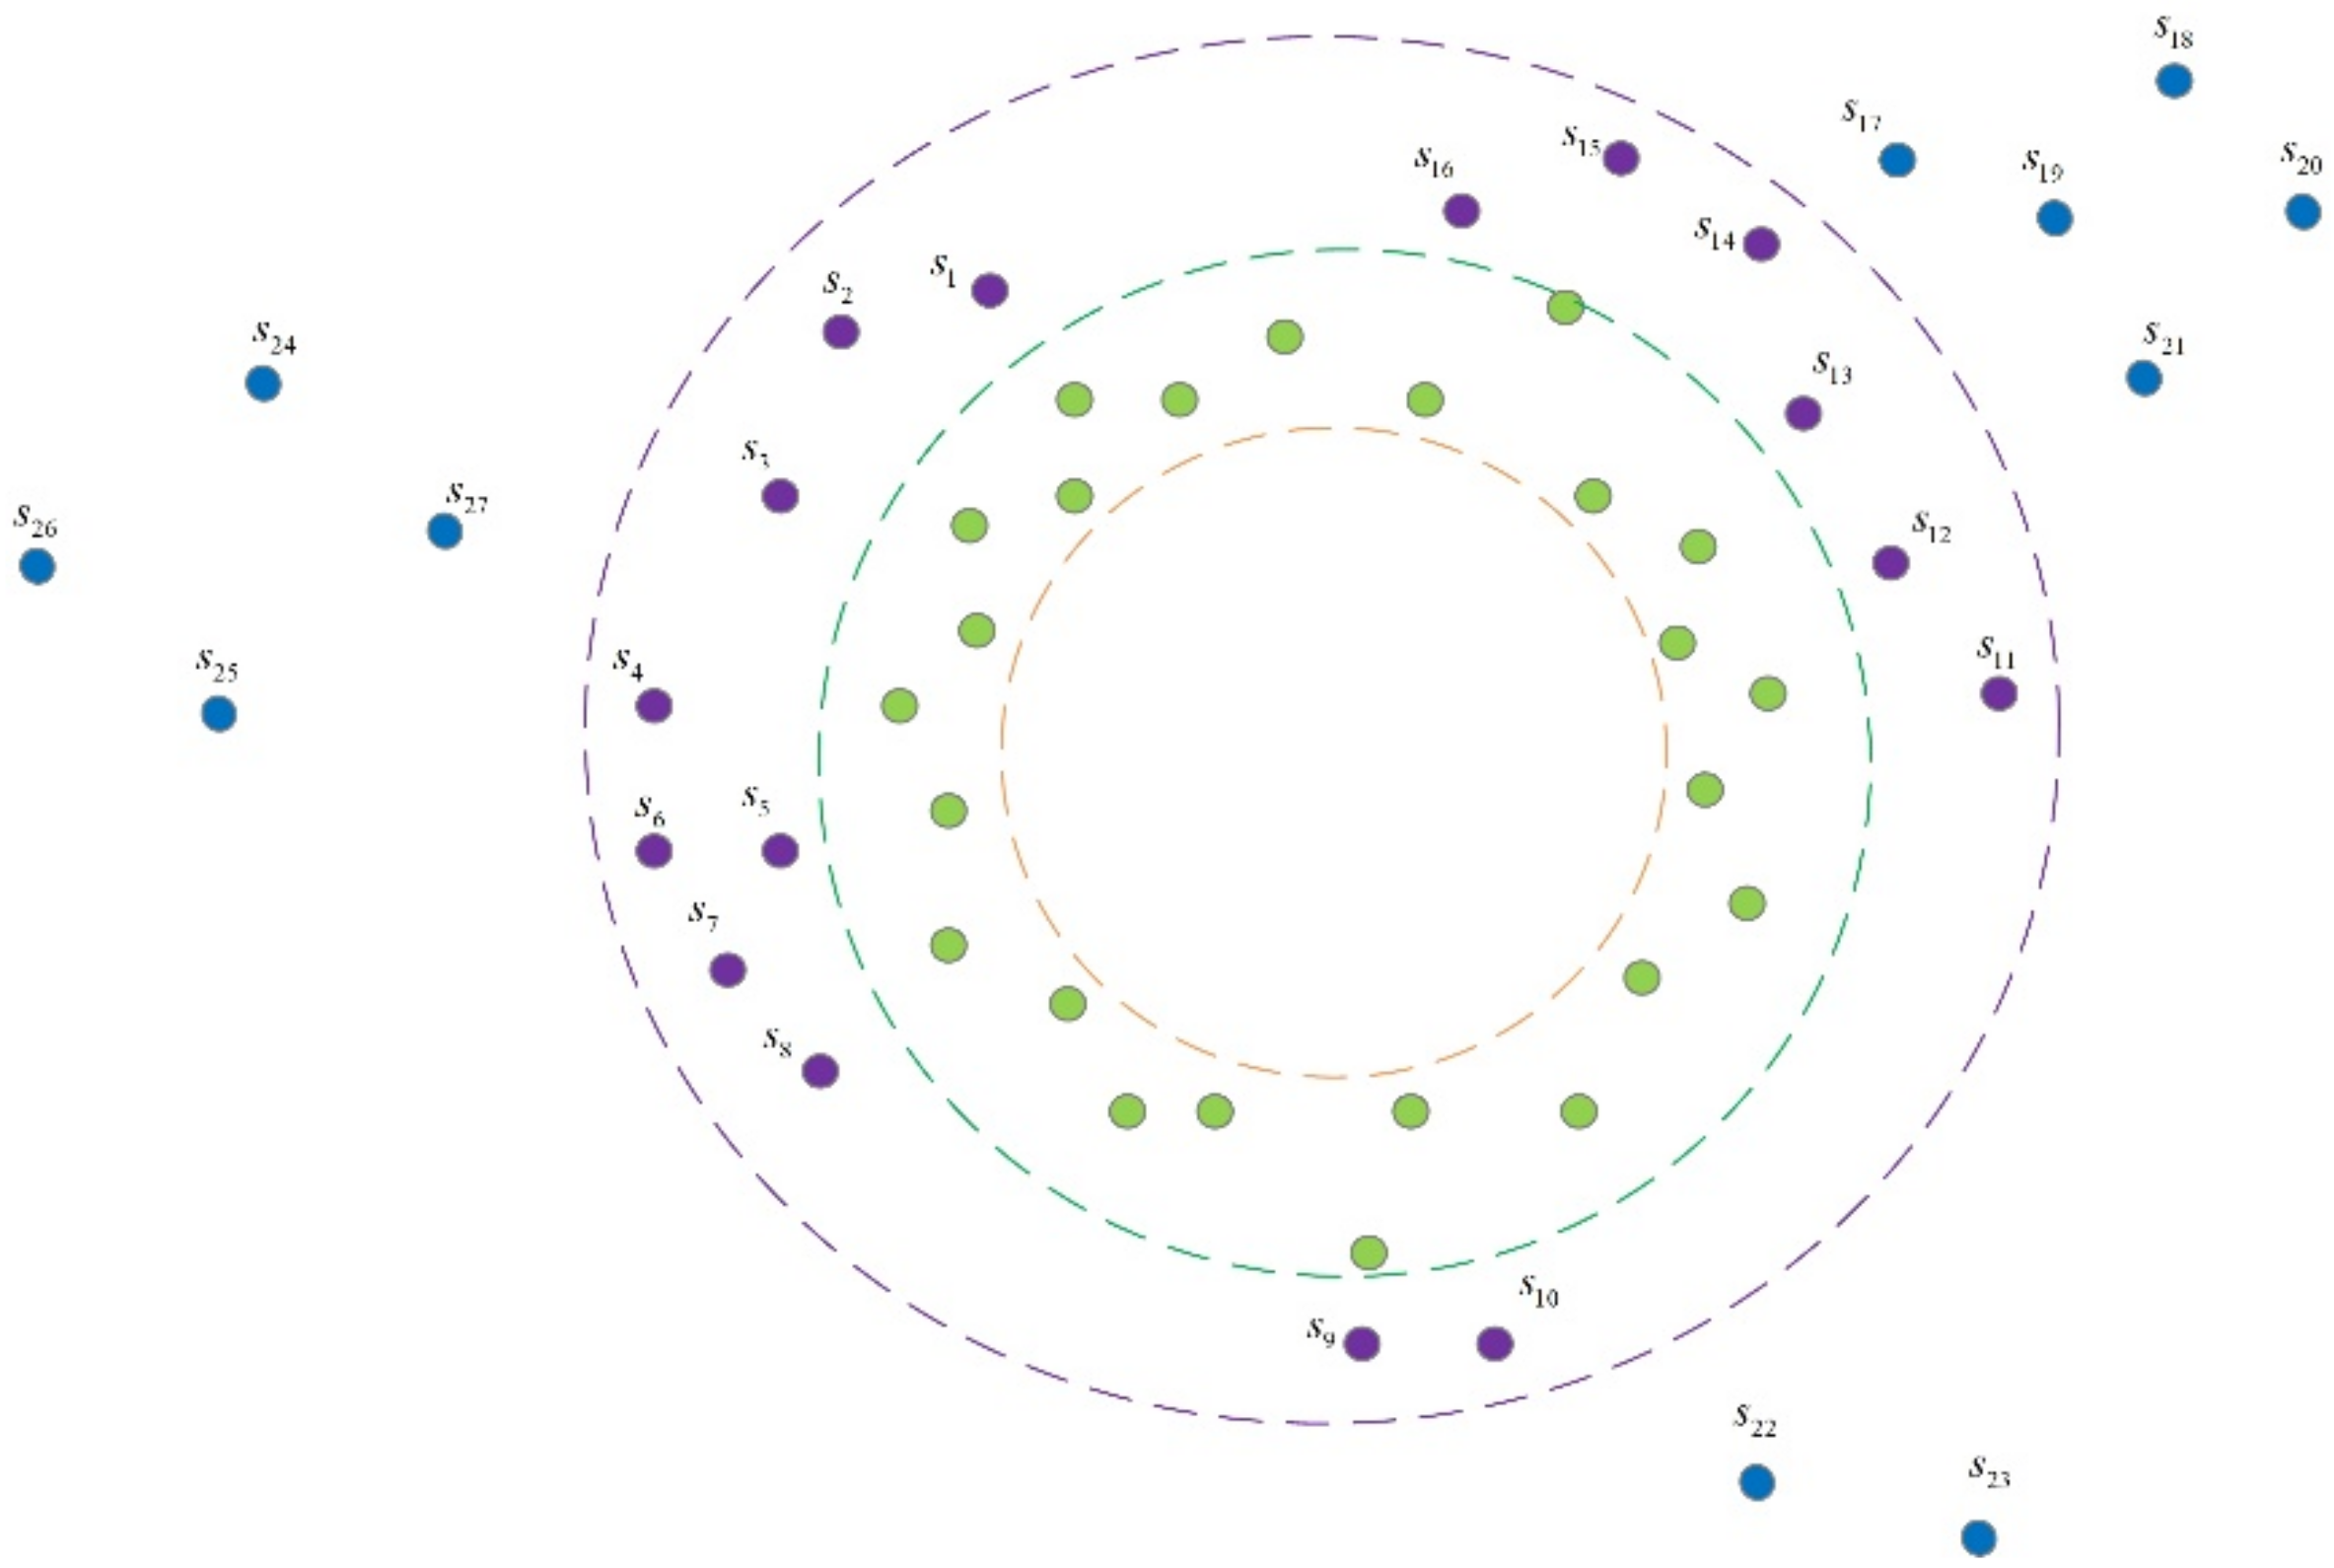
Case 1: The node is located between RWCV and RWCV + Ddmax/2 from BS in the drone-pad region.
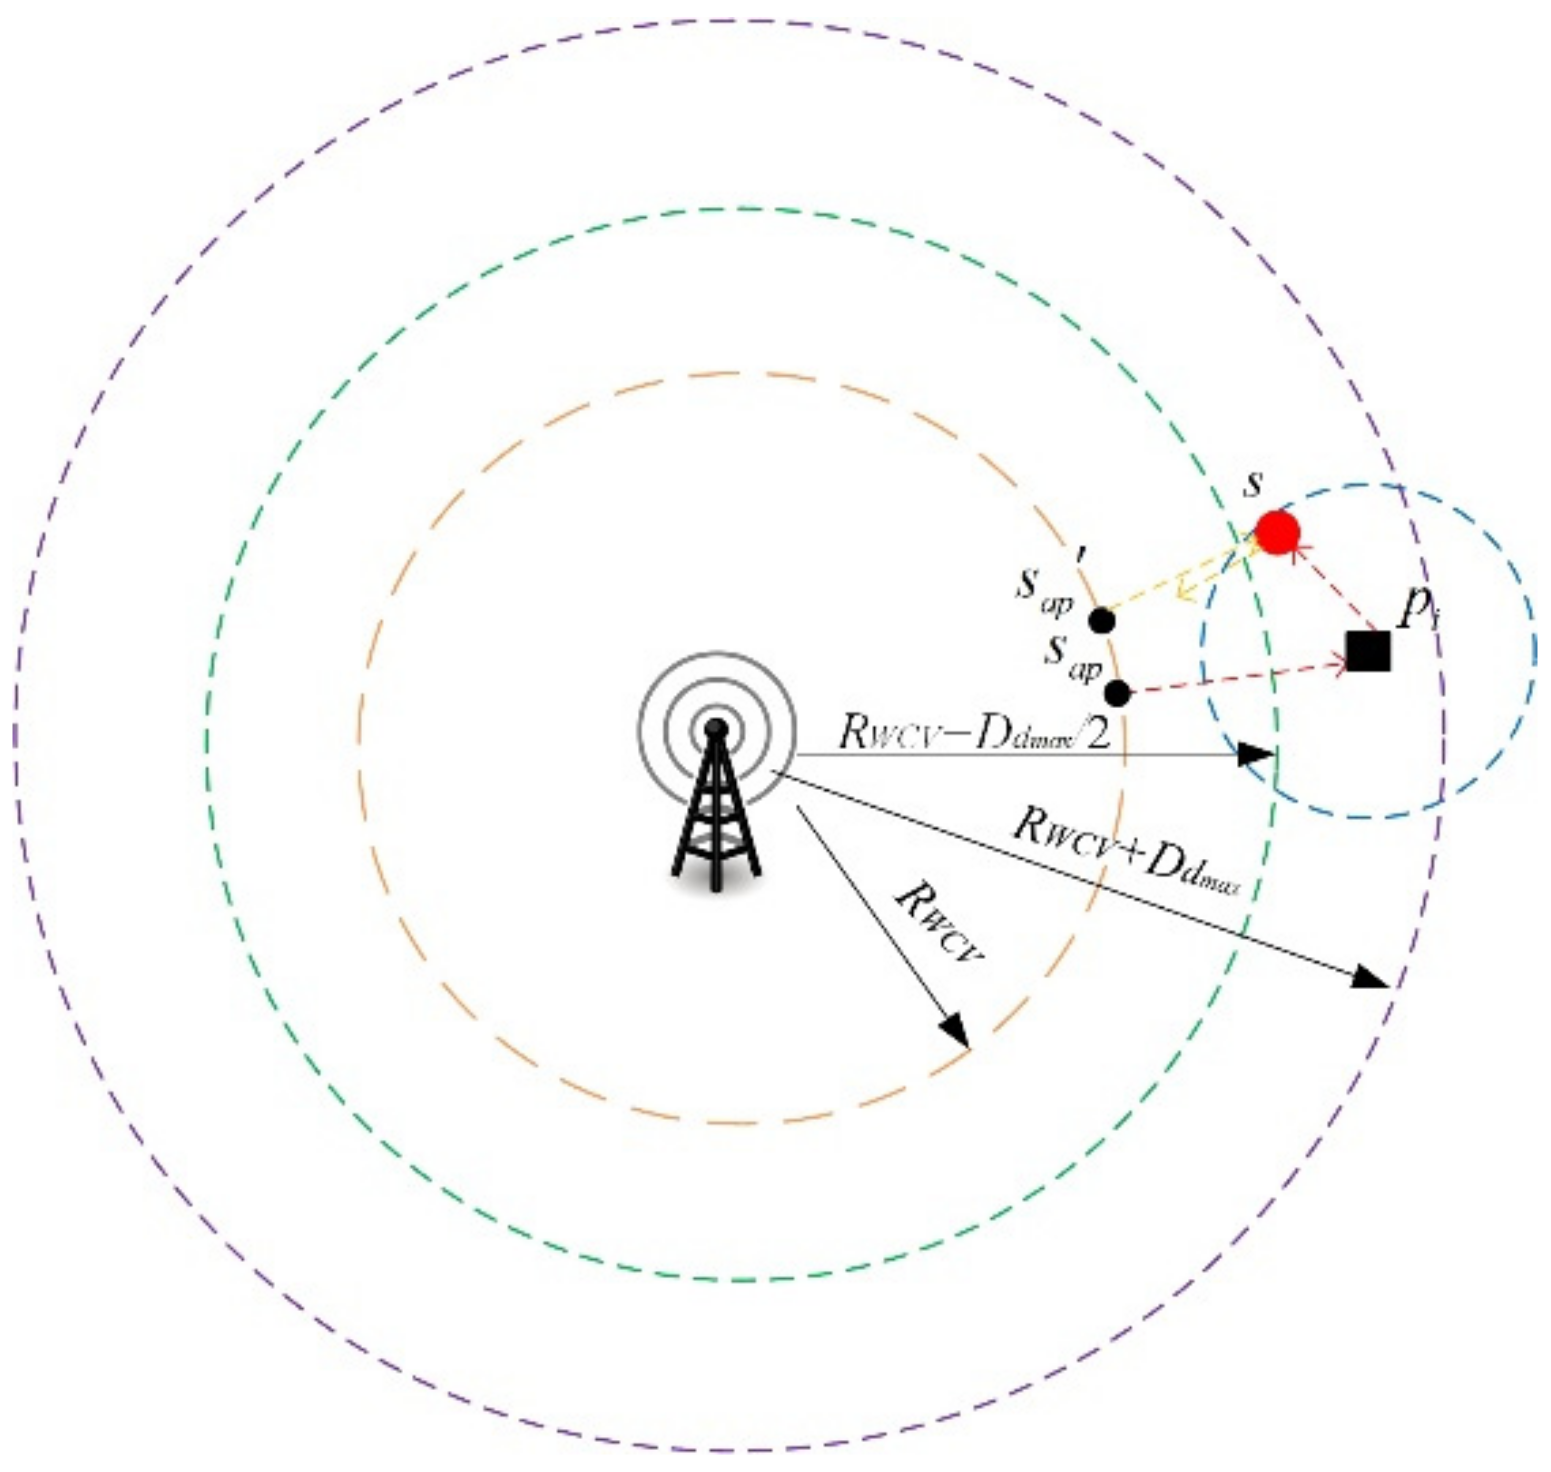
Case 2: The node is located between RWCV + Ddmax/2 and RWCV + Ddmax from BS in the drone-pad region.
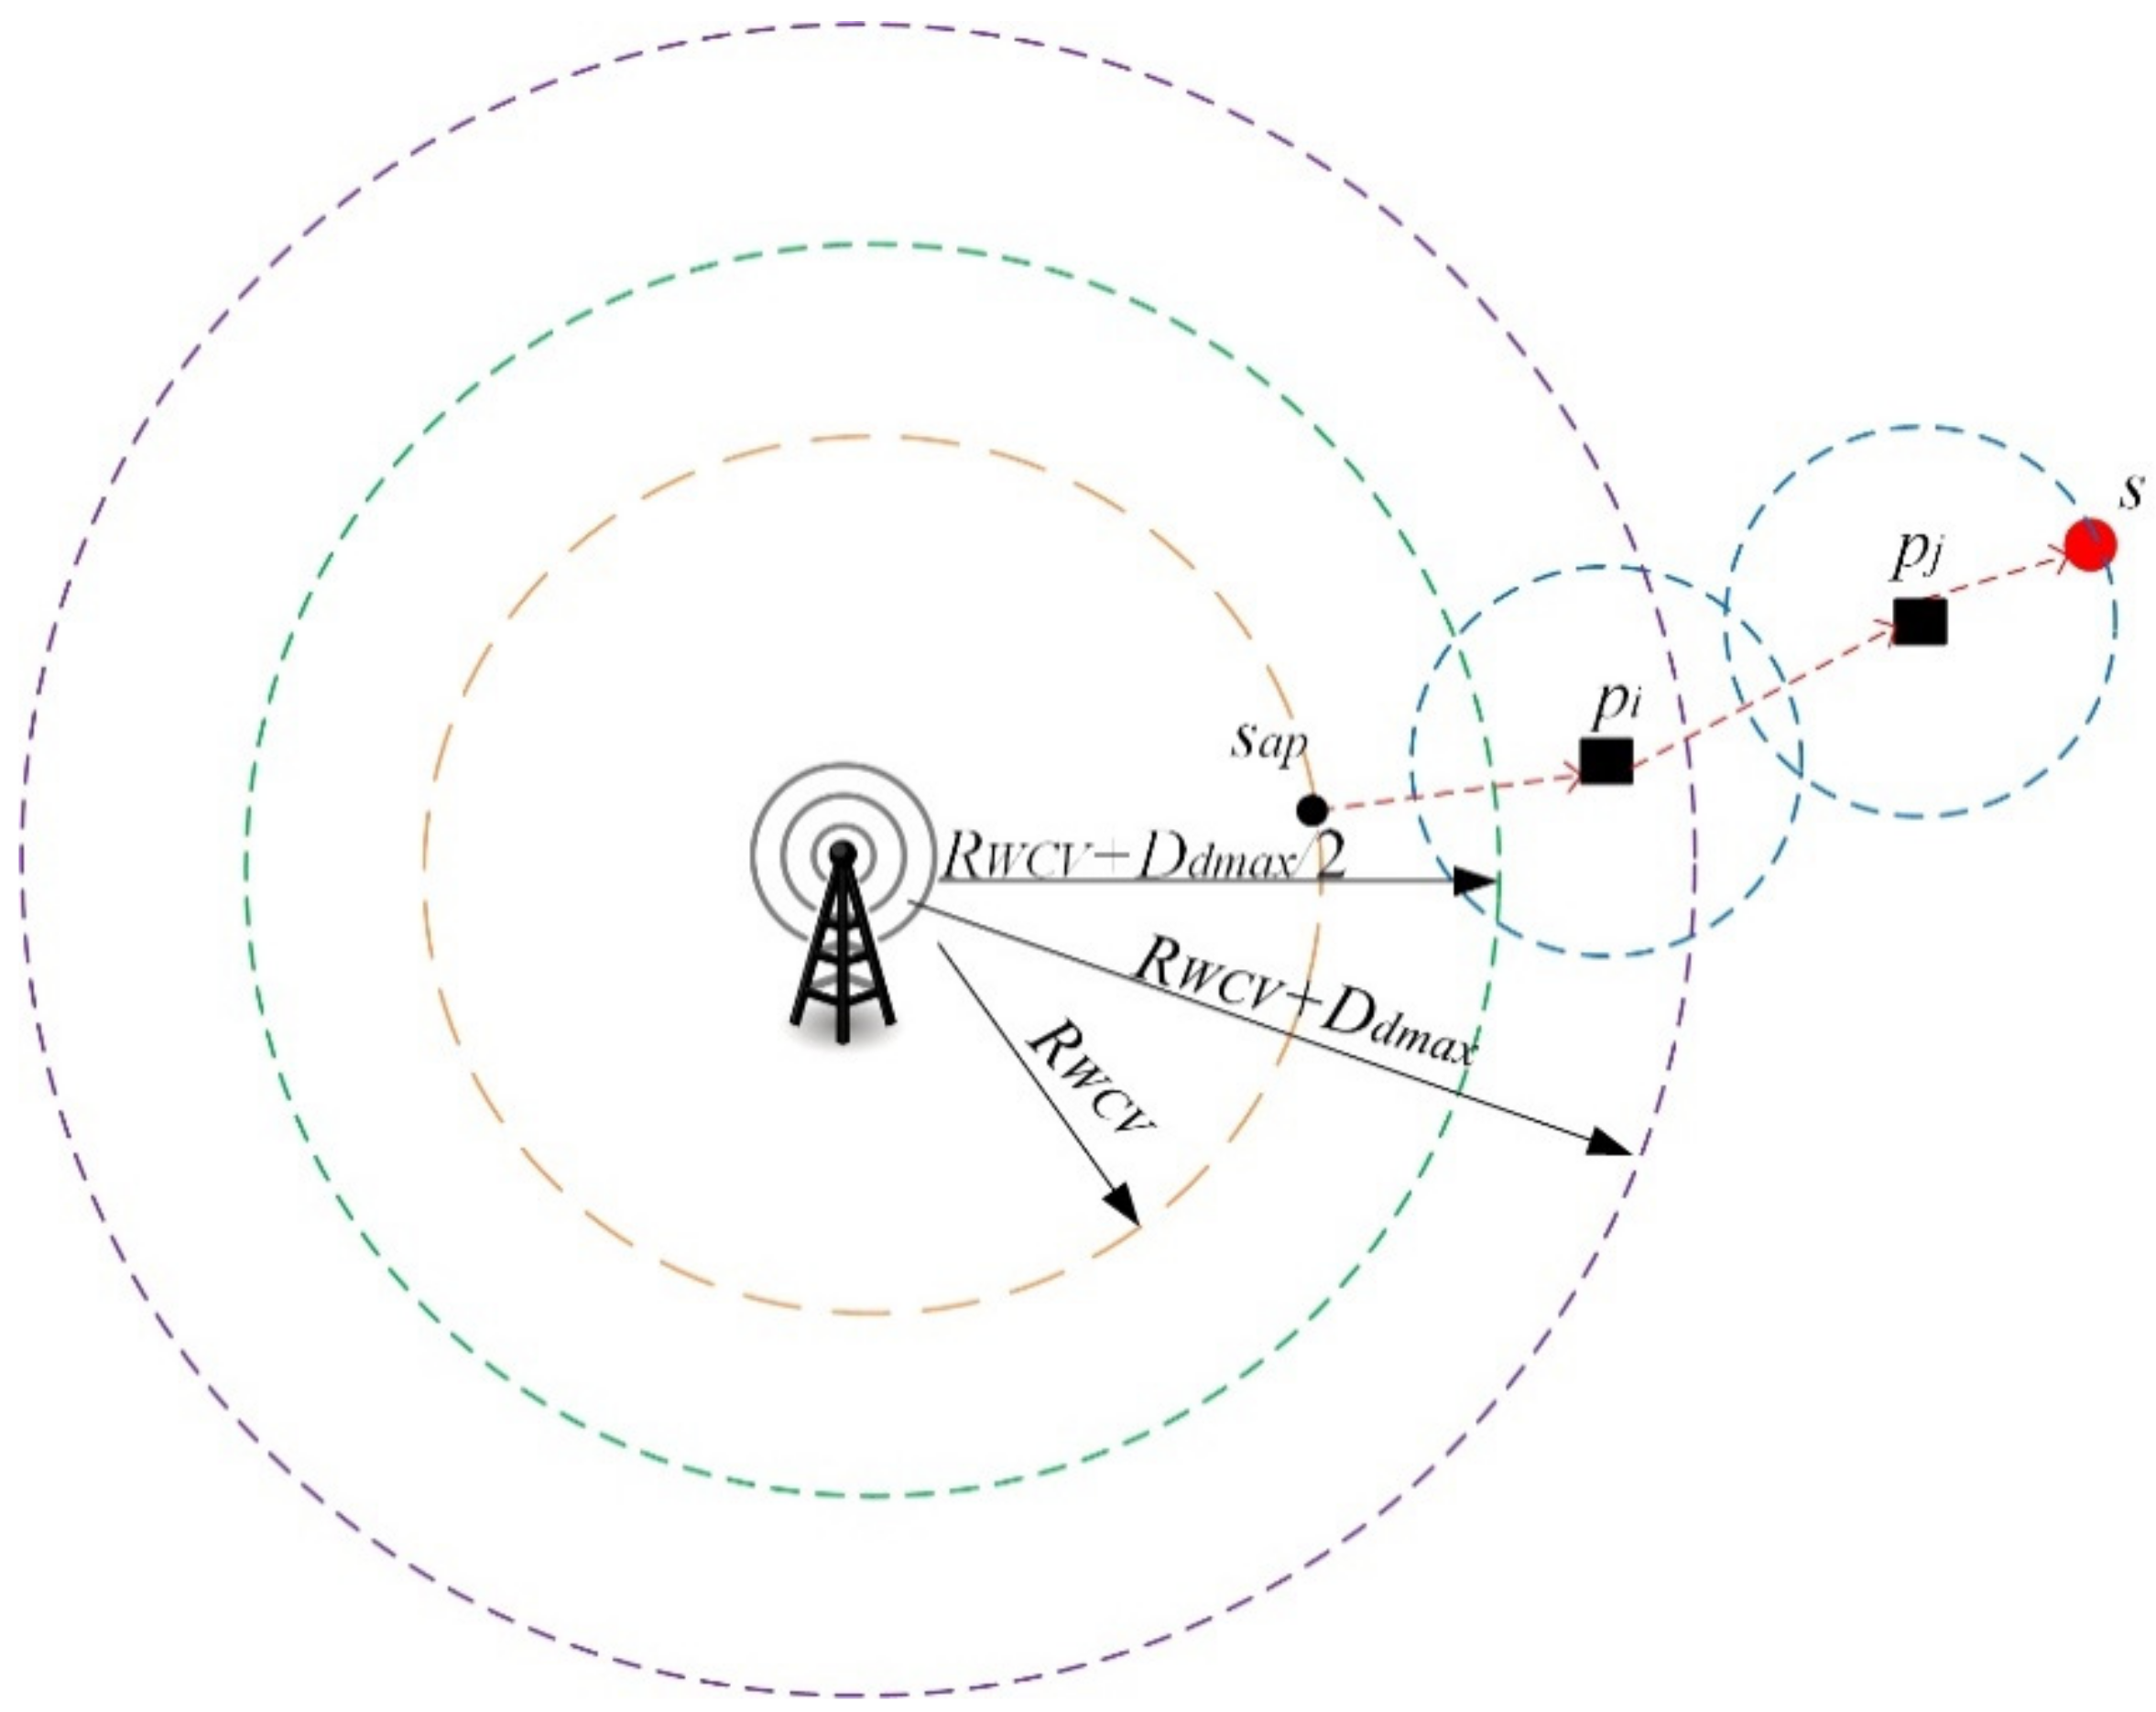
Case 3: The node is located more than RWCV + Ddmax from BS in the drone-pad region.
Figure 3 depicts the above three cases. Nodes that satisfy Case 1 are colored green (located between the yellow dotted circle and green dotted circle in Figure 3), ones that satisfy Case 2 are colored purple (located between the green dotted circle and purple dotted circle in Figure 3), and ones that satisfy Case 3 are colored blue (located outside the purple dotted circle in Figure 3).
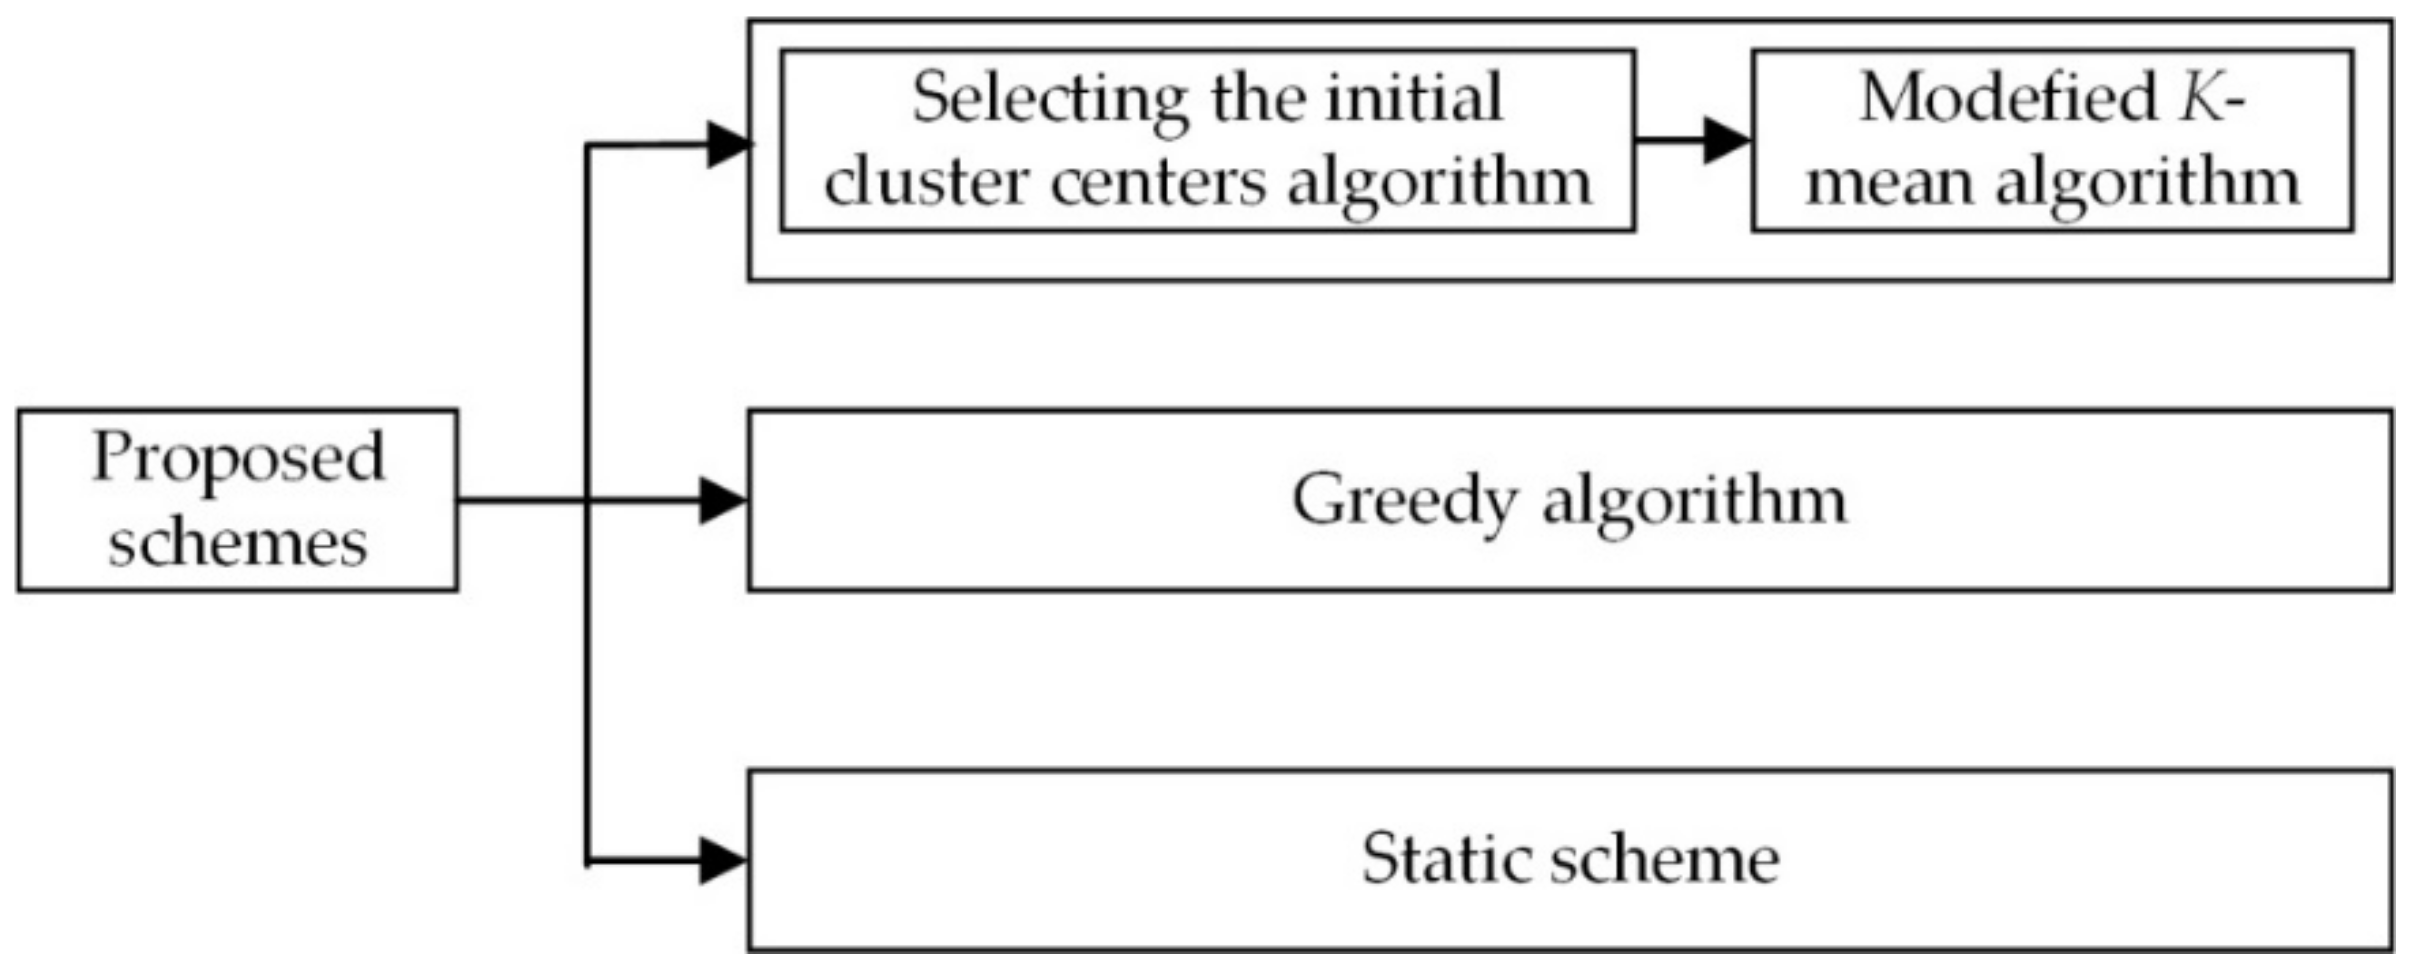
Combining Definitions 1 to 4 and Theorems 1 to 3 (shown in Appendix A), the pad deployment problem can be formulated. In Section 4.3, Section 4.4 and Section 4.5, the efficient deployment algorithms for the problem will be presented. Then, based on the results of the deployment algorithms, a hybrid scheduling scheme is addressed in Section 4.6. A big picture of all parts of the proposed algorithms and schemes is shown in Figure 4.

4.2. Problem Formulation for Pad Deployment

The pad deployment problem is formulated as a mathematical problem, which is presented in this subsection.
To simplify the problem, the WCV region is assumed to be a circle with a center of BS. An efficient pad scheme is designed by considering the distribution of nodes in the drone-pad region and the relationship between the WCV region and the drone-pad region.
The pad deployment problem is defined below.
Minimize: |P = {p1, p2, …, pK}|,
Subject to:
s i S S w c v c i j 1 , p j P
p i P e i j 1 , p j P
e i j = 1 , i f   d ( p i , p j ) D d max 0 , o t h e r w i s e
c i j = 1 , i f   d ( s i , p j ) D d max / 2 0 , o t h e r w i s e
r i = 1 , i f   d ( p i , B S ) R w c v + D d max 0 , o t h e r w i s e
Ω   is   a   permutation   of   a   subset   of   P r Ω ( 1 ) × e i , Ω ( 1 ) × k = 1 Ω 1 e Ω ( k ) , Ω ( k + 1 ) × e Ω ( Ω ) , j 1 , p i , p j P ,
where pipj when ij.
Constraints (4) and (7) indicate that every sensor node in the middle (as shown in Figure 3, the region between green and purple dotted circle) and at the edge of the drone-pad region is covered by at least one pad. Constraints (5) and (6) state that each pad is connected to at least one other pad. Constraint (6) implies that a pad in the middle and at the edge of the drone-pad region is connected with another pad only if the distance between them is within Ddmax. Constraint (7) implies that a node in the middle or at the edge of the drone-pad region is connected with a pad only if it is located within Ddmax/2 of the pad. Constraint (8) implies that a pad in the middle or at the edge of the drone-pad region is connected with the WCV region only if the distance between the pad and BS is within the sum of RWCV and Ddmax. Constraint (9) implies that at least one available path exists between any releasing stop sap in the WCV region and a node in the drone-pad region.
A simplified pad deployment problem that considers deploying pads on the location of sensor nodes or some places in the drone-pad region is shown as follows. Note that the sensor nodes in the drone-pad region must form several connected subgraphs to collect and relay sensing information to the sink via hop–by–hop communication, so that there always exists a solution for the simplified pad deployment problem. Specifically, in this work, three schemes are proposed and discussed in the following subsections. The first two schemes, including the modified K-mean and greedy schemes, solve the problem by designing efficient algorithms, while the third scheme (called the static scheme) works by placing pads according to the geometric properties of the pad region and the relationship between the drone-pad region and the WCV region. Moreover, the modified K-mean scheme determines the number of pads and the pads’ locations by iteratively computing the node clusters’ centers in the drone-pad region. The greedy scheme uses the node locations in the drone-pad region as potential deployment positions for the pads, while, in the modified K-mean and static schemes, the deployment positions may or may not be in the nodes’ locations.

4.3. Modified K-Mean Scheme

The K-means algorithm is a popular data-clustering algorithm. However, in the K-means algorithm, K data centers are selected randomly, which makes the clustering result unstable, even trapped in a local optimal solution. In the proposed algorithm, the selection of initial cluster centers is very important and affects the performance of the algorithm. Therefore, the selection of initial cluster centers is also taken into account. According to the pad’s regional characteristics, minimizing the maximum inter-cluster distance scheme is a typical method for selecting initial discrete cluster centers [30] and is applied in the design.
However, the number of clusters, K, needs to be specified before performing the algorithm. The constrained information obtained by the previous analysis is integrated into the K-means algorithm. Combining the constrained conditions, the number of clusters, K, is estimated roughly according to Equation (10):
K = A r e a π R W C V 2 π ( D d max / 2 ) 2 + 1
where Area is the size of the sensing region.
The key idea of Algorithm 1 is to select the initial cluster center as far as possible from the selected cluster centers until the number of cluster centers equals K. The first step selects a node in node set V of the drone-pad region as the first cluster center randomly, and removes all of the nodes from set V covered by the node. Step 2 chooses a node in set V farthest from the selected cluster center in set C. Step 2 is repeated until K cluster centers are selected. The details for selecting the initial cluster centers scheme are shown in Algorithm 1.
Algorithm 1 Selecting the initial cluster centers algorithm
Input: Sensor node set V of the drone-pad region with a center set C = ∅, initial cluster number K, Set Vc= ∅.
Output: An initial cluster center set C.
Step 1: Select a node s1 randomly in V as the first cluster center, c = s1.
    C c
    for each s in set V
    Compute dist(s, c)
    if dist(s, c) ≤ dmax/2
    Vc s
    V = V/Vc
Step 2: Select a node s in V with the maximum value of max(min(dist(s, ci))) as the cluster center, c = s.
    C c
    Vc =
   for each s in set V
   Compute dist(s, c)
   if dist(s, c) ≤ dmax/2
   Vc s
   V = V/Vc
Step 3: Repeat Step 2 until |C|= K.
Step 4: Output the Set C.
Then, according to the results of Algorithm 1 and the previous analysis, the traditional K-means algorithm is modified as follows. The intuitive idea of the modified K-mean algorithm is: given a set of sensor node set V, the set is divided into K clusters according to the distance between the sensor nodes. The selection of initial cluster centers is as even as possible. Moreover, make the sensors in the same cluster as close as possible, limited by Constraints (4) and (7), and make the distance between clusters as far as possible, constrained by Constraints (5) and (6). Step 1 of Algorithm 2 computes the distance between nodes in set V and each cluster center. Step 2 assigns each node in set V to the nearest cluster according to the distance. Step 3 recalculates the cluster centers, and Step 4 computes cluster criterion E. Step 5 determines repeating Step 1 by comparing E. The details of the steps are shown in Algorithm 2.
Algorithm 2 Modified K-mean algorithm
Input: Sensor node set V of the drone-pad region, an initial cluster center set C, K = |C|.
Output: A final cluster center set C.
Step 1: for each c in set C
      for each s in set V
   Compute dist(s, c)
Step 2: According the result of Step 1, assign each s in set V into the nearest cluster, i.e., if dist(s, ci) = min{dist(s, ci), i = 1, 2, 3,… K}, then s Ci.
Step 3: Compute new cluster centers c j = 1 n s i C j s i , j = 1, 2, 3, …, K.
Step 4: Compute cluster criterion function E = i = 1 n j = 1 k | | s i c j | | 2 .
Step 5: if E ε
  go to Step 6.
  else go to Step 1.
Step 6: Output set C.

4.4. Greedy Scheme

In this subsection, a greedy scheme is used to solve the pad deployment problem by applying the concept of selecting the maximum degree and graph-coloring technique [18], so that two graphs consisting of one or more connected subgraphs are obtained.
We colored the nodes with different colors to indicate different statuses. A node in gray denotes that it has been covered by a pad, and a node in black means that it has been chosen as a pad. Moreover, a node is colored in purple or blue if it is neither covered nor chosen as a pad yet.
Intuitively, the greedy scheme is firstly performed on purple nodes by selecting a node that colors most purple nodes in each step until there are no more purple nodes in the input graph. However, in order to find a proper node efficiently, it chooses a node v (as a pad) by comparing the |NP(v)| values of every purple node v that is Ddmax/2 to Ddmax away from any selected pad, where NP(v) is the set of neighboring purple or gray nodes of v. Then, based on the selected pads in the first stage, the greedy scheme is performed on nodes in blue by choosing a node that colors most blue nodes in each step until there are no more blue nodes in the given graph. It also chooses a node as a pad by comparing the |NB(v)| values of every blue node that is Ddmax/2 to Ddmax away from any selected pad, where NB(v) is the set of neighboring blue or gray nodes of v.
The detailed steps of the greedy scheme are described in Algorithm 3.
Initially, in Step 1, two different graphs, G1 and G2, with purple nodes are constructed, where G1 is constructed based on Condition (2) and G2 is based on Condition (1) of Definition 4. That is, the greedy scheme creates G1 = (V1, E1) by adding an edge between si and sj in V1 if, and only if, d(si, sj) ≤ Ddmax/2d(si, sj)Ddmax. Next, it constructs G2 = (V2, E2) by adding an edge between si and sj in V2 if, and only if, d(si, sj) ≤ Ddmax/2.
Then, in Step 2, the greedy scheme computes N(v) for every node v in G1, where N(v) is the set of purple vertices in V1 that are adjacent to v in G1. It chooses the node v with the maximum |NP(v)| number of nodes in G2, then colors v black and all NP(v) gray. The same coloring operation is applied to the corresponding nodes in G1, and also v is added into set C. Next, in Step 3, for every purple node u in N(v) of a node vC in G1, compute NP(u) in G2. After selecting a node x with maximum |NP(x)| value, the algorithm colors x in black and NP(x) gray in G1 and G2. The algorithm also adds x into set C. Repeat the procedures of Step 3 until there are no purple nodes in G2.
Next, Step 6 reconstructs G1 and G2 in blue nodes with set C. In Step 7, the nodes in set C are colored in black in the two graphs; then, for each v in set C, color each node in NB(v) gray in G1 and G2. Step 8 computes NB(u) in G2 for every blue node u in N(v) of a node vC in G1. Then, a node x with the maximum |NB(x)| value is selected, and node x is colored in black and NB(x) gray in G1 and G2. Next, x is put into set C. Repeat the procedures of Step 8 until there are no blue nodes in G2.
Algorithm 3 selects a node as a pad in N(v) of a node vC in G1, which makes sure that the pads generated by Algorithm 3 are connected in some connected subgraphs (i.e., every pad is at least Ddmax/2 to Ddmax away from (connected with) one other pad). Moreover, all the sensor nodes are covered by the pads, because all nodes are colored in gray (i.e., are covered) or black (i.e., are chosen as pads) after the execution of Algorithm 3.
Algorithm 3 Greedy algorithm
Input: Purple node set with Vp = {sp1, sp2, …, spN}, blue node set Vb = {sb1, sb2, …, sbM} with a node set C = ∅.
Output: a selected node set C.
   Step 1: Create a graph G2 = (V2, E2) by adding an edge between si and sj in Vp if, and only if, d(si, sj) ≤ Ddmax/2.
   Create a graph G1 = (V1, E1) by adding an edge between si and sj in Vp if, and only if, Ddmax/2 ≤ d(si, sj) ≤ Ddmax.
Step 2: Calculate N(v) of each uncolored node v in V1 of G1.
Calculate NP(v) for every purple node v in V2 of G2.
   Select a purple node v in G1 with the maximum NP(v) value in G2.
   Set v.color = black.
        C v .
   Set u.color = gray for each node u in NP(v).
Step 3: For each node v in set C
    for each purple node x in N(v) of G1
     Calculate NP(x) of each node x in V2 of G2.
    Select the node x with the maximum NP(x) value. Set x.color = black.
     C x .
    Set y.color = gray for each node y in NP(x).
Step 4: Repeat Step 3 until there are no purple nodes in G2.
Step 5: Set V = Vb C
Step 6: Create a graph G2 = (V2, E2) by putting an edge between si and sj in V if, and only if, d(si, sj)≤ Ddmax/2.
    Create a graph G1 = (V1, E1) by putting an edge between si and sj in V if, and only if, Ddmax/2 ≤ d(si, sj) ≤ Ddmax.
Step 7: For each node v in set C
   Set v.color = black.
     Calculate NB(v) for every blue node v in V2 of G2.
     Set u.color = gray for each node u in NB(v).
Step 8: For each node v in set C
   for each blue node x in N(v) of G1
   Calculate NB(x) of each node x in V2 of G2.
   Select the node x with the maximum NB(x) value.
   Set x.color = black.
         C x .
   Set y.color = gray for each node y in NP(x).
Step 9: Repeat Step 8 until there are no blue nodes in G2.
Step 10: Output the nodes in black (i.e., set C).

4.5. Static Scheme

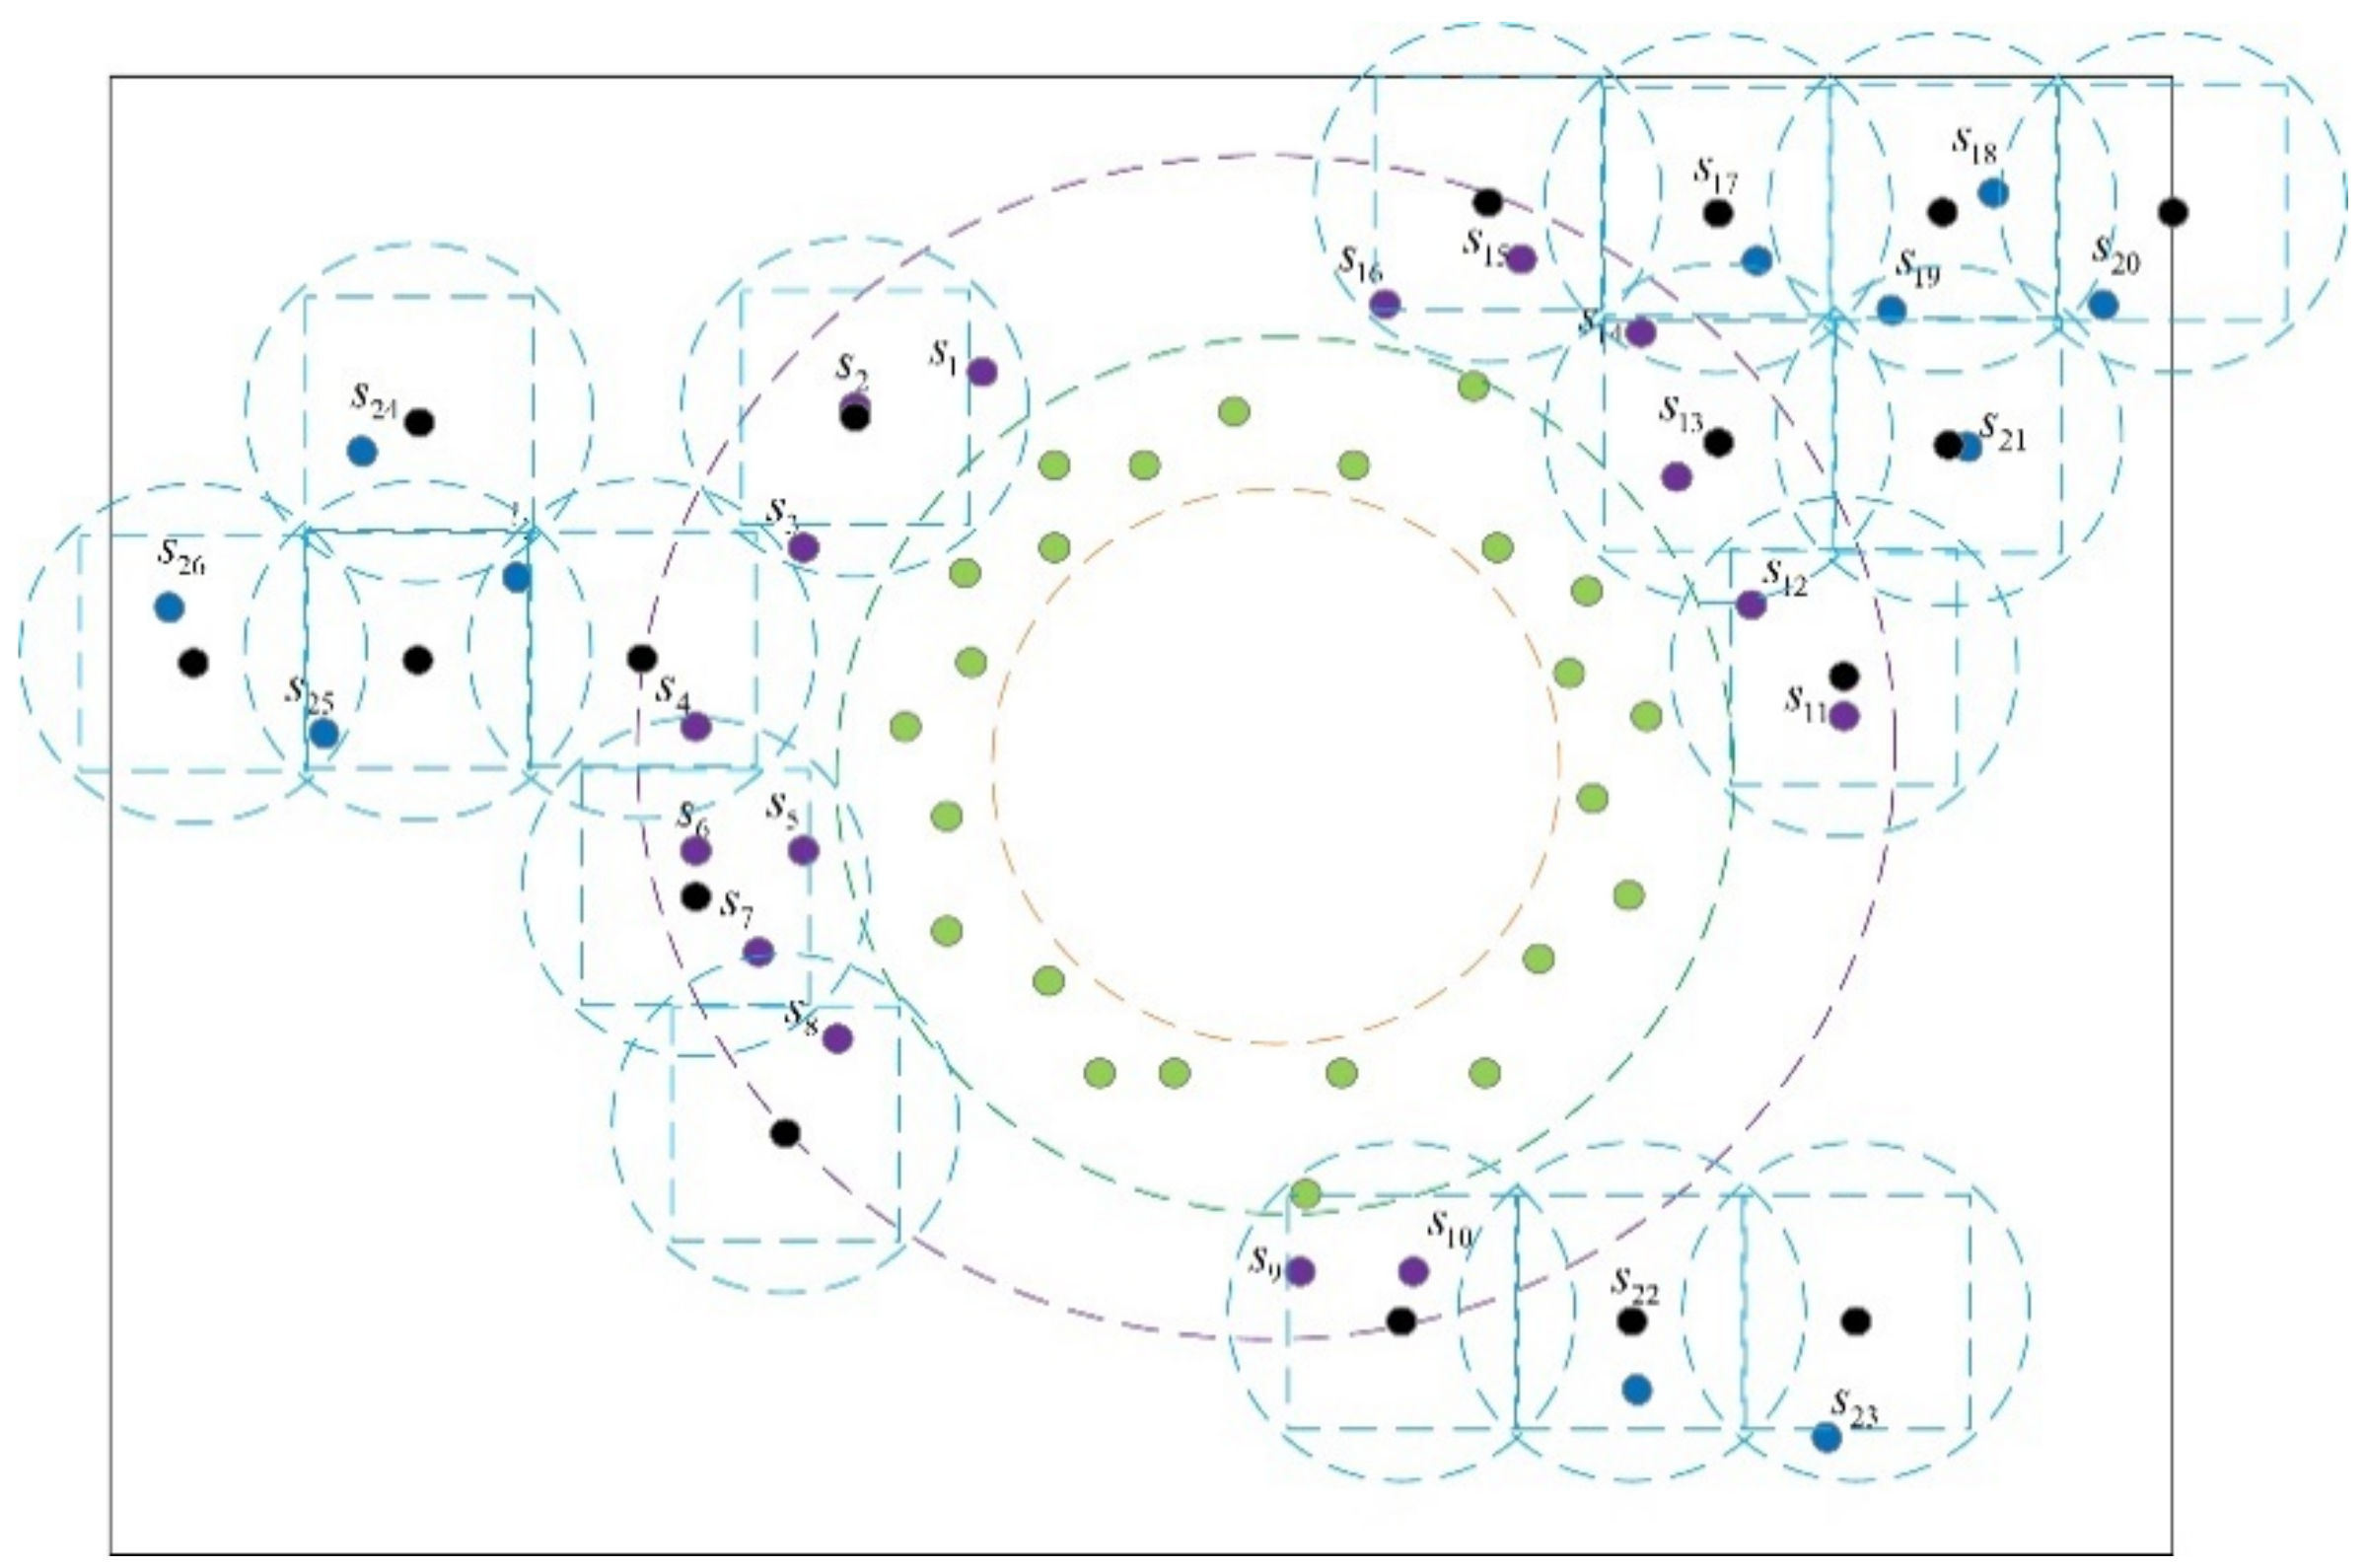
The static scheme solves the problem of pad deployment by regularly and systematically placing pads to cover the region of purple and blue nodes (the middle and outer of the drone-pad region) in Figure 5. Then, the redundant pads are removed. The static scheme must not only cover the middle (purple nodes in the sub-region) and outer sub-region (blue nodes in the sub-region) of the drone-pad region, but also ensure at least one available drone flight path for every purple or blue node. For example, as shown in Figure 5, the static scheme locates the pads (black points), and the blue dotted circles (indicating the flying range) are overlapped one by one until they cover the whole drone-pad region. That is, make sure that one pad is connected with at least one other pad.

4.6. Scheduling for the WCV and Drones

To solve the charging scheduling problem in the proposed WRSN model, a hybrid scheduling scheme that minimizes the total time of charging scheduling is presented in this section. The difficulty in designing such a scheme is how to coordinate the WCV and drones to work cooperatively and synchronously.

4.6.1. Scheduling Problem

According to the discussion in Section 4.1, sensor nodes with charging requests in the drone-pad region can employ three types of scheduling for drones, as shown in Figure 6. When Case 1 occurs, the optimal flying stop for launching drones is computed according to Theorem 1. Following this, the drone launches from the releasing stop sap directly to the target node. When Case 2 occurs, the optimal releasing stop is computed by the nearest pad that covers the node, then the drone launches from the releasing stop to the pad, then back to the node. When Case 3 occurs, the optimal flying stop is computed by the pad located at a distance between Ddmax/2 and Ddmax from the WCV region that connects a flying path to the node; then, the drone launches from the releasing stop first to the pad (for replenishing its energy) and then to the node along a connecting path.
For Cases 2 and 3, the releasing stop is computed as follows. Connect the pad to the BS with a straight line and take a point Ddmax from the pad on the line as a releasing stop. Then, the coordinates of releasing stops are computed as in Equation (11):
x = x 0 + D d max d i s t ( s 0 , p i ) ( x 0 x p i ) y = y 0 + D d max d i s t ( s 0 , p i ) ( y 0 y p i )
where (x0, y0) are the coordinates of the BS and (xpi, ypi) are the coordinates of the first pad (the first pad for drone land on when it launches from WCV-region) in Case 3 or Case 2, or the node with the charging request in Case 1.

4.6.2. Scheduling for the WCV

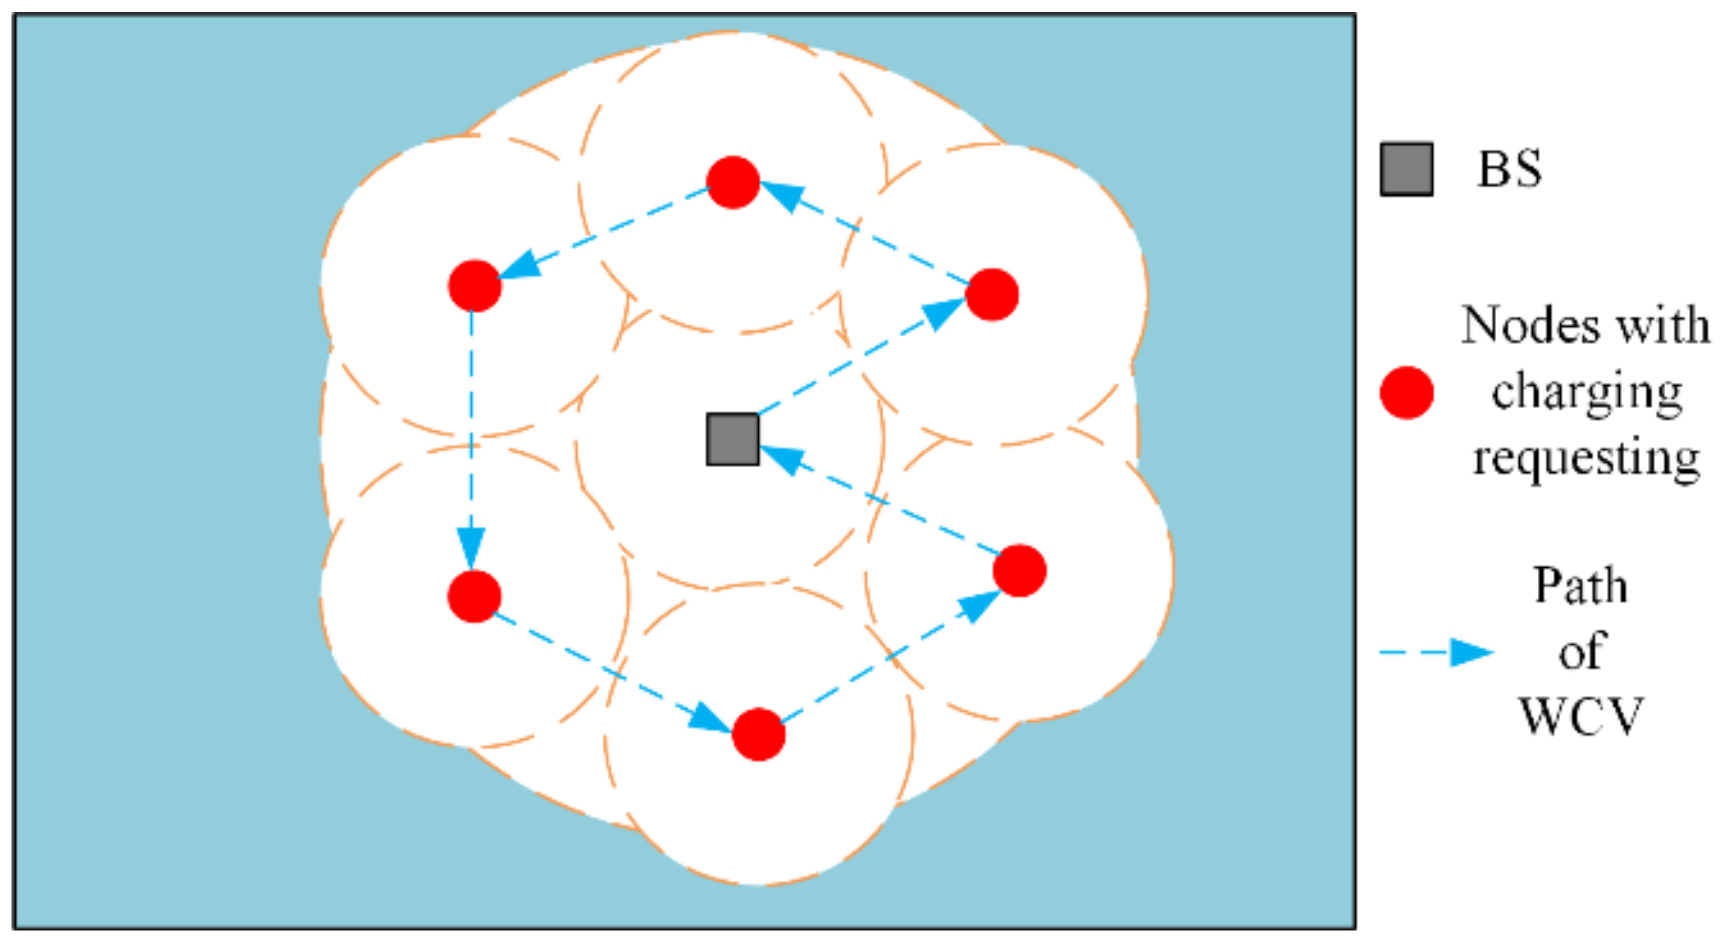
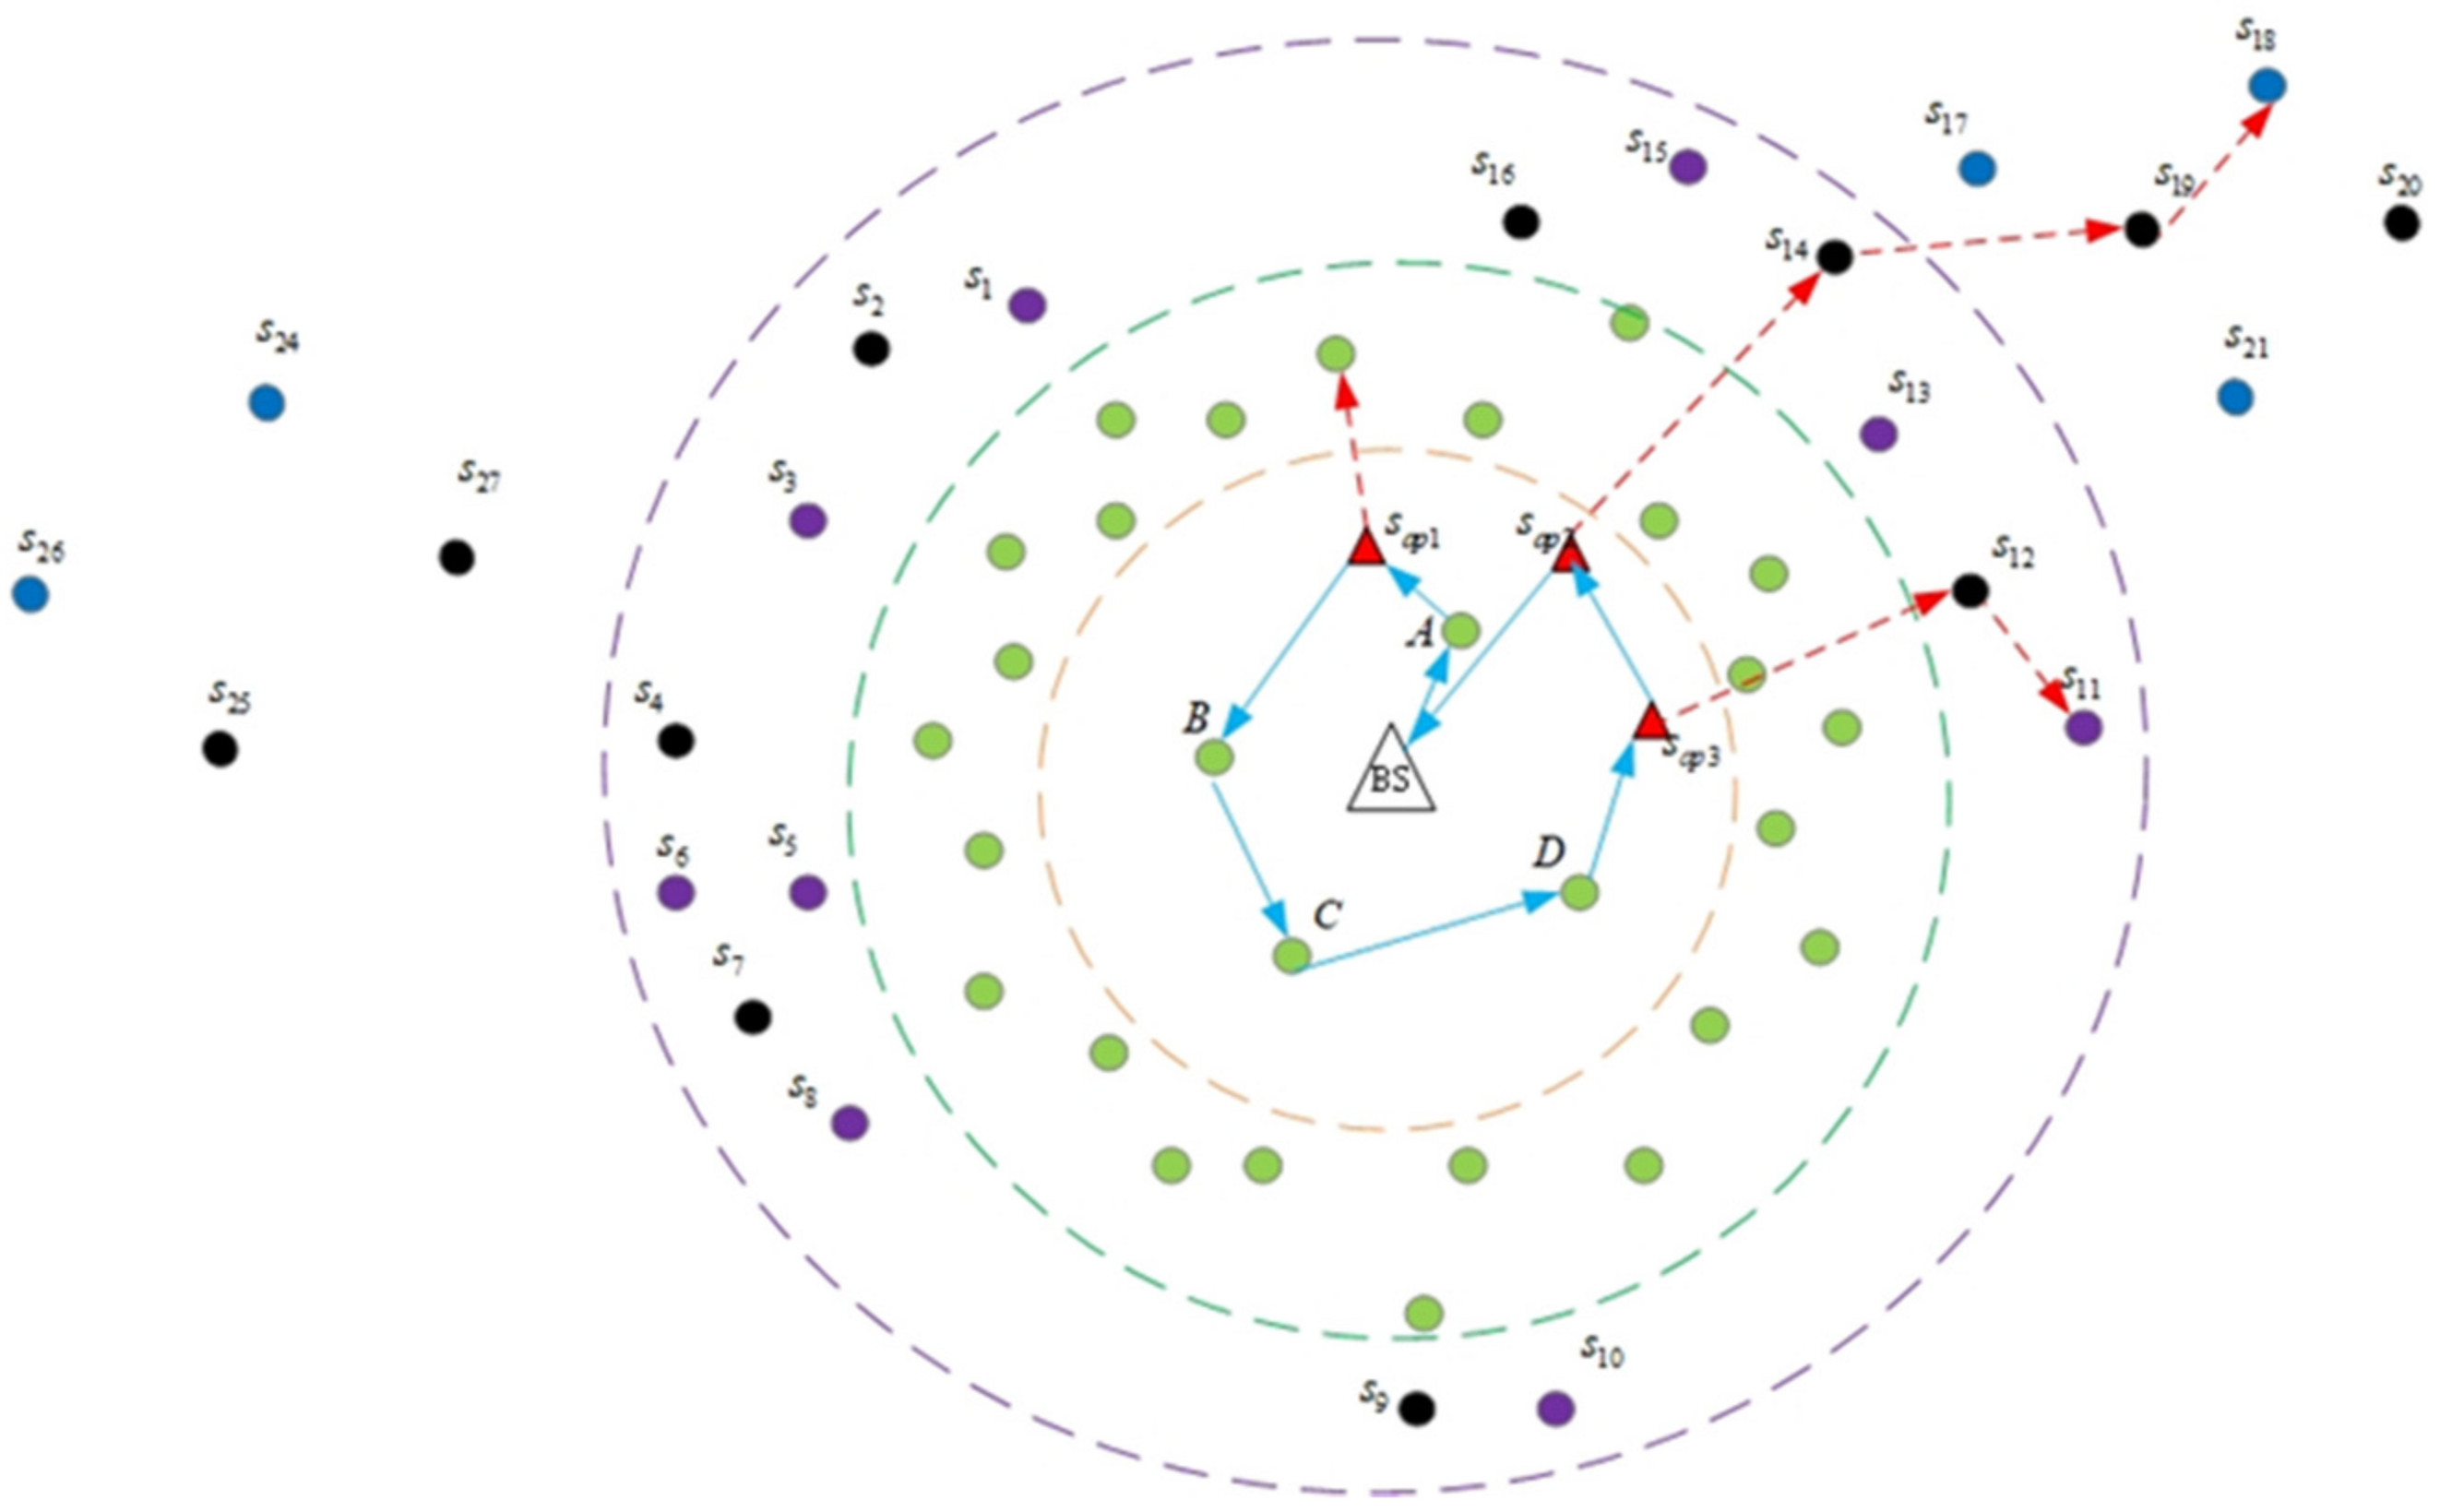
In this work, a WCV moves freely in the WCV region. On the basis of previous simulations [31], Nearest–Job–Next with Preemption (NJNP) is a simple, but efficient, scheme for on-demand charging. Therefore, in this work, nodes with charging requests in the WCV region and the pre-calculated flying stops are scheduled in advance according to NJNP. For example, as shown in Figure 7, the scheduling for WCV is BS A sap1 B C D sap3 sap2 BS.

5. Simulations

In this section, we conducted simulations to show the effectiveness and efficiency of the proposed algorithms. First of all, the simulation setup is described, followed by a comparison and discussion of the simulation results. Because the number of pads is an important metric in this work, that obtained by the three schemes is examined by varying various network parameters such as Ddmax, network density, and the size of the WCV region. The simulation parameters are shown in Table 3.

5.1. Performance of the Proposed Deployment Schemes

In the simulations, static rechargeable sensor nodes are deployed randomly over a square region. Note that BS is located in the center of the region. In the following figures, each value is taken from an average of 30 different outcomes for each value according to the same network parameters. We performed the simulations using a PC with a quad-core 3.2 GHZ Intel i7 processor and 16 GB RAM, and we used Visual Studio C# 2017 to implement the algorithms.
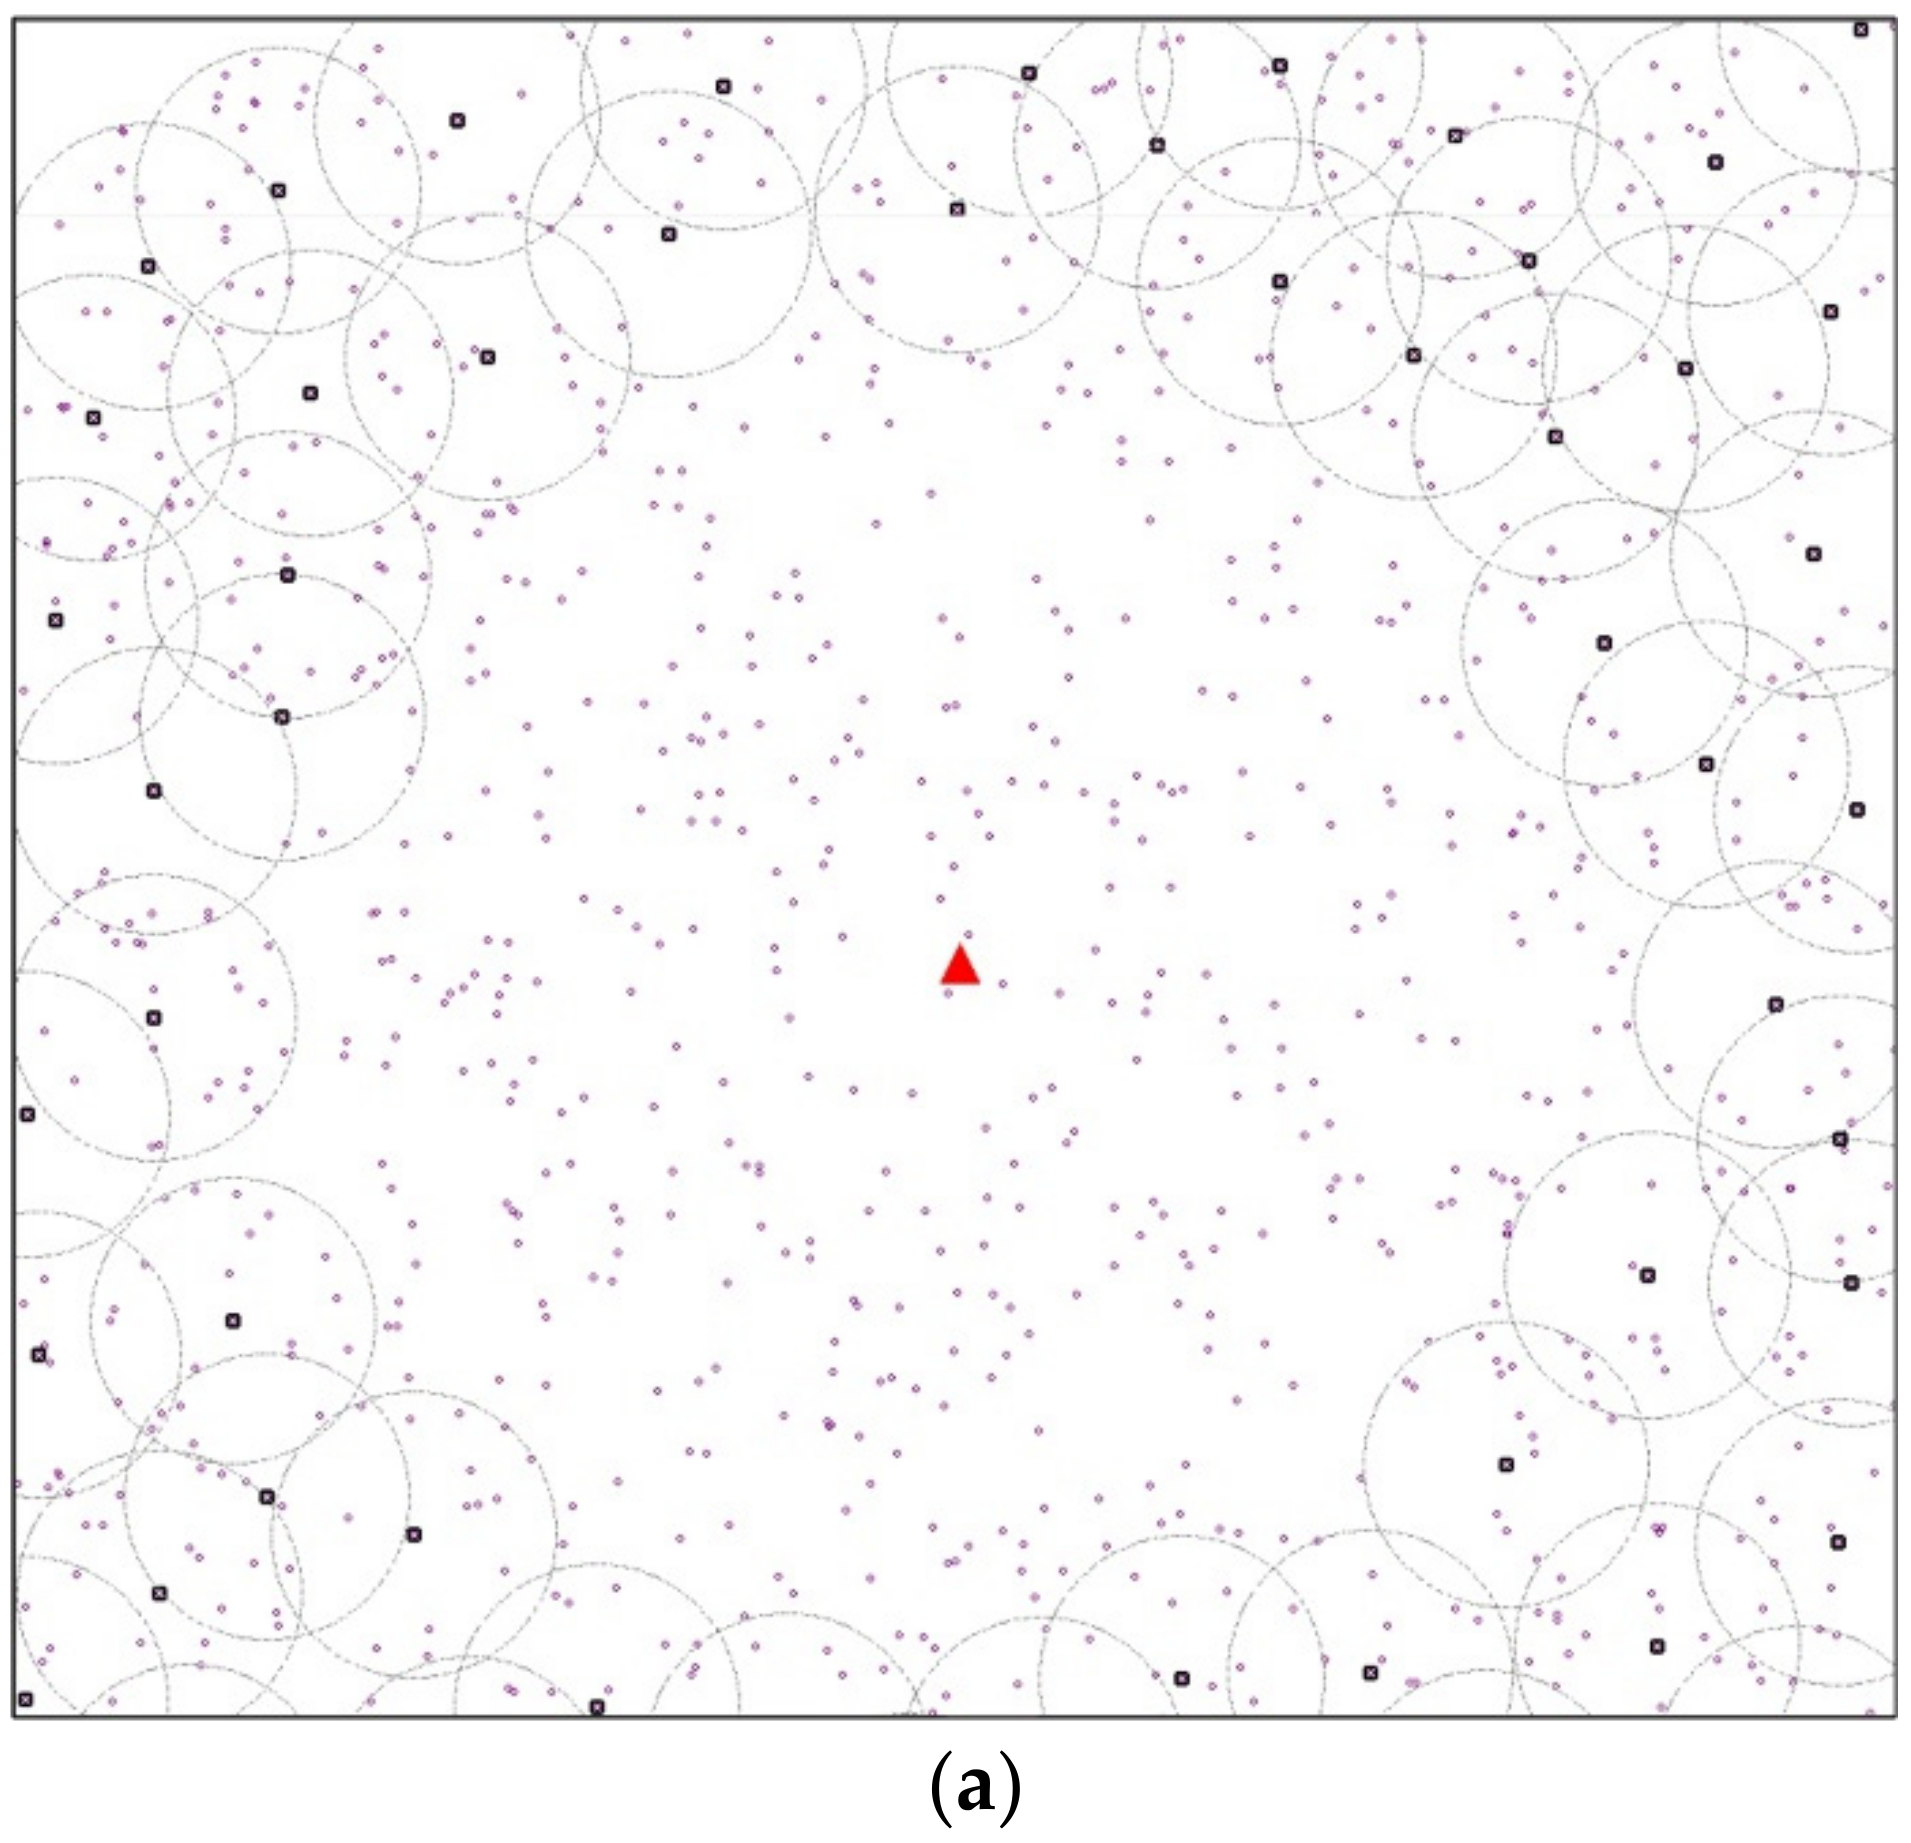
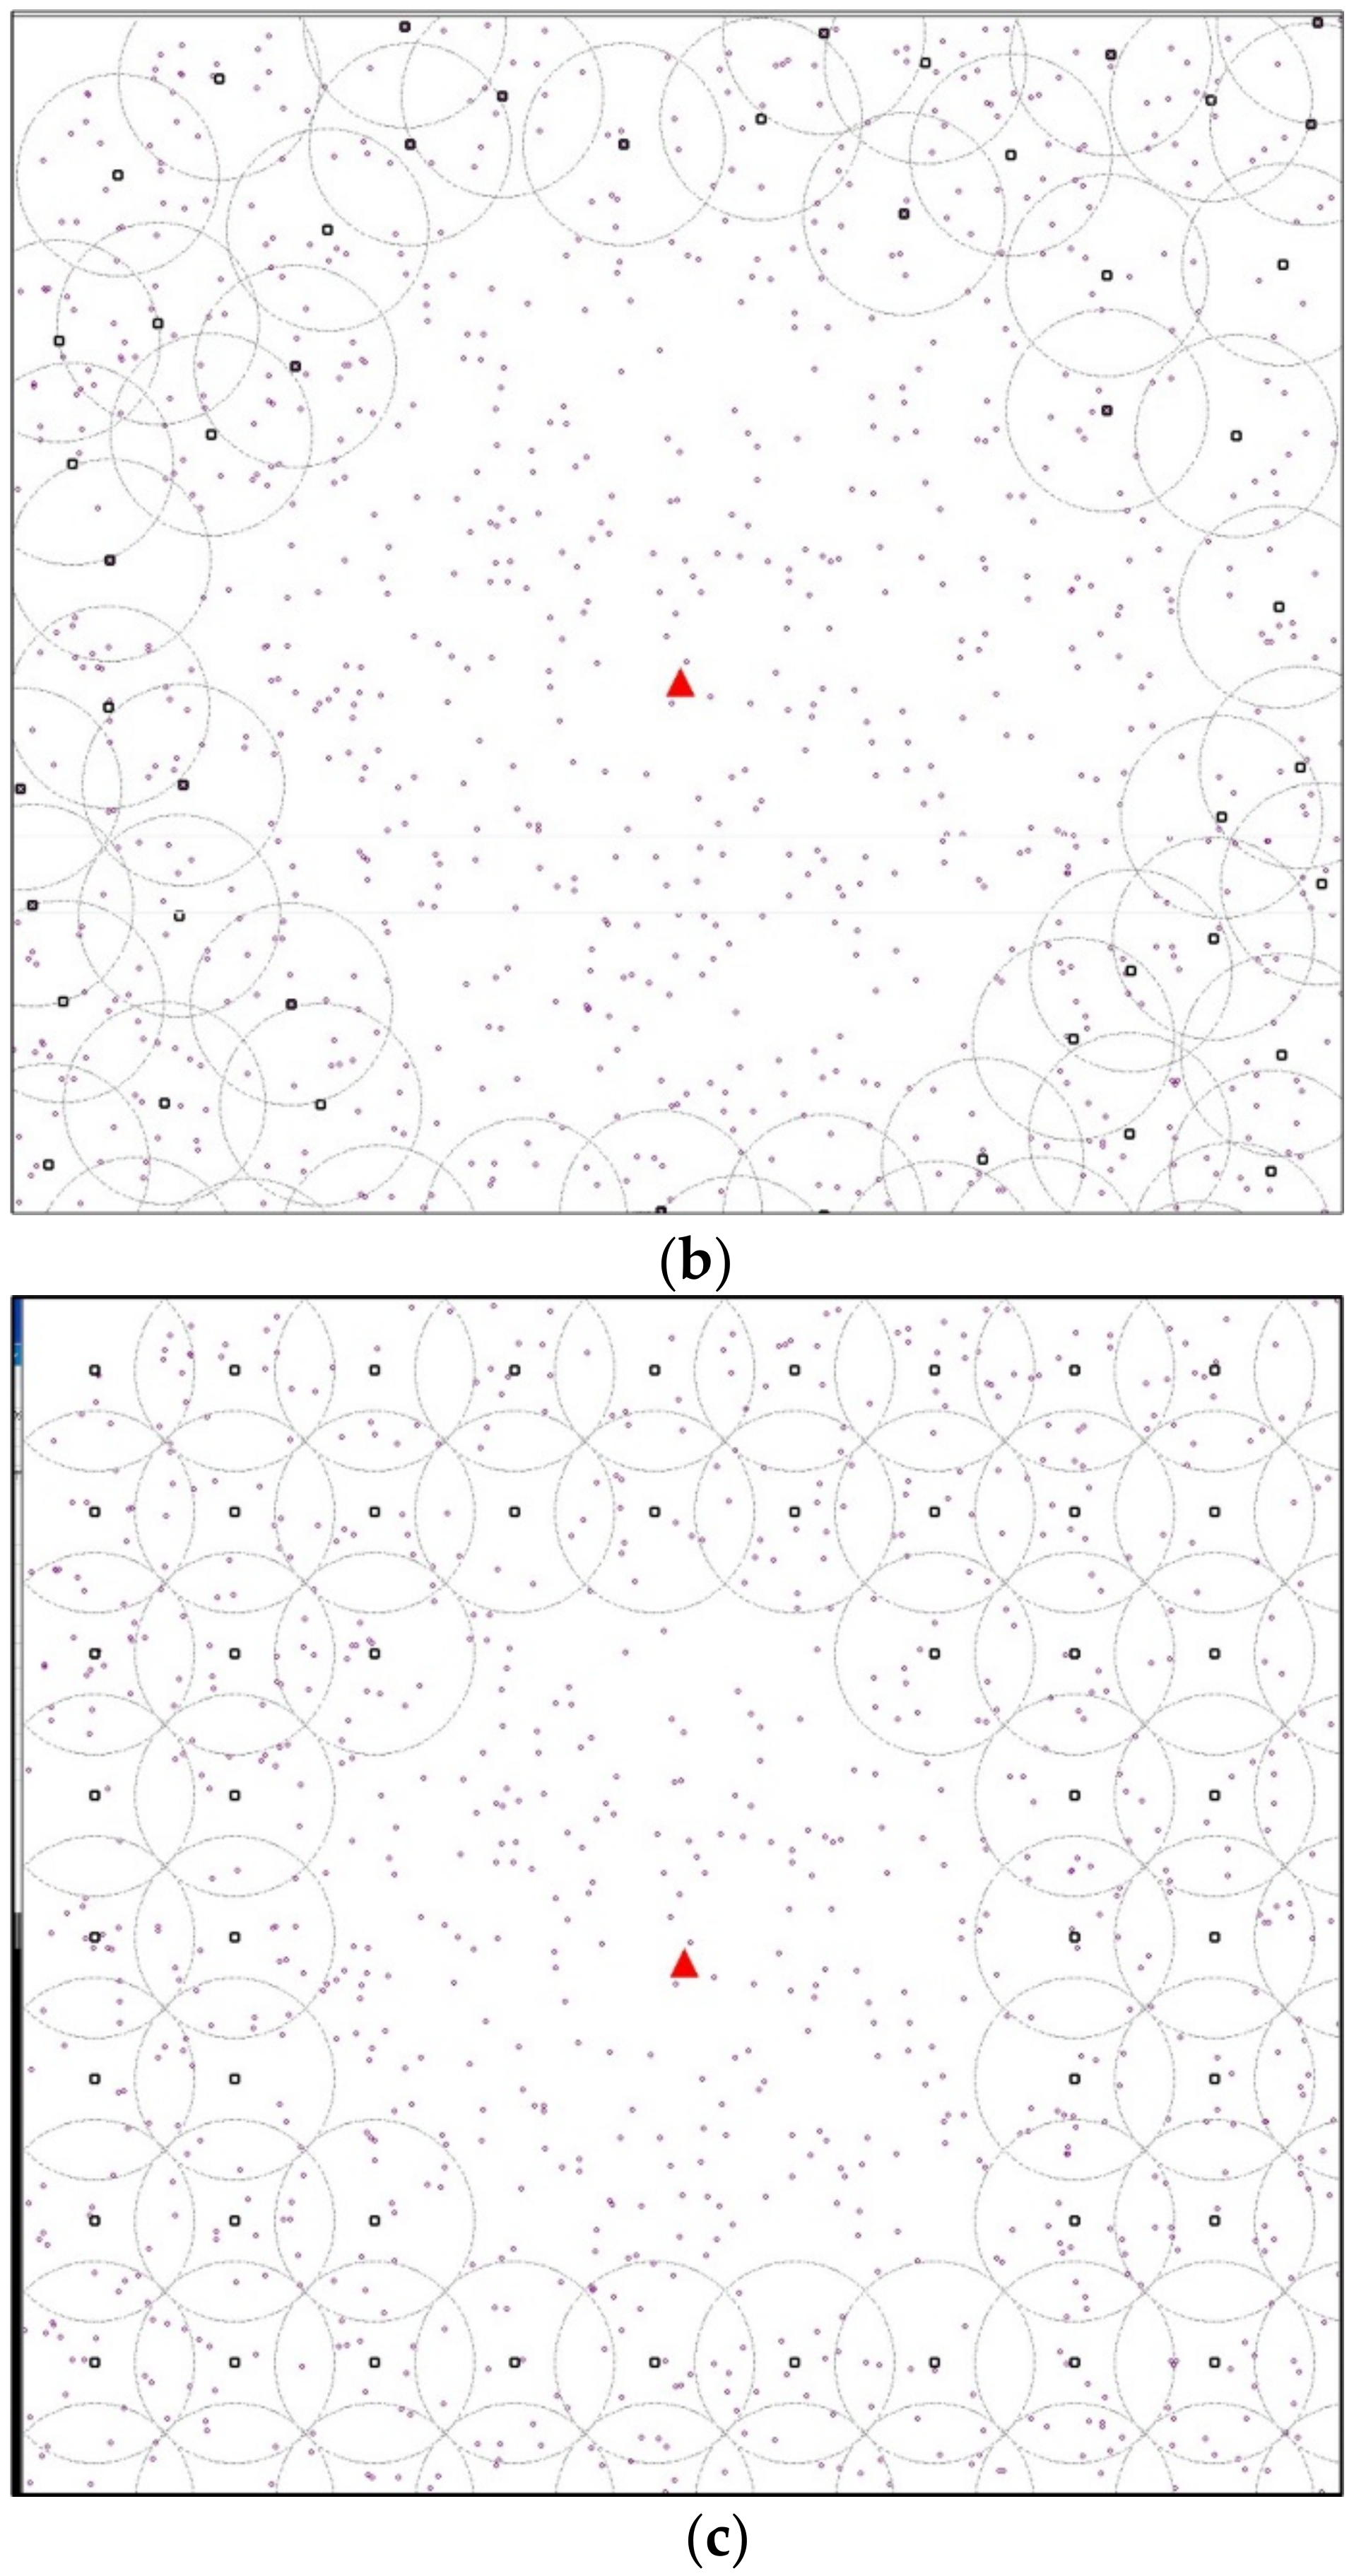
The simulations compared the greedy, K-mean, and static schemes by analyzing the impacts of various network parameters on the number of pads. First, the snapshots of the greedy, K-mean, and static schemes are depicted in Figure 8a–c. In these figures, the small black and purple circles represent pads and nodes, respectively. The red triangle is the BS. The large, gray dotted-line circles depict the flight range of drones from a pad. The deployed region size is set to 1000 × 1000 m, the number of nodes is 1000, the flight range of drones is Ddmax = 150 m, and the radius of the WCV region is 300 m. It can be seen that the positions and numbers of pads obtained by the three schemes are different, as shown in Figure 8a–c.
To investigate the impact of network density on the number of pads deployed, the number of sensor nodes varied between 500 to 1000 in the simulations, while the flight range of drones was Ddmax = 150 m and the radius of the WCV region was 300 m. In Figure 9, it can be seen that, when the number of nodes increased, the number of deployed pads also increased for all three proposed schemes. Let α, β, and γ denote the number of deployed pads of the greedy scheme, the K-mean scheme, and the static scheme, respectively. In Figure 9, the relationship between the three schemes in our simulations is as follows: α < β < γ.
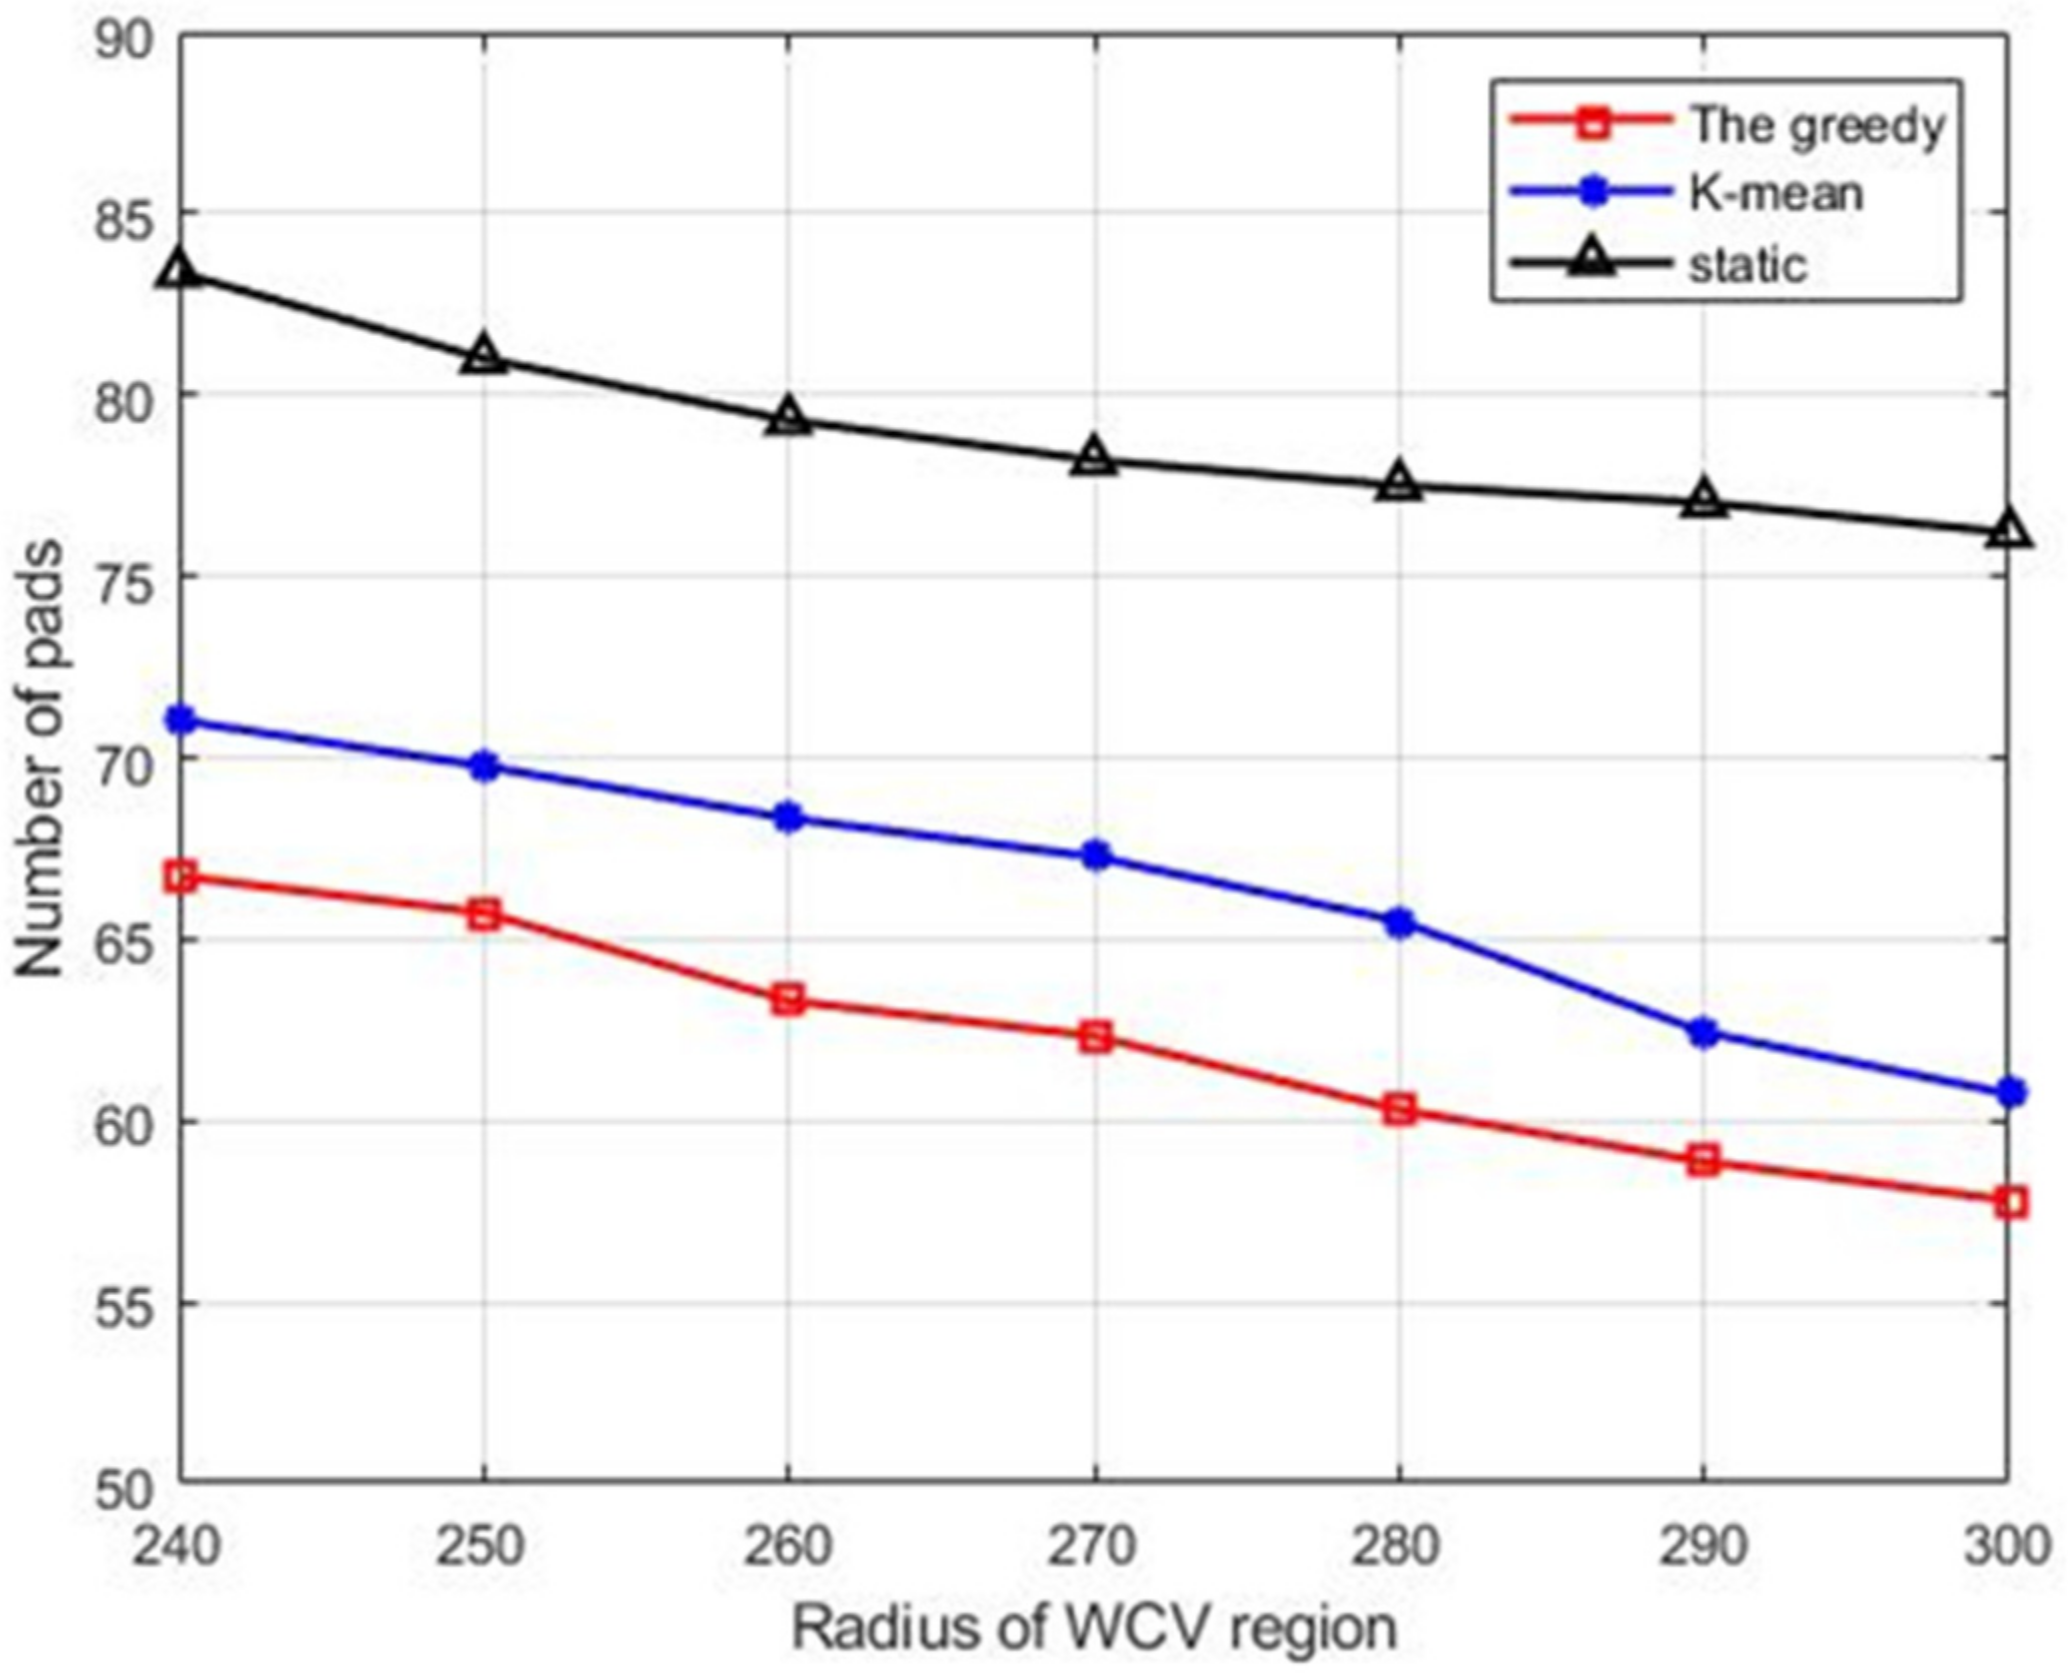
The impact of the WCV region size was analyzed by varying the radius of the WCV region from 240 to 300. For this purpose, the number of nodes was fixed at N = 1000 and the flight range was fixed at Ddmax = 150 m. The number of pads obtained by the three deployment schemes for different radii of the WCV region is depicted in Figure 10. In Figure 10, the number of pads decreased with the increasing radius of the WCV region. When the radius of the WCV region was larger, the drone region became smaller, so it required fewer pads. In addition, the number of pads obtained by the greedy scheme was the minimum. On the other hand, the number of pads obtained by the static scheme was the maximum.
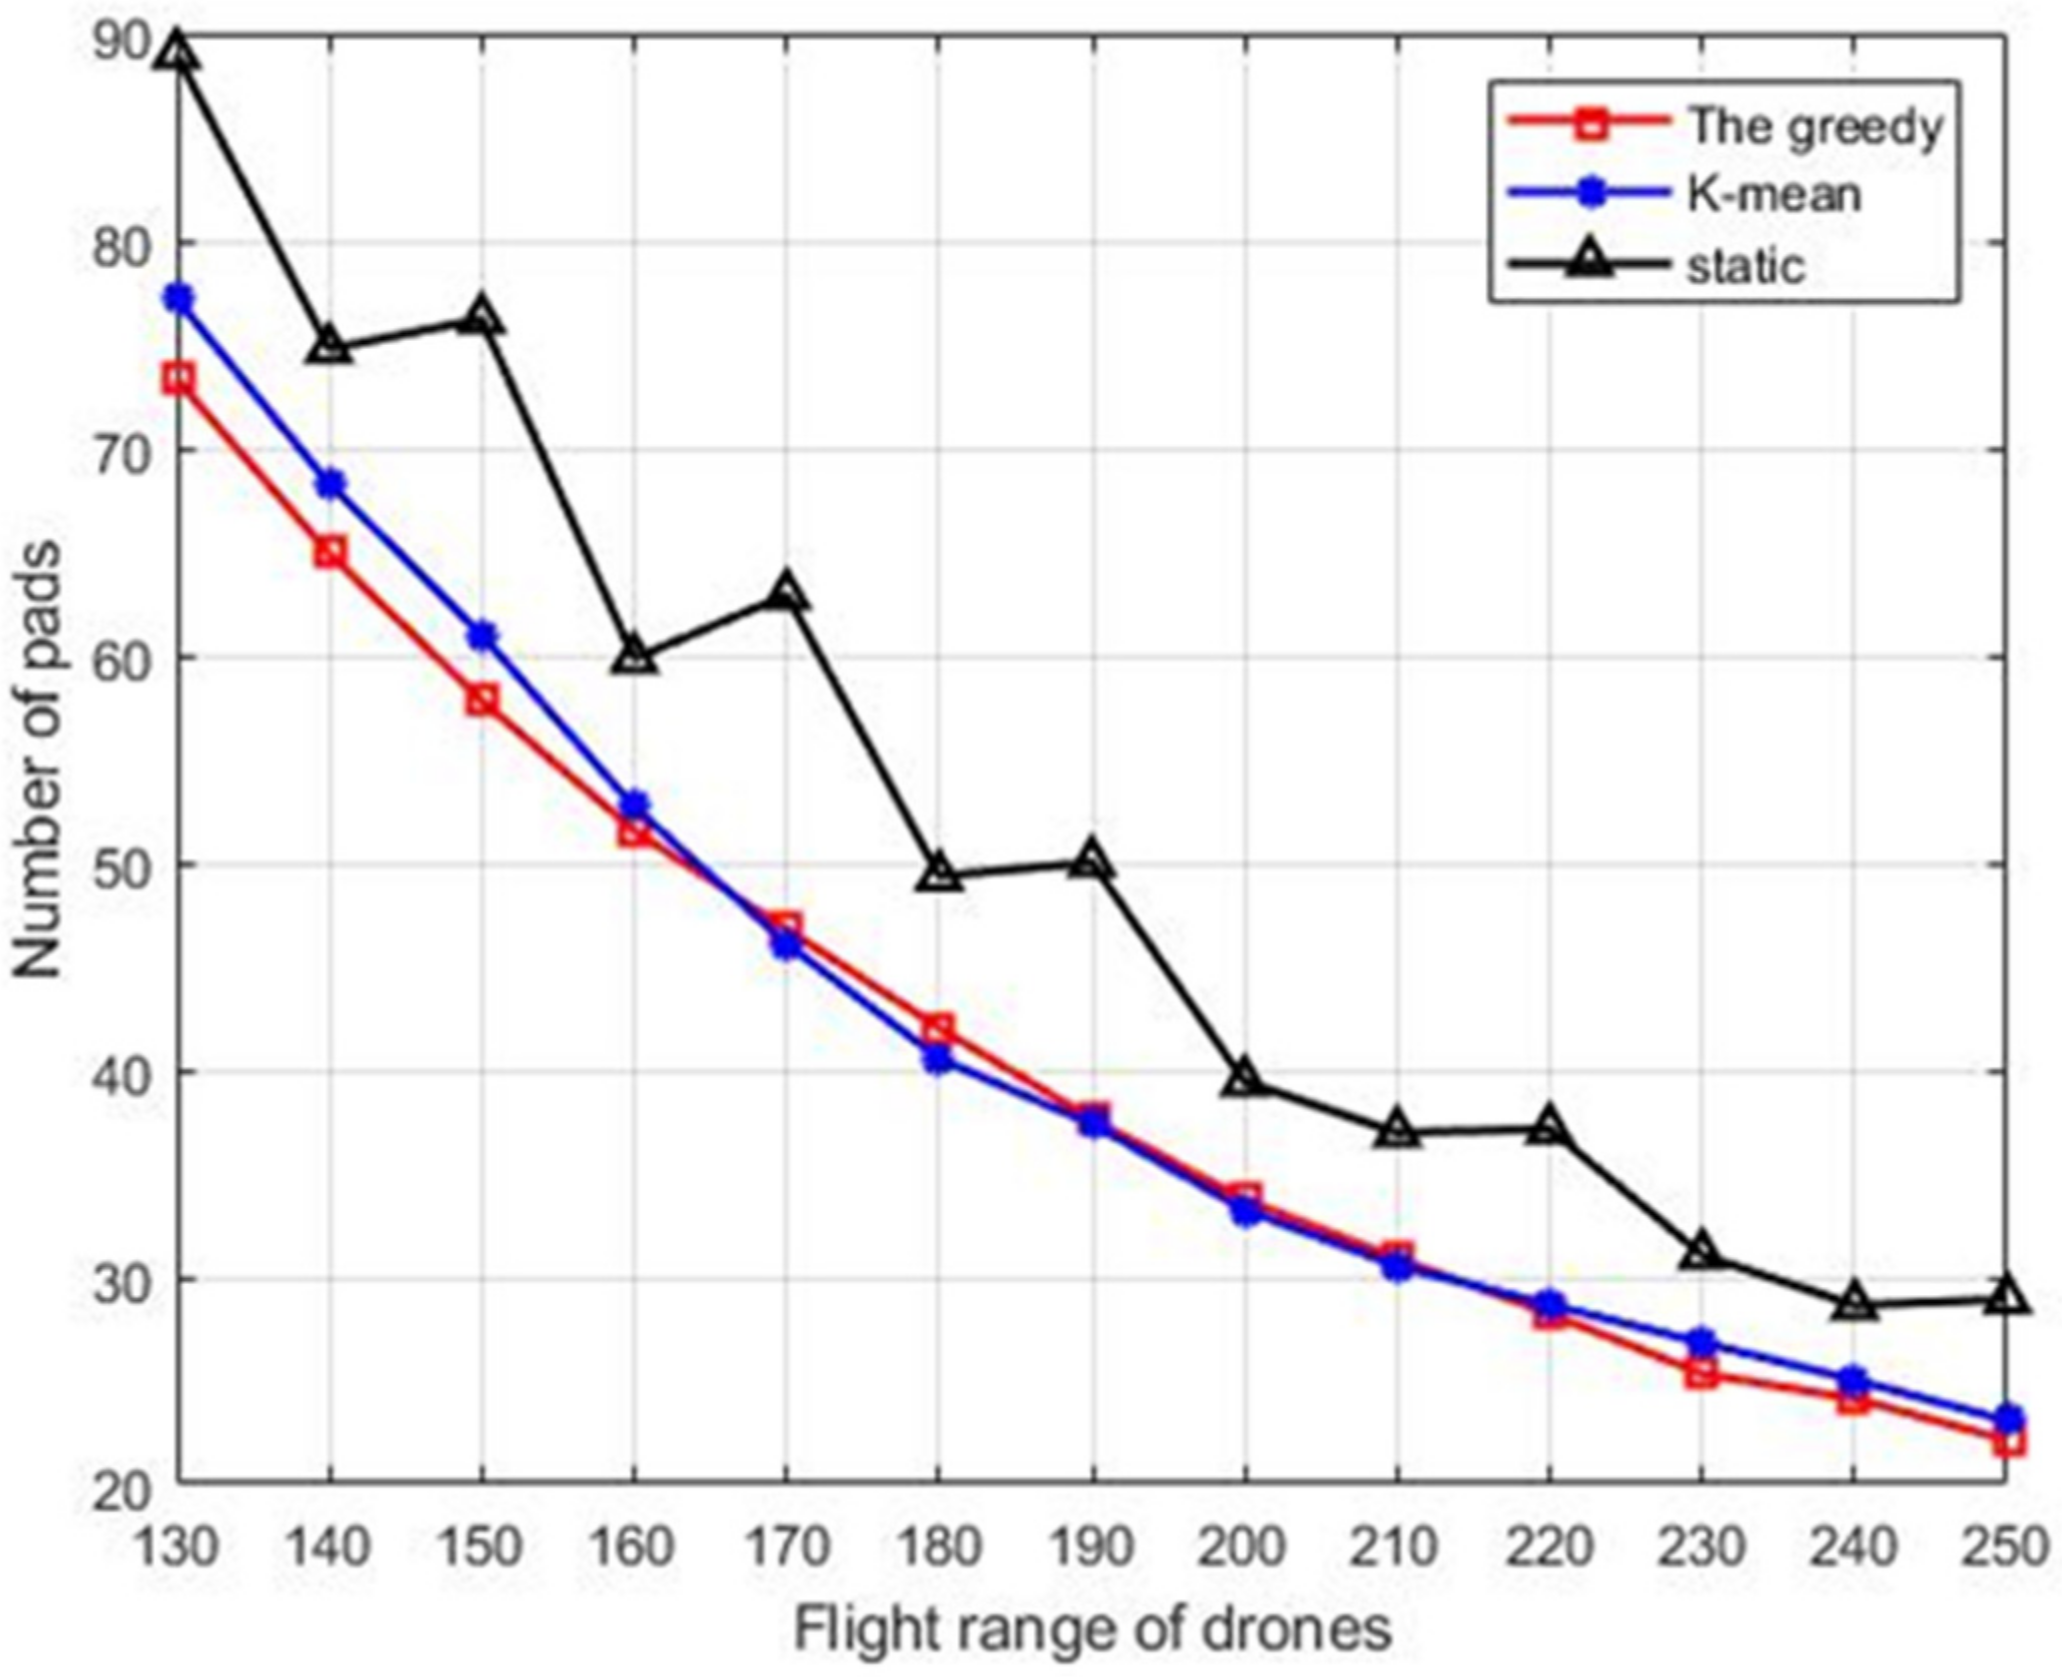
Figure 11 gives the number of pads derived by the three schemes for different values of flight range Ddmax. In this simulation, the number of sensor nodes was kept at N = 1000, and the radius of the WCV region was 300 m. The number of pads was computed by varying the flight range Ddmax from 130 to 250. In Figure 11, the number of pads decreased as the flight range Ddmax increased. In addition, the number of pads obtained by the greedy and K-mean schemes was generally lower than that obtained by the static scheme.

5.2. Performance of the Scheduling Based on Deployment Schemes

In this subsection, we conduct simulations to verify our collaborative charging scheduling based on the three proposed deployment schemes. The simulation parameters are shown in Table 4.
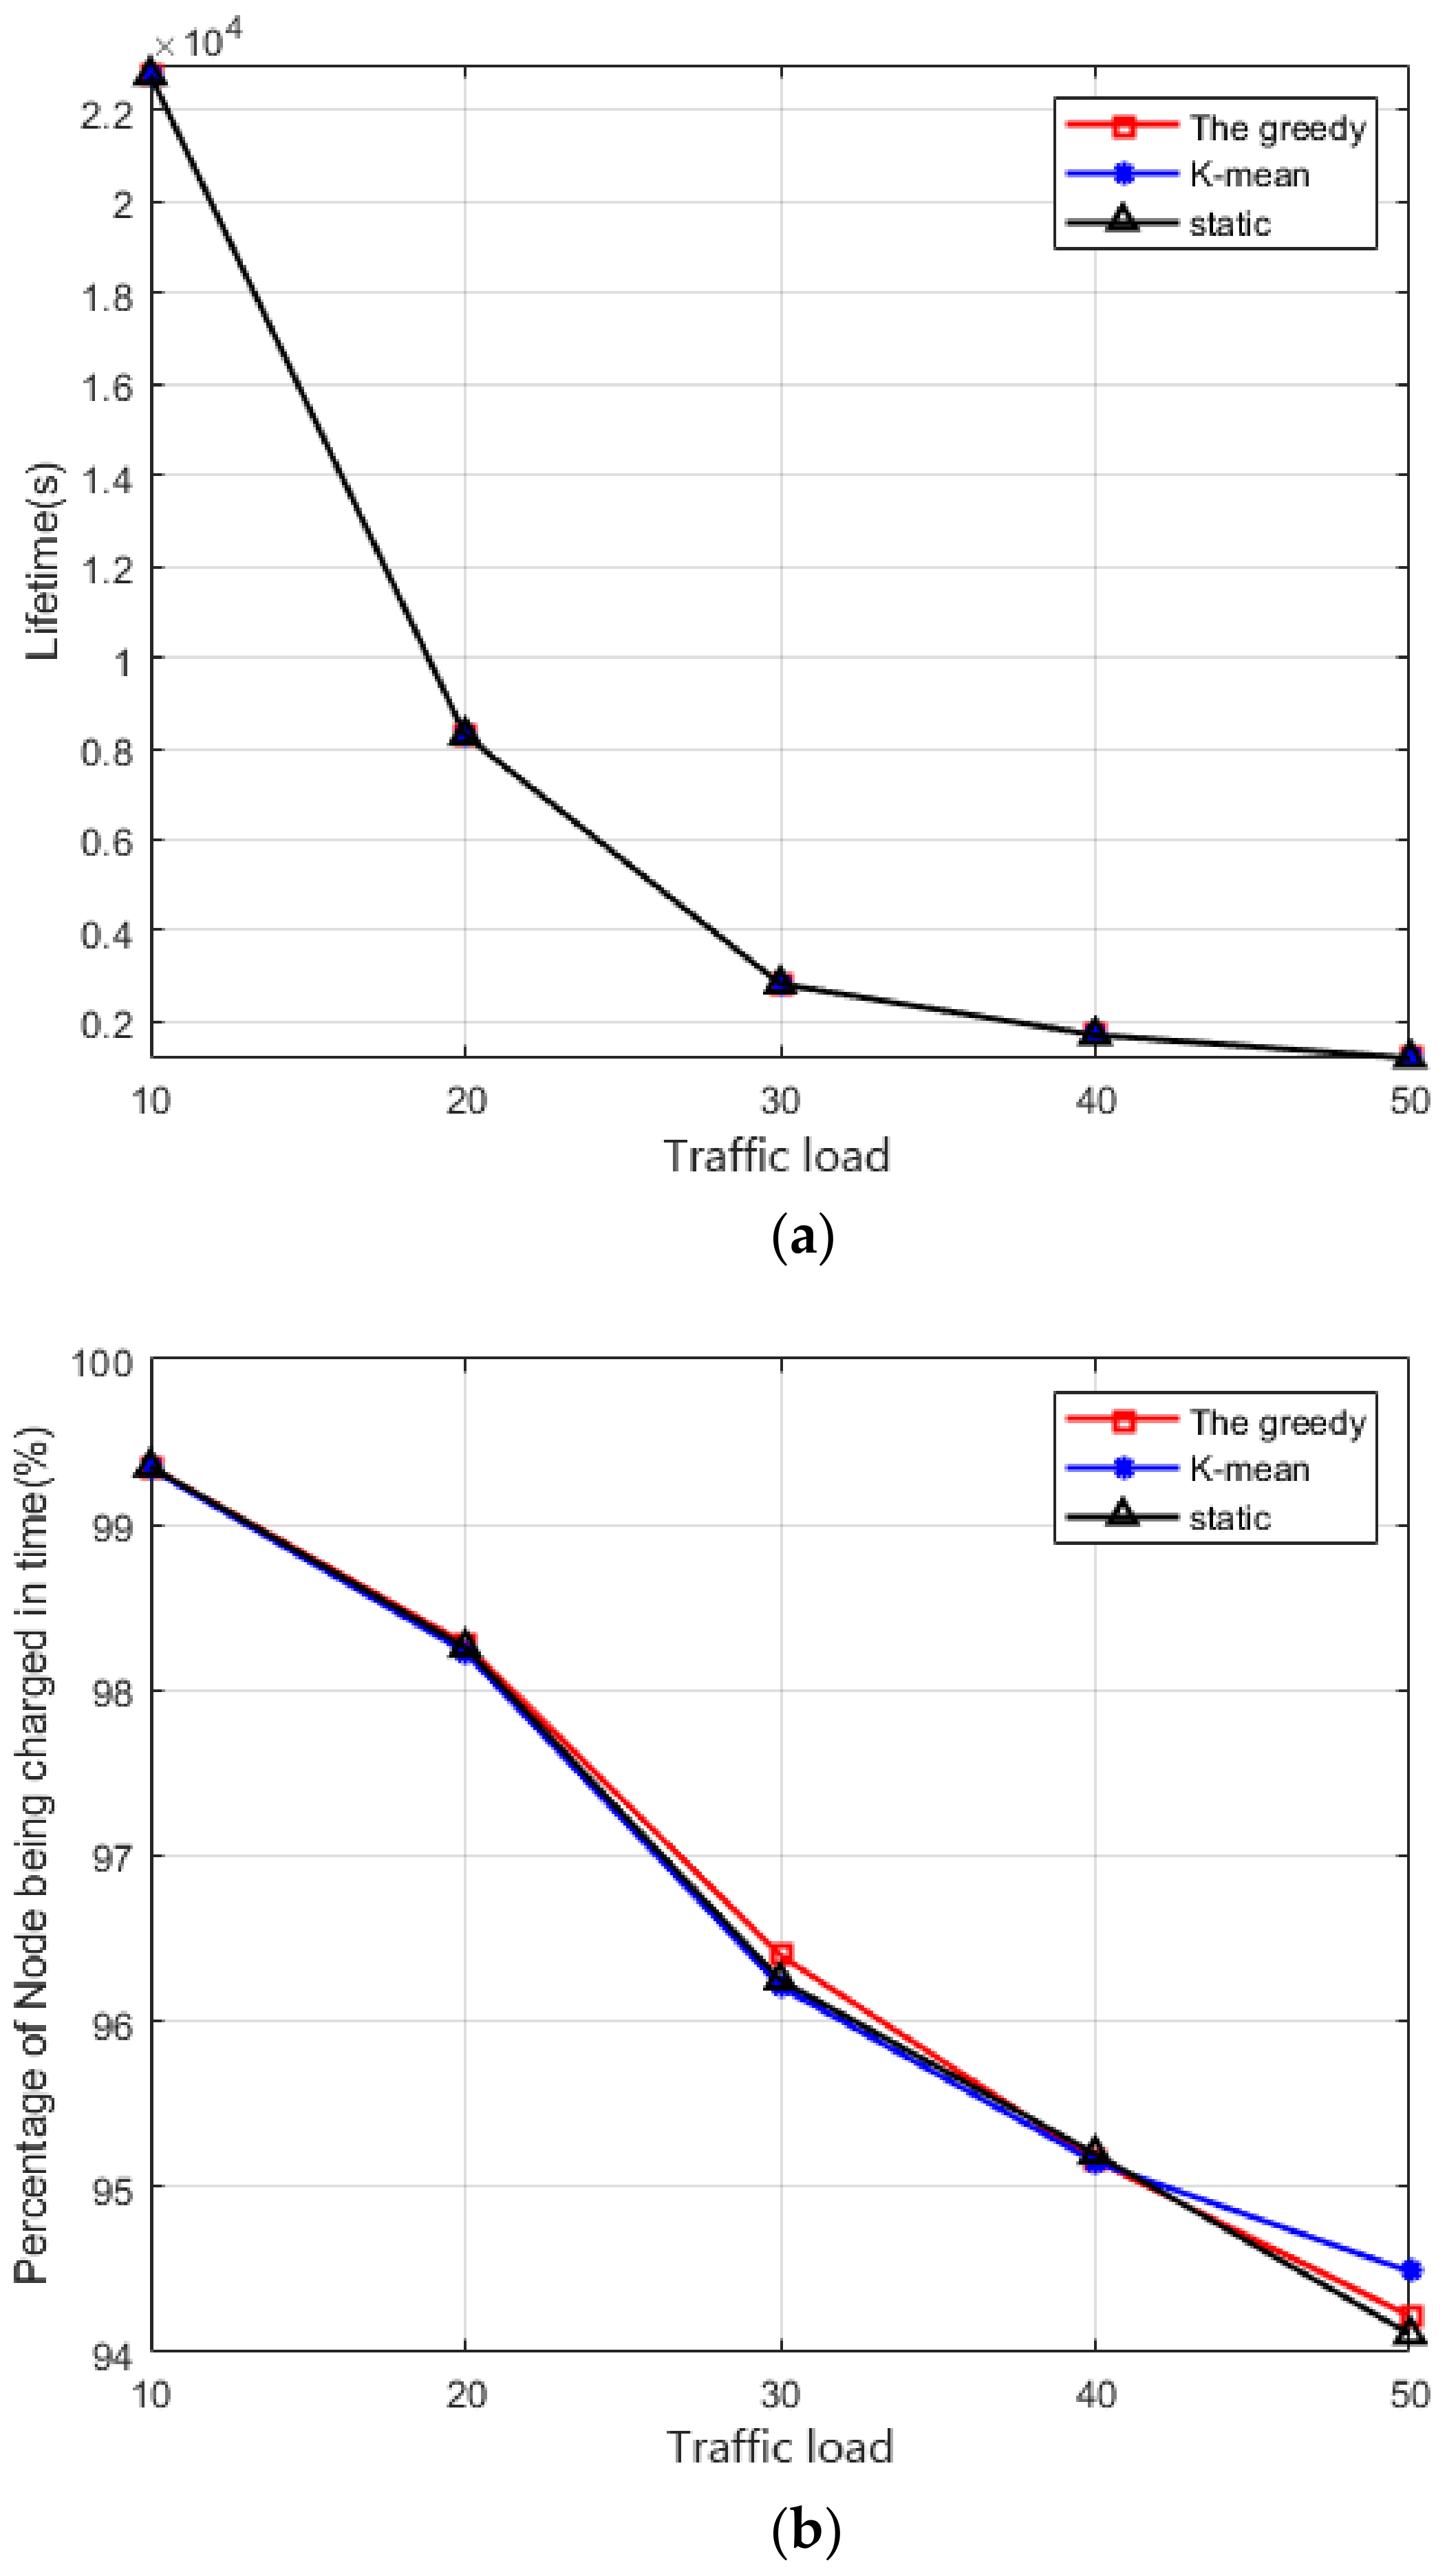
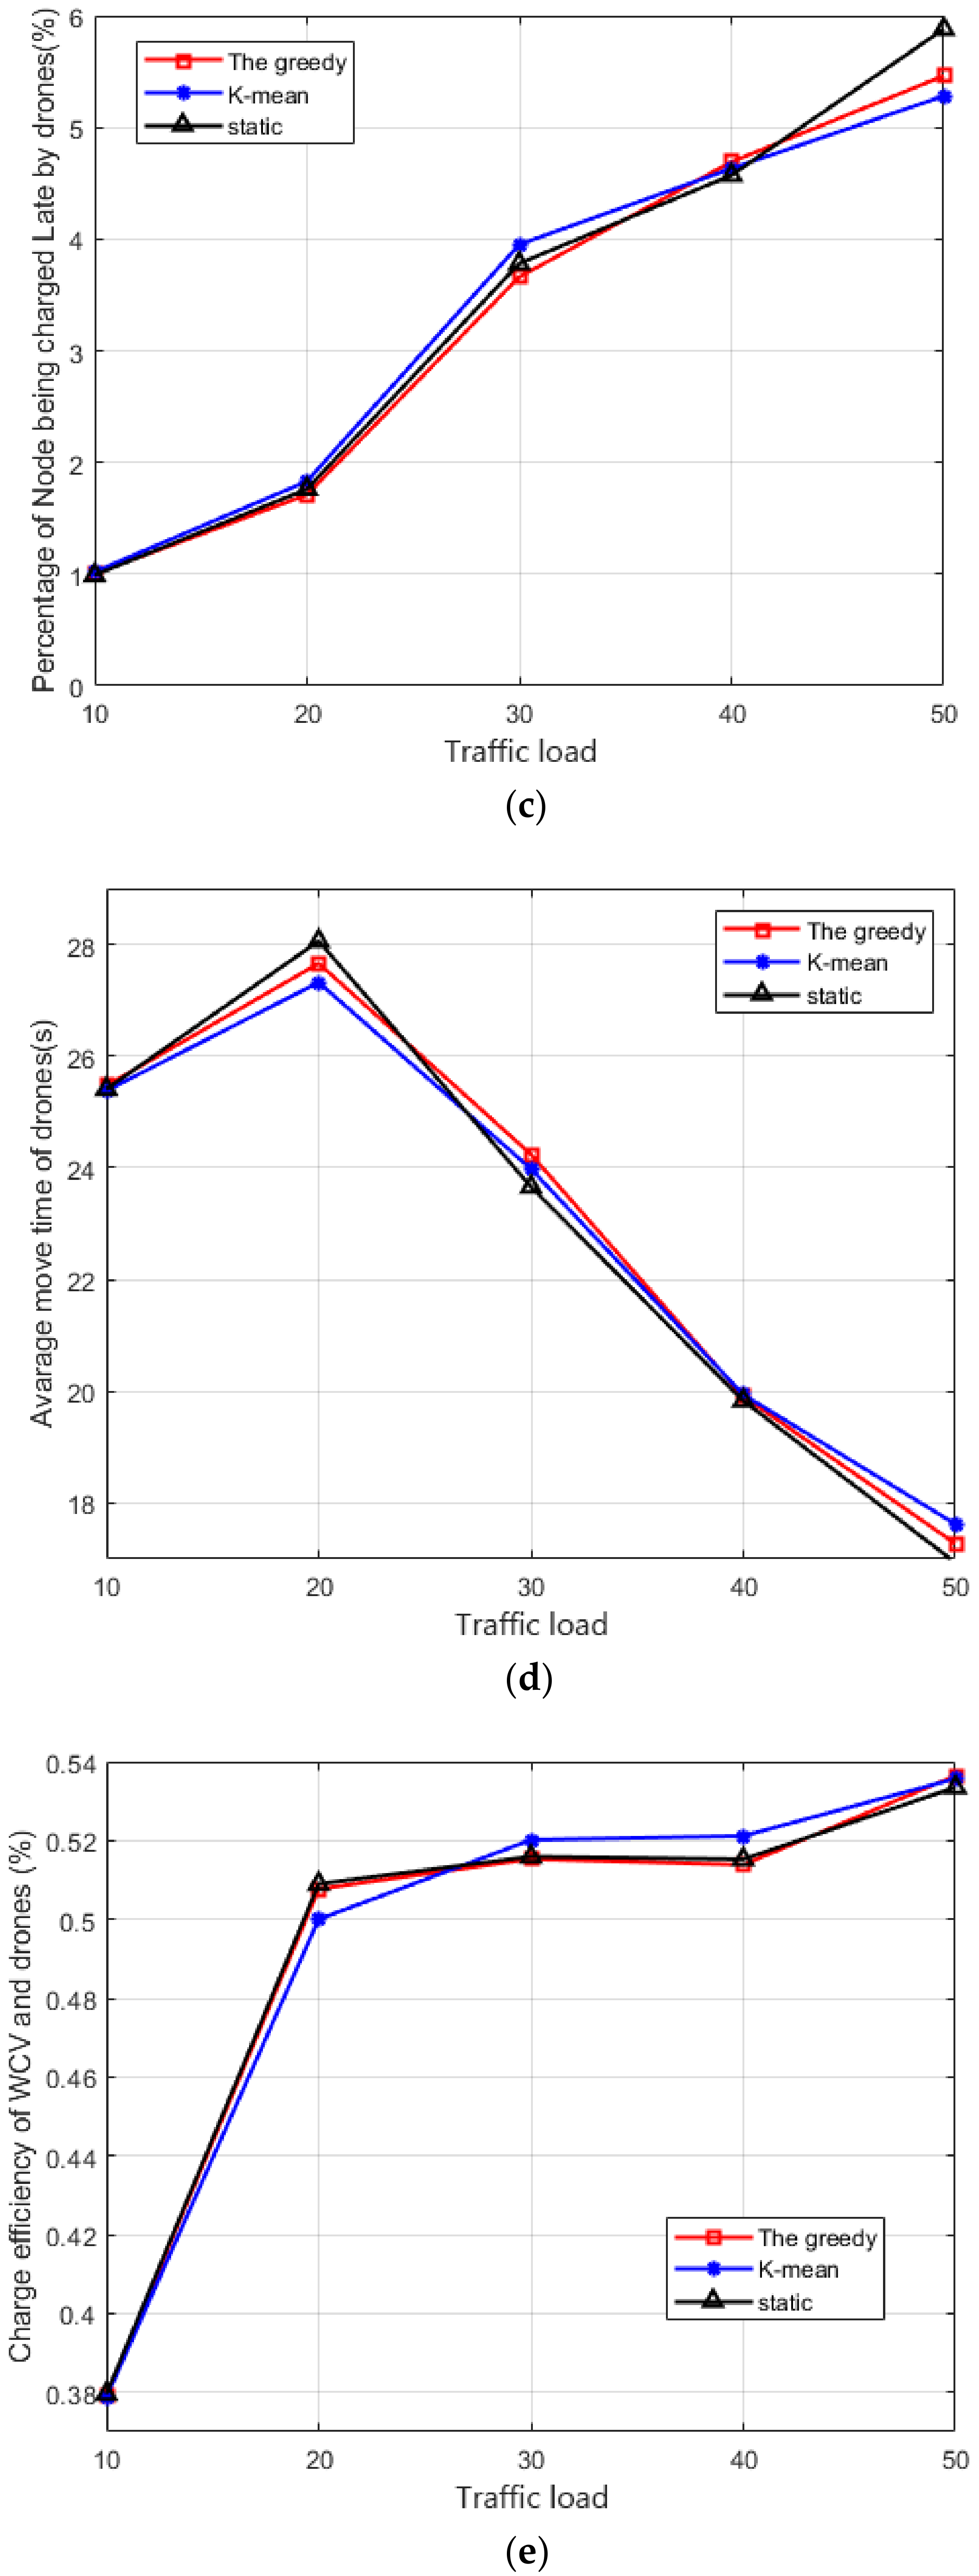
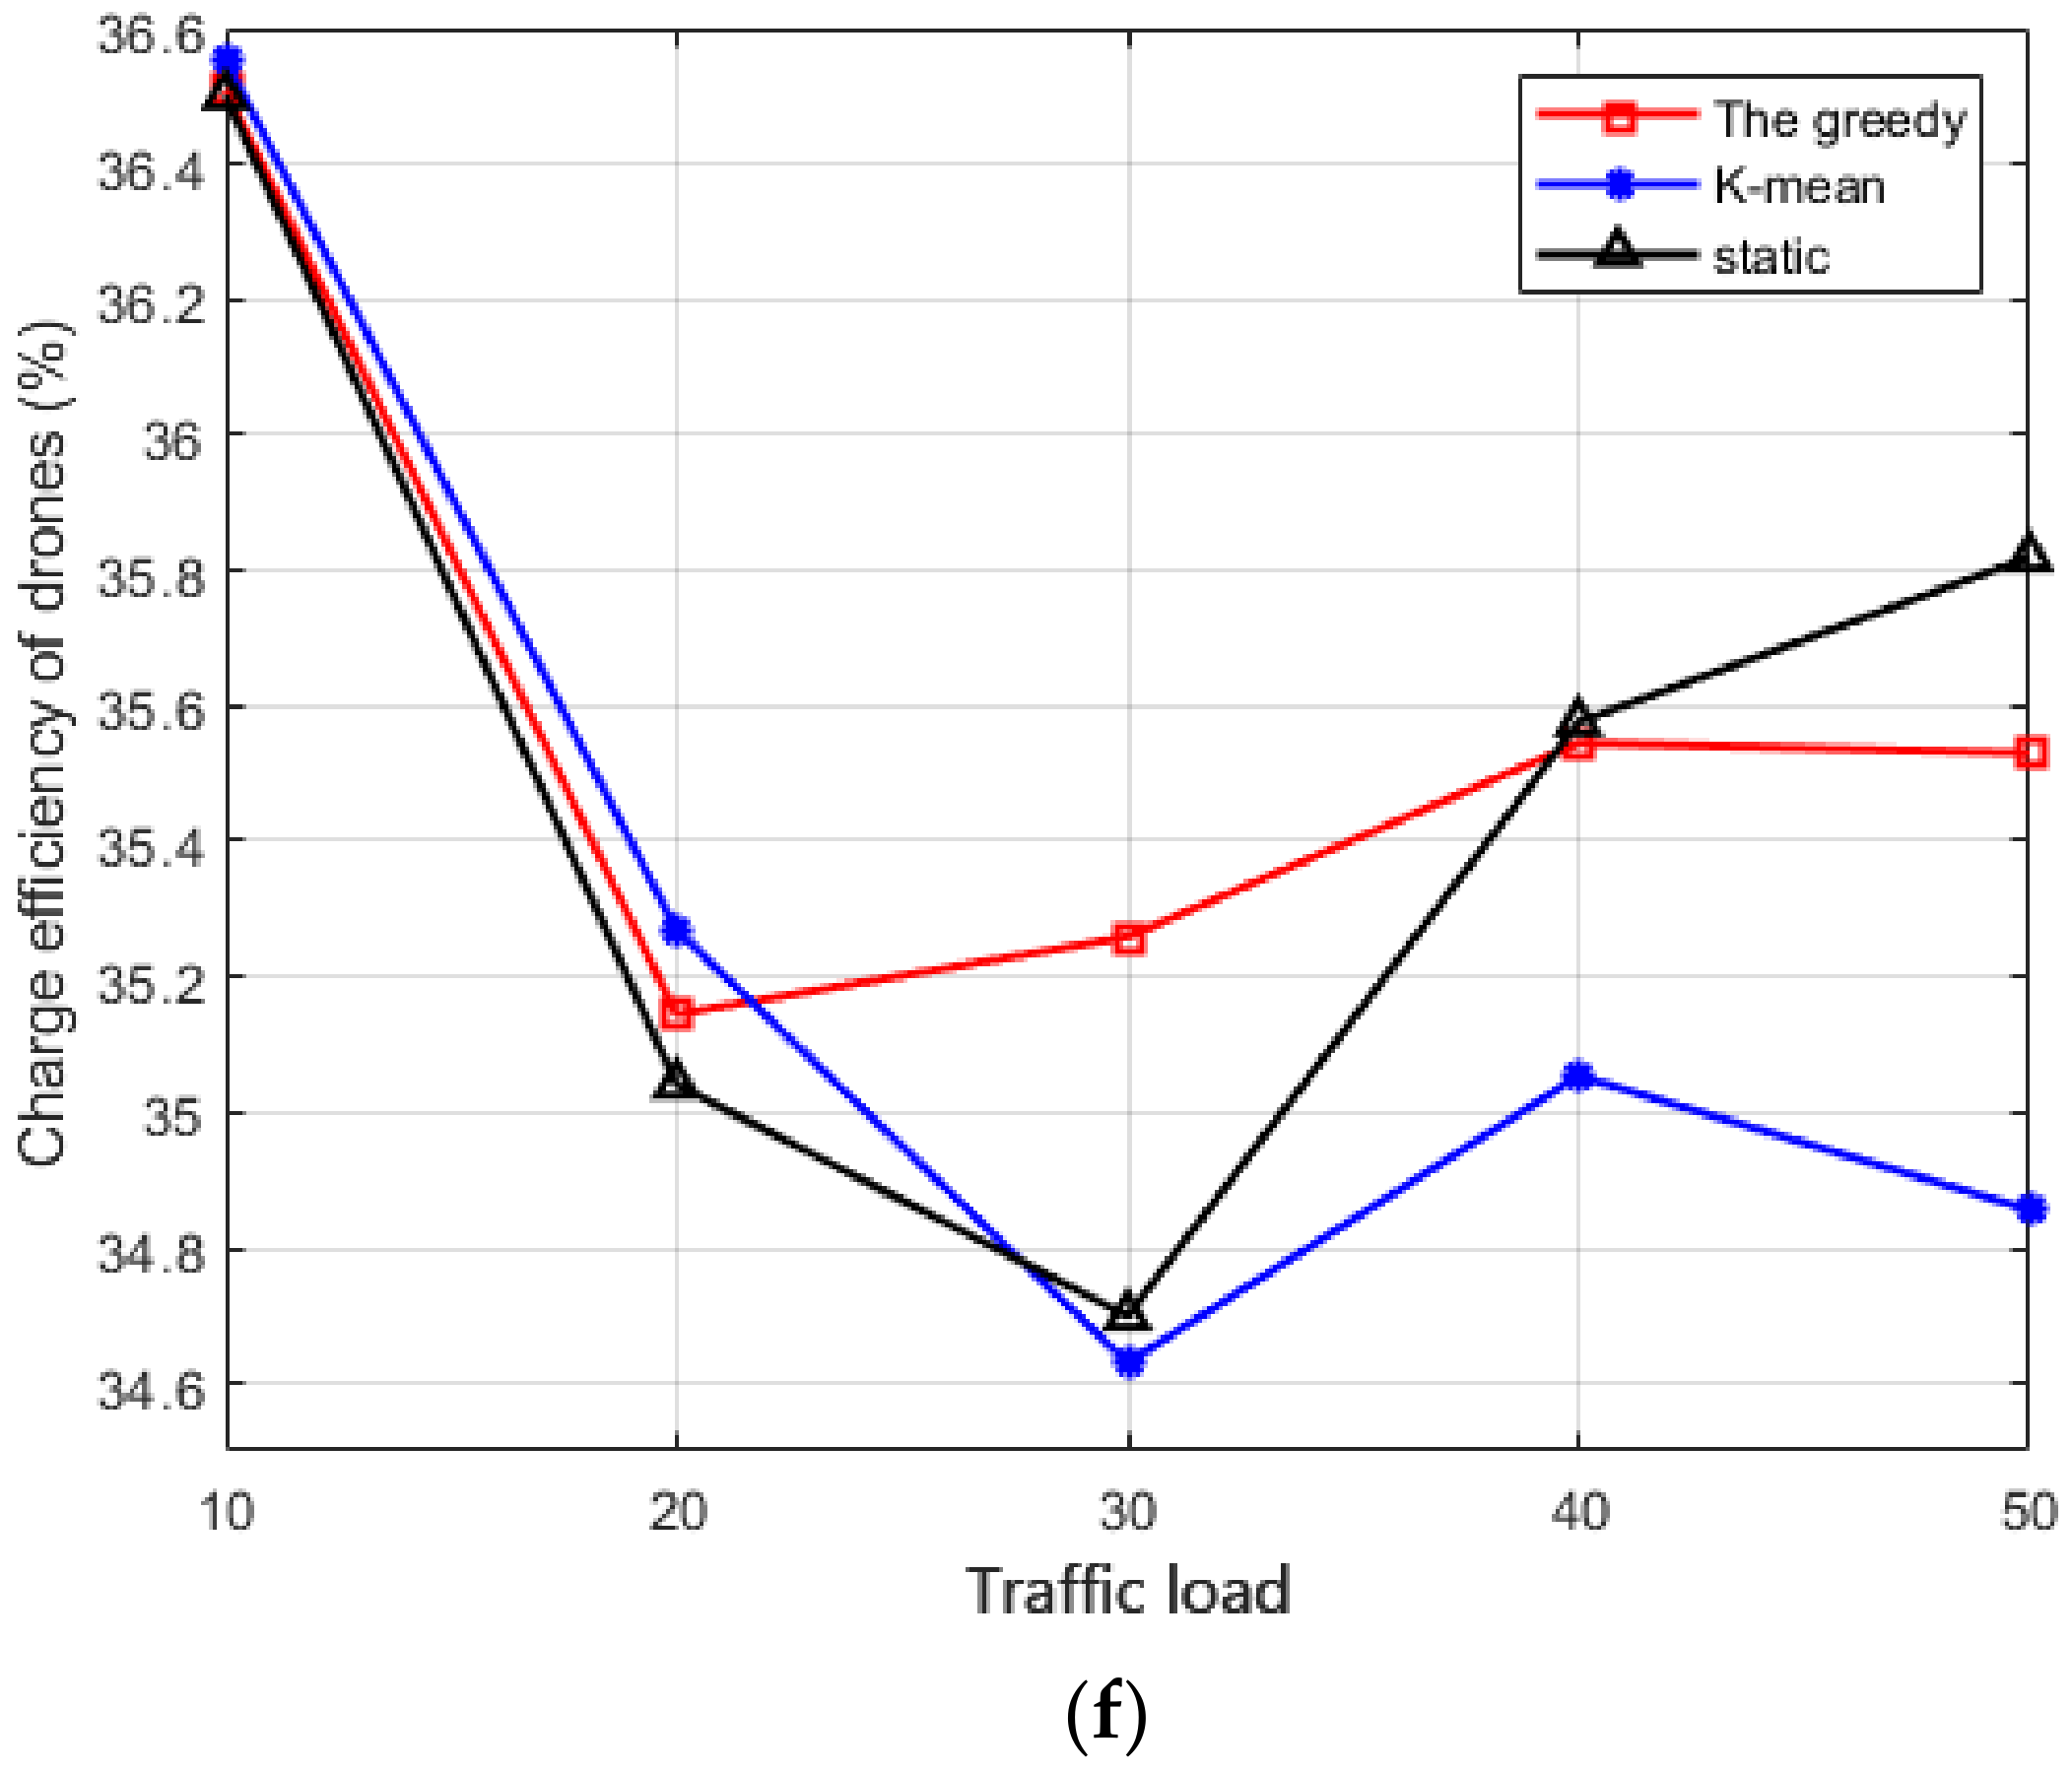
Figure 12a–f shows the simulation results under different traffic loads. With the increase of the traffic load, the lifetime, the percentage of nodes being charged in time, and the average move time of drones decrease, but the percentage of nodes being charged late by drones and the charge efficiency of all vehicles increase. However, the charge efficiency of drones stays at a relatively stable value, between 34.5 and 36.6. In Figure 12a, we can see that the lifetime curves overlap because the first dead node appears near the BS, which is assigned to the WCV. Then, in Figure 12b,c, the WRSN is too busy, which leads to more nodes not being charged in time. However, in Figure 12e, the busier the WRSN, the higher the charge efficiency. This is because a busier WRSN generates more charging requests; the WCV charges more nodes during one charging circle and consumes less energy on average for charging nodes or carrying drones. From Figure 12f, we can observe that the charge efficiency of drones is relatively stable due to the collaborative charging in our proposed design.

5.3. Statistical Validation

The simulation results were proven to be statistically significant by means of statistical description (in Table 5) and Fisher’s least significant difference (LSD) post hoc test (in Table 6) based on calculating the 95% confidence interval the for the mean difference. It can be observed in Table 5 (b–f) that the data from the simulation results were accurate as the standard deviation was small, but the standard deviation of lifetime was large because lifetime was decided by the first dead node, which was affected by the random node region distribution and its random energy consumption. In Table 6b–e, the performance is not remarkably different between the three schemes and there is almost no difference in lifetime from Table 6a. When the network is busy, the percentage of nodes being charged in time and the percentage of nodes being charged late by drones of K-mean is slightly better than that of the other two schemes, the moving time of drones of static is slightly superior to that of the other two schemes, and the charge efficiency of the greedy scheme is slightly superior to that of the other schemes. Then, in Table 6f, in the busy network, the charge efficiency of drones of the static scheme is significantly better than that of the K-mean scheme and slightly better than that of the greedy scheme.

6. Conclusions

In this work, we proposed a novel charging system for WRSN that uses one WCV, a set of WCV-carried drones, and several pads assisted by a drone to replenish energy in large and/or hostile areas. The sensors located in the WCV region are charged by the WCV, and those located in the drone-pad region are charged by drones, assisted by the pads. We have formulated a pad deployment problem to minimize the total number of pads under the limited flight range of the drones and proposed three approximation algorithms to tackle the problem. Then, based on the three pad deployment schemes, we further presented collaborative charging scheduling. The theoretical analysis and extensive simulations showed the efficiency and effectiveness of the proposed algorithms. The simulation results present that the number of pads obtained by the greedy and K-mean schemes was lower than that of the static scheme.
The proposed algorithms were mainly designed to solve the pad deployment problem based on the newly proposed WRSN model. However, we also further studied more effective and optimal schemes for the problem. In the future, more complex factors will be extrapolated under varying circumstances. The proposed WRSN model will be extended to a more complex scenario. Then, an efficient charging scheduling design in the proposed WRSN model will be taken into account. Moreover, multiple WCVs carrying a set of drones will also be studied in a vast and complex scenario, along with associated algorithms.
Drone-based radio and optical wireless communication systems can provide an effective, low-cost wireless connection [32]. Compared with the traditional radio and optical wireless communication platform, the low-altitude drone wireless communication system enjoys the advantages of rapid deployment, low cost, on-demand deployment, flexible configuration, and better communication channel quality due to short-range line-of-sight links. However, the high mobility and energy constraint of drones also need to be overcome. As a result, applying the proposed model to state-of-the-art radio and optical wireless communication systems seems promising and will be considered in future work.

Author Contributions

Conceptualization, J.-J.C. and C.-W.Y.; Formal analysis, J.-J.C.; Methodology, J.-J.C.; Validation, J.-J.C. and C.-W.Y.; Writing—original draft, J.-J.C.; Writing—review & editing, J.-J.C. and C.-W.Y. All authors have read and agreed to the published version of the manuscript.

Funding

This research was funded by the Natural Science Foundation of Fujian Province, China, grant number 2019J01795, and the Doctoral Scientific Research Foundation of Longyan University, China, grant number LB2021013.

Data Availability Statement

Not Applicable.

Conflicts of Interest

The funders had no role in the design of the study; in the collection, analysis, or interpretation of data; in the writing of the manuscript, or in the decision to publish the results.

Appendix A

Definition 1.
The pad deployment problem: given a WCV region and a set of sensors with their coordinates in the drone-pad region, the problem is to deduce the minimum number k of pads so that, for any sensor si in the drone-pad region, there exists at least one drone flight path that connects a sensor sapi in the WCV region to this sensor si in the drone-pad region.
Definition 2.
Given a sensor s and a fixed flight distance limit Ddmax, a flight path sapi = p0 → pj → pj+1 → … →pl → s is called available if, and only if, dist(pl, s) ≤ Ddmax/2 and dist(pj, pj+1) ≤ Ddmax (for 0 ≤ j ≤ l). Here, dist indicates the Euclidean distance function.
Definition 3.
The pad deployment with flight distance limit problem: given a WCV region, a set of sensor nodes with their coordinates in a drone-pad region, and the maximum flight distance limit, the problem is finding the minimum number of pads and their coordinates that result in one available drone flight path connecting a releasing stop sapi in the WCV region to this node si in the drone-pad region.
Definition 4.
Given a WCV region and a set of nodes with their coordinates in a drone-pad region, the pad cover problem is to find out the minimum number of pads {p1, p2, …, pK} under the following two conditions:
Condition (1):
For every si in S-SWCV, there exists at least a pj in {p1, p2, …, pK}, such that d(si, pj)≤ Ddmax/2. Here we say that pj covers si.
Condition (2):
The constructed graph G = (V, E) is divided into several connected subgraphs G1 = (V1, E1), G2 = (V2, E2), …, where V = V1 V2 … = {p1, p2, …, pK}, E = E1 E2 … and (pi, pj) ∈ Ez if, and only if, piVz and pjVz and dist(pi, pj) ≤ Ddmax.
Condition (1) guarantees that, for every sensor node s, there exists at least one nearby pad pi that supports extra energy for a drone to fly to sensor s for the assigned charging mission and then fly back to pi. Intuitively, the pad cover problem deploys the minimum number of disks (a circle with its radius Ddmax/2) to cover all sensor nodes. Here, a circle is used to represent a pad.
Condition (2) ensures the reachability of every deployed pad in each subregion of the drone-pad region for drones. Since the subgraphs of the constructed graph are connected, a drone in a subregion can fly from one pad to another, be recharged, and then fly to the target node. By repeating the above process, any pad in the same connected subgraph can be reached by a drone due to the connectivity of the underlying subgraphs (flight map) of the drone-pad region.
Theorem 1.
When Case 1 occurs, there exists a direct flight path from a releasing stop sapi in the WCV region to the node.
Proof of Theorem 1.
As shown in Figure A1, when the sensor node s is located within RWCV + Ddmax/2 from BS (the region between the dotted yellow circle and dotted green circle), obviously, the WCV can release a drone to launch directly from a releasing stop sap in the WCV region to charge the node and then fly back to the sap. □
Figure A1. There exists a direct flight path from a releasing stop in the WCV region to the target node (Case 1).
Energies 15 02256 g0a1
Theorem 2.
When Case 2 occurs, there exists an available flight path from a sapi to the node s if, and only if, the node s is covered at least by one pad that is located between RWCV + Ddmax/2 and RWCV + Ddmax from BS.
Proof of Theorem 2.
For a single request from a node si located between RWCV + Ddmax/2 and RWCV + Ddmax (Figure A2, the region between the dotted green circle and dotted purple circle) in the drone-pad region, the drone cannot fly to the node because, if the drone flies to the node directly, its residual energy cannot support its return to sap in the WCV region (the yellow dotted arrow in Figure A2).
Figure A2. There exists an available flight path from a releasing stop to the target node which is covered by a pad located in a ring area surrounding the WCV region (Case 2).
Energies 15 02256 g0a2
If the node is covered by a pad (pi in Figure A2—the dotted blue circle indicates the cover range of pi) located between RWCV and RWCV + Ddmax from BS (Figure A2, the region between the dotted yellow circle and dotted purple circle), then there exists an available flight path sappispisap (the red dotted arrow in Figure A2). □
Theorem 3.
When Case 3 occurs, there is an available flight path from a releasing stop sap to the sensor node s if, and only if, the node is covered at least by one pad that has a connecting path to one pad deployed between RWCV and RWCV + Ddmax from BS.
Proof of Theorem 3.
When Case 3 occurs, suppose node s is covered by a pad pj that has not completed a path to a pad located between RWCV and RWCV + Ddmax from BS (Figure A3, the region between the dotted yellow circle and dotted purple circle). Obviously, a drone cannot launch from a stop sap in the WCV region to s. Conversely, if the covered pad pj has a path to a pad located between RWCV and RWCV + Ddmax from BS, then there exists an available flight path from sap to s (the red dotted arrow in Figure A3). □
Figure A3. There exists an available flight path from a releasing stop to the target node that is covered by a pad and connected by pads located in an area outside the WCV region (Case 3).
Energies 15 02256 g0a3

References

  1. Lazarescu, M.T. Design and Field Test of a WSN Platform Prototype for Long-Term Environmental Monitoring. Sensors 2015, 15, 9481–9518. [Google Scholar] [CrossRef] [Green Version]
  2. Muñoz-Gea, J.P.; Manzanares-Lopez, P.; Malgosa-Sanahuja, J.; Garcia-Haro, J. Design and implementation of a P2P communication infrastructure for WSN-based vehicular traffic control applications. J. Syst. Architect. 2013, 59, 923–930. [Google Scholar] [CrossRef]
  3. Liu, X.; Liu, A.; Li, Z.; Tian, S.; Choi, Y.; Sekiya, H.; Li, J. Distributed cooperative communication nodes control and optimization reliability for resource-constrained WSNs. Neurocomputing 2017, 270, 122–136. [Google Scholar] [CrossRef]
  4. Temene, N.; Sergiou, C.; Georgiou, C.; Vassiliou, V. A survey on mobility in wireless sensor networks. Ad Hoc Netw. 2022, 125, 102726. [Google Scholar] [CrossRef]
  5. Gao, X.; Fan, J.; Wu, F.; Chen, G. Cooperative sweep coverage problem with mobile sensors. IEEE Trans. Mobile Comput. 2022, 21, 480–494. [Google Scholar] [CrossRef]
  6. Yogi, A.Y.; Noritaka, S.; Hiromi, M. Multiple Route Construction with Path-overlap Avoidance for Mobile Relay on WSN. Eng. Lett. 2015, 23, 299–306. [Google Scholar]
  7. Yalçın, S.; Erdem, E. BTA-MM: Burst traffic awareness-based adaptive mobility model with mobile sinks for heterogeneous wireless sensor networks. ISA Trans. 2021. [Google Scholar] [CrossRef]
  8. Lu, Y.; Sun, N.; Pan, X. Mobile sink-based path optimization strategy in wireless sensor networks using artificial bee colony algorithm. IEEE Access 2019, 7, 11668–11678. [Google Scholar] [CrossRef]
  9. Khedr, A.M.; Al Aghbari, Z.; Khalifa, B.E. Fuzzy-based multi-layered clustering and ACO-based multiple mobile sinks path planning for optimal coverage in WSNs. IEEE Sens. J. 2022, 1. [Google Scholar] [CrossRef]
  10. Al-Kaseem, B.R.; Taha, Z.K.; Abdulmajeed, S.W.; Al-Raweshidy, H.S. Optimized energy—Efficient path planning strategy in WSN with multiple mobile sinks. IEEE Access 2021, 9, 82833–82847. [Google Scholar] [CrossRef]
  11. Al-Behadili, H.A.; AlWane, S.K.; Al-Yasir, Y.I.; Parchin, N.O.; Olley, P.; Abd-Alhameed, R.A. Use of multiple mobile sinks in wireless sensor networks for large-scale areas. IET Wirel. Sens. Syst. 2020, 10, 175–180. [Google Scholar] [CrossRef]
  12. Zhang, Z.; Glaser, S.; Bales, R.; Conklin, M.; Rice, R.; Marks, D. Insights into mountain precipitation and snowpack from a basin-scale wireless-sensor network. Water Resour. Res. 2017, 53, 6626–6641. [Google Scholar] [CrossRef]
  13. Faustine, A.; Mvuma, A.N.; Mongi, H.J.; Gabriel, M.C.; Tenge, A.J.; Kucel, S.B. Wireless Sensor Networks for Water Quality Monitoring and Control within Lake Victoria Basin: Prototype Development. Wirel. Sens. Netw. 2014, 06, 281–290. [Google Scholar] [CrossRef]
  14. Lee, H.-S.; Kim, D.-Y.; Lee, J.-W. Radio and Energy Resource Management in Renewable Energy-Powered Wireless Networks with Deep Reinforcement Learning. IEEE Trans. Wirel. Commun. 2022, 1. [Google Scholar] [CrossRef]
  15. Zareei, M.; Vargas-Rosales, C.; Villalpando-Hernandez, R.; Azpilicueta, L.; Anisi, M.H.; Rehmani, M.H. The effects of an Adaptive and Distributed Transmission Power Control on the performance of energy harvesting sensor networks. Comput. Netw. 2018, 137, 69–82. [Google Scholar] [CrossRef] [Green Version]
  16. Bao, X.; Han, L.; He, X.; Tan, W.; Fan, T. Optimizing Maximum Monitoring Frequency and Guaranteeing Target Coverage and Connectivity in Energy Harvesting Wireless Sensor Networks. Mob. Inf. Syst. 2019, 2019, 6312589. [Google Scholar] [CrossRef] [Green Version]
  17. Jin, Y.; Xu, J.; Wu, S.; Xu, L.; Yang, D.; Xia, K. Bus network assisted drone scheduling for sustainable charging of wireless rechargeable sensor network. J. Syst. Architect. 2021, 116, 102059. [Google Scholar] [CrossRef]
  18. Chen, J.; Yu, C.W.; Ouyang, W. Efficient Wireless Charging Pad Deployment in Wireless Rechargeable Sensor Networks. IEEE Access 2020, 8, 39056–39077. [Google Scholar] [CrossRef]
  19. Chen, Y.; Gu, Y.; Li, P.; Lin, F. Minimizing the number of wireless charging PAD for unmanned aerial vehicle–based wireless rechargeable sensor networks. Int. J. Distrib. Sens. Netw. 2021, 17, 155014772110559. [Google Scholar] [CrossRef]
  20. Nguyen, P.L.; La, V.Q.; Nguyen, A.D.; Nguyen, T.H.; Nguyen, K. An on-demand charging for connected target coverage in WRSNs using fuzzy logic and Q-learning. Sensors 2021, 21, 5520. [Google Scholar] [CrossRef]
  21. Zhong, P.; Xu, A.; Zhang, S.; Zhang, Y.; Chen, Y. EMPC: Energy-minimization path construction for data collection and wireless charging in WRSN. Pervasive Mob. Comput. 2021, 73, 101401. [Google Scholar] [CrossRef]
  22. Chawra, V.K.; Gupta, G.P. Hybrid meta-heuristic techniques based efficient charging scheduling scheme for multiple mobile wireless chargers based wireless rechargeable sensor networks. Peer Peer Netw. Appl. 2021, 14, 1303–1315. [Google Scholar] [CrossRef]
  23. Li, Y.; Zhong, L.; Lin, F. Predicting-scheduling-Tracking: Charging nodes with non-deterministic mobility. IEEE Access 2021, 9, 2213–2228. [Google Scholar] [CrossRef]
  24. Simica, M.; Bila, C.; Vojisavljevic, V. Investigation in wireless power transmission for UAV charging. In Proceedings of the 19th International Conference on Knowledge Based and Intelligent Information and Engineering Systems, Singapore, 7–9 September 2015; pp. 1846–1855. [Google Scholar]
  25. Wu, T.; Yang, P.; Dai, H.; Li, P.; Rao, X. Near optimal bounded route association for drone-enabled rechargeable WSNs. Comput. Netw. 2018, 145, 107–117. [Google Scholar] [CrossRef]
  26. Wang, Y.; Hua, M.; Liu, Z.; Zhang, D.; Dai, H.; Hu, Y. Joint Scheduling and Trajectory Design for UAV-Aided Wireless Power Transfer System. Lect. Notes Inst. Comput. Sci. Soc. Inform. Telecommun. Eng. 2019, 278, 3–17. [Google Scholar] [CrossRef]
  27. Wu, P.; Xiao, F.; Sha, C.; Huang, H.; Sun, L. Trajectory Optimization for UAVs’ Efficient Charging in Wireless Rechargeable Sensor Networks. IEEE Trans. Veh. Technol. 2020, 69, 4207–4220. [Google Scholar] [CrossRef]
  28. Liang, S.; Fang, Z.; Sun, G.; Lin, C.; Li, J.; Li, S.; Wang, A. Charging UAV deployment for improving charging performance of wireless rechargeable sensor networks via joint optimization approach. Comput. Netw. 2021, 201, 108573. [Google Scholar] [CrossRef]
  29. Lin, C.; Yang, W.; Dai, H.; Li, T.; Wang, Y.; Wang, L.; Wu, G.; Zhang, Q. Near Optimal Charging Schedule for 3-D Wireless Rechargeable Sensor Networks. IEEE Trans. Mob. Comput. 2021, 11. [Google Scholar] [CrossRef]
  30. Gonzalez, T.F. Clustering to minimize the maximum intercluster distance. Theor. Comput. Sci. 1985, 38, 293–306. [Google Scholar] [CrossRef] [Green Version]
  31. He, L.; Kong, L.; Gu, Y.; Pan, J.; Zhu, T. Evaluating the on-demand mobile charging in wireless sensor networks. IEEE Trans. Mobile Comput. 2015, 14, 1861–1875. [Google Scholar] [CrossRef]
  32. Hu, W.; Zhang, M.; Li, Z.; Popov, S.; Leeson, M.S.; Xu, T. High-dimensional feature based non-coherent detection for multi-intensity modulated ultraviolet communications. J. Lightwave Technol. 2021, 1. [Google Scholar] [CrossRef]
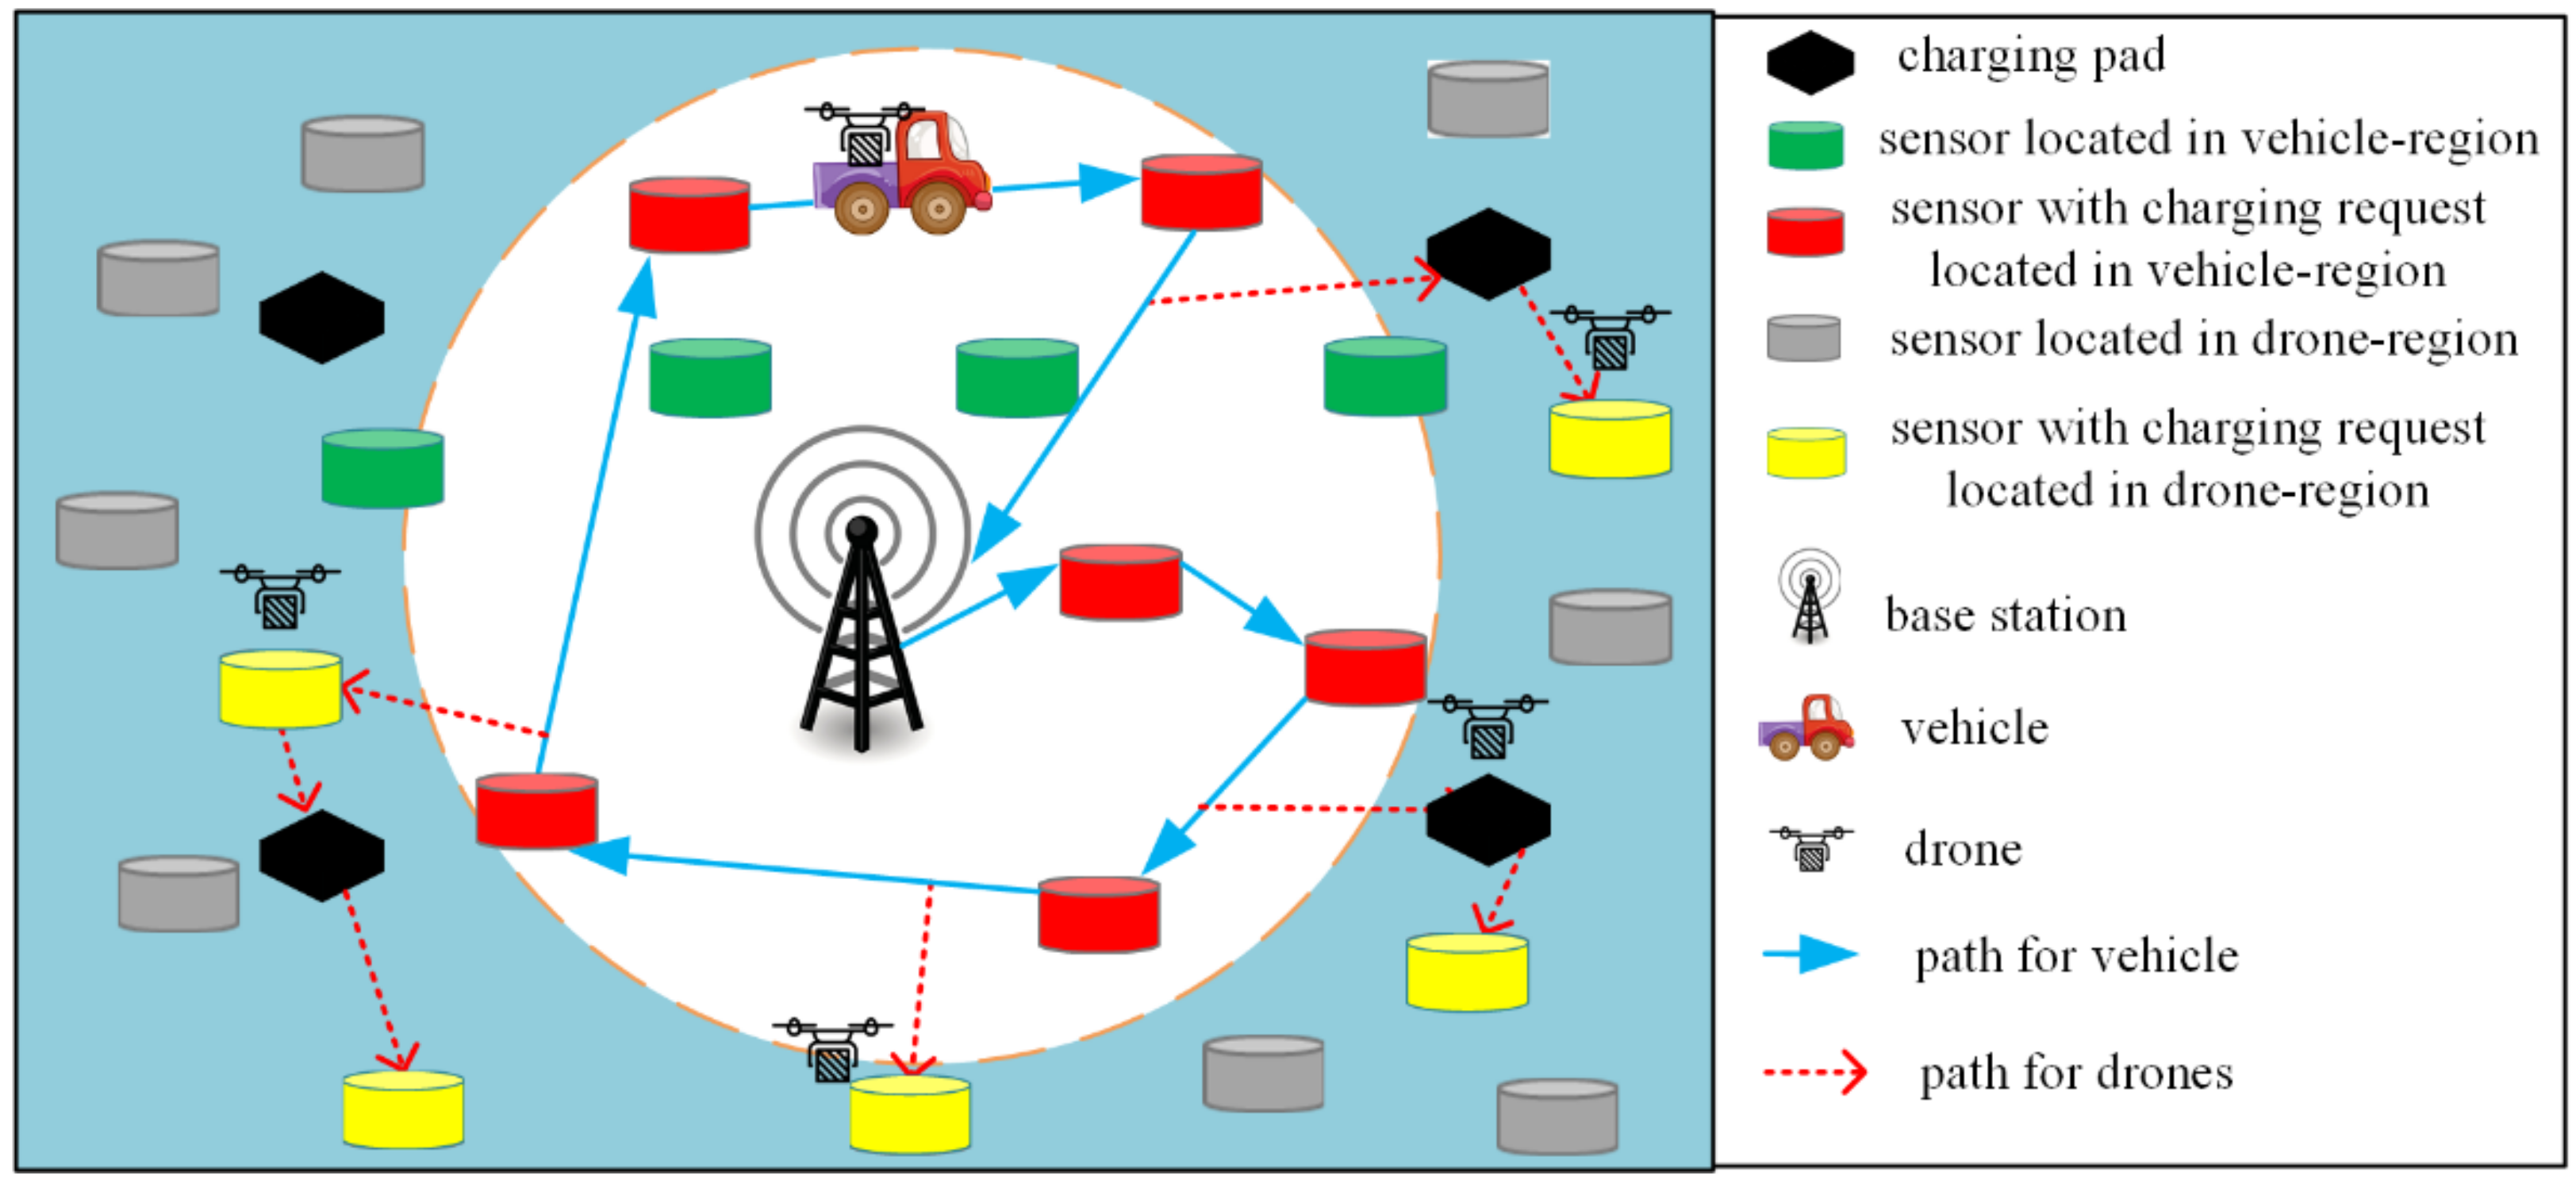
Figure 1. The proposed novel WRSN system that integrates one WCV, a set of WCV-carried drones, and pads.
Energies 15 02256 g001
Figure 2. The mathematical model for estimating the radius of the WCV region.
Energies 15 02256 g002
Figure 3. Three possibilities when determining an available flight path according to the target sensor location.
Energies 15 02256 g003
Figure 4. A big picture of all parts of the proposed schemes.
Energies 15 02256 g004
Figure 5. Deployment of pads with the static scheme.
Energies 15 02256 g005
Figure 6. Determining the flying stops for drones based on three cases of the target sensor locations.
Energies 15 02256 g006
Figure 7. Scheduling for drones based on three cases of the target sensor locations.
Energies 15 02256 g007
Figure 8. Snapshots for the (a) greedy, (b) K-mean, and (c) static schemes.
Energies 15 02256 g008aEnergies 15 02256 g008b
Figure 9. Comparison of the number of pads for diverse network densities.
Energies 15 02256 g009
Figure 10. Comparison of the number of pads when the radius of the WCV region changed.
Energies 15 02256 g010
Figure 11. Comparison of the number of pads when the flight range changes.
Energies 15 02256 g011
Figure 12. Comparison of the performance metrics under different traffic loads: (a) lifetime, (b) the percentage of nodes being charged in time, (c) the percentage of nodes being charged late by drones, (d) the average move time of drones, (e) the charge efficiency of all vehicles, and (f) the charge efficiency of drones.
Energies 15 02256 g012aEnergies 15 02256 g012bEnergies 15 02256 g012c
Table 1. Comparison with related works.
WCVDronePadWCV-Carried Drones
[20,21,22,23]UsedNot usedNot usedNot used
[28]Not usedUsedNot usedNot used
[19,29]Not usedUsedUsedNot used
[17]UsedNot usedNot usedUsed
Our workUsedNot usedUsedUsed
Table 2. Symbols and definitions.
SymbolDefinition
CtotalTotal moving distance of the WCV
emax_WCVMaximum capacity of the WCV
emax_snMaximum capacity of each sensor’s battery
emin_snMinimum capacity of each sensor’s battery
PWCVEnergy consumption rate of the WCV
RWCVRadius of the WCV region
sapiThe ith stop for releasing drones
DdmaxMaximum flight distance of drones
siThe ith sensor
piThe ith pad
SNodes with charging requesting
SWCVNodes with charging requesting in the WCV region
nmaxMaximum number of sensors with charging requests in each charging circle
PSet of pads
KNumber of clusters
Table 3. Simulation parameters of the deployment schemes.
ParameterValues
Network size (m2)1000 × 1000
Network density500–1000
Ddmax (m)130–250
RWCV (m)240–250
Table 4. Simulation parameters of the collaborative charging scheduling.
ParameterValues
Simulation time (s)100,000
Network size (m2)1000 × 1000
Network density1000
Number of drones carried by WCVs10
RWCV (m)300
Ddmax (m)130
Traffic load ([0, x/network density])10–50
Energy capacity of WCVs (J)100,000
Battery capacity of drones (J)300
Battery capacity of nodes (J)100
Speed of drones (m/s)35
Speed of WCVs (m/s)10
Energy threshold of nodes (%)30
Energy consumption rate of drones when flying (J/s)10
Energy consumption rate of drones when hovering for charging nodes (J/s)1
Energy consumption rate of moving WCVs (J/m)10
Charging rate (J/s)5
Initial energy of nodes (%)100
Network traffic (number of events sensed by nodes per second)50
Transmission range of nodes (m)60
Packet length (kB)10
Time of transmitting packets for one hop (s)0.01
Table 5. The statistical description.
(a) For lifetime
Traffic loadSchemeStandard deviationStandard error95% confidence interval for mean difference
Lower boundUpper bound
50Greedy381.03970.7571072.961362.84
K-mean381.03970.7571072.961362.84
Static381.03970.7571072.961362.84
(b) For percentage of nodes being charged in time
Traffic loadSchemeStandard deviationStandard error95% confidence interval for mean difference
Lower boundUpper bound
50Greedy0.04231215550.00785717000.9162716290.948460995
K-mean0.02602504570.00483272970.9303379120.950136708
Static0.04365448400.00810643420.9143726640.947583219
(c) For percentage of nodes being charged late by drones
Traffic loadSchemeStandard deviationStandard error95% confidence interval for mean difference
Lower boundUpper bound
50Greedy0.05385526430.01017768830.0474034240.089169207
K-mean0.04191377350.00792095870.0453838240.077888753
Static0.06132343000.01158903900.0506282630.098185751
(d) For average move time of drones
Traffic loadSchemeStandard deviationStandard error95% confidence interval for mean difference
Lower boundUpper bound
Static4.73214640.878737518.59954522.199569
50Greedy6.11107821.134798715.09331319.742373
K-mean5.29726580.983677615.93638919.966333
Static5.03012600.934070915.17403119.000747
(e) For charge efficiency of WCV and drones
Traffic loadSchemeStandard deviationStandard error95% confidence interval for mean difference
Lower boundUpper bound
50Greedy0.00040736240.00007564530.0052107270.005520632
K-mean0.00044915710.00008340640.0051889560.005530657
Static0.00035728050.00006634530.0051996980.005471503
(f) For charge efficiency of drones
Traffic loadSchemeStandard deviationStandard error95% confidence interval for mean difference
Lower boundUpper bound
50Greedy0.01195989790.00222089730.3504304340.359529038
K-mean0.01683657530.00312647350.3417963210.354604902
Static0.00842700880.00156485620.3547567080.361167633
Table 6. LSD post hoc test.
(a) For lifetime
Traffic loadBetween schemesMean
difference
Standard errorSignificance95% confidence interval for mean difference
Lower boundUpper bound
50GreedyK-mean0.000100.0661.000−198.99198.99
Static0.000100.0661.000−198.99198.99
K-meanGreedy0.000100.0661.000−198.99198.99
Static0.000100.0661.000−198.99198.99
StaticGreedy0.000100.0661.000−198.99198.99
K-mean0.000100.0661.000−198.99198.99
(b) For percentage of nodes being charged in time
Traffic loadBetween schemesMean
difference
Standard errorSignificance95% confidence interval for mean difference
Lower boundUpper bound
50GreedyK-mean−0.00787099810.01002678650.435−0.0278103630.012068366
Static0.00138837060.01002678650.890−0.0185509940.021327735
K-meanGreedy0.00787099810.01002678650.435−0.0120683660.027810363
Static0.00925936880.01002678650.358−0.0106799960.029198733
StaticGreedy−0.00138837060.01002678650.890−0.0213277350.018550994
K-mean−0.00925936880.01002678650.358−0.0291987330.010679996
(c) For percentage of nodes being charged late by drones
Traffic loadBetween schemesMean
difference
Standard errorSignificance95% confidence interval for mean difference
Lower boundUpper bound
50GreedyK-mean0.00665002680.01415704180.640−0.0215180460.034818099
Static−0.00612069130.01415704180.667−0.0342887640.022047381
K-meanGreedy−0.00665002680.01415704180.640−0.0348180990.021518046
Static−0.01277071810.01415704180.370−0.0409387910.015397354
StaticGreedy0.00612069130.01415704180.667−0.0220473810.034288764
K-mean0.01277071810.01415704180.370−0.0153973540.040938791
(d) For average move time of drones
Traffic loadBetween schemesMean
difference
Standard errorSignificance95% confidence interval for mean difference
Lower boundUpper bound
50GreedyK-mean−0.53351841.44404020.713−3.4051512.338114
Static0.33045401.44404020.820−2.5411783.202086
K-meanGreedy0.53351841.44404020.713−2.3381143.405151
Static0.86397241.44404020.551−2.0076603.735605
StaticGreedy−0.33045401.44404020.820−3.2020862.541178
K-mean−0.86397241.44404020.551−3.7356052.007660
(e) For charge efficiency of WCV and drones
Traffic loadBetween schemesMean
difference
Standard errorSignificance95% confidence interval for mean difference
Lower boundUpper bound
50GreedyK-mean0.00000587330.00010671000.956−0.0002063310.000218078
Static0.00003007890.00010671000.779−0.0001821260.000242283
K-meanGreedy−0.00000587330.00010671000.956−0.0002180780.000206331
Static0.00002420560.00010671000.821−0.0001879990.000236410
StaticGreedy−0.00003007890.00010671000.779−0.0002422830.000182126
K-mean−0.00002420560.00010671000.821−0.0002364100.000187999
(f) For charge efficiency of drones
Traffic loadBetween schemesMean
difference
Standard errorSignificance95% confidence interval for mean difference
Lower boundUpper bound
50GreedyK-mean0.0067791244 *0.00338191230.0480.0000538210.013504428
Static−0.00298243410.00338191230.380−0.0097077380.003742869
K-meanGreedy−6.7791244294 × 10−30.00338191230.048−0.013504428−0.000053821
Static−9.7615585278 × 10−30.00338191230.005−0.016486862−0.003036255
StaticGreedy0.00298243410.00338191230.380−0.0037428690.009707738
K-mean0.0097615585 *0.00338191230.0050.0030362550.016486862
(* indicates the significance level of mean difference is 0.05).
Publisher’s Note: MDPI stays neutral with regard to jurisdictional claims in published maps and institutional affiliations.