Abstract
For the design of floating offshore wind turbines (FOWT), all the load cases need to be calculated by using a coupled model of wind turbine and platform, while the uncoupled approach will help to reduce the number of simulations for the design and optimization of floating offshore wind turbines. In this study, the effects of the wind and wave actions on the tower loading of a FOWT were investigated and an uncoupled approach for the load calculation was proposed and verified by comparing with the result of coupled simulation. First, the effect of elastic platform was considered by tuning the Young’s modulus of the tower material when rigid platform model was used in the analysis. The effect of wind and wave actions on the loading of the tower was then investigated. It was found that the difference of the wind load between fixed and floating wind turbines is observed only in the mean component and can be predicted by considering the hydrostatic stiffness of the platform and mooring stiffness. The standard deviation of the fore-aft tower moment increased as the significant wave heights increased when the mean wind speeds and peak wave periods were fixed. This is caused by the increase of the inertia force induced by the pitch and surge motions of the platform and the increase of the fluctuating pitch angle. On the other hand, the standard deviation of the fore-aft tower moment decreased as the peak periods increased when the mean wind speeds and significant wave heights were fixed. The increase of the peak period caused the decrease of the pitch and surge accelerations of the platform and results in the decrease of the inertia force. Finally, the tower loading in extreme sea states during power production was carried out by using the proposed uncoupled approach and the results showed good agreement with those by the coupled approach, and the simulation time was reduced to 1/40.
1. Introduction
Offshore wind is a rapidly maturing renewable energy technology and significant research has been carried out [1,2,3,4,5,6]. Among them, substantial offshore wind energy resource is located in deep water where use of conventional bottom-mounted wind turbines is not feasible, and floating offshore wind turbines (FOWT) are needed [7,8] and several kinds of FOWT concepts have been proposed [9,10]. However, the loading on FOWT may increase significantly compared to the bottom fixed wind turbines mainly due to the large motion of the platform. Robertson and Jonkman [11] showed that the ultimate tower base bending moment of a wind turbine on a semi-submersible platform during operation increases about 30% compared to the bottom fixed turbines. However, there are no clear explanations on how the wind and wave actions affect the loading of FOWT tower. Therefore, for the design verification of FOWT, all the load cases need to be calculated by using coupled model of wind turbine and platform, including the aerodynamics of the rotor and tower as well as the hydrodynamics and mooring systems according to IEC TS 61400-3-2 [12]. If the wind and wave induced loads can be accurately predicted by the uncoupled approach, it will help to reduce the number of simulations for the design and optimization of floating offshore wind turbines.
When modeling FOWT for dynamic simulation, the tower first mode frequency is important because it should be carefully chosen so that it does not cause resonance with the frequency of 1P (rotor rotation frequency) or 3P (blade passing frequency). When the wind turbine is installed on floating platform, the elasticity of the platform and non-fixed boundary condition may cause the increase of the tower first mode frequency and resonance with the blade passing frequency. Zhang and Ishihara [13] proposed to adjust the length of the tower and the predicted frequency showed good agreement with the measurement. However, this method is difficult to apply for FOWT. Another problem is the validation of the numerical model for FOWT by using the water tank tests. Robertson et al. [14,15] concluded that any state-of-the-art dynamic simulation model of FOWT underestimates the low frequency response compared to the water tank test. However, water tank tests may have several problems, such as the effect of sensor wiring on the platform motion and the appropriateness of the scaling of the turbulent wind field. The validation of the numerical model by using full scale measurements is needed.
The characteristic of wave effect on the tower loading is also an important issue. Kvittem and Moan [16] pointed out that the fatigue load decreases with the increase of the peak wave period. Long et al. [17] showed that the standard deviation of the tower base moment increases as the wave height increases. However, the mechanism has not been clarified yet.
The combination of the wind and wave effects is a key issue when uncoupled simulation approach is used. Xu and Ishihara [18] proposed analytical formulae for the calculation of the standard deviation of fore-aft tower bending moment based on the surge and pitch motions of platform, in which the tower bending moments caused by surge and pitch motions were calculated separately, then combined by using the complete quadratic combination (CQC). However, the correlation between surge and pitch motions may be different from that obtained by the CQC approach which is widely used in the building engineering.
In this study, the numerical models of floating offshore wind turbine by using both coupled and uncoupled approaches are discussed in Section 2. The characteristics of the wind and wave actions on the FOWT are then investigated by using numerical simulations, and the comparison of coupled and uncoupled approaches is performed for extreme sea states during power production in Section 3. The conclusions are summarized in Section 4.
2. Numerical Model and Load Calculation
The modeling of the FOWT for the dynamic simulation, including control parameters and hydrodynamic properties are described in Section 2.1. The prediction of tower moment induced by the platform motion is then explained in Section 2.2. Finally, an uncoupled approach is proposed in Section 2.3.
2.1. The Load Calculation by Using Coupled Model
The dynamic simulation tool of wind turbine FASTv8 [19] was used for the coupled simulation. In this simulation, the aerodynamic loading on the rotor blades was considered by using blade element momentum (BEM) theory. The gravity force and the centrifugal force were considered in the numerical simulation. Equation (1) expresses the motion of the system [20].
where , , and are mass, damping, and stiffness matrices, respectively. , , and stand for displacement, velocity, and acceleration vector of each degree of freedom. , , , , and indicate the gravitational, buoyancy, hydrodynamic, mooring line, and aerodynamic force vectors, respectively.
A standard downwind turbine model proposed by the University of Tokyo during the IEA Task 40 project (UWT80d-2.0) was used to simulate the behavior of the HWT80-2.0. Table 1 shows the dimension and weight of UWT80d-2.0. For the control, a conventional variable-speed, variable blade-pith-to-feather configuration was used [21,22]. The control parameters used in this study are summarized in Table 2.

Table 1.
Description of the dimension and weight of UWT80d-2.0.
Table 2.
Summary of control parameters.
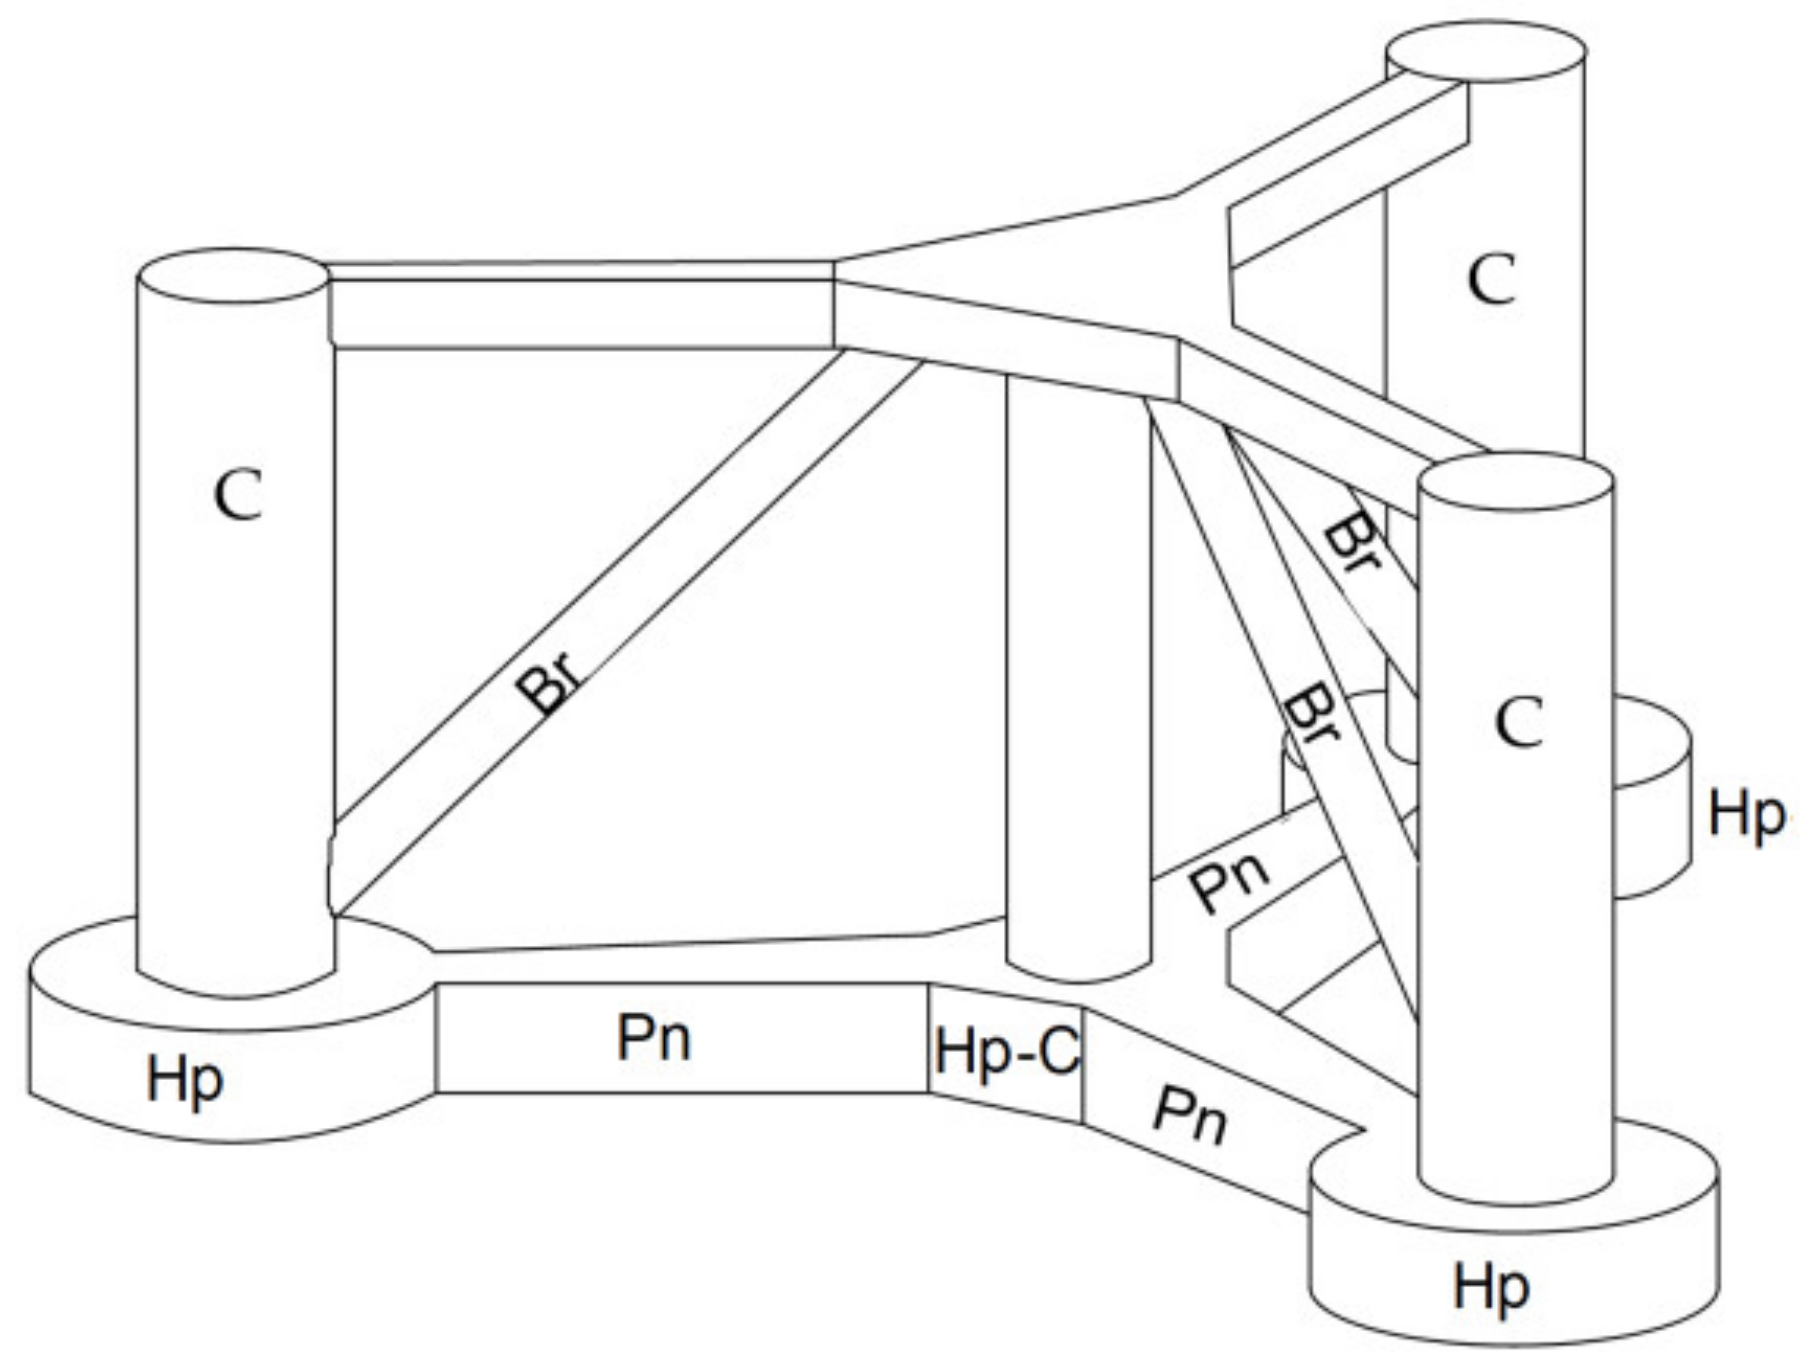
The hydrodynamic force is based on the potential flow theory and computational fluid dynamics (CFD). Ansys AQWA was used for the potential flow analysis and Ansys Fluent was used for the computational fluid dynamics. The added mass matrix and the radiation damping matrix, and wave excitation force vectors were based on the potential flow theory. The viscous damping coefficients were based on the CFD simulation [23]. It was noted that the viscous damping coefficients were the functions of KC number. In this study, KC number was assumed to be 4.62 for the surge and sway directions and 0.9 for the heave direction. The components using the drag coefficients in simulation are shown in Figure 1 and their values are summarized in Table 3.
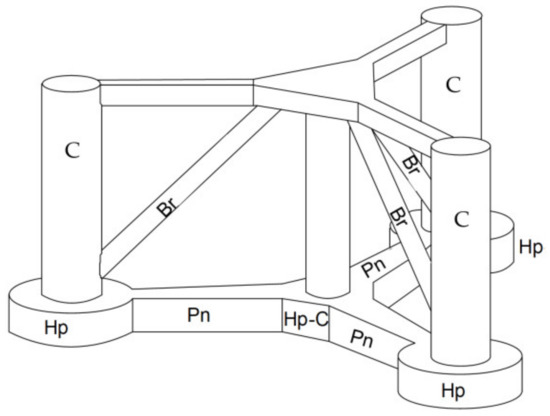
Figure 1.
Components of the semi-submersible platform.
Table 3.
Drag coefficients Cd for each component of platform in Figure 1.
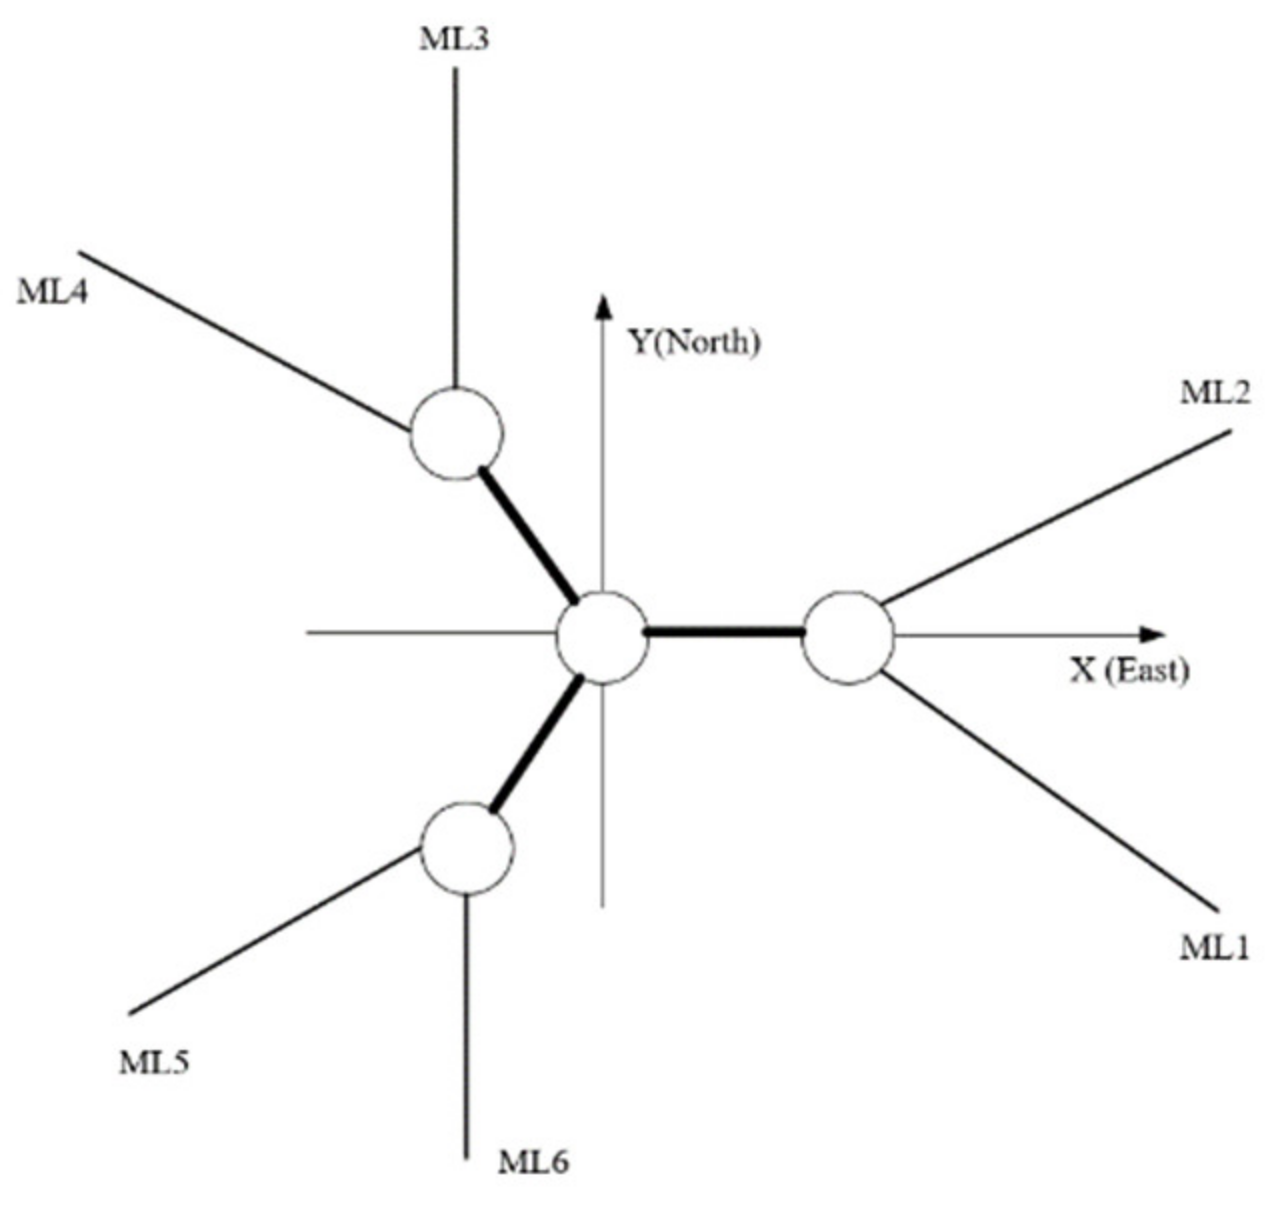
The analysis of the mooring lines was performed by using the Mooring Analysis Program (MAP++) based on the steady-state forces on a multi-segmented, quasi-static (MSQS) mooring line concept [24]. The configuration of the mooring line is shown in Figure 2 and the properties of the mooring lines are summarized in Table 4.

Figure 2.
Mooring line configuration.
Table 4.
Description of mooring line properties.
2.2. Prediction of Tower Moment Induced by Platform Motion
The cause of standard deviation of the fore-aft tower bending moment of FOWT was investigated by using the result of the numerical simulation. The fluctuating moment was contributed to by fluctuating wind and fluctuating platform motion which was mainly caused by wave. In this section, only the moment induced by the platform motion is examined to consider the effect of wave height. The platform motion caused the fore-aft tower bending moment through three mechanisms below.
The first one is the tower moment caused by the pitch rotation. When the platform had a pitch angle, the whole system inclined and the gravity force caused the moment. The pitch angle fluctuation caused the fluctuation of the tower moment. The tower and the rotor nacelle assembly (RNA) were modeled as a lumped mass, as shown in Figure 3. at the node can be calculated from the pitch angle of platform as follows:
where is the mass at the node , is the height of node measured from the center of gravity of the system.
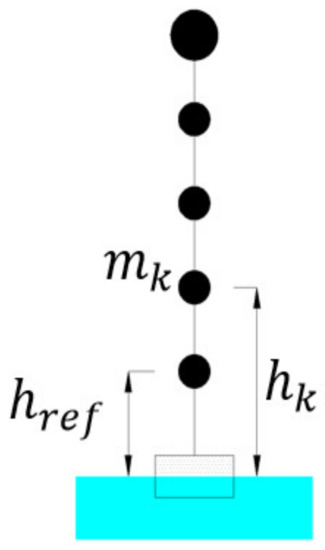
Figure 3.
Lumped mass model of floating wind turbine.
The second one, , caused by the angular acceleration in the pitch direction can be calculated from the pitch angular acceleration as:
The last one, , is the bending moment caused by the surge acceleration of the platform and can be calculated by using Equation (4).
The total fore-aft tower bending moment induced by the platform motion can be defined as the sum of the three moments mentioned above.
The standard deviation of , , and can be calculated from the standard deviation of platform pitch angle , pitch angular acceleration and surge acceleration as follows by assuming .
2.3. The Load Calculation Based on the Uncoupled Approach
Since the mean fore-aft tower base moment is strongly affected by wind action, the mean component can be estimated by using the numerical simulation for the bottom mounted wind turbine with additional moment caused by the pitch motion of platform. This additional moment can be calculated by using the mean pitch angle of the system . The total mean moment at the node can be calculated as follows:
where is the mean fore-aft moment at the node for the bottom mounted wind turbine, and is the mean pitch angle of the system which can be calculated by solving Equation (10).
where is the mean thrust force, is the distance between the center of gravity of the platform and the nacelle, is the distance between the center of gravity of the system and the center of gravity of the tower and the RNA, and and are the hydrostatic and mooring stiffness in the pitch direction, respectively. By assuming , the mean pitch angle can be calculated as follows.
The pitch component of the hydrostatic stiffness can be calculated by using Equation (12).
where is the water density, is the cross section of the platform at the water line, is the distance from the pitch axis, is the volume of the platform in the water, and is the distance between the center of gravity and the center of buoyancy. The value of the mooring stiffness is discussed in Section 3.4.
The maximum fore-aft tower bending moment can be calculated as follows:
where (i) is the mean tower bending moment.
The peak factor of the wind load, , is modeled by fitting the simulated peak factor as:
where is the cut-in wind speed, for this case it is 4 m/s. is the hub-height wind speed. is the rated wind speed and is 13 m/s, is the cut-out wind speed and is 25 m/s. The standard deviation (i) is the standard deviation of wind loading and can be calculated by the bottom fixed wind turbine simulation.
The standard deviation (i) is the standard deviation of loading due to the platform motion by wave and can be calculated by the simulation without wind. The peak factor for the wave loading, , is estimated by using Gaussian process.
where is the simulation time length. is 600 s. is the zero up crossing frequency of tower base bending moment for Gaussian process:
where is the frequency, and is the power spectral density. and are the variance of the background part, resonant part at the platform pitch motion frequency, and tower resonant part, respectively. In general, there are three peaks corresponding to wave peak frequency , pitch natural frequency and tower first natural frequency in the power spectral density of the tower base moment. Since and are negligible small compared to , the zero up-crossing frequency becomes approximately.
3. Prediction of Tower Bending Moment of FOWT by Coupled and Uncoupled Approaches
In this study, the 2 MW offshore wind turbine at Fukushima Floating Offshore Demonstration Project [18] is used to validate the coupled and uncoupled approaches. The wind turbine is installed on a semi-submersible platform with six catenary mooring lines. The detailed information of onsite measurement and metocean conditions are described in Section 3.1. The effect of flexibility and boundary condition of platform on the tower first mode frequency is investigated in Section 3.2. The fore-aft tower bending moments predicted by using the coupled and uncoupled approaches are discussed in Section 3.3. The effect of wind action is discussed in the low wave height condition and the effect of wave action is then investigated in the low wind speed condition. Finally, the tower bending moments in the extreme sea states condition during power production are investigated and the predicted tower bending moments by both approaches are compared in Section 3.4.
3.1. Onsite Measurement and Metocean Conditions
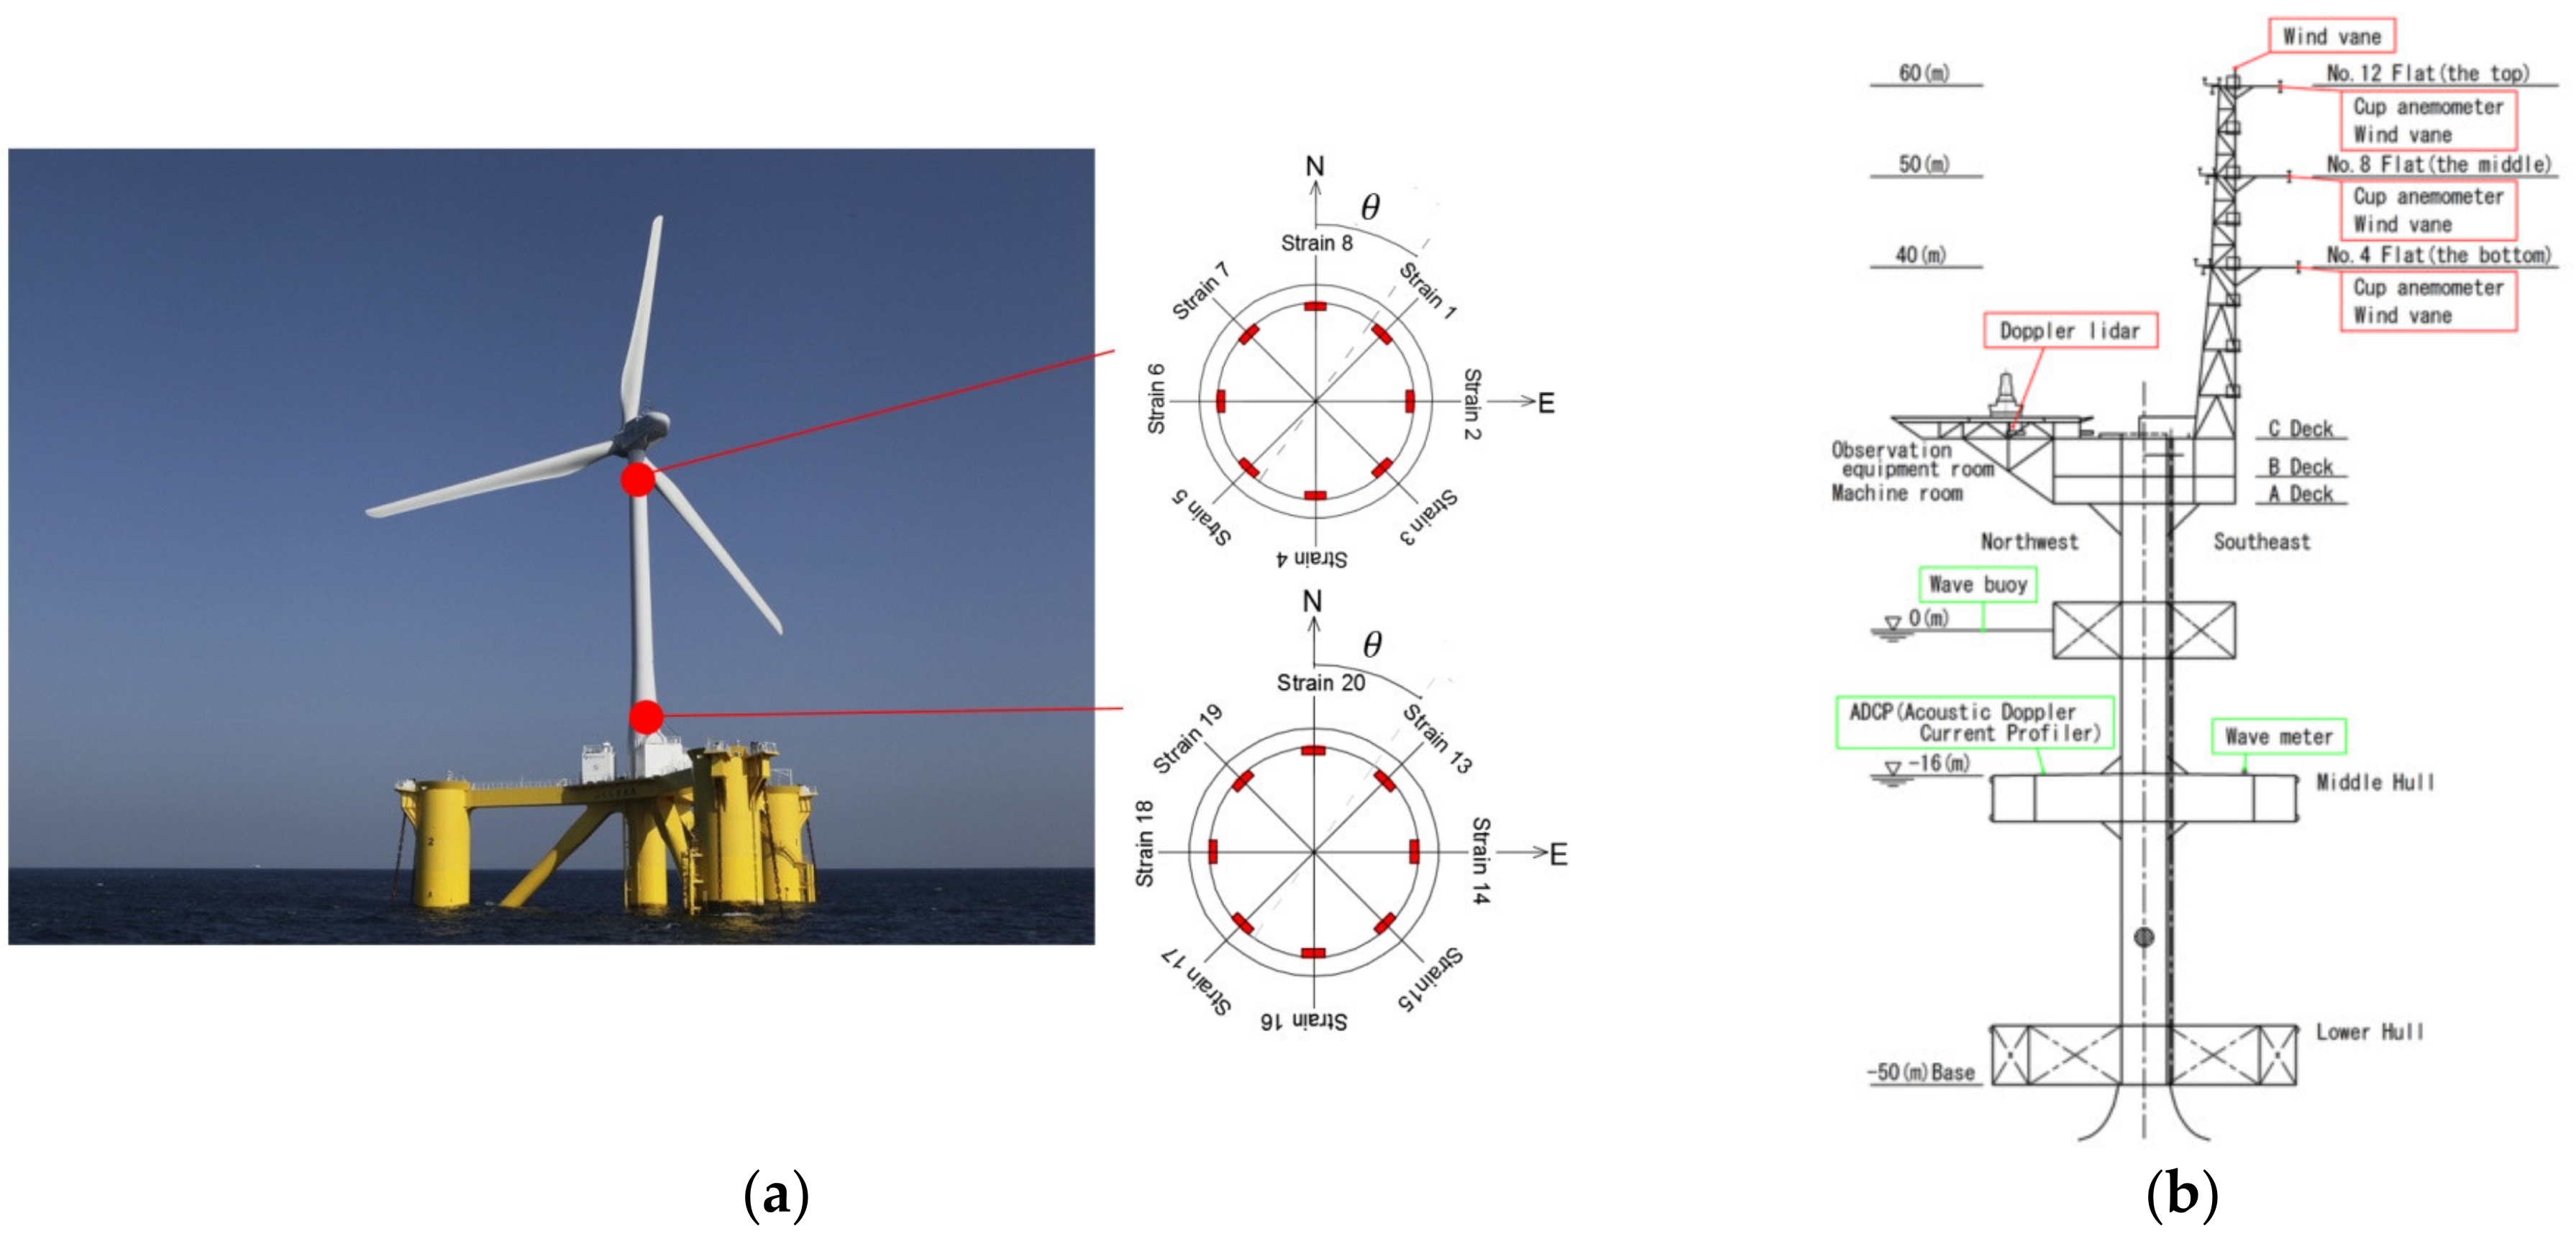
A 2 MW wind turbine (Hitachi HTW-2.0 80) with semi-submersible platform and catenary mooring system, Fukushima Mirai, installed at offshore Fukushima, is used in this study. As show in Figure 4a. The tower bending moment is measured by using the strain gauges installed on the tower of the turbine, and the platform motion is measured by using accelerometers, gyros and RTK-GPS sensors.
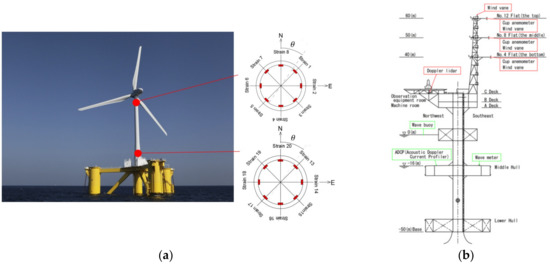
Figure 4.
Overview of 2 MW floating wind turbine and measurement systems. (a) 2 MW wind turbine (Fukushima Mirai), (b) floating substation (Fukushima Kizuna).
A floating substation, Fukushima Kizuna, was installed next to the 2 MW wind turbine and equipped with metocean measurement devices to measure environmental conditions [25] as illustrated in Figure 4b. Wind speed and directions were measured by using cup anemometers, wind vanes, and sonic anemometers on the met mast, and a doppler lidar on the main deck. Wave height and period were measured by using the wave meter installed on the hull of the substation.
The calibration of zero-point of pitch and role angle was performed by using the measurement data of nacelle rotation test under calm weather condition. Sixteen strain gauges were installed on the tower, at 25.9 and 63.1 m above mean sea level, to measure the tower bending moment at the tower bottom and the top. At each height, 8 strain gauges were installed, as shown in Figure 4a.
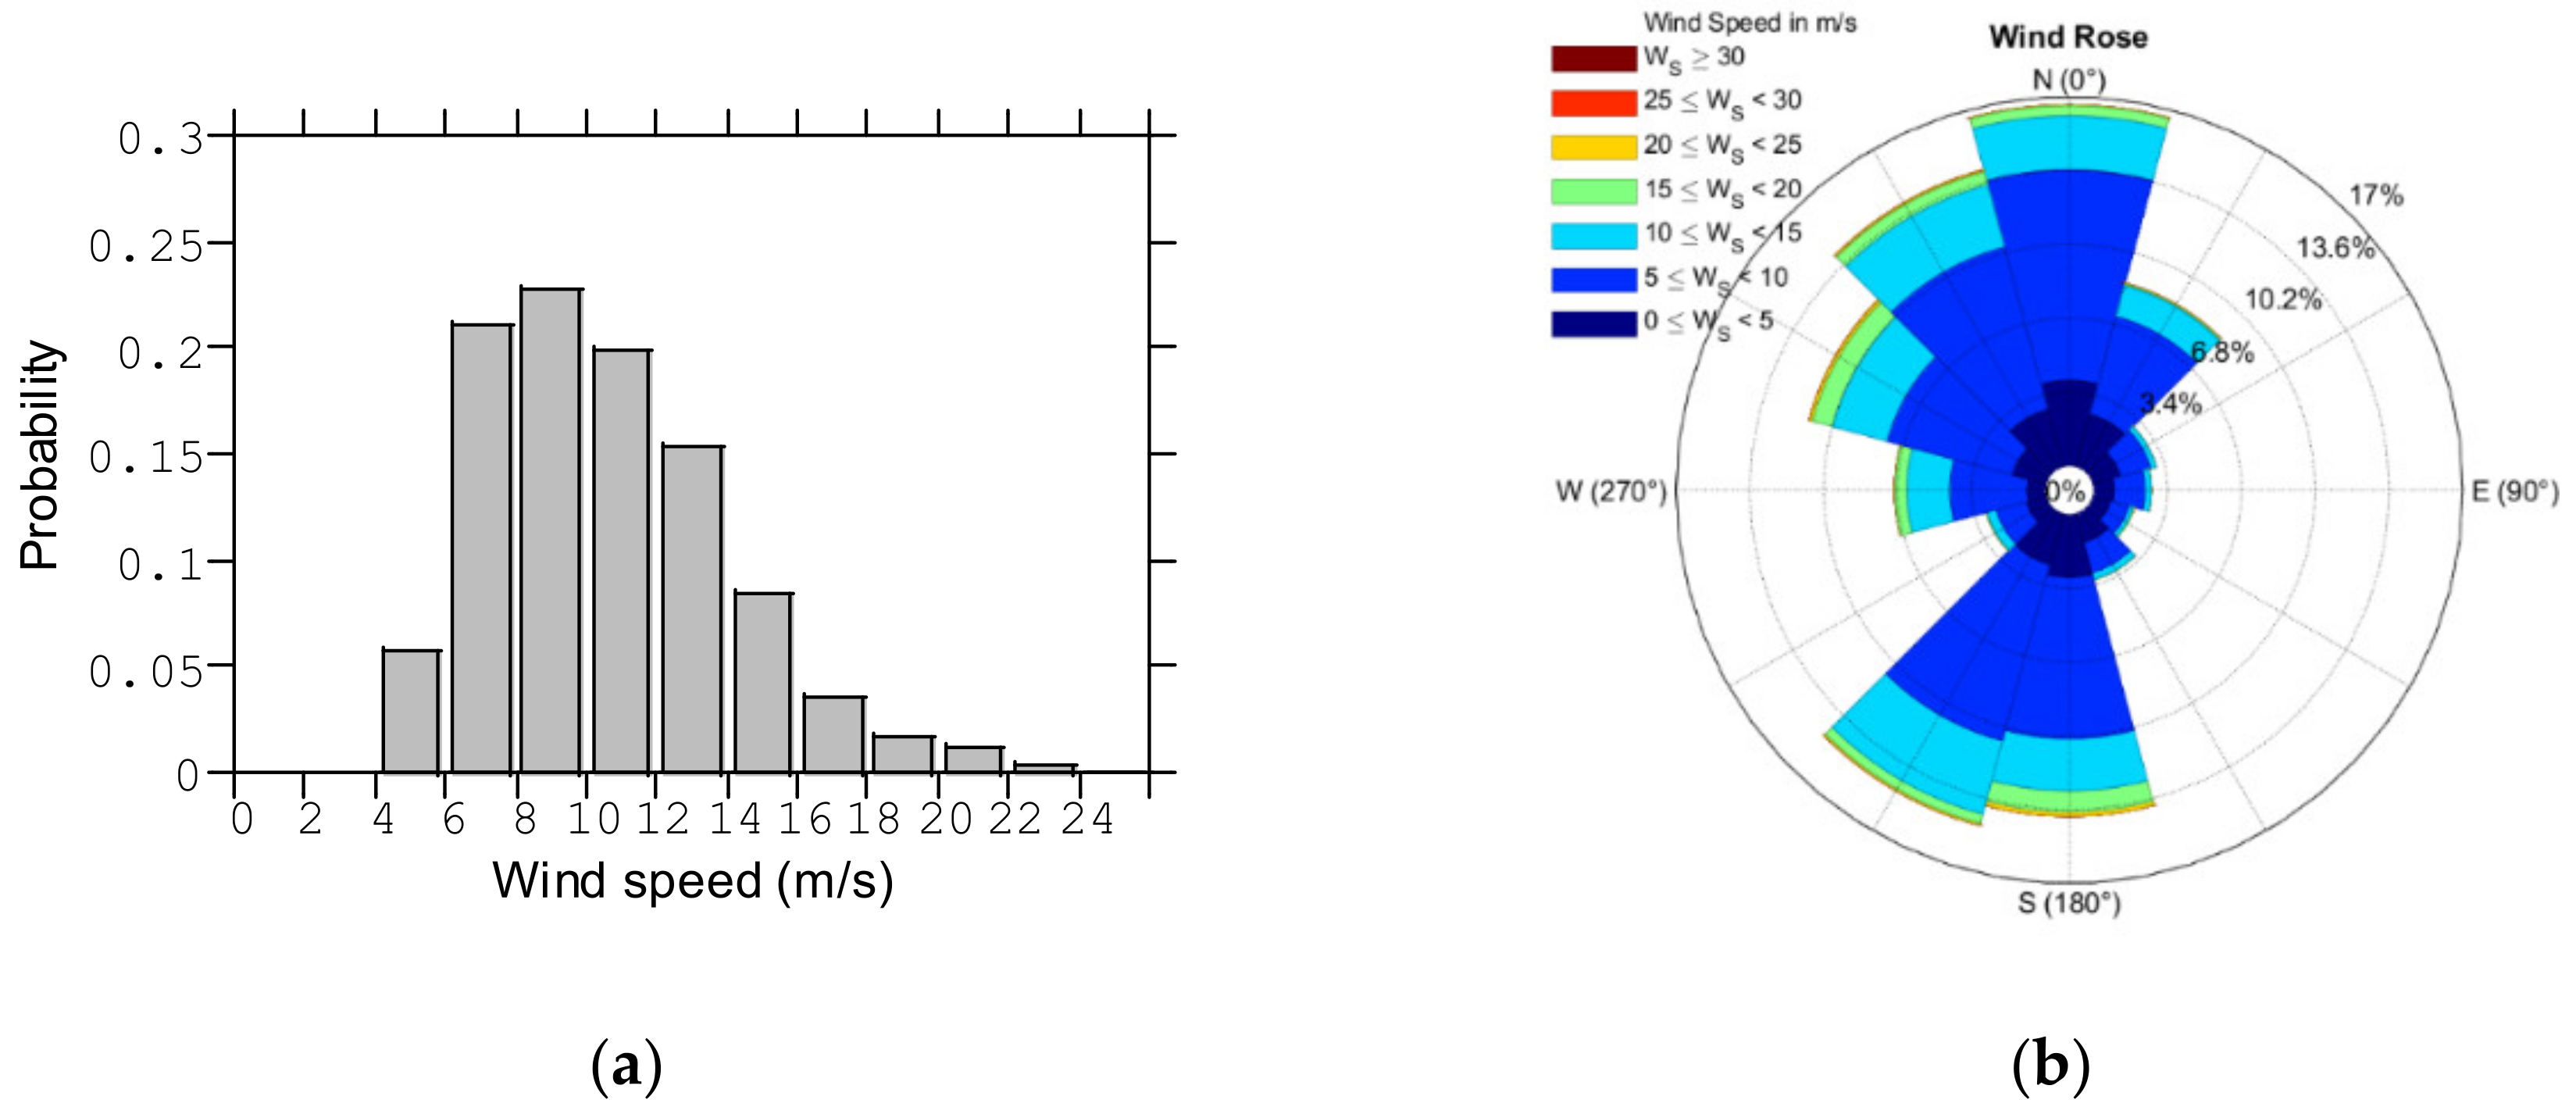
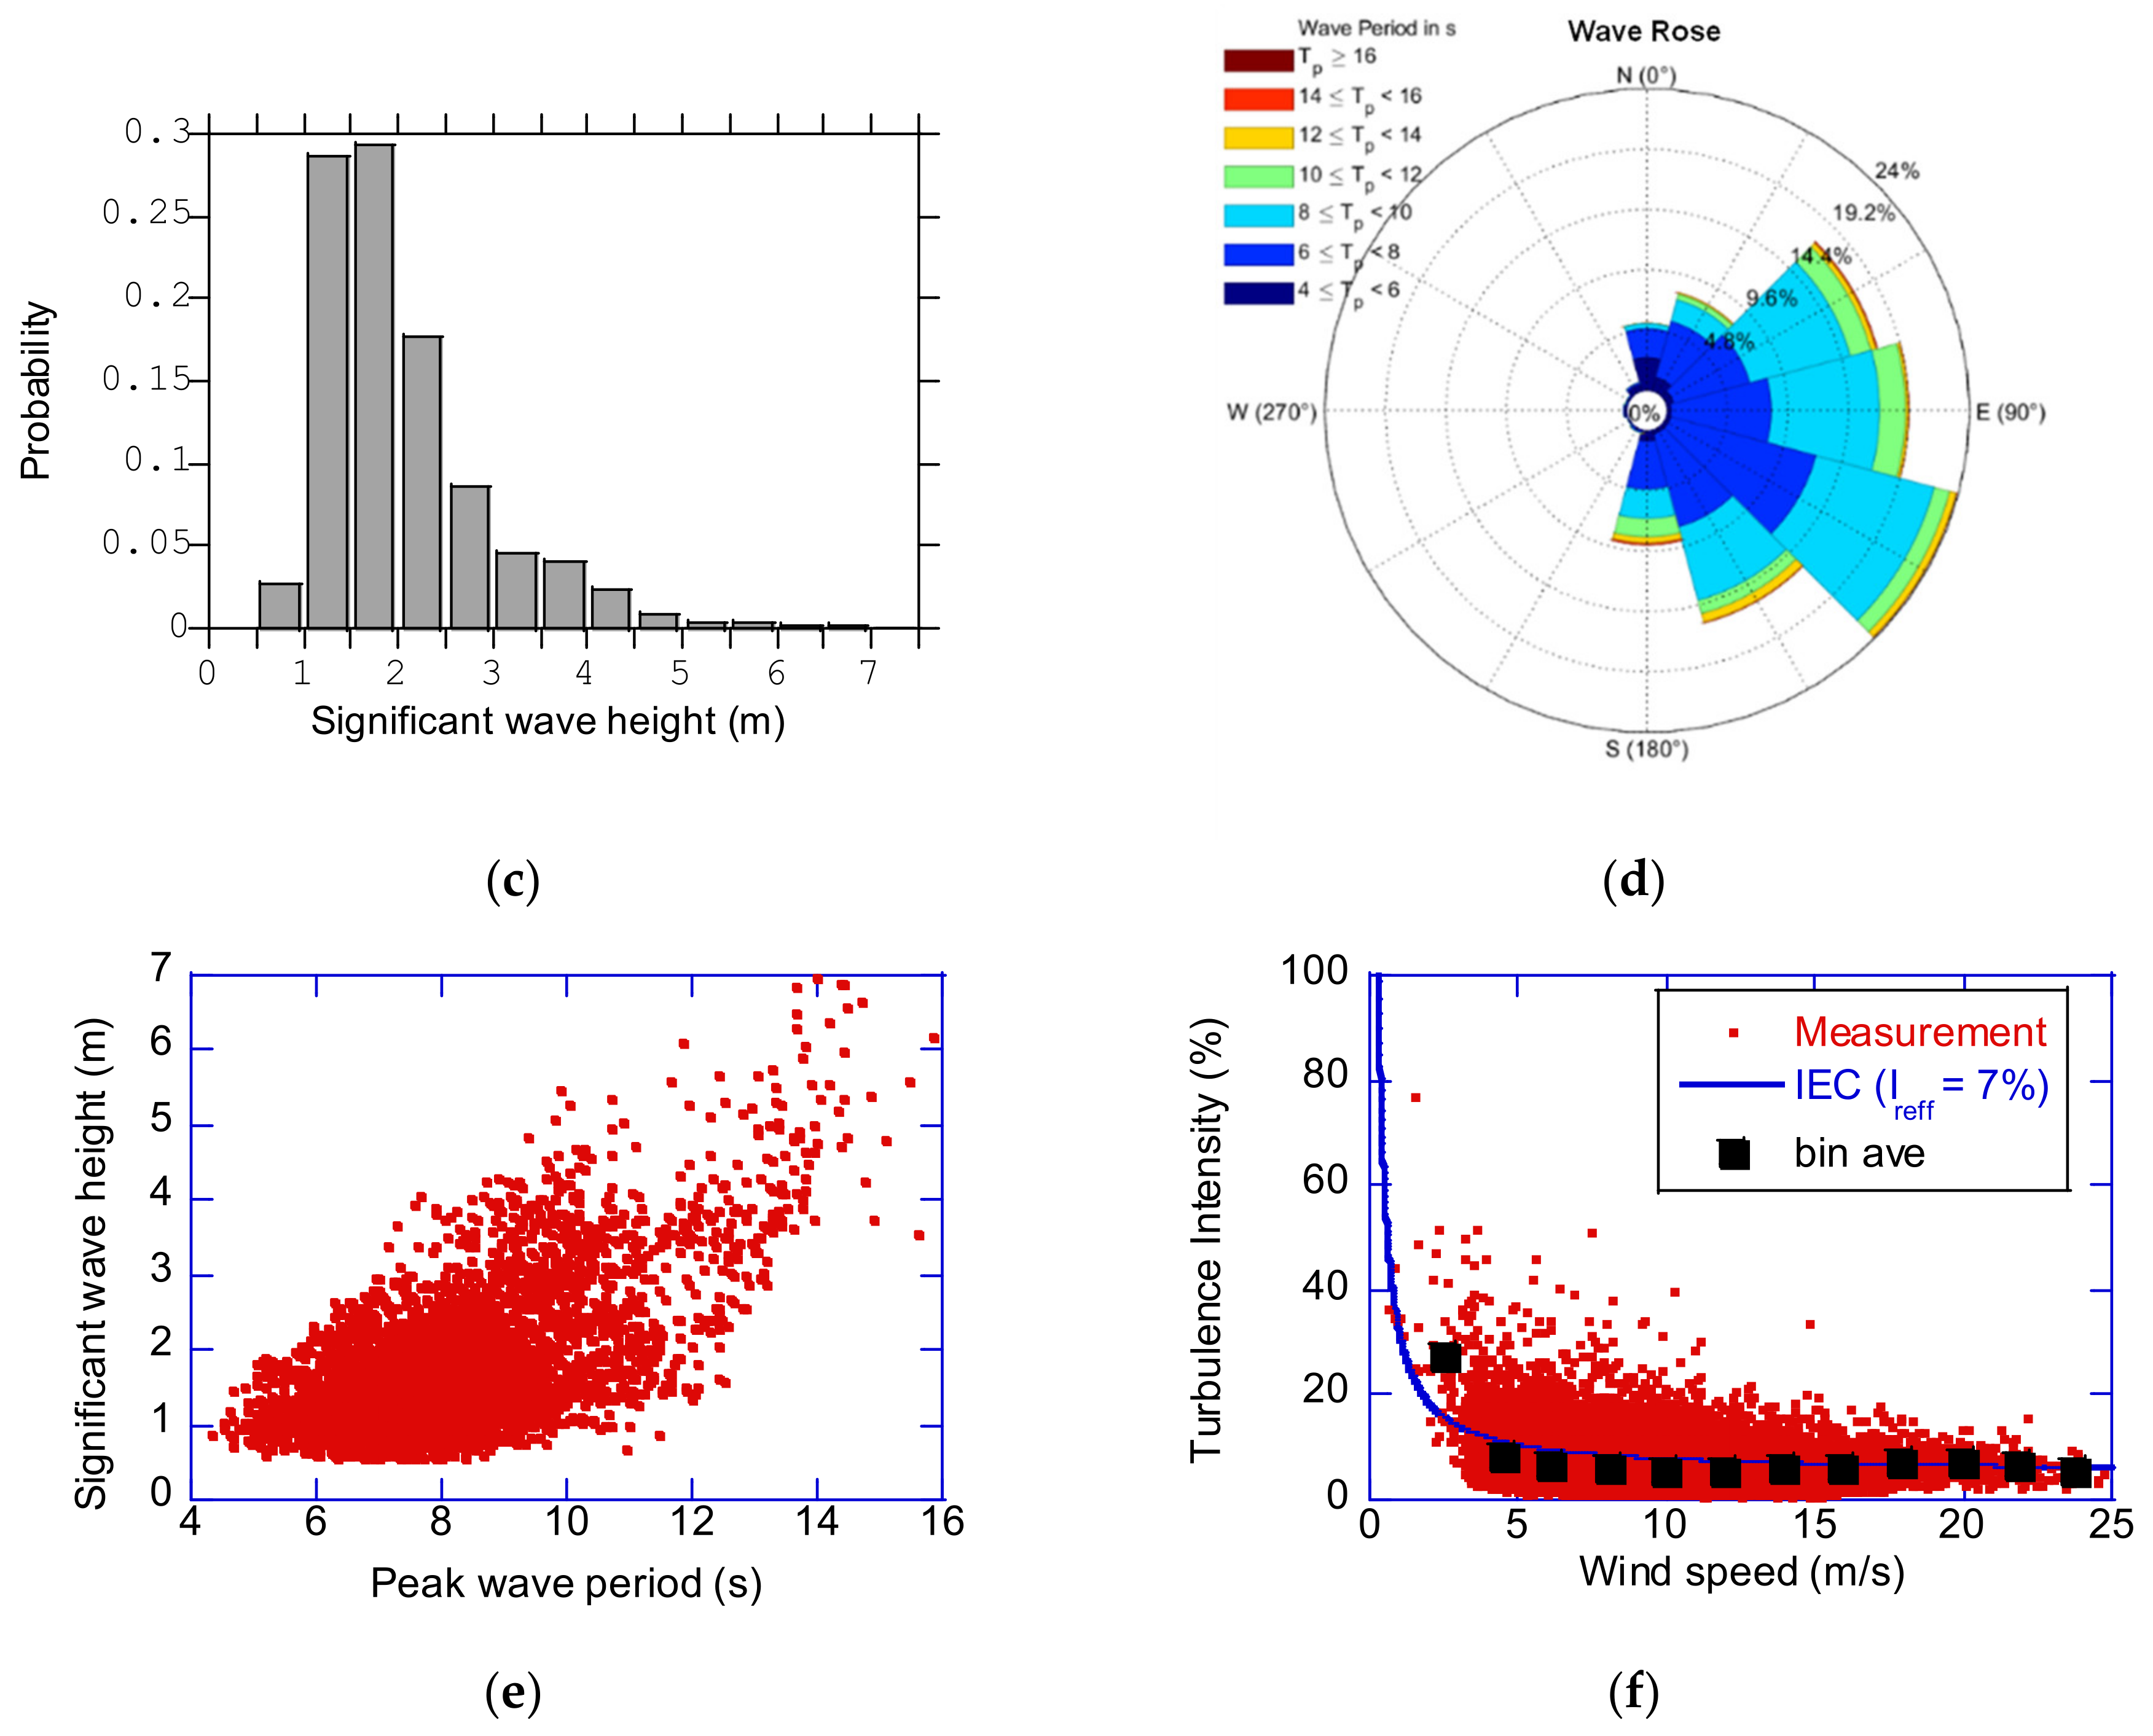
Figure 5 illustrates the wind and wave conditions at the Fukushima site. The wind speed frequency distribution is shown Figure 5a and the prevailing wind directions in Figure 5b are north-north-westerly and southerly. The wave height frequency distribution is plotted in Figure 5c and the prevailing wave direction in Figure 5d is east-south-easterly. Figure 5e depicts the relationship between significant wave height and peak wave period, which shows a large variance since the Fukushima site faces to the Pacific Ocean. The turbulence intensity was lower than that measured at onshore sites as shown in Figure 5f. It was found that the value of was the most appropriate when normal turbulence model (NTM) in IEC61400-1:2019 [26] was fitted to the bin average value of the turbulence intensity.

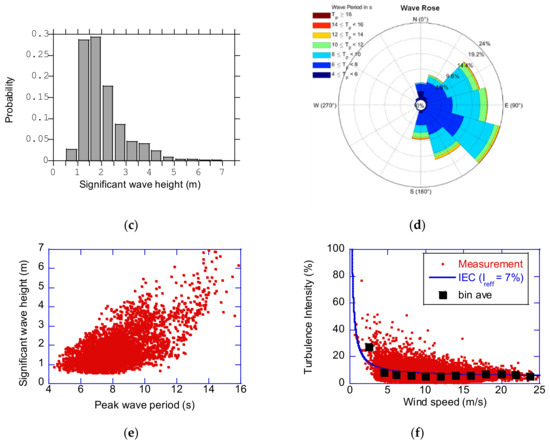
Figure 5.
Metocean condition at the Fukushima site: (a) wind speed frequency distribution; (b) wind rose; (c) wave height frequency distribution; (d) wave rose; (e) relationship between peak wave period and significant wave height; (f) turbulence intensity as function of mean wind speed.
3.2. The Effect of Flexibility and Boundary Condition of Platform on the Tower First Mode Frequency
The FEM models with beam elements were built to investigate the effect of platform flexibility and boundary condition on wind turbine tower loads. Two boundary conditions at the bottom of the center platform, fixed and free condition, and two different elasticities of the platform, rigid and flexible, were considered. The rigid platform was achieved by assuming that the young modulus of element was relatively high. For the flexible platform, the actual dimension and properties of platform were used. The rotor and nacelle were modeled as a concentrated mass with an inertia moment.
Eigenvalue analysis was performed by ABAQUS [27] and the tower natural frequencies were obtained for each model. Table 5 illustrates the natural frequencies of tower first mode from four FEM models and also the measured frequency. It is clear that the first mode eigenfrequency predicted by the FEM model with free boundary condition and flexible platform shows good agreement with the measured frequency.
Table 5.
First mode natural frequency.
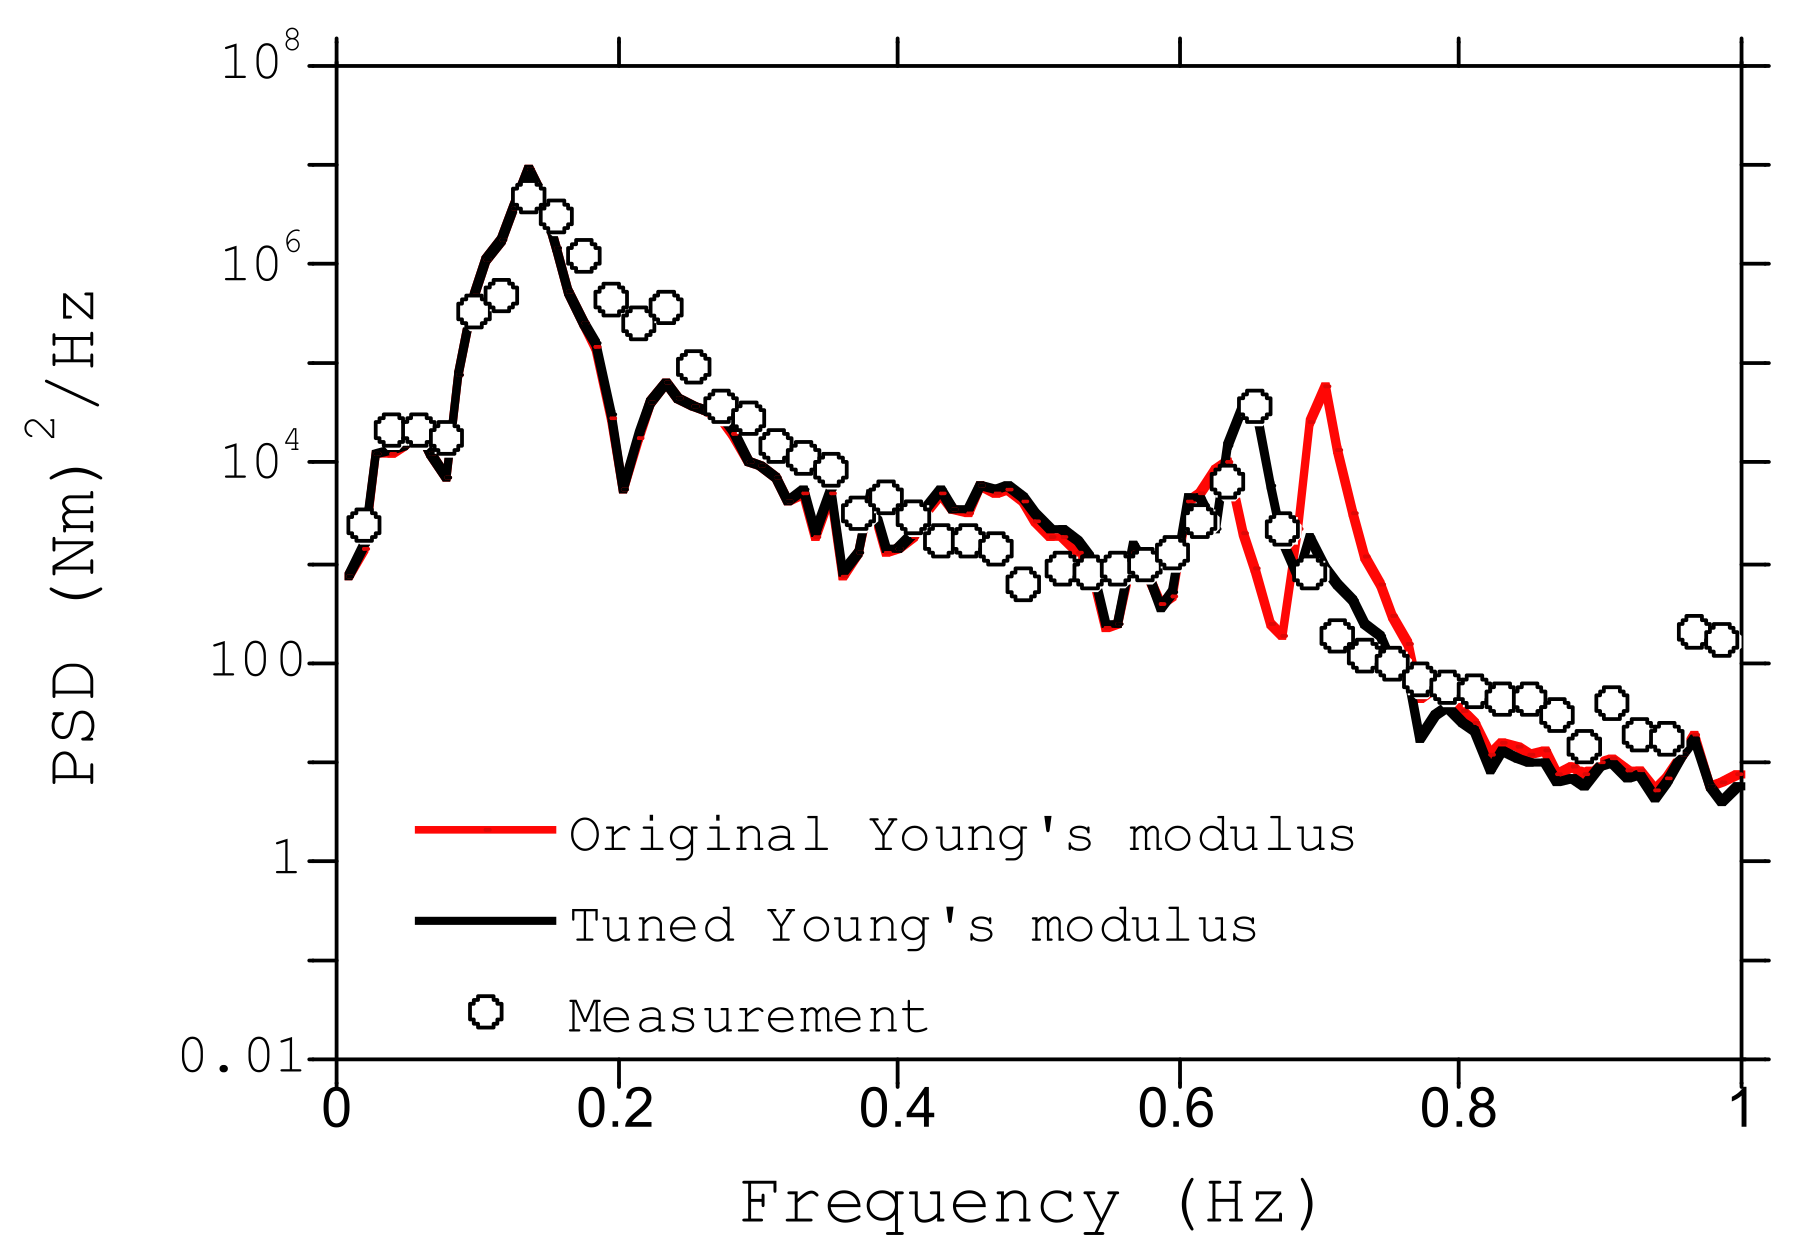
Many wind turbine simulation tools, such as FAST, use rigid platform model. Therefore, the tower stiffness of the wind turbine model with rigid platform should be tuned by using the results of the FEM eigenvalue analysis. The tuning of the tower stiffness can be achieved by tuning the Young’s modulus by using Equation (18) instead of adjusting the length of the tower [13].
where is the original Young’s modulus and is the tuned Young’s modulus, which is used for the dynamic simulation. Two dynamic simulations were performed by using the original Young’s modulus and the tuned one at 9:40–9:50 a.m. on 16 March 2015 in parked condition. The wind speed was 2.7 m/s, and the significant wave height and the peak wave period were 1.2 m and 8.0 s. The predicted power spectral density of tower base moments is shown in Figure 6. The simulation with the tuned Young’s modulus shows better agreement with the measurement and the overestimation of the tower first mode frequency was improved.

Figure 6.
Power spectral density of fore-aft tower base moment in parked condition.
3.3. The Characteristics of Wind and Wave Actions
The characteristics of wind and wave actions are investigated by using coupled and uncoupled approaches. The mean value and the standard deviation of the fore-aft bending moment at the tower top and the bottom are obtained from the dynamic simulations and compared with the measurement.
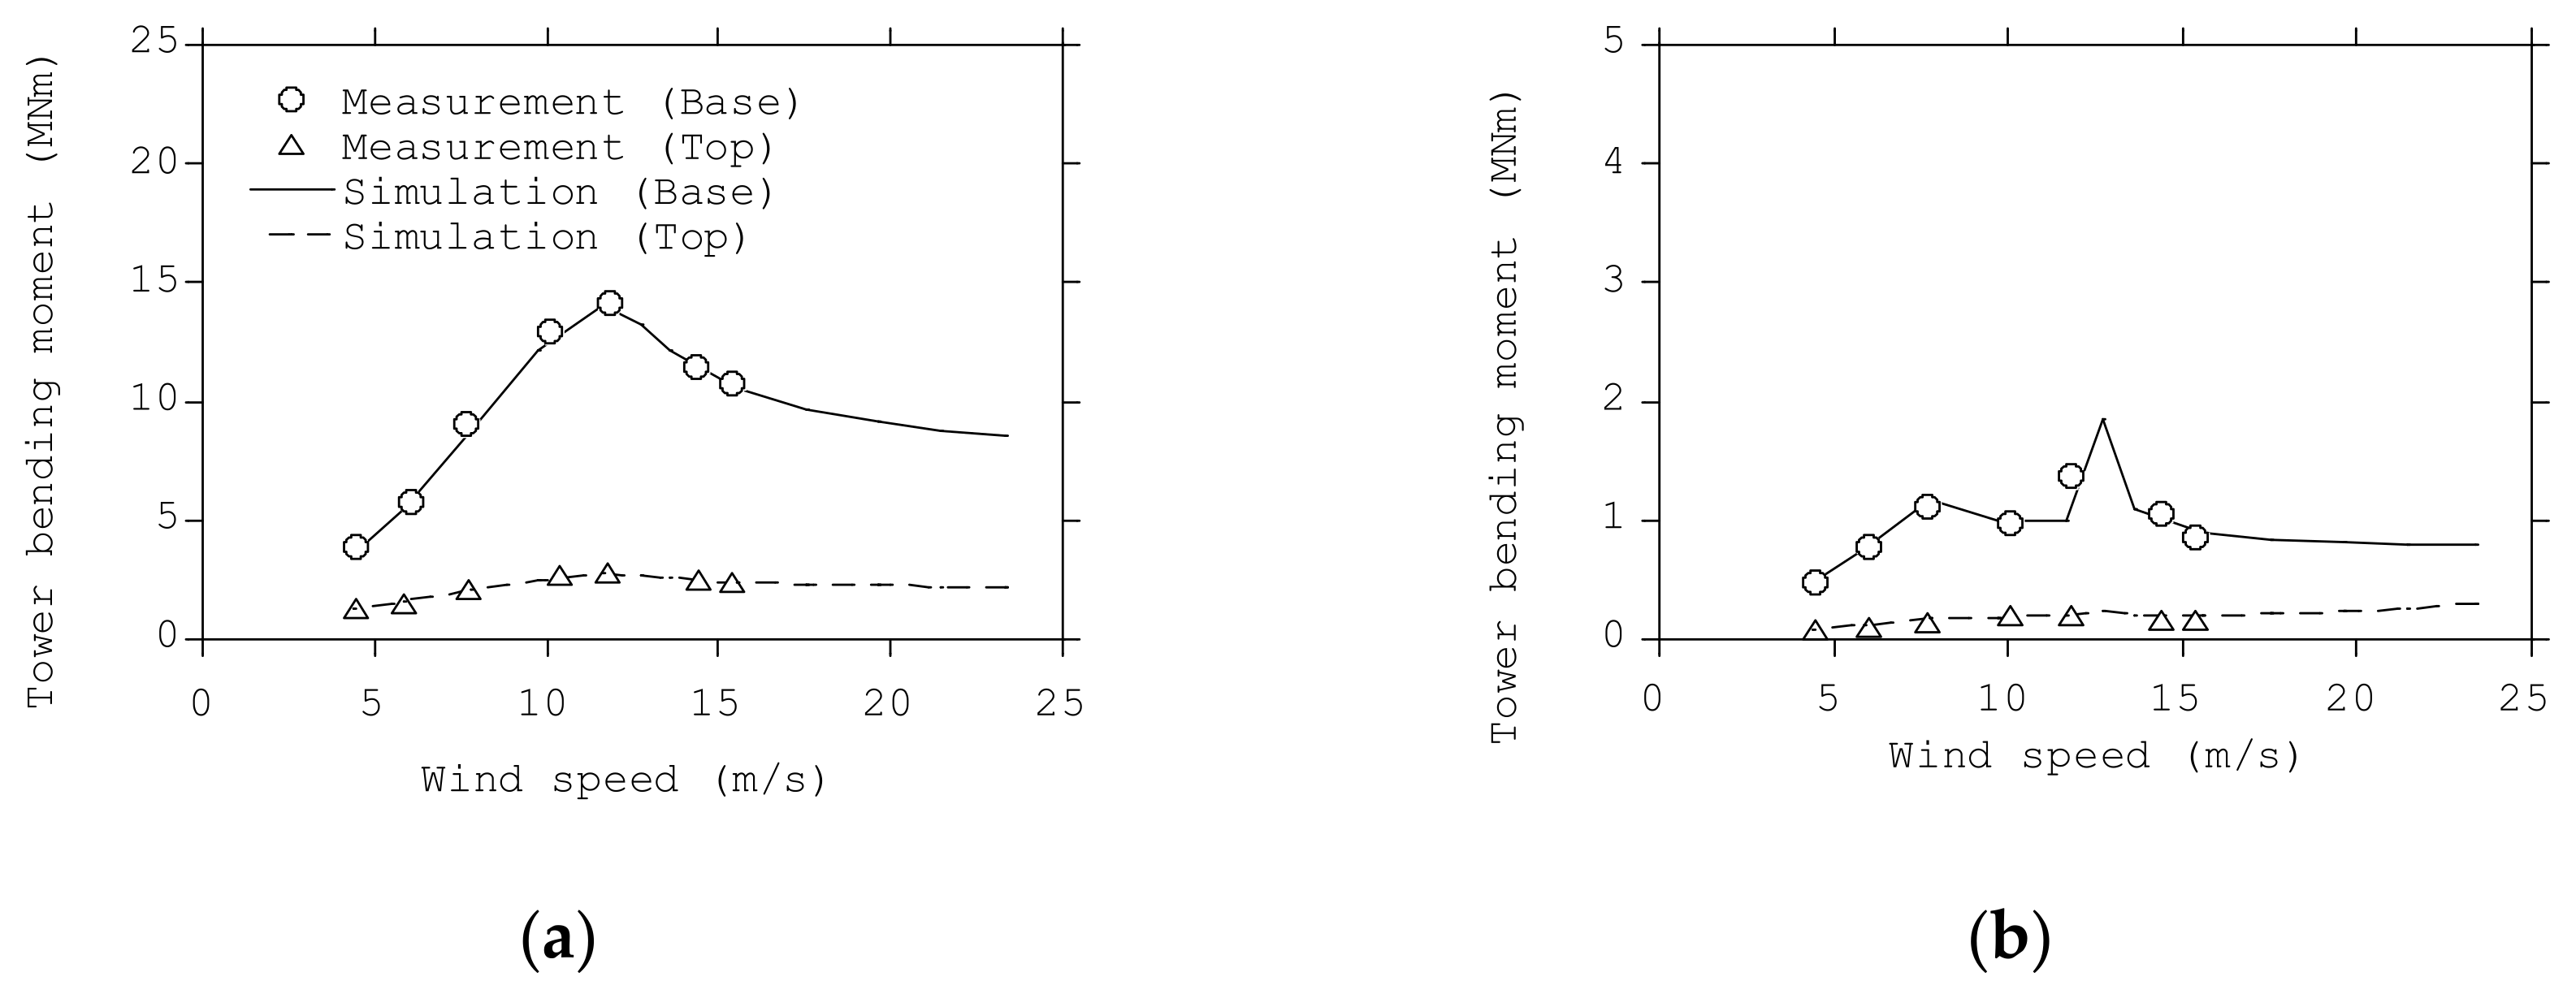
First, the characteristic of the wind action was investigated. To minimize the effect of the wave, the low wave height case with m was chosen and the wave period was fixed to 10 s. For the measurement data, the mean value of all the data of which the significant wave height was between 0.25 and 0.75 m, and the peak wave periods between 8.0 and 12.0 s were plotted. The Kaimal spectrum for wind and JONSWAP spectrum for wave were used in the simulation. The predicted mean value and standard deviation of the fore-aft tower bending moments in Figure 7 showed good agreement with the measurements at the tower top and base. The peak values near the rated wind speed were observed at the tower base, while these peaks were not obvious at the tower top. These characteristics were similar to those obtained by Yamaguchi et al. [28] for a bottom fixed offshore wind turbine at the Choshi site.
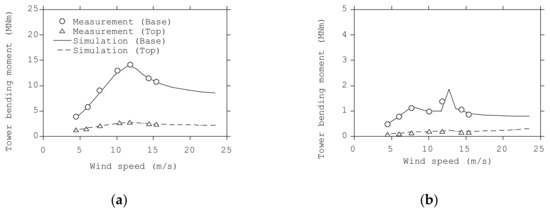
Figure 7.
Effect of wind speed on (a) mean and (b) standard deviation of the fore-aft bending moment at the tower top and base.
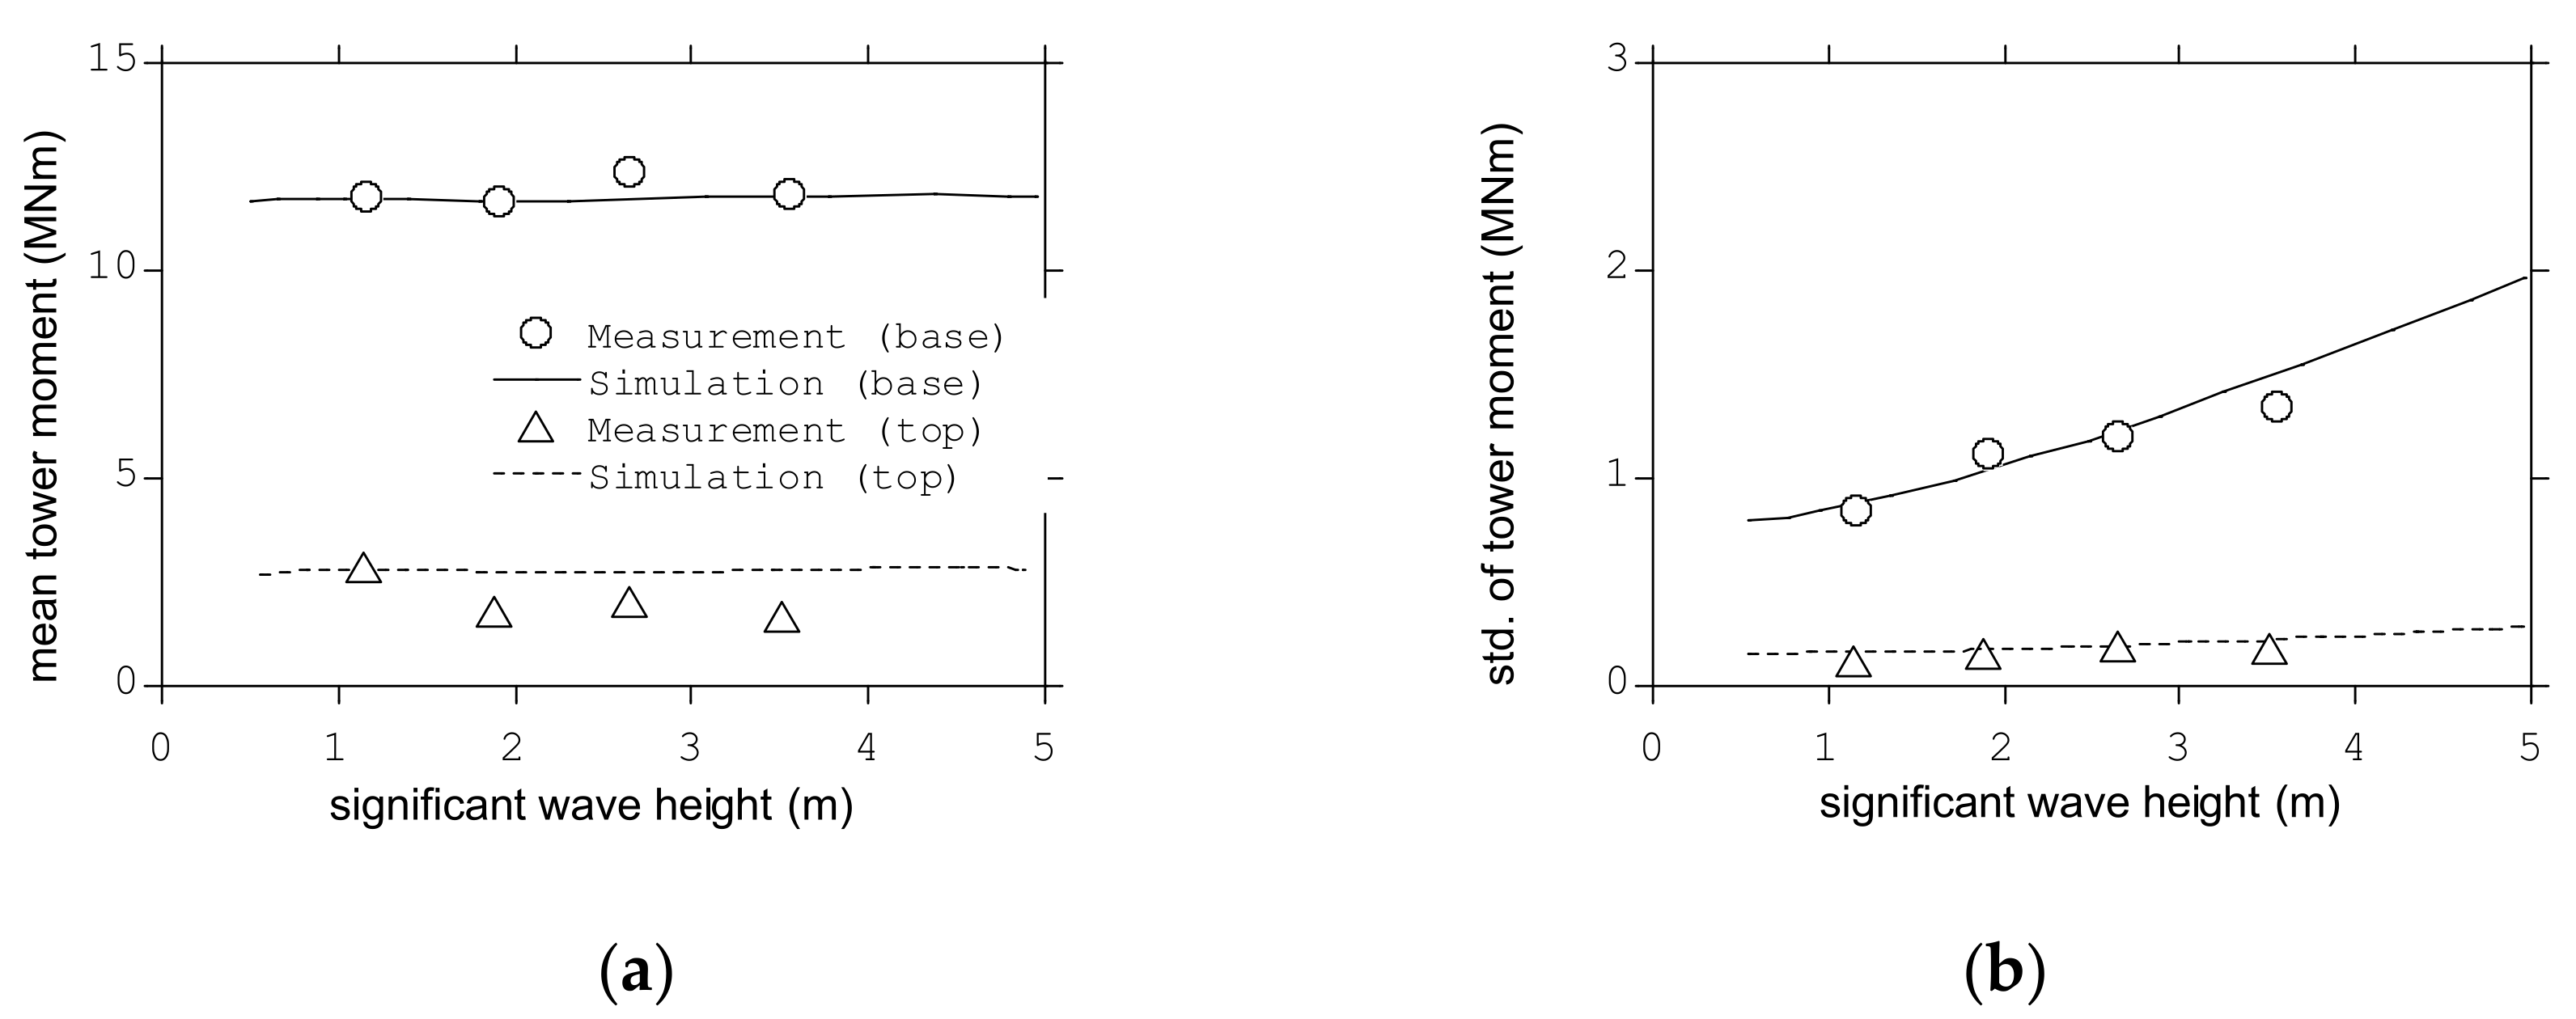
The effect of wave height on the wind turbine tower loadings were then investigated. In this study, only fore-aft bending moment was investigated, which is usually the dominant factor in the design of the tower in DLC 1.6, and relevant platform motions such as pitch and surge were discussed. Figure 8 shows the mean and the standard deviation of the fore-aft tower bending moments as function of the significant wave height. The mean wind speed was fixed to 9.0 m/s and the peak wave period is fixed to 10.0 s. For the measurement data, the mean value of all the data of which the mean wind speed was between 8.0 and 10.0 m/s and the peak wave periods between 8.0 and 12.0 s were plotted. The increase of the wave height did not cause the increase of the mean tower bending moment. On the other hand, the standard deviation of the tower bending moment increased as the significant wave height increased. This conclusion was same as that obtained by Long et al. [17].
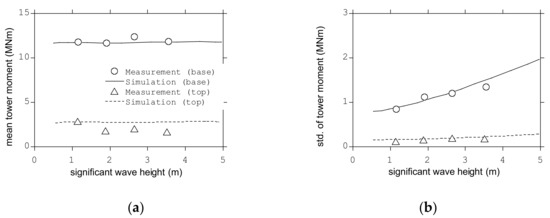
Figure 8.
Effect of significant wave height on (a) mean and (b) standard deviation of fore-aft tower bending moments at the tower top and base.
The contribution of platform motion to the standard deviation of tower bending moments for different significant wave height was investigated by using the dynamic simulations and Equations (5)–(8). Figure 9 shows the standard deviation of the fore-aft tower bending moment induced by the total platform motion , pitch angle , pitch angular acceleration , and surge acceleration as functions of significant wave height. As discussed above, the total standard deviation increased as the wave height increased, which is caused by the fact that all of the platform motions increase with the significant wave height.
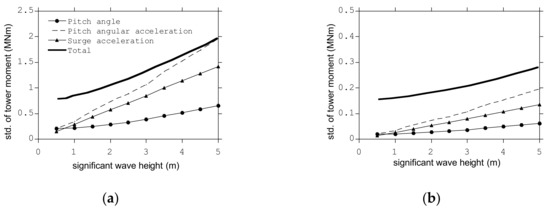
Figure 9.
Standard deviation of fore-aft tower bending moments as function of significant wave height at (a) tower base and (b) tower top.
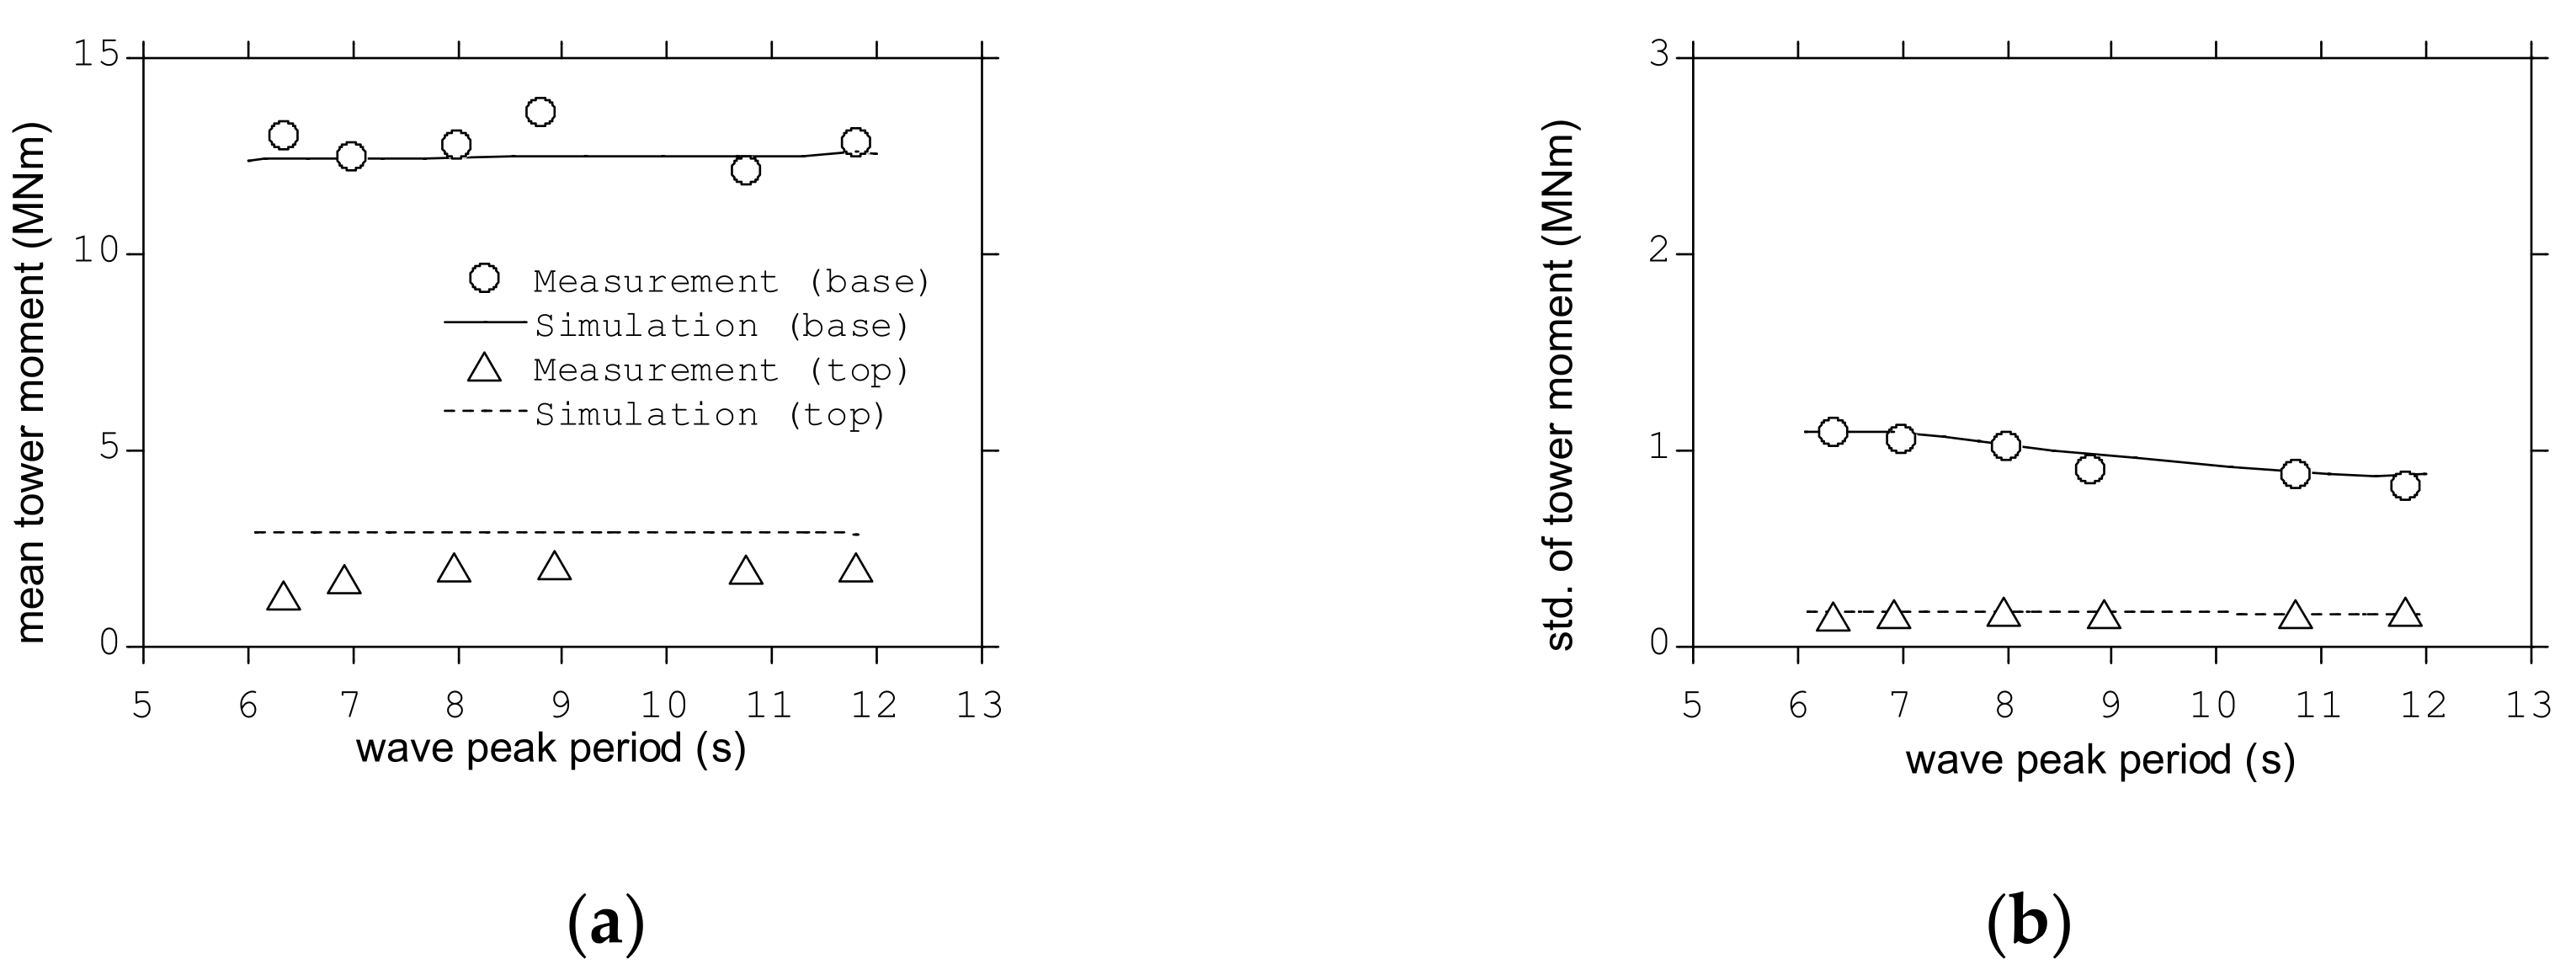
As shown in Figure 10, the mean tower bending moments were almost unaffected by the wave period at the tower top and base. However, the standard deviation of the tower bending moment decreased with the increases of the peak wave period at the tower base and results in the decrease of fatigue load as mentioned by Kvittem and Moan [16].

Figure 10.
Effect of peak wave period on (a) mean and (b) standard deviation of fore-aft tower bending moments at the tower top and base.
The contribution of platform motion to the standard deviation of fore-aft tower bending moments for different peak wave period are also investigated to clarify the reason of this decrease by using the dynamic simulations and Equations (5)–(8) as shown in Figure 11. It is clear that this decrease was caused by the decrease of and since the pitch and surge accelerations decrease when the peak period increases, and this causes the reduction of the total standard deviation of the fore-aft tower bending moment.
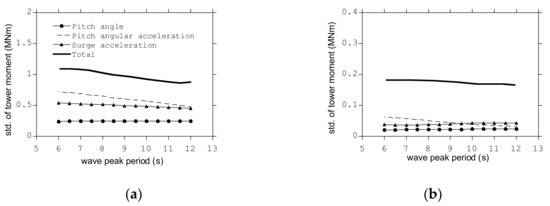
Figure 11.
Standard deviation of the fore-aft tower bending moment as function of wave period: (a) tower base; (b) tower top.
3.4. Comparison between Coupled and Uncoupled Approach for the Extreme Sea States
The DLC 1.6 was the one of the most significant design load cases defined by IEC TS 61400-3-2 [12], which is for the extreme sea state during power production. Note that the wind turbine was in operation in this load case. For the wind condition, the normal wind turbulence model was considered. For the wave height, the unconditional extreme significant wave height, Hs50, with a recurrence period of 50 years was used as a conservative value instead of the significant wave height, Hs,SSS (V), for each severe sea state. For the wave period, the designer shall take account of the range of wave period appropriate to each extreme wave height. In this study, the wind and wave misalignment was not considered because the wind and wave co-directional case causes the maximum load in this load case as mentioned IEC TS 61400-3-2 [12].
In this study, the significant wave height of 6.1 m and three wave periods of 7, 10, and 13 s were chosen as an example of DLC 1.6. Table 6 shows the environmental conditions for these extreme sea states. The coupled and uncoupled simulations were performed for these conditions.
Table 6.
The environmental conditions for the extreme sea states.
For the uncoupled simulation, the mooring stiffness in Equation (10) needed to be identified. This value can be estimated by linearizing the relationship of pitch angle of platform and restoring moment caused by the mooring line by using analytical solution of the catenary. Figure 12 shows this relationship between the restoring pitch moment from mooring lines and pitch angle. The mooring stiffness was calculated from the slope as 22.69 MNm/rad. On the other hand, the hydrostatic stiffness in Equation (12) was 496.7 MNm/rad, which means approximately 4% of the pitch stiffness comes from the mooring line and 96% from the hydrostatic stiffness of the platform.

Figure 12.
The relationship between the restoring pitch moment from mooring lines and pitch angle.
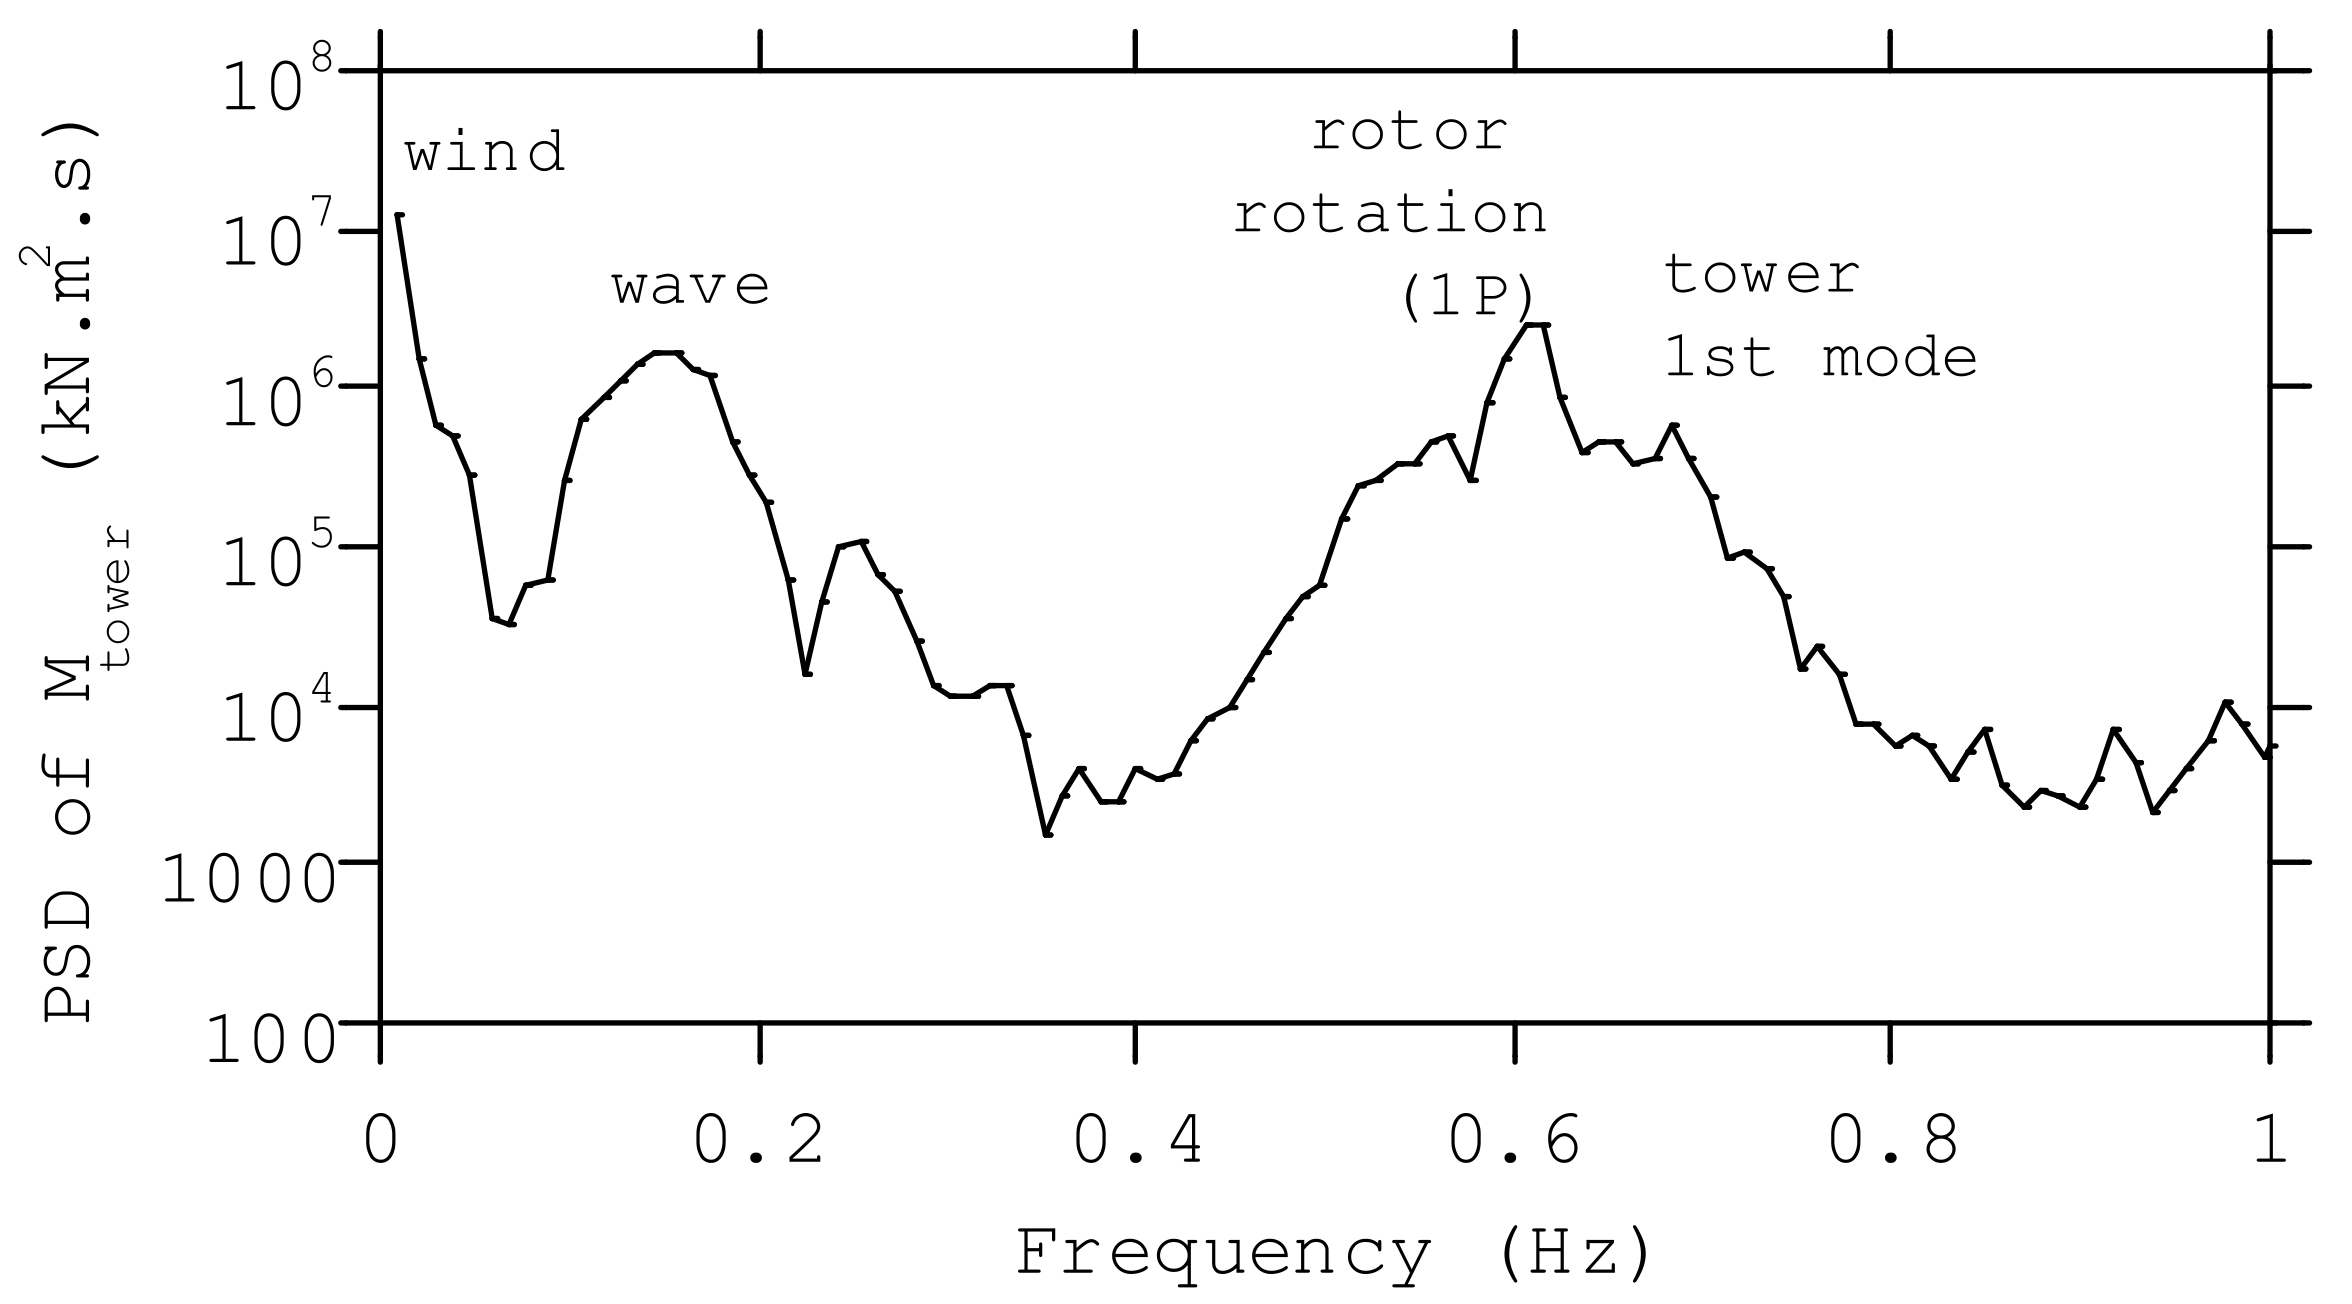
Figure 13 shows the power spectrum density of the tower base fore-aft moment in extreme sea state during power production, in which three peaks are clearly observed. The first peak in low frequency region was caused by the background component of wind load, the second one corresponded to the wave frequency, the third one was due to the rotor rotation frequency (1P) and tower first mode frequency which are caused by the resonance with wind. These three peaks were separated each other and implies each component can be evaluated separately.
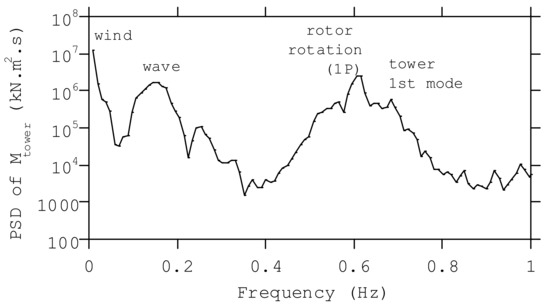
Figure 13.
Power spectrum density of the fore-aft tower base moment in extreme sea stated during power production.
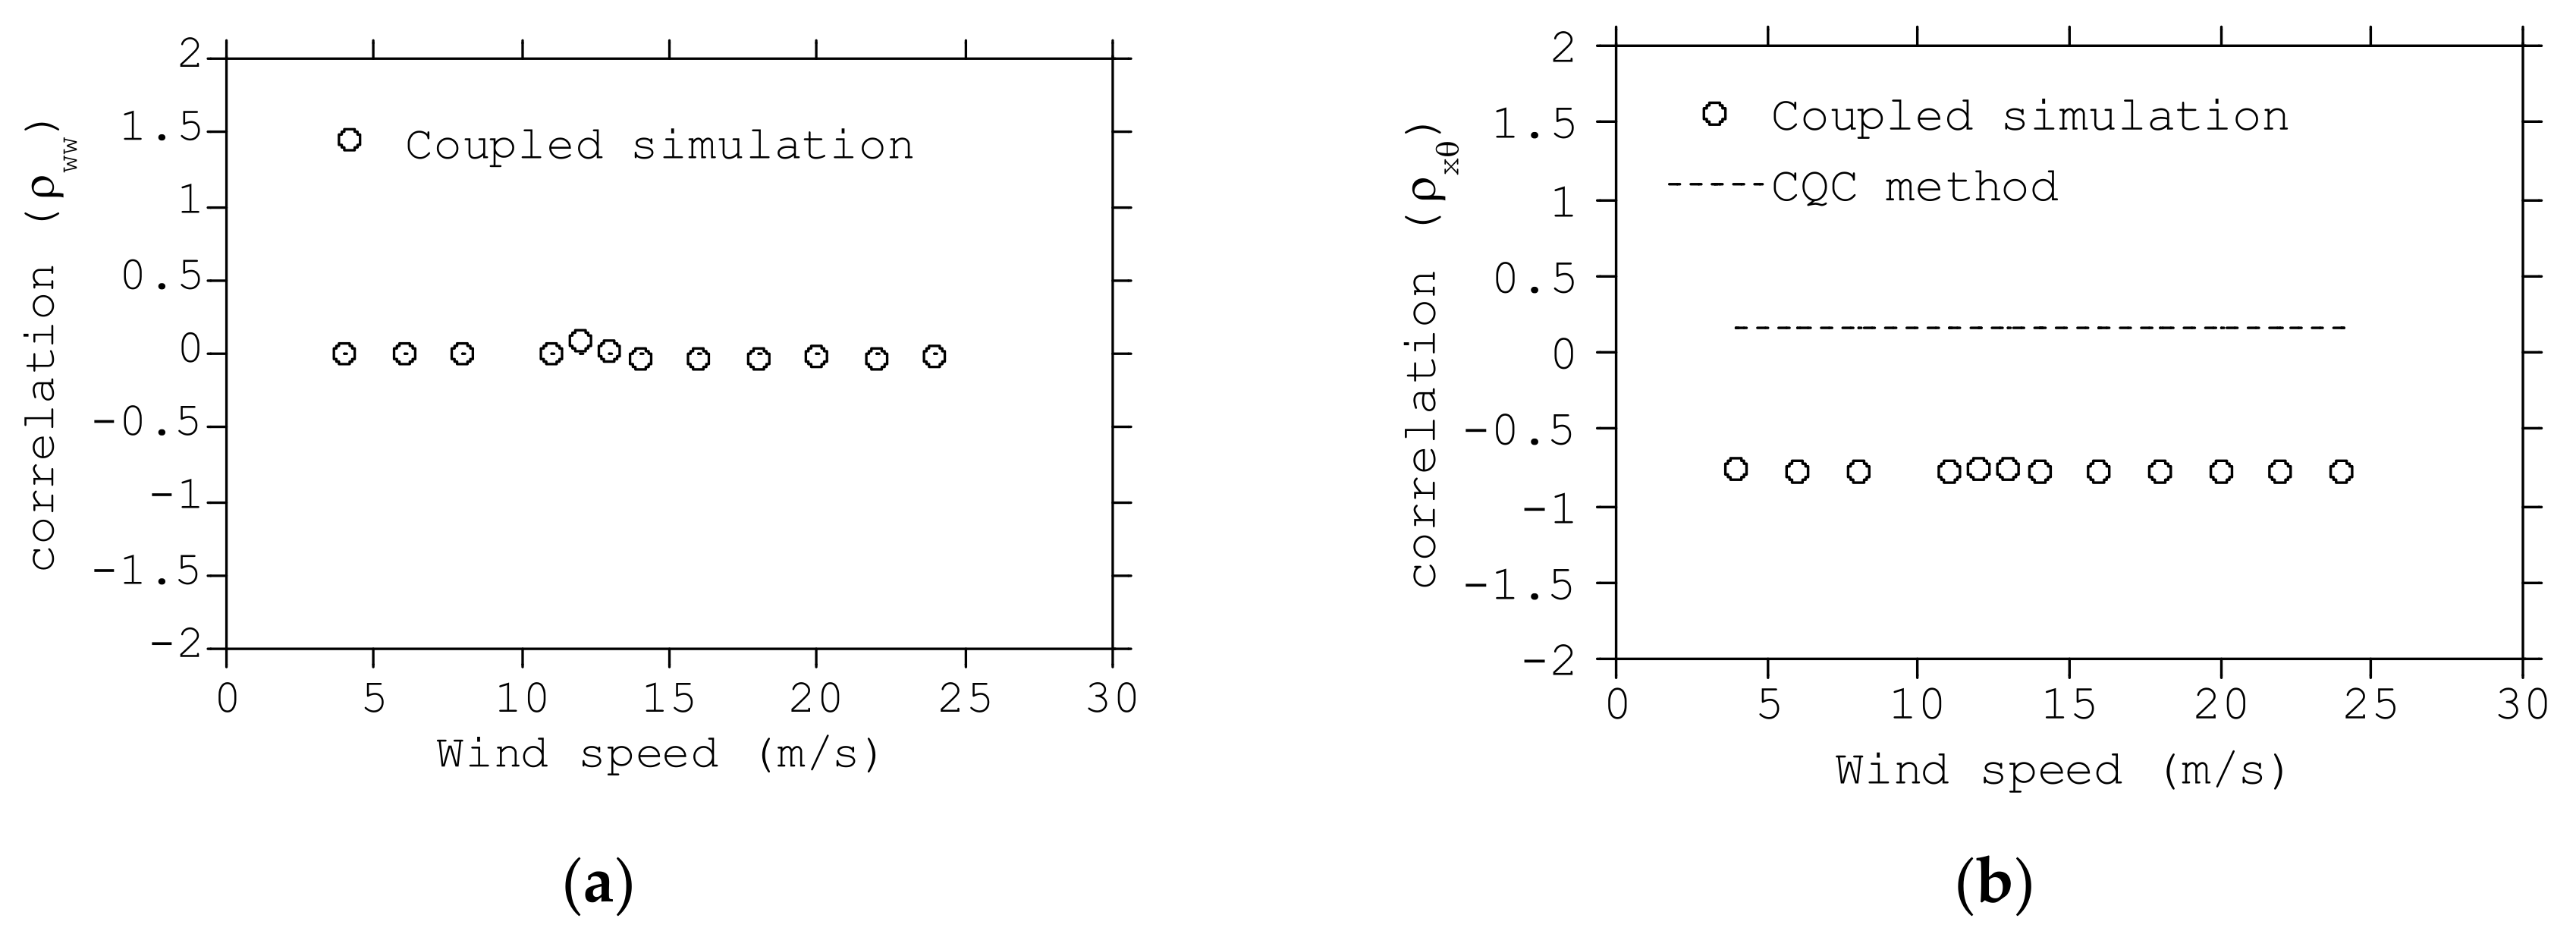
In the uncoupled simulation, it was assumed that there was no correlation between the fluctuating wind and wave actions as mentioned in Xu and Ishihara [18]. Figure 14a shows the correlation coefficient between the fore-aft tower base moments caused by wind and wave obtained from the coupled simulations with = 10 s. It indicates that the assumption of no correlation is reasonable. Figure 14b shows the correlation coefficients between the platform pitch motion induced fore-aft tower base moment, , as shown in Equations (2) and (3), and the platform surge motion induced one, , as shown in Equation (4). It was found that these correlation coefficients were negative. This is natural as the center of the platform pitch motion is located between the center of gravity of the system and center of buoyancy of the system, which means the surge motion which is defined at the center of gravity of the system is always negatively correlated with the pitch motion. On the other hand, the CQC method [29] for the calculation of the correlation between elastic modes of structure shows positive values and results in the overestimation of the fluctuating tower bending moments.

Figure 14.
The correlation coefficient of fluctuating fore-aft tower base moment. (a) Correlation between wind and wave induced loads, (b) correlation between pitch and surge motion induced loads.
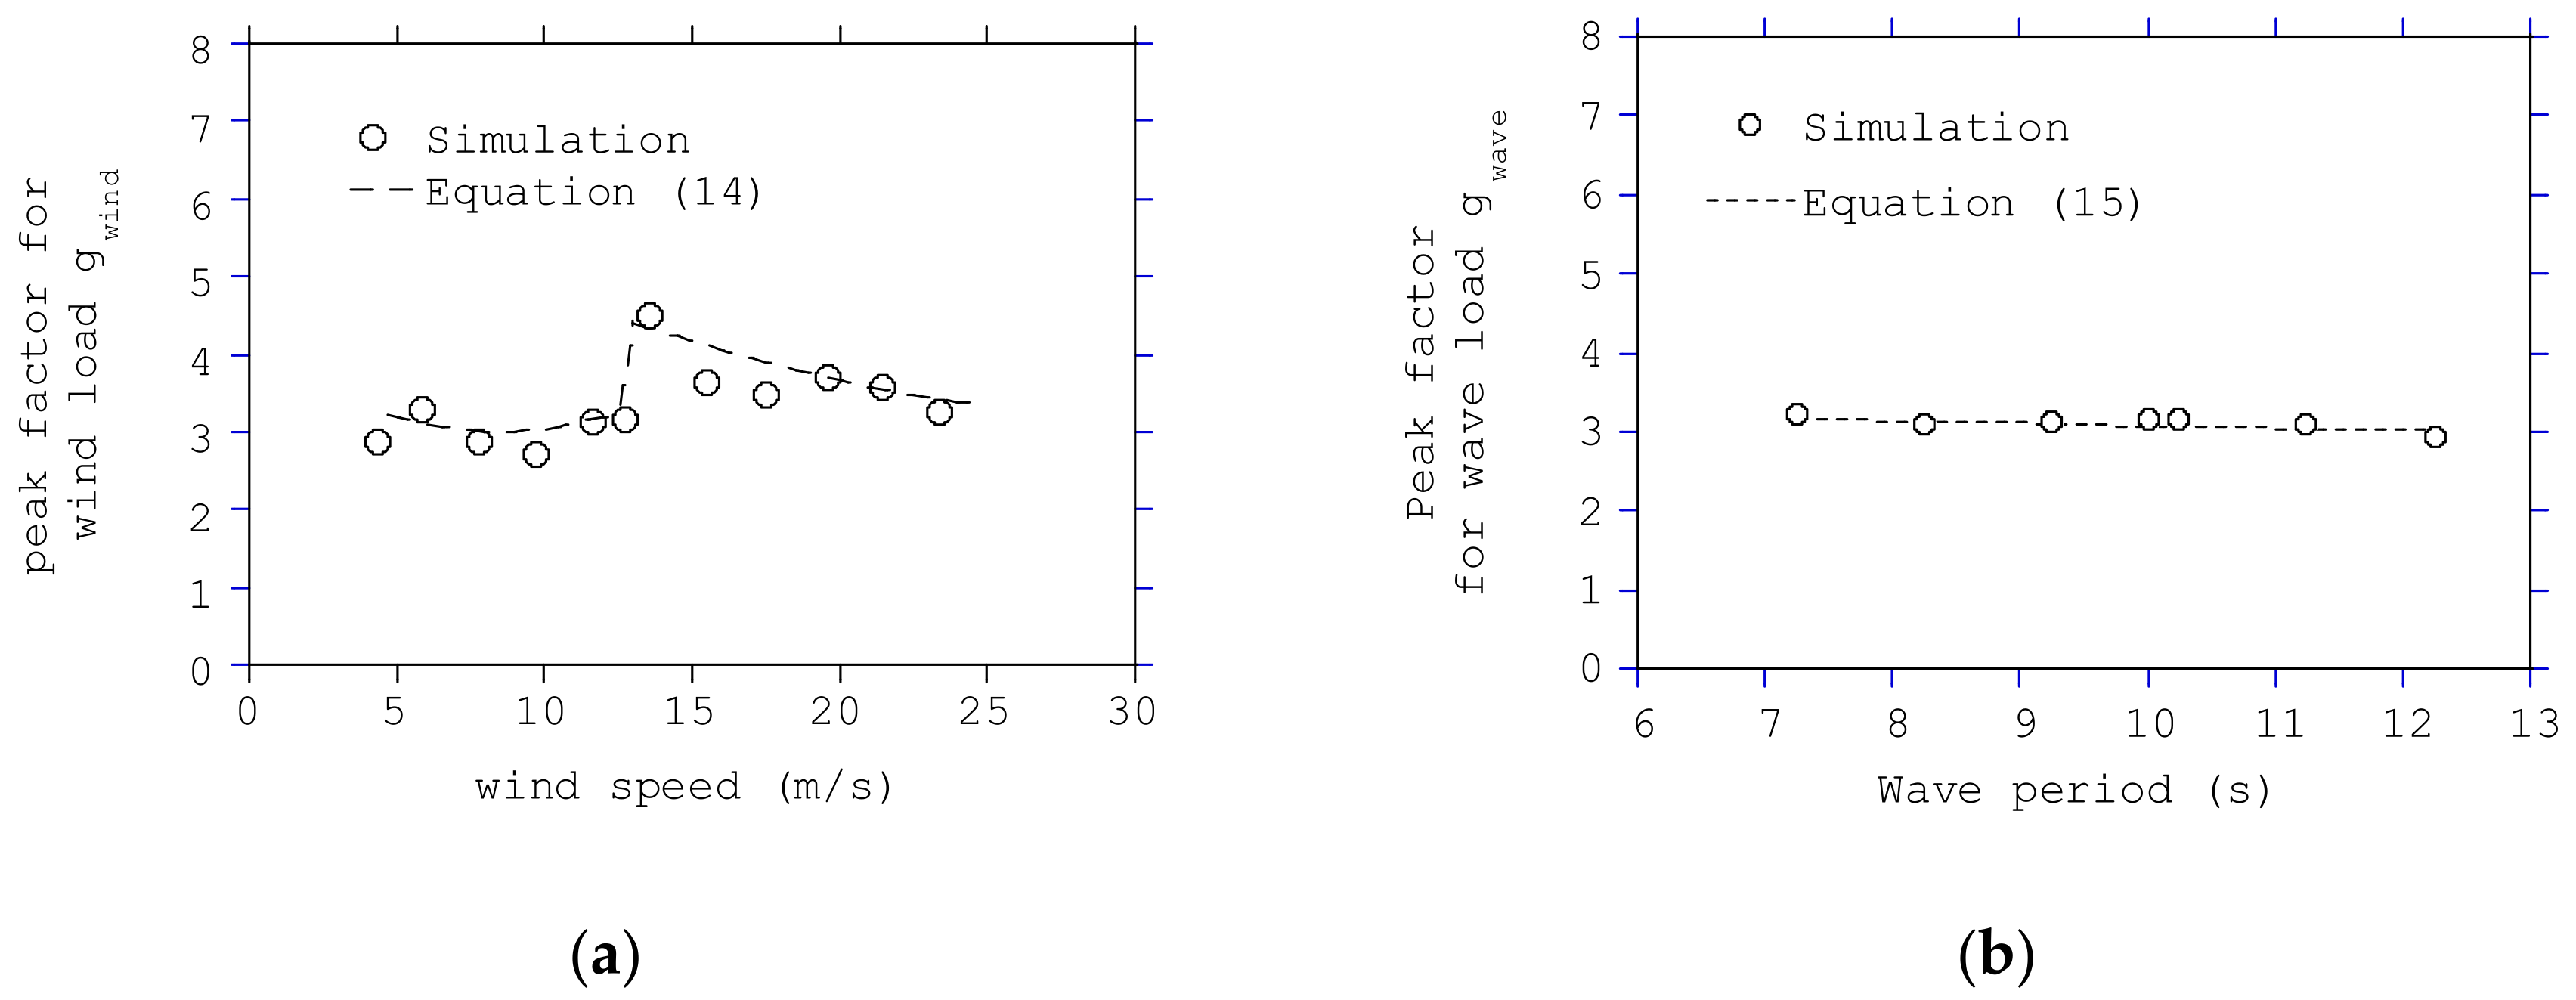
The proposed peak factor as shown in Equations (14) and (15) also needs to be validated. Figure 15a shows the peak factors for wind actions obtained from the simulation of bottom mounted wind turbine and Equation (14). Figure 15b shows the peak factors for wave action obtained from the platform motion of the coupled simulation and Equation (15). The proposed peak factors show good agreement with those from the coupled simulations.
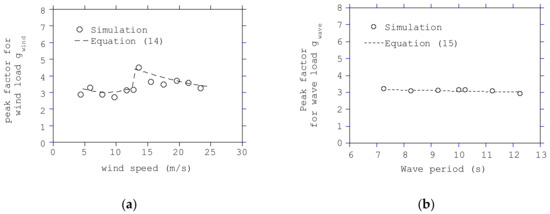
Figure 15.
Comparison of the peak factors of fore-aft tower base moment: (a) wind load, (b) wave load.
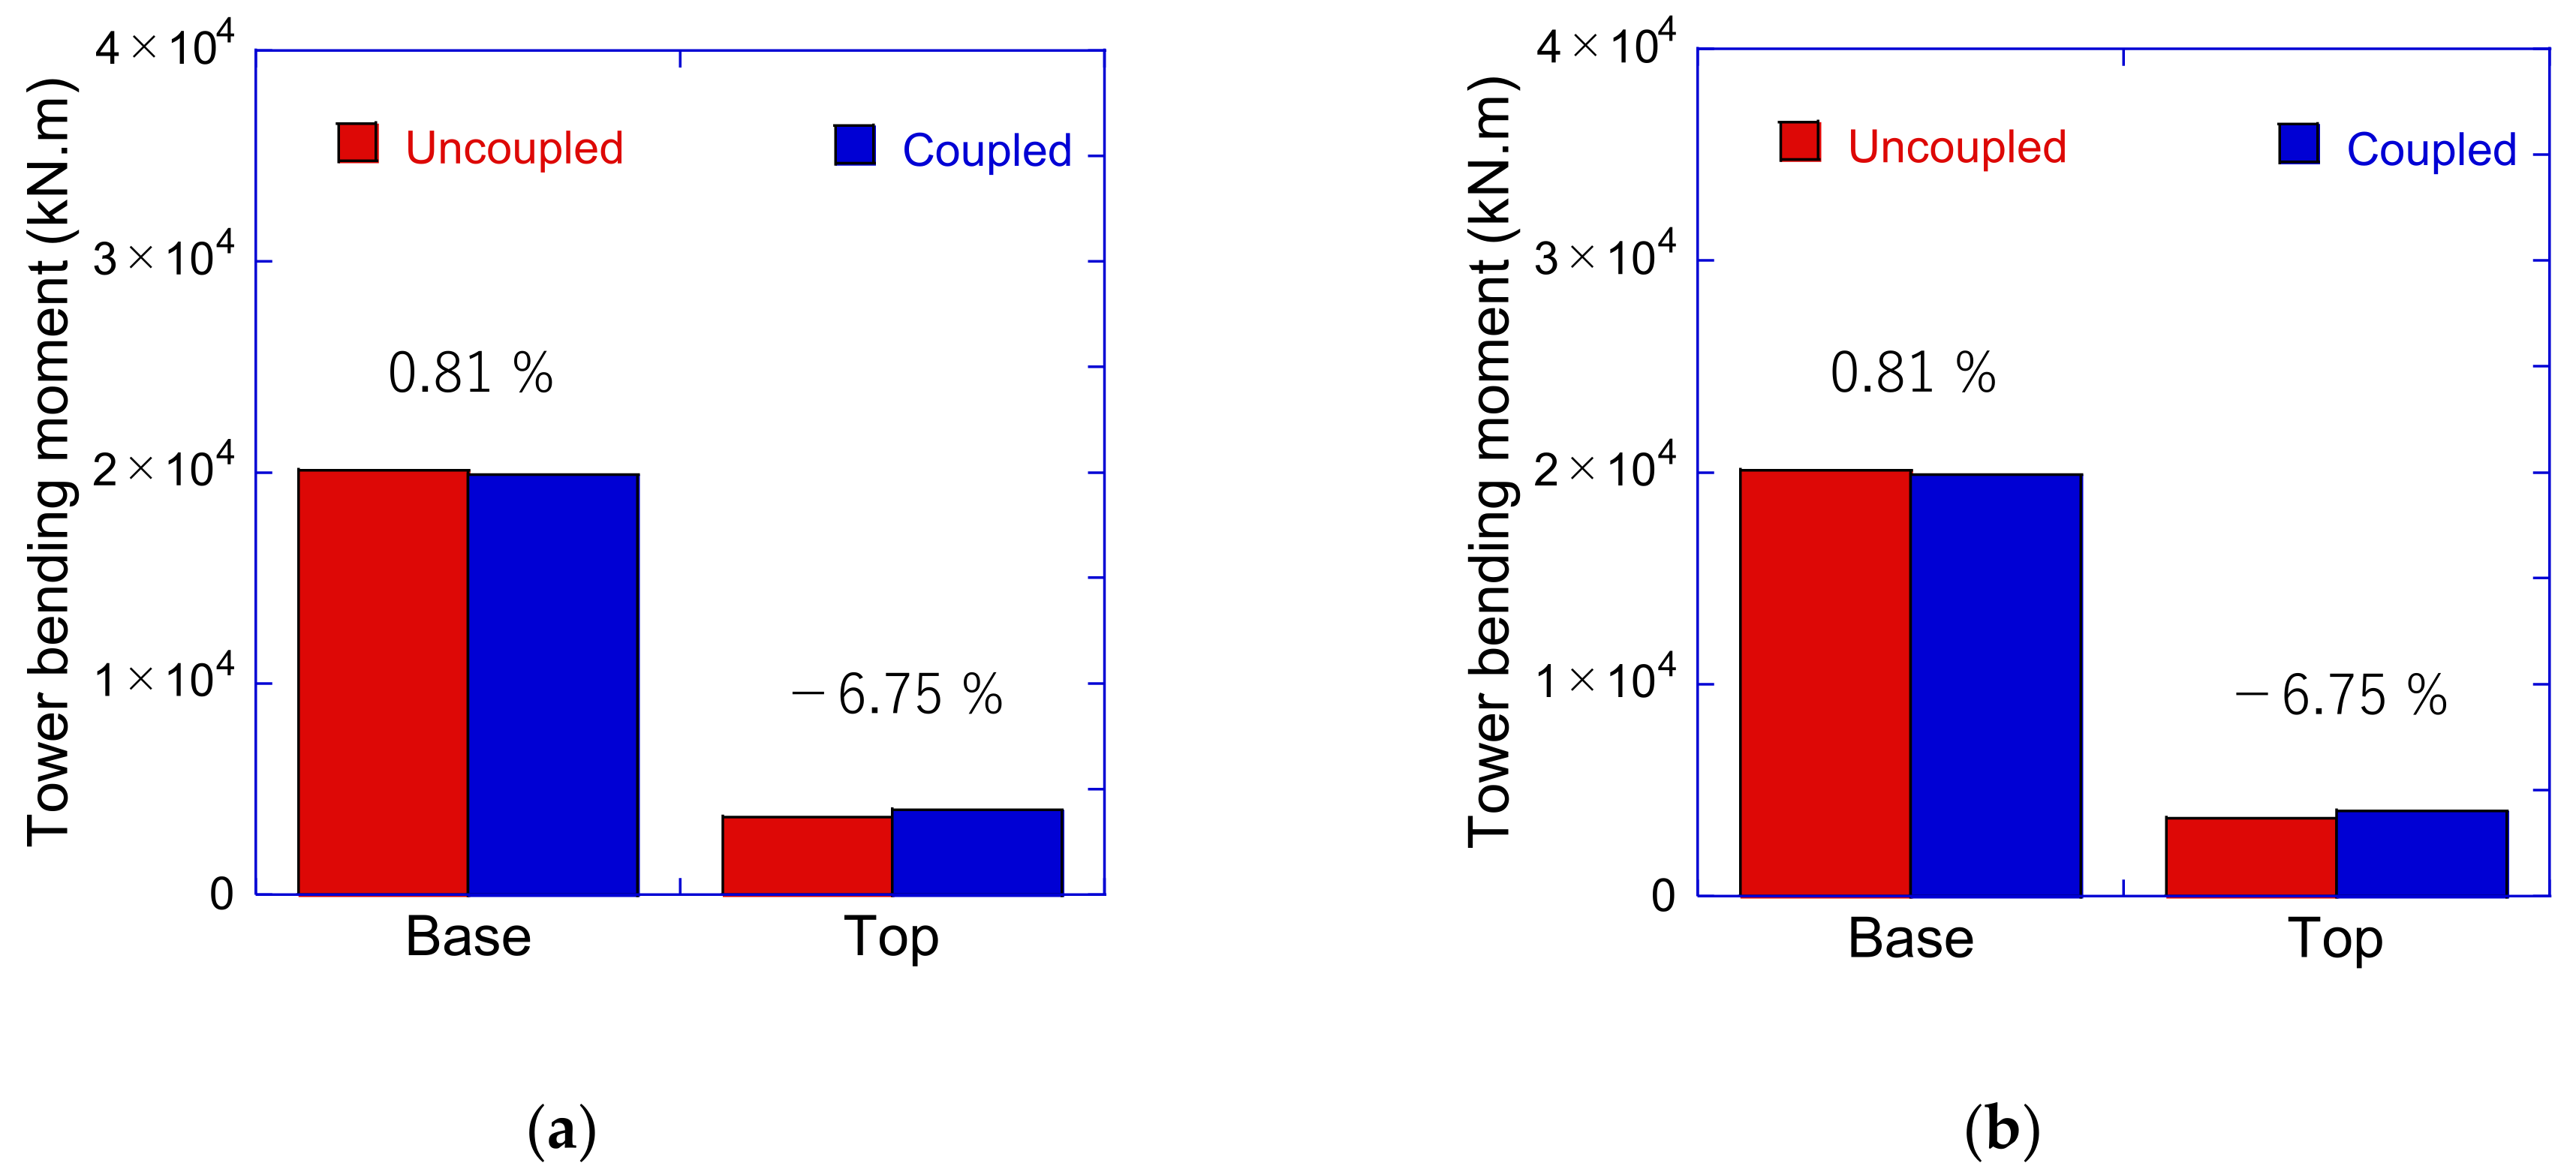
Finally, the extreme load of DLC 1.6 in IEC TS 61400-3-2 [6], in which the wind turbine is in operation, was calculated by using the coupled and uncoupled approaches. The mean value and the maximum value of the fore-aft tower bending moment at the tower base and the tower top are shown in Figure 16. It was found that the values from the uncoupled approach showed good agreement with those from the coupled one.

Figure 16.
The fore-aft tower bending moment at the tower base and the top during power production under severe sea state. (a) Mean tower bending moment, (b) maximum tower bending moment.
The number of simulations can significantly be reduced by using the proposed uncoupled approach. According to IEC TS 61400-3-2 [6], the coupled simulations need to be performed under each combination of winds and waves, and at least six realizations of each wind and wave combination should be considered by using different random seeds to reduce the uncertainty in the estimation of the maximum value. The total number of the simulation was then 6 seeds × 12 wind speeds × 3 wave periods, which in total was equal to 216 cases. For each case, 1 h simulation was required. Therefore, in total the required simulation time length was 216 h calculated from 216 cases of 1-h simulation. When the uncoupled approach was used, the calculation of wind and wave included loads could be performed separately. The wind-induced load could be estimated by the simulation of the bottom fixed wind turbine, in which case only a 10-min simulation was required for each wind speed. The wave induced load can be estimated by using 1 h simulation of only three wave period conditions. Therefore, the total number of the calculation was equal to 12 wind cases of 10 min simulation plus 3 wave cases of 1 h simulation. In total, the required simulation time length was 12 cases × 1/6 h + 3 cases × 1 h, which is equal to 5 h. This means that the uncoupled approach can significantly reduce simulation time to 1/40 compared with the coupled approach.
4. Conclusions
In this study, the effects of wind and wave actions on FOWT are investigated and an uncoupled approach for the load calculation is proposed. Following conclusions are obtained.
- The elasticity and the bottom boundary condition of the platform had to be considered to accurately predict the tower first mode frequency. When performing the dynamic simulation of FOWTs by using rigid platform model such as FAST, the effect of the elasticity of platform could be considered by tuning the Young’s modulus of the tower material to fit the tower first model frequency obtained by the finite element method. The predicted power spectrum density of the fore-aft tower base moment by using the proposed method shows good agreement with the measurement;
- The difference of the wind load between the bottom fixed wind turbine and floating wind turbine was observed only in the mean component and can be corrected by considering the hydrostatic stiffness of platform and mooring stiffness, since the fluctuating wind load of wind turbine tower on semi-submersible platforms did not show difference from that on fixed foundations;
- The standard deviation of the fore-aft tower moment increased as the significant wave heights increased when the mean wind speed and peak wave period were fixed. On the other hand, the standard deviation of the fore-aft tower bending moment decreased as the peak wave periods increased when the mean wind speed and significant wave height were fixed. It was found that the increase of the significant wave height causes the increase of the pitch and surge motions of the platform resulting in the increase of the fluctuating fore-aft tower moment, and the increase of the peak wave period caused the decrease of the pitch and surge accelerations of the platform resulting in the decrease of the fluctuating fore-aft tower moment;
- The predicted tower loading in extreme sea states during power production by the proposed uncoupled approach show good agreement with those by the coupled approach, and the simulation time was reduced to 1/40 for FOWTs on semi-submersible platforms because the effect of wind action and wave action can be calculated separately.
Author Contributions
Conceptualization, A.Y. and T.I.; methodology, A.Y. and T.I.; data curation, S.D.; investigation, A.Y., S.D. and T.I.; formal analysis, S.D.; visualization, S.D; writing—original draft, A.Y.; writing—review and editing, T.I.; supervision, T.I.; project administration, T.I.; funding acquisition, T.I. All authors have read and agreed to the published version of the manuscript.
Funding
This research received no external funding.
Institutional Review Board Statement
Not applicable.
Informed Consent Statement
Not applicable.
Data Availability Statement
Data sharing not applicable.
Acknowledgments
This research is carried out as a part of the Fukushima floating offshore wind farm demonstration project funded by the Ministry of Economy, Trade, and Industry. The authors wish to express their deepest gratitude to the concerned parties for their assistance during this study.
Conflicts of Interest
The authors declare no conflict of interest.
References
- Dhingra, T.; Sengar, A.; Sajith, S. A fuzzy analytic hierarchy process-based analysis for prioritization of barriers to offshore wind energy. J. Clean. Prod. 2022, 345, 131111. [Google Scholar] [CrossRef]
- Dokur, E.; Erdogan, N.; Salari, M.E.; Karakuzu, C.; Murphy, J. Offshore Wind Speed Short-Term Forecasting Based on a Hybrid Method: Swarm Decomposition and Meta-Extreme Learning Machine. Available online: https://ssrn.com/abstract=4000338 (accessed on 14 March 2022).
- Calautit, K.; Aquino, A.; Calautit, J.K.; Nejat, P.; Jomehzadeh, F.; Hughes, B.R. A review of numerical modelling of multi-scale wind turbines and their Environment. Computation 2018, 6, 24. [Google Scholar] [CrossRef] [Green Version]
- Buljac, A.; Kozmar, H.; Yang, W.; Kareem, A. Concurrent wind, wave and current loads on a monopile-supported offshore wind turbine. Eng. Struct. 2022, 255, 113950. [Google Scholar] [CrossRef]
- Dinh, Q.V.; Doan, Q.V.; Ngo-Duc, T.; Dinh, V.N.; Duc, N.D. Offshore wind resource in the context of global climate change over a tropical area. Appl. Energy 2022, 308, 118369. [Google Scholar] [CrossRef]
- Lerche, J.; Lindhard, S.; Enevoldsen, P.; Velaayudan, A.; Teizer, J.; Neve, H.H.; Wandahl, S. What can be learned from variability in offshore wind projects. Energy Strategy Rev. 2022, 39, 100794. [Google Scholar] [CrossRef]
- Wang, C.M.; Utsunomiya, T.; Wee, S.C.; Choo, Y.S. Research on floating wind turbines: A literature survey. IES J. Part A Civ. Struct. Eng. 2010, 3, 267–277. [Google Scholar] [CrossRef] [Green Version]
- Twidell, J.; Gaudiosi, G. (Eds.) Offshore Wind Power; Multi-Science Publishing Co. Ltd.: Essex, UK, 2009. [Google Scholar]
- Goupee, A.J.; Koo, B.J.; Kimball, R.W.; Lambrakos, K.F.; Dagher, H.J. Experimental comparison of three floating wind turbine concepts. J. Offshore Mech. Arct. Eng. 2014, 136, 020906. [Google Scholar] [CrossRef]
- Tang, Y.G.; Song, K.; Wang, B. Experiment study of dynamics response for wind turbine system of floating foundation. China Ocean Eng. 2015, 29, 835–846. [Google Scholar] [CrossRef]
- Robertson, A.N.; Jonkman, J.M. Loads analysis of several offshore floating wind turbine concepts. In Proceedings of the International Society of Offshore and Polar Engineers 2011 Conference, Maui, HI, USA, 19–24 June 2011; Available online: https://www.nrel.gov/docs/fy12osti/50539.pdf (accessed on 14 March 2022).
- IEC TS 61400-3-2; Wind Energy Generation Systems—Part 3-2: Design Requirements for Floating Offshore Wind Turbines, Edition 1.0. International Electrotechnical Commission: Geneva, Switzerland, 5 April 2019.
- Zhang, S.; Ishihara, T. Effects of Multidirectional Sea States and Flexible Foundation on Dynamic Response of Floating Offshore Wind Turbine System. In Proceedings of the First International Symposium on Flutter and its Application, Tokyo, Japan, 15–17 May 2016. [Google Scholar]
- Robertson, A.N.; Gueydon, S.; Bachynski, E.; Wang, L.; Jonkman, J.; Alarcón, D.; Amet, E.; Beardsell, A.; Bonnet, P.; Boudet, B.; et al. OC6 Phase I: Investigating the underprediction of low frequency hydrodynamic loads and responses of a floating wind turbine. J. Phys. Conf. Ser. 2020, 1618, 032033. [Google Scholar] [CrossRef]
- Robertson, A.N.; Fabian, W.; Jonkman, J.M.; Wojciech, W.P.; Habib, D. OC5 Project Phase II: Validation of global loads of the DeepCwind floating semisubmersible wind turbine. Energy Procedia 2017, 137, 38–57. [Google Scholar] [CrossRef]
- Kvittem, M.I.; Moan, T. Time domain analysis procedures for fatigue assessment of a semi-submersible wind turbine. Mar. Struct. 2015, 40, 38–59. [Google Scholar] [CrossRef] [Green Version]
- Long, M.; Yanping, H.; Tao, Z. Research on Dynamic Response Characteristics of 6 MW Spar-Type Floating Offshore Wind Turbine. J. Shanghai Jiaotong Univ. (Sci.) 2018, 23, 505–514. [Google Scholar] [CrossRef]
- Xu, N.; Ishihara, T. Prediction of tower loading of floating offshore wind turbine systems in the extreme wind and wave conditions. Wind. Eng. 2014, 38, 463–476. [Google Scholar] [CrossRef]
- Jonkman, J.M.; Buhl, M.L., Jr. Loads Analysis of a Floating Offshore Wind Turbine Using Fully Coupled Simulation. In Proceedings of the Wind Power 2007 Conference & Exhibition, Los Angeles, CA, USA, 3–6 June 2007; Available online: https://www.nrel.gov/docs/fy07osti/41714.pdf (accessed on 14 March 2022).
- Ishihara, T.; Zhang, S. Prediction of dynamic response of semi- submersible floating offshore wind turbine using augmented Morison’s equation with frequency dependent hydrodynamic coefficients. Renew. Energy 2019, 131, 1186–1207. [Google Scholar] [CrossRef]
- Yoshida, S. Variable speed-variable pitch controllers for aero-servo-elastic simulations of wind turbine support structures. J. Fluid Sci. Technol. 2011, 6, 300–312. [Google Scholar] [CrossRef] [Green Version]
- Yamaguchi, A.; Yousefi, I.; Ishihara, T. Reduction of the fluctuating load on wind turbine by using a combined nacelle acceleration feedback and Lidar-based feedforward control. Energies 2020, 13, 4558. [Google Scholar] [CrossRef]
- Liu, Y.; Ishihara, T. Prediction of dynamic response of semi-submersible floating offshore wind turbines by a novel hydrodynamic coefficient model. J. Phys. Conf. Ser. 2019, 1356, 012035. [Google Scholar] [CrossRef]
- Jonkman, J.M.; Buhl, M.L., Jr. A Quantitative Comparison of the Responses of Three Floating Platforms. In Proceedings of the European Offshore Wind 2009 Conference and Exhibition, Stockholm, Sweden, 14–16 September 2009; Available online: https://www.nrel.gov/docs/fy10osti/46726.pdf (accessed on 14 March 2022).
- Yamaguchi, A.; Taki, S.; Ishihara, T. Metocean measurement at Fukushima offshore site. In Proceedings of the Grand Renewable Energy 2018, Yokohama, Japan, 17–22 June 2018. [Google Scholar] [CrossRef]
- IEC61400-1; Wind Energy Generation Systems—Part 1: Design Requirements, Edition 4.0. International Electrotechnical Commission: Geneva, Switzerland, 8 February 2019.
- Michael, S. ABAQUS/Standard User’s Manual, Version 6.9; Dassault Systmes Simulia Corp.: Providence, RI, USA, 2009. [Google Scholar]
- Yamaguchi, A.; Sarli, P.W.; Ishihara, T. Extreme load estimation of the wind turbine tower during power production. Wind Eng. 2019, 45, 93–106. [Google Scholar] [CrossRef]
- Kiureghian, A.D. A response spectrum method for random vibration analysis of mdf systems. Earthq. Eng. Struct. Dyn. 1981, 9, 419–435. [Google Scholar] [CrossRef]


Publisher’s Note: MDPI stays neutral with regard to jurisdictional claims in published maps and institutional affiliations. |
© 2022 by the authors. Licensee MDPI, Basel, Switzerland. This article is an open access article distributed under the terms and conditions of the Creative Commons Attribution (CC BY) license (https://creativecommons.org/licenses/by/4.0/).