Article

Performance Comparison and Analysis of the Curtain-Wall-Type Liquid-Type Photovoltaic Thermal Unit According to the Pipe Connection Method

1
School of Architectural, Civil, Environmental and Energy Engineering, Kyungpook National University, 80 Daehakro, Buk-gu, Daegu 41566, Korea
2
Department of Architectural Engineering, Pusan National University, 2 Busandaehak-ro 63, Geomjeong-gu, Busan 46241, Korea
*
Author to whom correspondence should be addressed.
Energies 2022, 15(7), 2317; https://doi.org/10.3390/en15072317
Submission received: 17 February 2022 / Revised: 17 March 2022 / Accepted: 21 March 2022 / Published: 22 March 2022
(This article belongs to the Special Issue Renewable Energy Systems for Buildings)

Abstract

:
Recently, there has been increasing attention on the use of renewable energy in buildings, particularly, the photovoltaic thermal (PVT) system that uses both solar power and thermal energy. However, there is a limit to adopting the PVT system in real buildings because many architects value the aesthetics of buildings or spaces. This study developed a curtain-wall-type liquid-type PVT (CW-PVT) that can be installed on a wall as it integrates with the building. To analyze the system performance, a real-scale experimental plant was established in an outdoor environment. The performance of the CW-PVT unit was verified for two different module pipe connection types: parallel and serial. Meteorological variable data, the inlet and outlet fluid temperatures, surface temperature, and electrical energy generation of the modules were measured and collected using the measurement equipment according to the module pipe connection type. Consequently, the parallel-type method was approximately 10% more efficient than the serial type in energy production, whereas the serial-type method produced water with a temperature approximately 47% higher than that of the parallel type. Notably, it was advantageous to apply the parallel-type connection to maximize the energy generation efficiency in buildings where the system efficiency is vital and the serial-type connection in buildings where the high temperature of hot water is required.

1. Introduction

Extreme climate events have recently been occurring worldwide owing to the effect of global warming. This has led nations to form treaties such as the Kyoto Protocol and the Paris Agreement to suppress the generation of greenhouse gases, the main cause of global warming. South Korea also established the Carbon Neutrality Committee under the direct control of the government and president. Its original goal was to reduce the country’s nationally determined contributions (NDCs) by 26.3%, compared to 2018. However, in October 2021, the government raised the reduction target to 40%, compared to 2018, and the carbon reduction target in the building sector was also substantially raised from 19.5% to 32.8% [1]. The South Korean government also announced a policy to obligate zero-energy buildings (ZEBs) by 2030, which mandates ZEBs for public buildings over 1000 m2 from 2020; public buildings over 500 m2, private buildings over 1000 m2, and multifamily residential buildings with over 30 households from 2025; all buildings over 500 m2 from 2030 [2,3].
Thus, more attention is being devoted to passive buildings that minimize energy consumption with improved insulation and airtightness as well as to active buildings that generate renewable energy such as solar and geothermal heat pump systems [4]. Renewable energy systems using solar power in particular are regarded as the most promising alternative energy source to fossil fuels.
However, solar power is limited to electricity production and suffers from reduced efficiency when the panels overheat; hence, an alternative is needed. One alternative is the photovoltaic thermal (PVT) system, in which a solar collector that absorbs thermal energy is attached to the back of a PV panel for simultaneous electricity and heat generation. Compared with existing individual systems, PVT systems produce more energy in proportion to the installation area and can simultaneously produce electricity and heat, making them efficient for buildings with a limited installation area and various energy uses [5].
The PVT system was first developed by Kern and Russell in 1978 to remove heat generated from building-integrated photovoltaics (BIPVs), and since then, it has been researched for about 40 years to develop an efficient system. Over the past decade, China and Europe have achieved significant progress in the development of PVTs, with commercial products now being distributed in the market [6].
Moradi et al. investigated the structural characteristics, advantages, and disadvantages of liquid- and air-type PVTs and analyzed their economic feasibility. They examined the properties of various materials forming a PVT and compared their energy efficiency [7]. Abdul-Ganiyu et al. installed a commercial PVT and conducted a field study according to insolation and flow rate variables. According to the results, the best efficiency was demonstrated at a flow rate of 0.033 kg/s regardless of changes in insolation. Furthermore, through experimental data analysis, the researchers derived an equation of the relationship between the PVT module temperature and the flow rate [8]. Arora et al. applied a nanofluid for the refrigerant of a conventional liquid-type PVT and measured the fluid temperature of the PVT according to the mixing ratio with water as a variable. In this way, they compared and analyzed the thermal energy production, heat transfer coefficient, etc. Their results demonstrated an average improvement in the performance of approximately 46.4%, compared with conventional water, and they determined the applicability of nanofluids through an economic feasibility analysis [9].
Meanwhile, in recent studies on PVTs, systems suited for the weather conditions or residential environment of the installation area have been developed, and their performance has been analyzed according to the building use or place of use. As air-type PVTs transfer heat through the air as a medium, they eliminate the risk of leakage or freezing and are convenient to use. In contrast, liquid-type PVTs produce more energy than air-type PVTs and can be directly used for heating water, making them effective in buildings, although it is difficult to maintain their equipment. Lee et al. derived, compared, and analyzed the performances of existing PV, air-type PVT, and liquid-type PVT through a field study. The existing PV yielded a power generation efficiency of 12.22%, liquid-type 13.68%, and air-type 13.06%, and the researchers analyzed the increase in the PV efficiency according to the cooling effect. In addition [10], Kim et al. created prototypes of glazed and unglazed PVTs and conducted a field study. The two modules yielded nearly identical thermal efficiency coefficients of 0.51 and 0.5, respectively; however, the thermal efficiency of the collectors was about 39% and 24%, respectively, indicating that the glazed PVT outperformed the unglazed PVT in the overall efficiency by approximately 27%. Meanwhile, in PVTs, the use of a glass cover is important depending on the module configuration, although the efficiency of energy generation changes with the internal configuration and materials such as absorbers [11]. Cheon et al. created prototype rectangular tube absorbers and fully wetted absorbers and experimentally analyzed the performance according to the absorber configuration. The thermal efficiency coefficients of the rectangular tube and fully wetted types were 0.69 and 0.75, and the heat loss coefficients were −14.43 and −14.27, respectively. Hence, the fully wetted type yielded a higher average thermal efficiency by approximately 4% (51% vs. 55%) and higher electrical efficiency by approximately 1% (14% vs. 15%) [12].
However, an efficient PVT installation in a building requires the development of a building-integrated PVT module and empirical research concerning practical use. Jeong et al. created a prototype building-integrated photovoltaic thermal system (BIPVT), installed it on the roof of an experimental house at an inclination angle of 30°, and assessed its heating and electrical performance. The BIPVT yielded a thermal efficiency of 52.5% and an electrical efficiency of 16.9%, and daily heating was shown to conserve approximately 47% of energy, compared with the existing heating system [13].
Meanwhile, in a previous study, the authors proposed a liquid-type PVT module that could be installed on a wall via the curtain wall method in order to install many PVTs in a building. The module was manufactured with an inclination angle of approximately 15° and designed to be advantageous for solar gain. Its performance was assessed through an energy analysis. The proposed curtain-wall-type liquid-type photovoltaic thermal system (CW-PVT) demonstrated about 26% higher annual electrical energy generation and 18% higher annual thermal energy generation than the vertically installed existing liquid-type PVT [14].
In a previous study, a CW-PVT suitable for installation on the building’s outer wall using the curtain wall method was developed. Therein, the performance of a single module was verified through energy analysis and an outdoor field study [15]. Thus far, previous domestic and foreign studies have focused on improving the performance of the PVT module itself, and it was concluded that it would be necessary to develop an installation method and operation manual for the dissemination and use of PVT for further research [16].
Therefore, in this study, an attempt was made to derive the electrical and thermal efficiencies corresponding to the connection of multiple CW-PVT units, analyze the factors that degrade efficiency, and use the results as basic data for CW-PVT installation guidelines and research on the development of operation and control systems.
To analyze the efficiency according to the connection of the CW-PVT unit, the CW-PVT unit was used in this study to analyze the performance of the unit depending on the connection method of the coolant pipe. The coolant pipe connection was designed and installed by dividing it into series and parallel types, and an experiment was conducted using an outdoor monitoring device prepared in accordance with the international standard for solar thermal collector test methods. The electrical and thermal performances, module surface temperature, and inlet and outlet temperatures, according to the connection type of the coolant pipes, were measured, and at the same time, the meteorological environment parameters such as insolation and outdoor temperature were measured to compare and analyze the electrical and thermal powers according to the connection method of the coolant pipes.

2. Materials and Methods
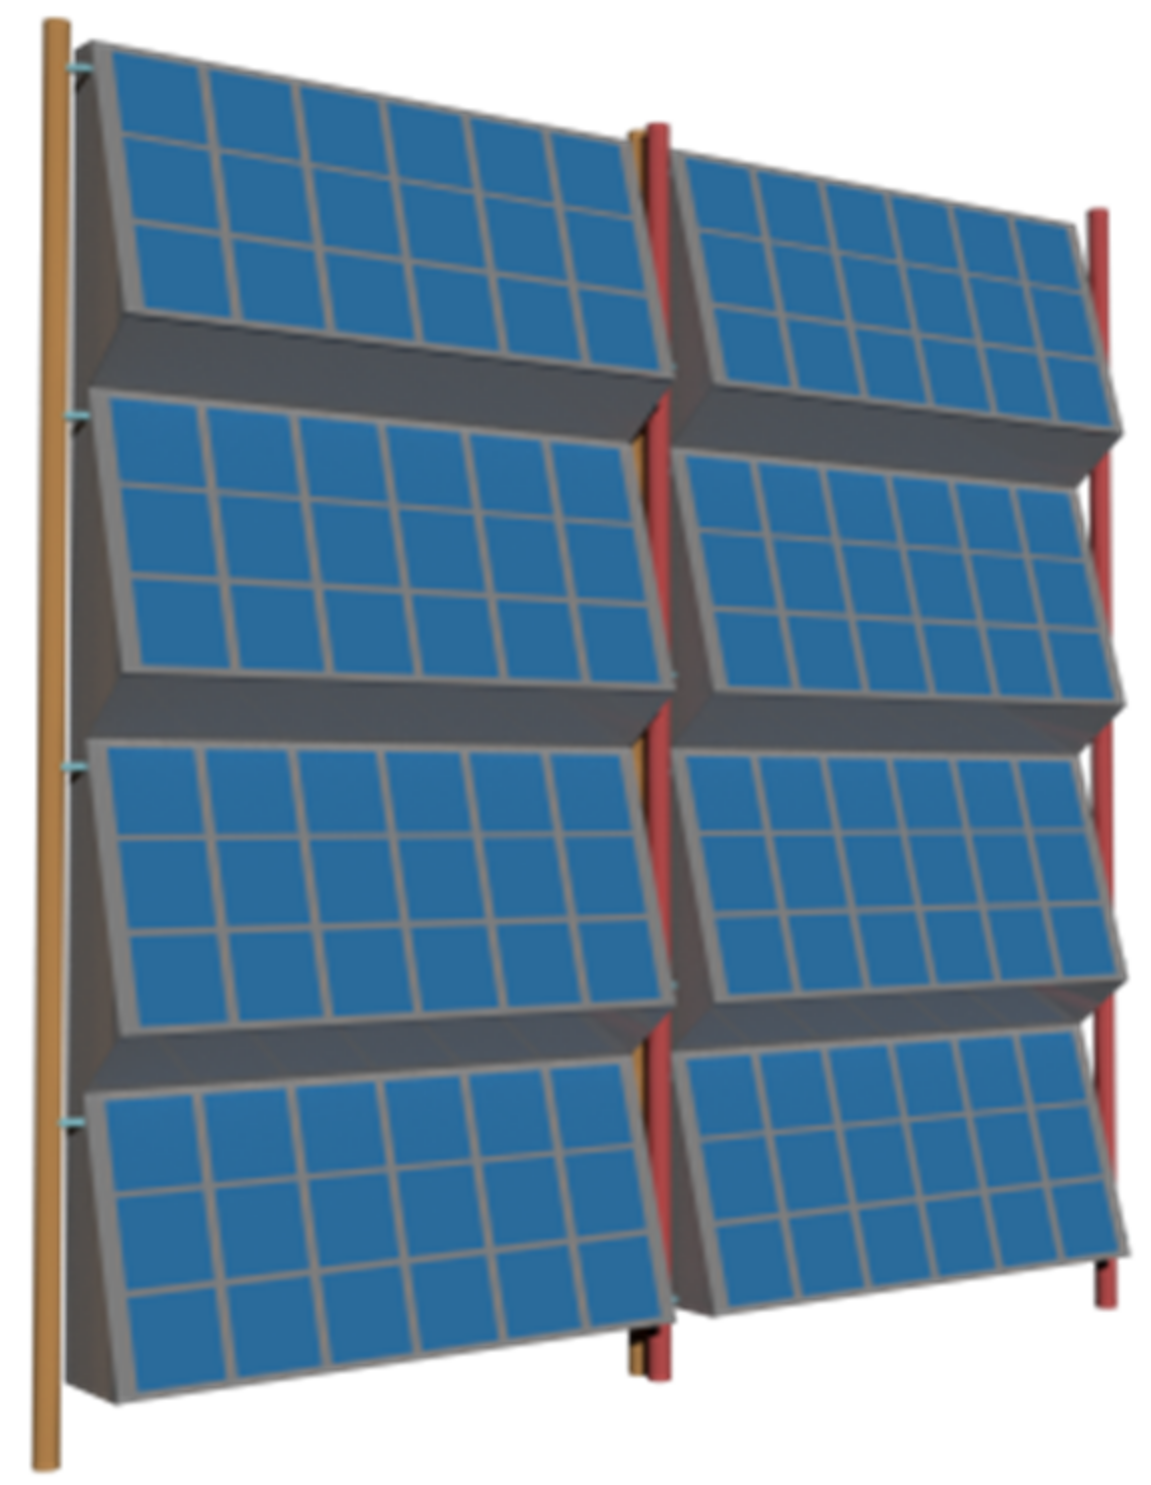
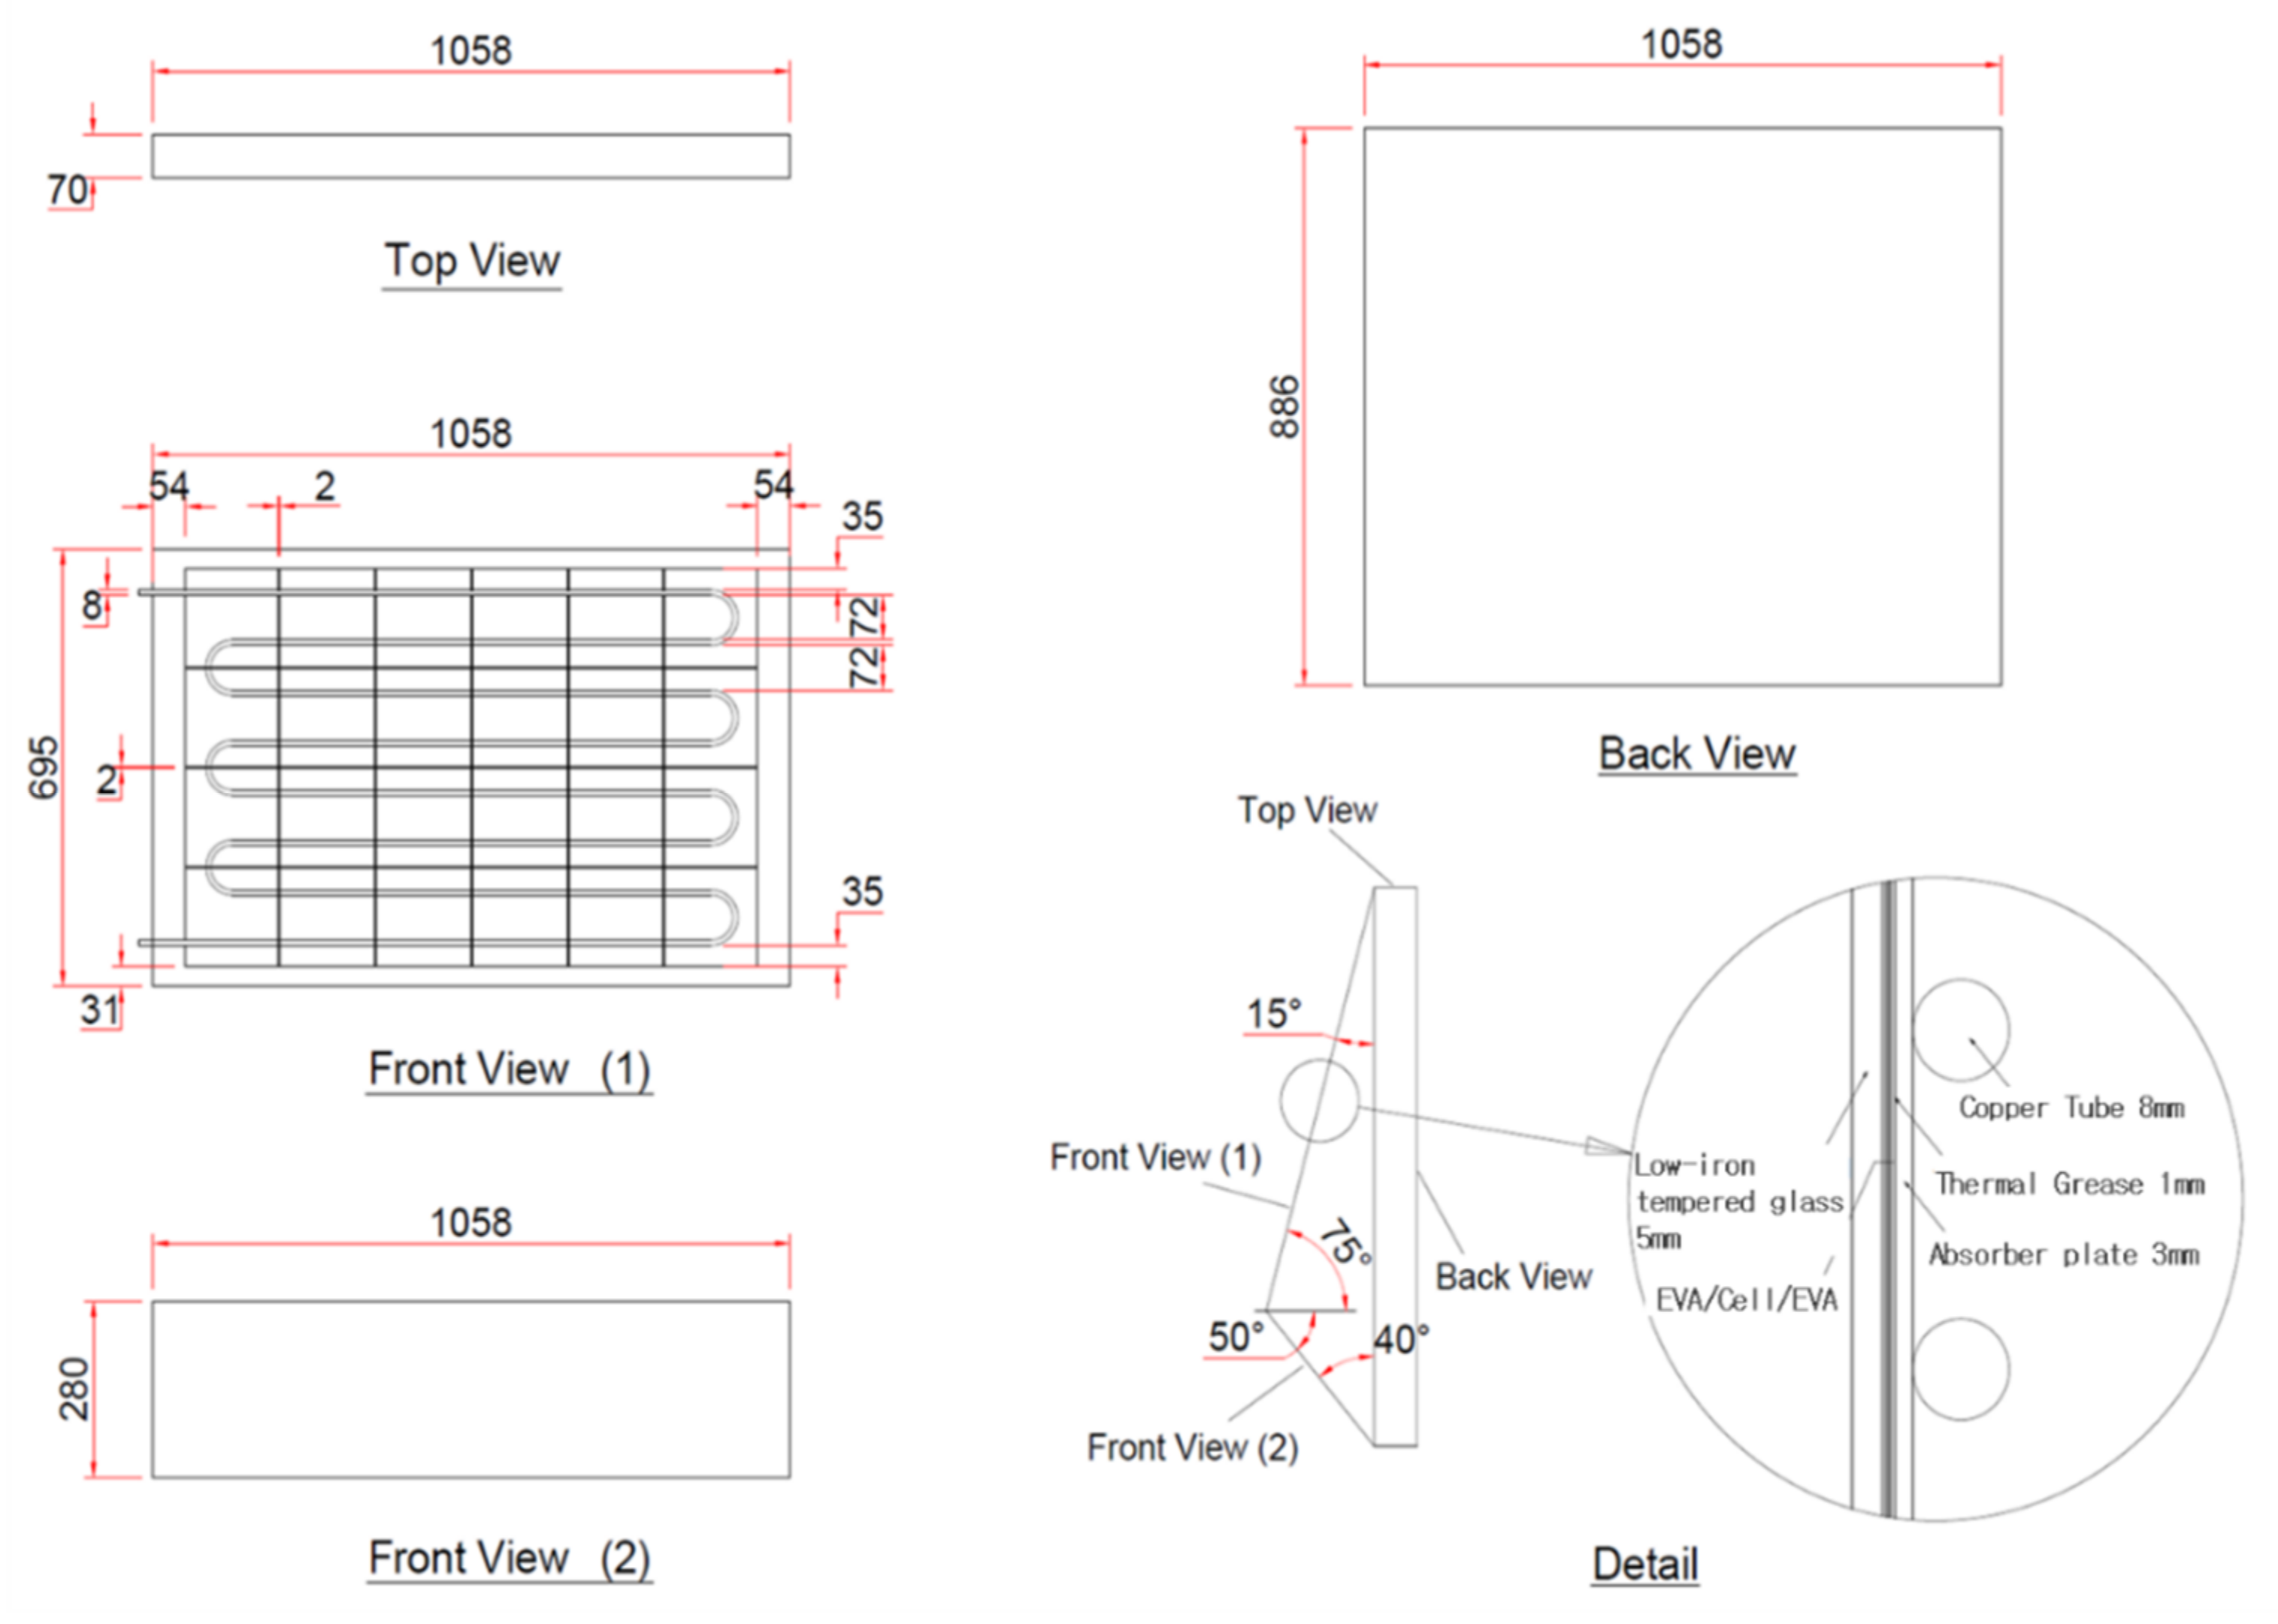
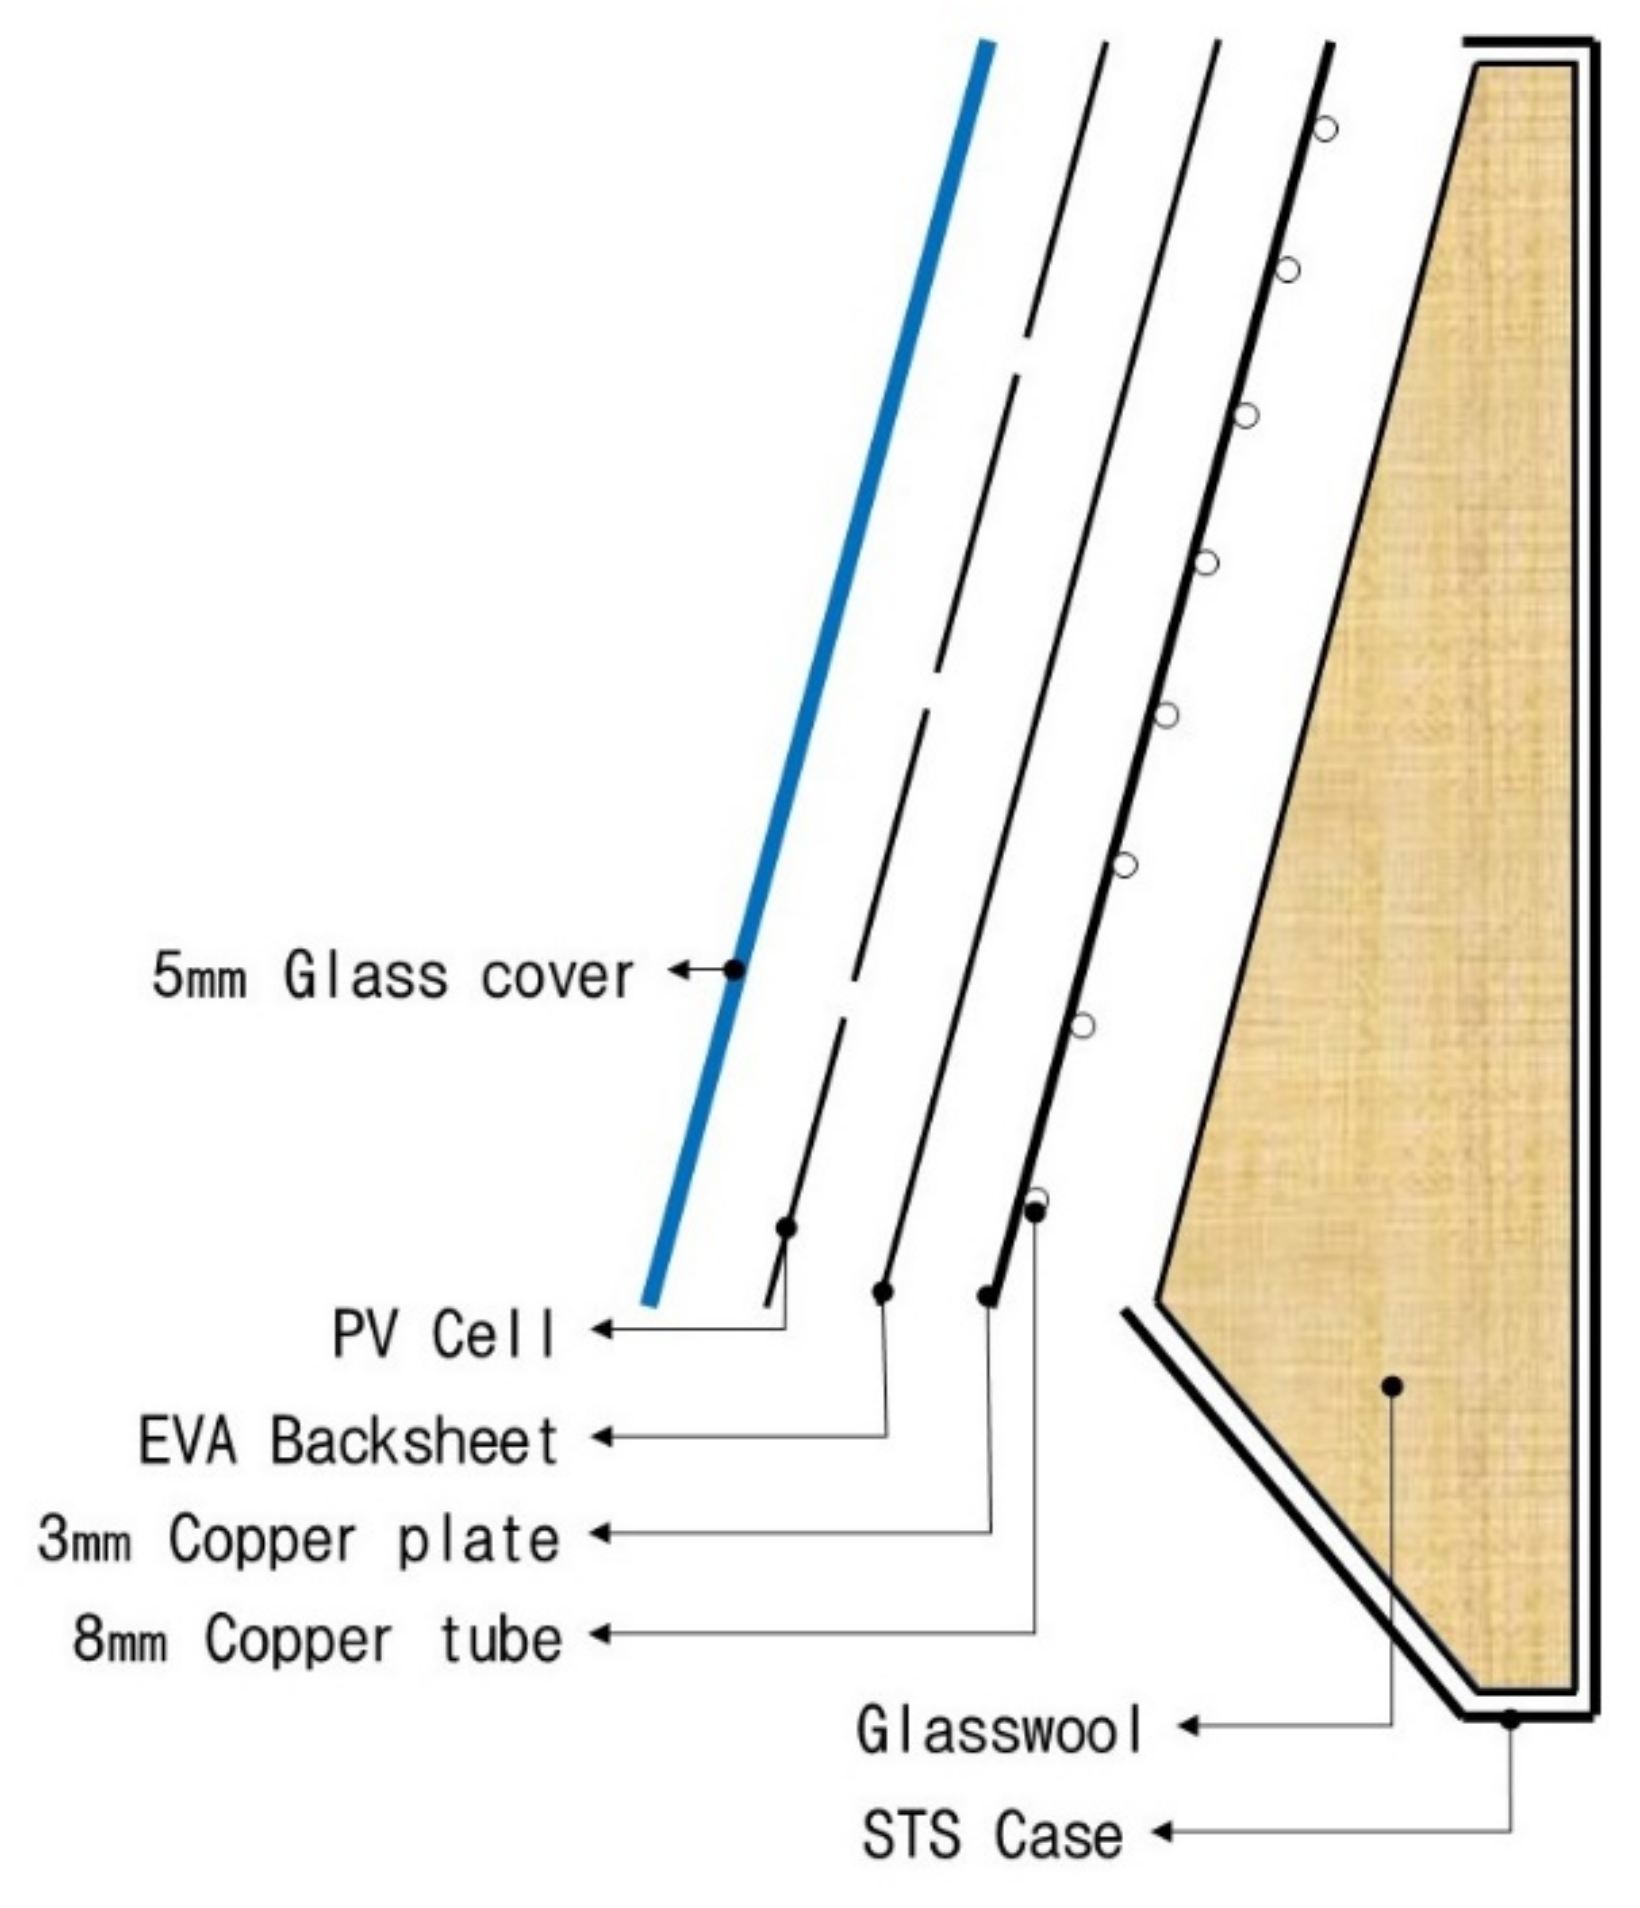
2.1. CW-PVT Unit

Currently, commercialized or under-development PVT modules are being installed on the roof or on top of buildings and structures, typically at an angle of 30–35°. When installed on a wall, a building-integrated module is installed vertically from the horizontal plane. As a result, modules installed on a wall receive less direct insolation and generate less energy than those installed on the roof.
Accordingly, as shown in Figure 1, the angles for some modules to which PV cells were attached were designed to receive direct insolation, and to prevent the PVT modules from protruding and degrading the building’s external appearance and stability, one module was divided into multiple sets.
In CW-PVT, the number of copper tubes attached to the back varies with the panel height according to the number of PV cells installed on the panel. Thus, the amount of electricity and thermal energy generated according to the module’s cooling efficiency changes. Additionally, the length of the protrusion differs with the angle and set length of the part to which the PV cells are attached, so modules protruding from the wall may degrade the building’s external appearance and stability. Authors proposed the optimal CW-PVT by using domestic and foreign PVT product research data and TRNSYS18, an energy simulation software, to determine the module size that is advantageous for power generation, material, and thickness of each part, and diameter and spacing of copper tubes [17,18,19]. Figure 2 shows a schematic diagram of CW-PVT, and Figure 3 shows the Cross-sectional diagram. The CW-PVT was designed with 24 PV cells installed per set at an angle of 15° from the vertical plane, and a serpentine-type pipe capable of exchanging heat was attached to the back of the PV cells.

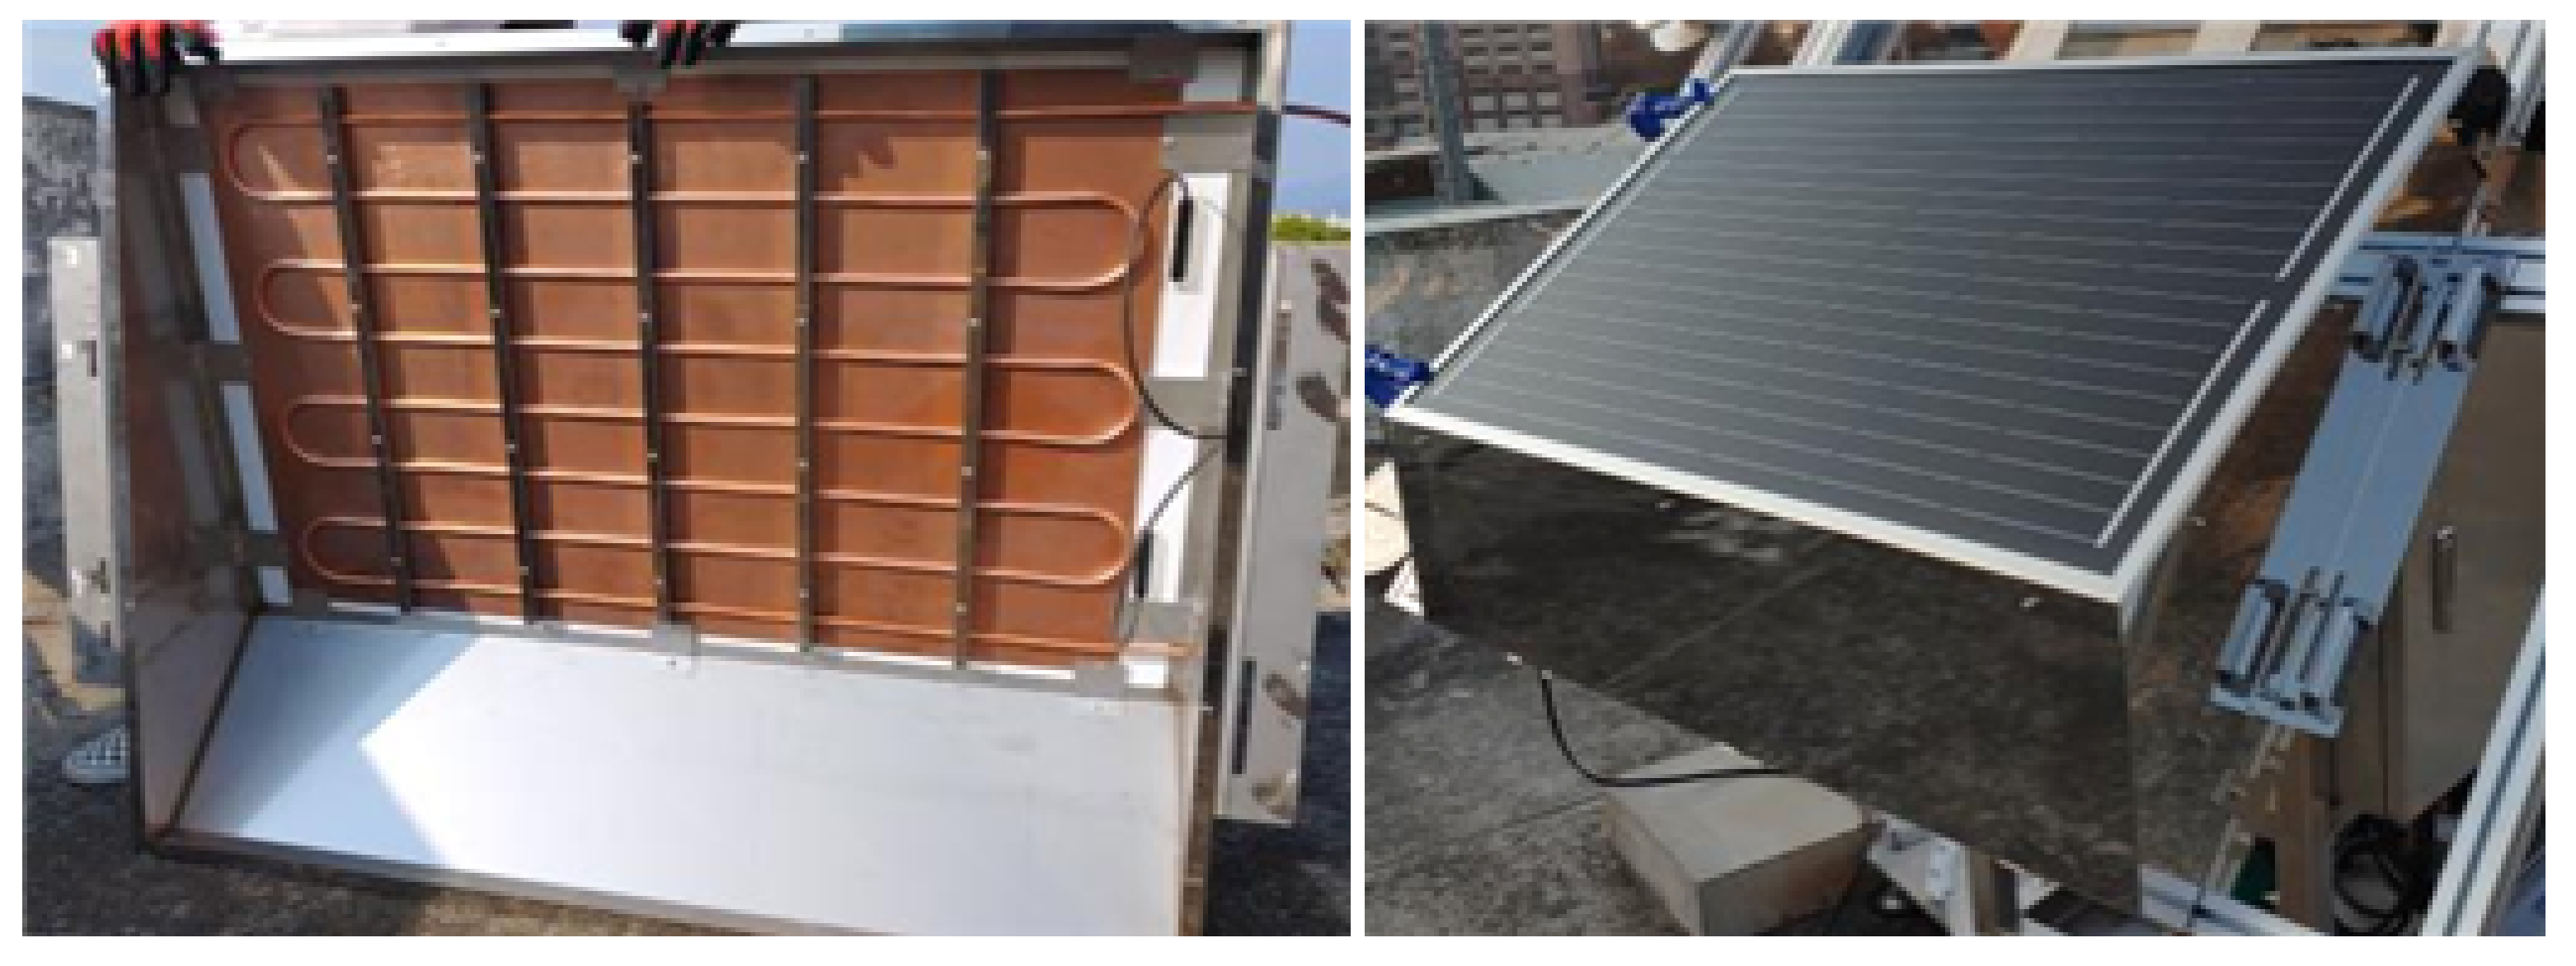
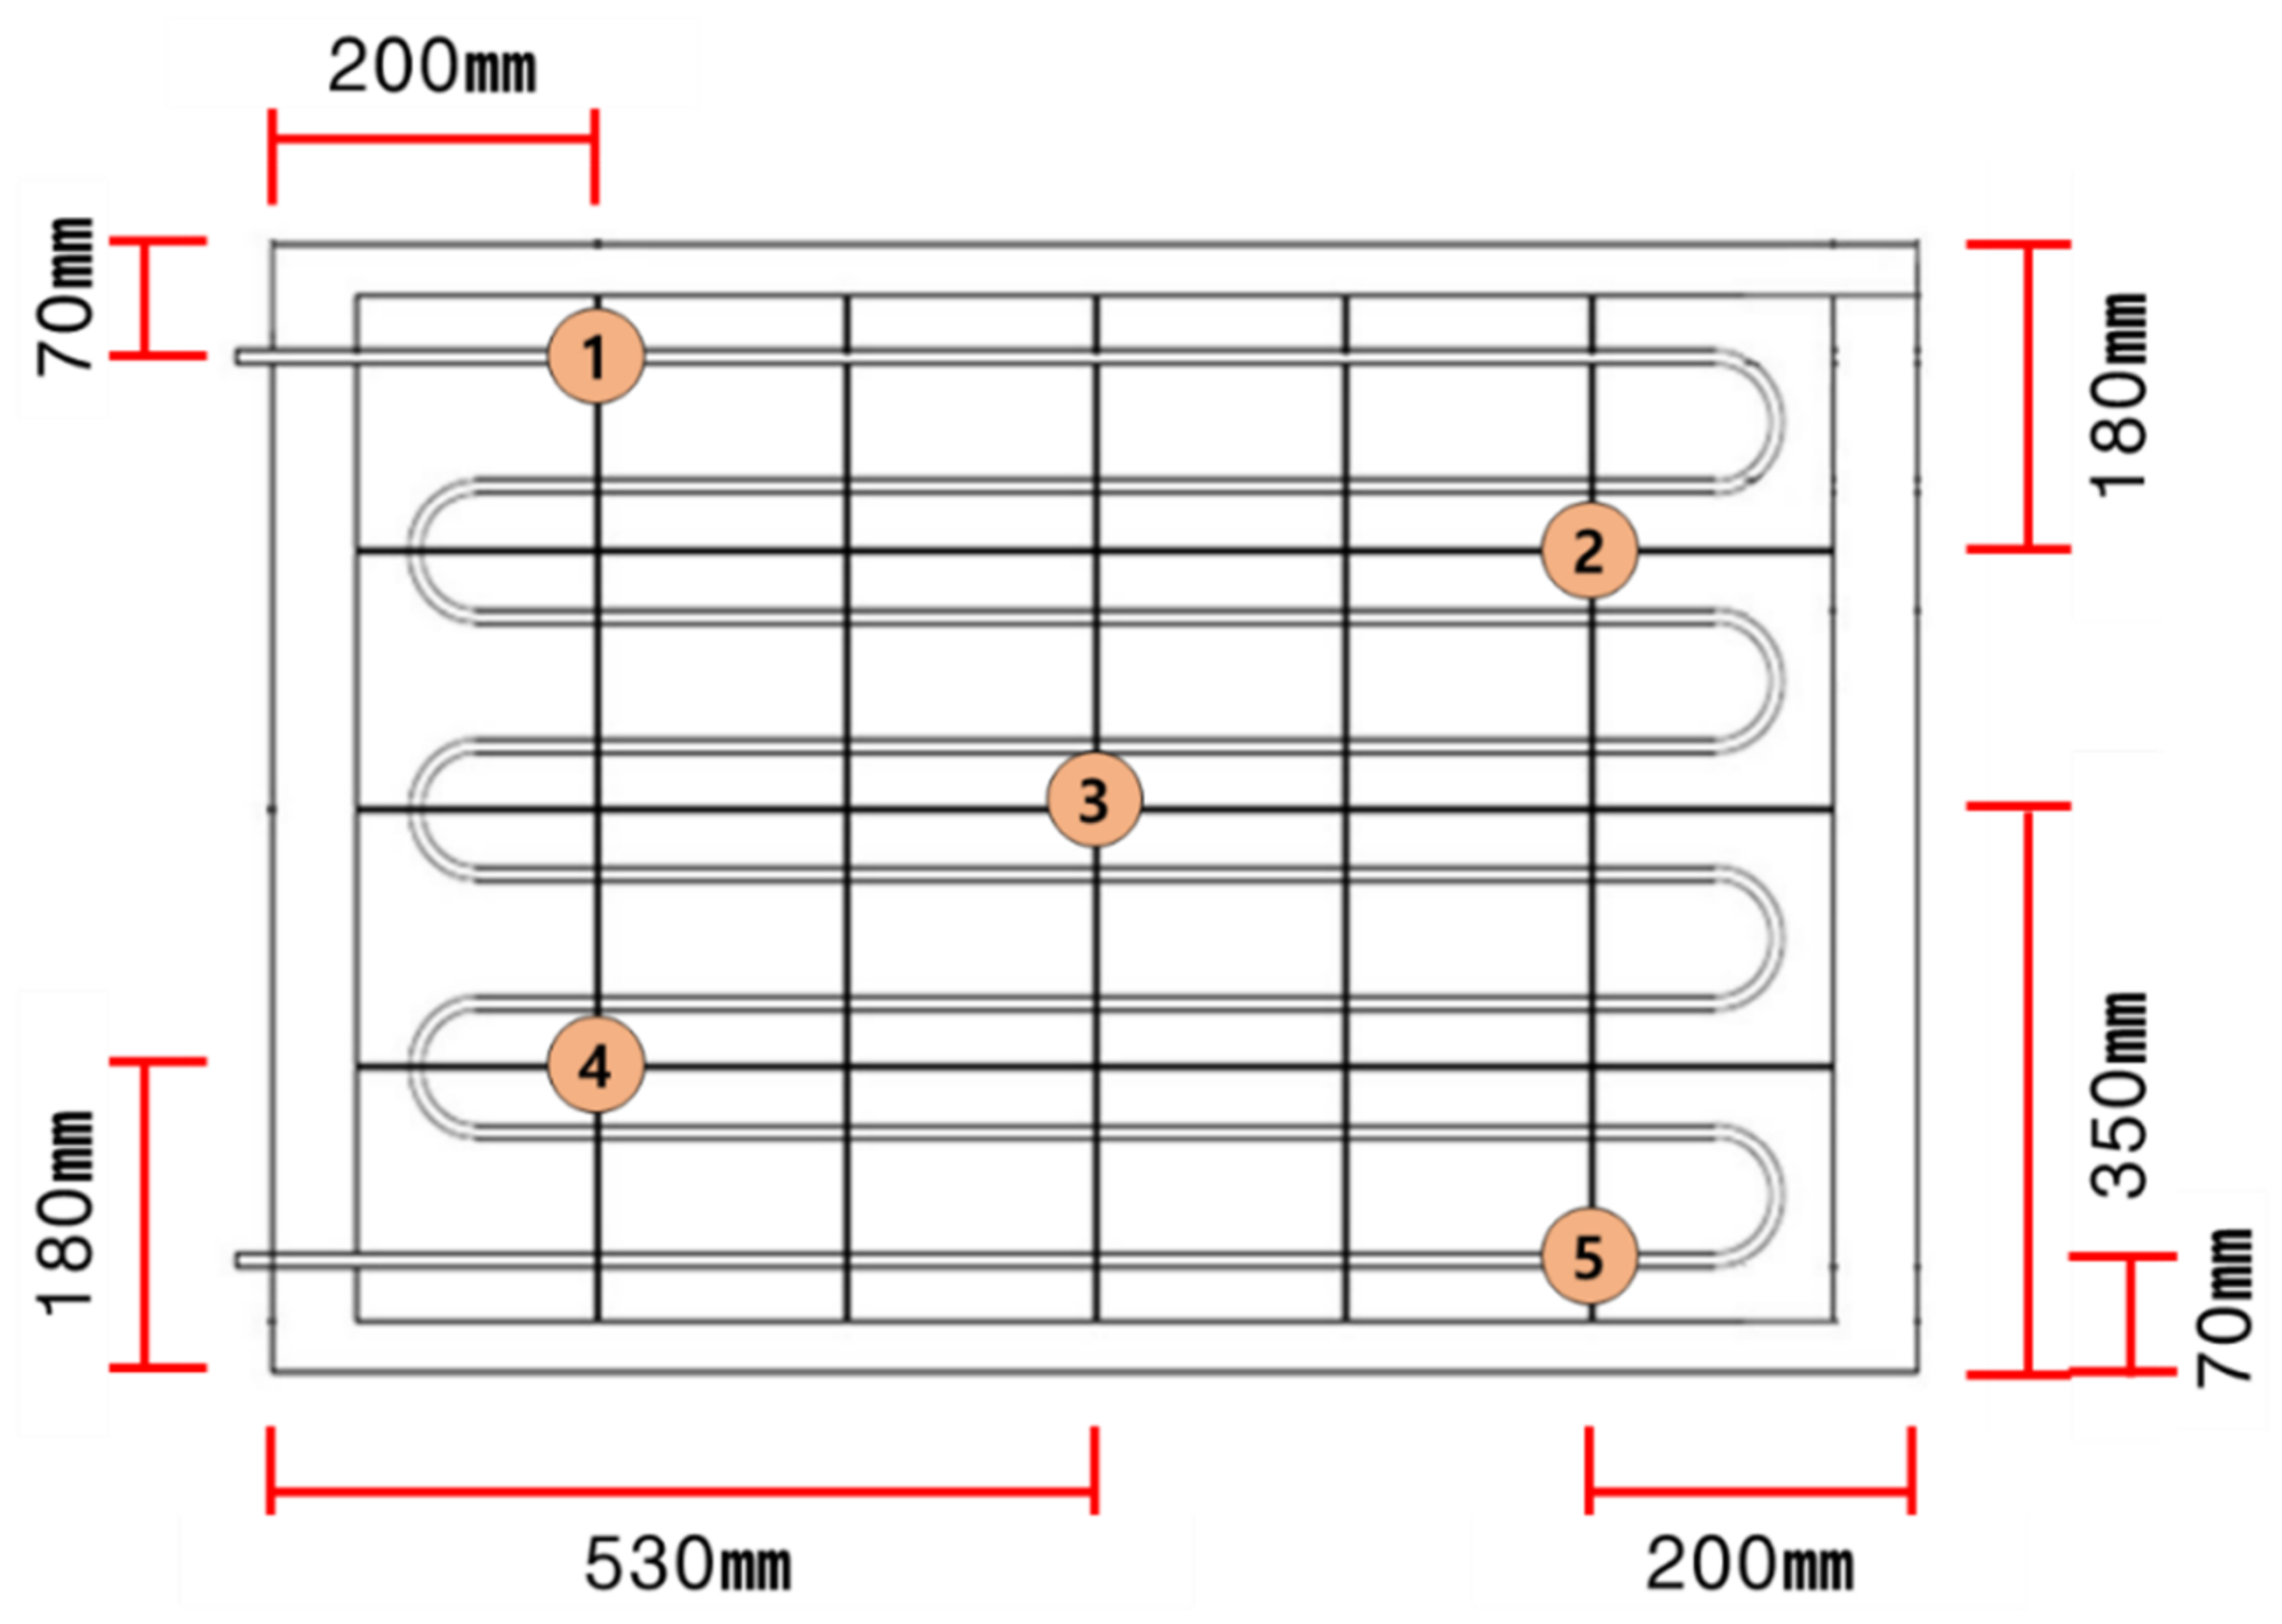
2.2. Fabrication of the CW-PVT and Performance Evaluation of a Single Unit

To analyze the electrical and thermal performance of the CW-PVT, in this study, an experiment using a real-scale experimental device was performed. Figure 4 shows the actual fabricated system. To fabricate the CW-PVT, 24 PV cells were installed per set at an angle of 15° from the vertical plane, and eight lines of 8 mm diameter copper tubes containing a flowing heating medium were installed on the back at uniform intervals. Table 1 shows each component and specification details of the developed CW-PVT.
Table 2 lists the experimental conditions and criteria for assessing the performance of the developed CW-PVT. The experiment was conducted with an outdoor field study device at an experimental building located at a latitude of 35.88 and a longitude of 128.61 in accordance with ISO 9806 (test methods for assessing solar thermal collectors) [20,21]. In addition to meteorological variables such as insolation and outdoor temperature, the inlet fluid temperature was fixed at 20 °C and the inlet flow rate at 0.02 kg/sm2. The actual measurement was performed for 21 days from 5 to 26 October. During the measurement period, the outside temperature was observed to be 10 to 19 °C, and there was no single rainy day.
Data collected during the actual measurement period were used for efficiency analysis by extracting only the data that met the wind speed and insolation standards of ISO 9806 regardless of cloud cover and outdoor temperature, and data from rainy days were excluded.
PVT performance is generally calculated using formulas for thermal and electrical efficiency, as shown in Equations (1)–(4), and is evaluated by ( T m T a ) / G , the insolation correlation coefficient. As shown in Equation (3), the PVT thermal efficiency is calculated as the ratio of the energy obtained by the collector itself ( Q 2 ) to the total energy obtained by the absorbers ( Q 1 ). The electrical efficiency is calculated as the ratio of the amount of electricity generated to the amount of insolation on the heat absorption area. As shown in Equation (4), the amount of electricity generated is calculated as the product of the maximum output voltage ( V ) and the maximum output current ( A ) [22].
Q 1 = A p v t × G
Q 2 = m ˙ C p T i T a
η t h = Q 2 Q 1 = m ˙ C p T i T a A p v t × G
η e l = I m V m A p v t × G
  • A p v t : Area of the module;
  • C p : Fluid specific heat (J/kg°C);
  • G : Solar radiation of slope (W/m2);
  • T i : Inlet fluid temperature (°C);
  • T a : Outlet fluid temperature (°C);
  • m ˙ : Inlet flowrate (kg/h);
  • I m : Maximum current (A);
  • V m : Maximum voltage (V);
  • η t h : Thermal efficiency;
  • η e l : Electrical efficiency.
Figure 5 shows the actual experimental data derived to evaluate the CW-PVT performance. The electrical efficiency according to the insolation correlation coefficient is expressed as y E 1 = 0.1 + 2.56 (( T m T a ) / G ); thus, the electrical efficiency coefficient ( η e l ) is 0.1, and the electric loss coefficient ( ζ e l ) is +2.56. Additionally, as the thermal efficiency is expressed as y T 1 = 0.43 + 2.71 (( T m T a ) / G ), the thermal efficiency coefficient ( η t h ) is 0.43, and the thermal loss coefficient ( ζ t h ) is +2.71 [14].
As shown in Figure 5, the average electrical efficiency of CW-PVT installed in a vertical plane was calculated to be approximately 12%, and the thermal efficiency was calculated to be approximately 43%. The efficiency of the PV module used in the production of CW-PVT decreased by approximately 27%, compared with the efficiency of 16.4% when it was installed at an angle of 30° to the south.

2.3. Experimental Conditions and Measurement Equipment

The environment for the field study was constructed on the roof of a building in the K University in Daegu Metropolitan City. As shown in Figure 6, the experimental equipment built to operate the CW-PVT consists of a chiller heat exchanger that controls the temperature of the heating medium and a circulating pump that controls the flow rate. Table 3 shows the capacity of each device.
As measurement devices, a pyranometer and a thermometer were installed to measure the meteorological variables, a flow meter to measure the flow entering the module, a resistance temperature detector (RTD) sensor to measure the temperature of the inlet fluid and outlet fluid, and a thermocouple to measure the temperature of the module surface. In addition, a power meter and a data logger were used to collect the data obtained by the aforementioned measurement equipment. Table 4 shows the Specifications of the measurement equipment. At this point, the pyranometer was installed parallel to the angle (15°) of the PV module of the CW-PVT to measure the insolation that directly hits the CW-PVT.
The bracket for the installation of CW-PVT had a total of three modules and could be adjusted from a vertical (90°) to a horizontal (180°) angle, with a 45° adjustment to the left and right. Three CW-PVT units for the actual measurement were installed at a vertical angle to the bracket, and the bearing was oriented to the south.
The actual measurement period was a total of 35 days during summer from 14 July to 20 August. Excluding the period for coolant pipe installation and trial run, measurements for serial and parallel types were carried out for 14 days each. In addition, data suitable for the ISO 9806 test standard were extracted from the actually measured data and used as data for performance analysis.
In a previous study, CW-PVT arrangement methods were divided into horizontal serial-type, vertical serial-type, and parallel-type, for which variables were set, and the performance was examined through energy analysis. According to the results, the horizontal series and vertical series methods yielded identical thermal and electrical energy generation, even though the module arrangements were different. For the parallel type, the amount of energy generated by each module and the module surface temperatures were the same [15].
Accordingly, in this study, the categorized serial and parallel types were the experimental variables. The serial-type modules were denoted as M 1 , M 2 , and M 3 . Furthermore, as the parallel-type modules showed the same generated energy and module surface temperature in a previous study, each module was denoted as M 1 , M 1 -1, and M 1 -2. The coolant pipes were configured according to the unit connection method shown in Figure 7 and Figure 8. At this point, the coolant pipe connected to each module was insulated with 25 mm thick glass wool with thermal conductivity of 0.05 W/mK, the same material as the thermal insulation material inside the module.
The measuring points for the inlet and outlet fluid temperatures, amount of electricity generated, and surface temperature of each module were set as shown in Figure 7 and Figure 8. As shown in Figure 9, five measuring points were set for the module surface temperature on the back of the CW-PVT considering the path of the copper tubes: two points directly affected by the copper tubes, two points indirectly affected between the copper tubes, and one central point showing the average temperature of the module.

3. Results and Discussion

3.1. Analysis of Experimental Data

Considering the meteorological data collected during the field study period, a day with relatively uniform outdoor temperature and insolation was selected. The coolant temperature, module surface temperature, and electricity generation according to the insolation and the outside temperature were compared to analyze the difference in the performance of each arrangement method.
As shown in Figure 10, the maximum outdoor temperature was 31 °C, and the maximum insolation was 1146 W/m2. A suitable time for generating electricity during the test period was from 11:00 to around 15:00, when the insolation exceeded 700 W/m2. In Sections B and D, which contained the top 10% of daily insolation, the average insolation was approximately 855 W/m2, and the outdoor temperature was 28.5 °C.
In Table 5, the module surface temperatures according to the unit connection method are compared with the data measured from the points shown in Figure 9. Measuring point No. 3 of each module is the center point, and its results are consistent with the average surface temperature of the modules. At Nos. 1, 2, 4, and 5, the surface temperature increases along the direction of the coolant flow.
The average module surface temperature of M 1 increased to a maximum of 18.7 °C at 14:00. With No. 3 as the baseline, the largest changes in temperature were −8.7% at No. 1, −6.9% at No. 2, +6% at No. 4, and +7% at No. 5; thus, at No. 5, which showed the highest surface temperature, it rose to a maximum of 20.1 °C.
Similar to the average module surface temperature of M 1 , that of M 2 increased to a maximum of 18.7 °C at 14:00, when the insolation was the greatest. With No. 3 as the baseline, the largest changes in temperature were −6.8% at No. 1, −4.8% at No. 2, +4.4% at No. 4, and +5.6% at No. 5; thus, at No. 5, which showed the highest surface temperature, it rose to a maximum of 23.2 °C.
Similar to the average module surface temperatures of M 1 and M 2 , that of M 3 , the third serial-type module, reached a maximum of 24.8 °C at 14:00, and the largest changes in temperature were −5.1% at No. 1, −3.8% at No. 2, +3.5% at No. 4, and +4.6% at No. 5; thus, at No. 5, which showed the highest surface temperature, it rose to a maximum of 26 °C.
Hence, for the parallel-type arrangement, consisting of only M 1 , the maximum daily average surface temperature of each module was 20.1 °C, and all modules were uniformly cooled by the coolant to 16.2 °C on average. For the serial-type arrangement, however, the maximum daily average surface temperature of M 2 was 15% higher than that of M 1 , whereas that of M 3 was 12% higher than that of M 2 . Thus, owing to the increased coolant temperature in M 1 and M 2 , the module surface cooling efficiency in M 2 and M 3 decreased.

3.2. Electrical and Thermal Performance Analysis

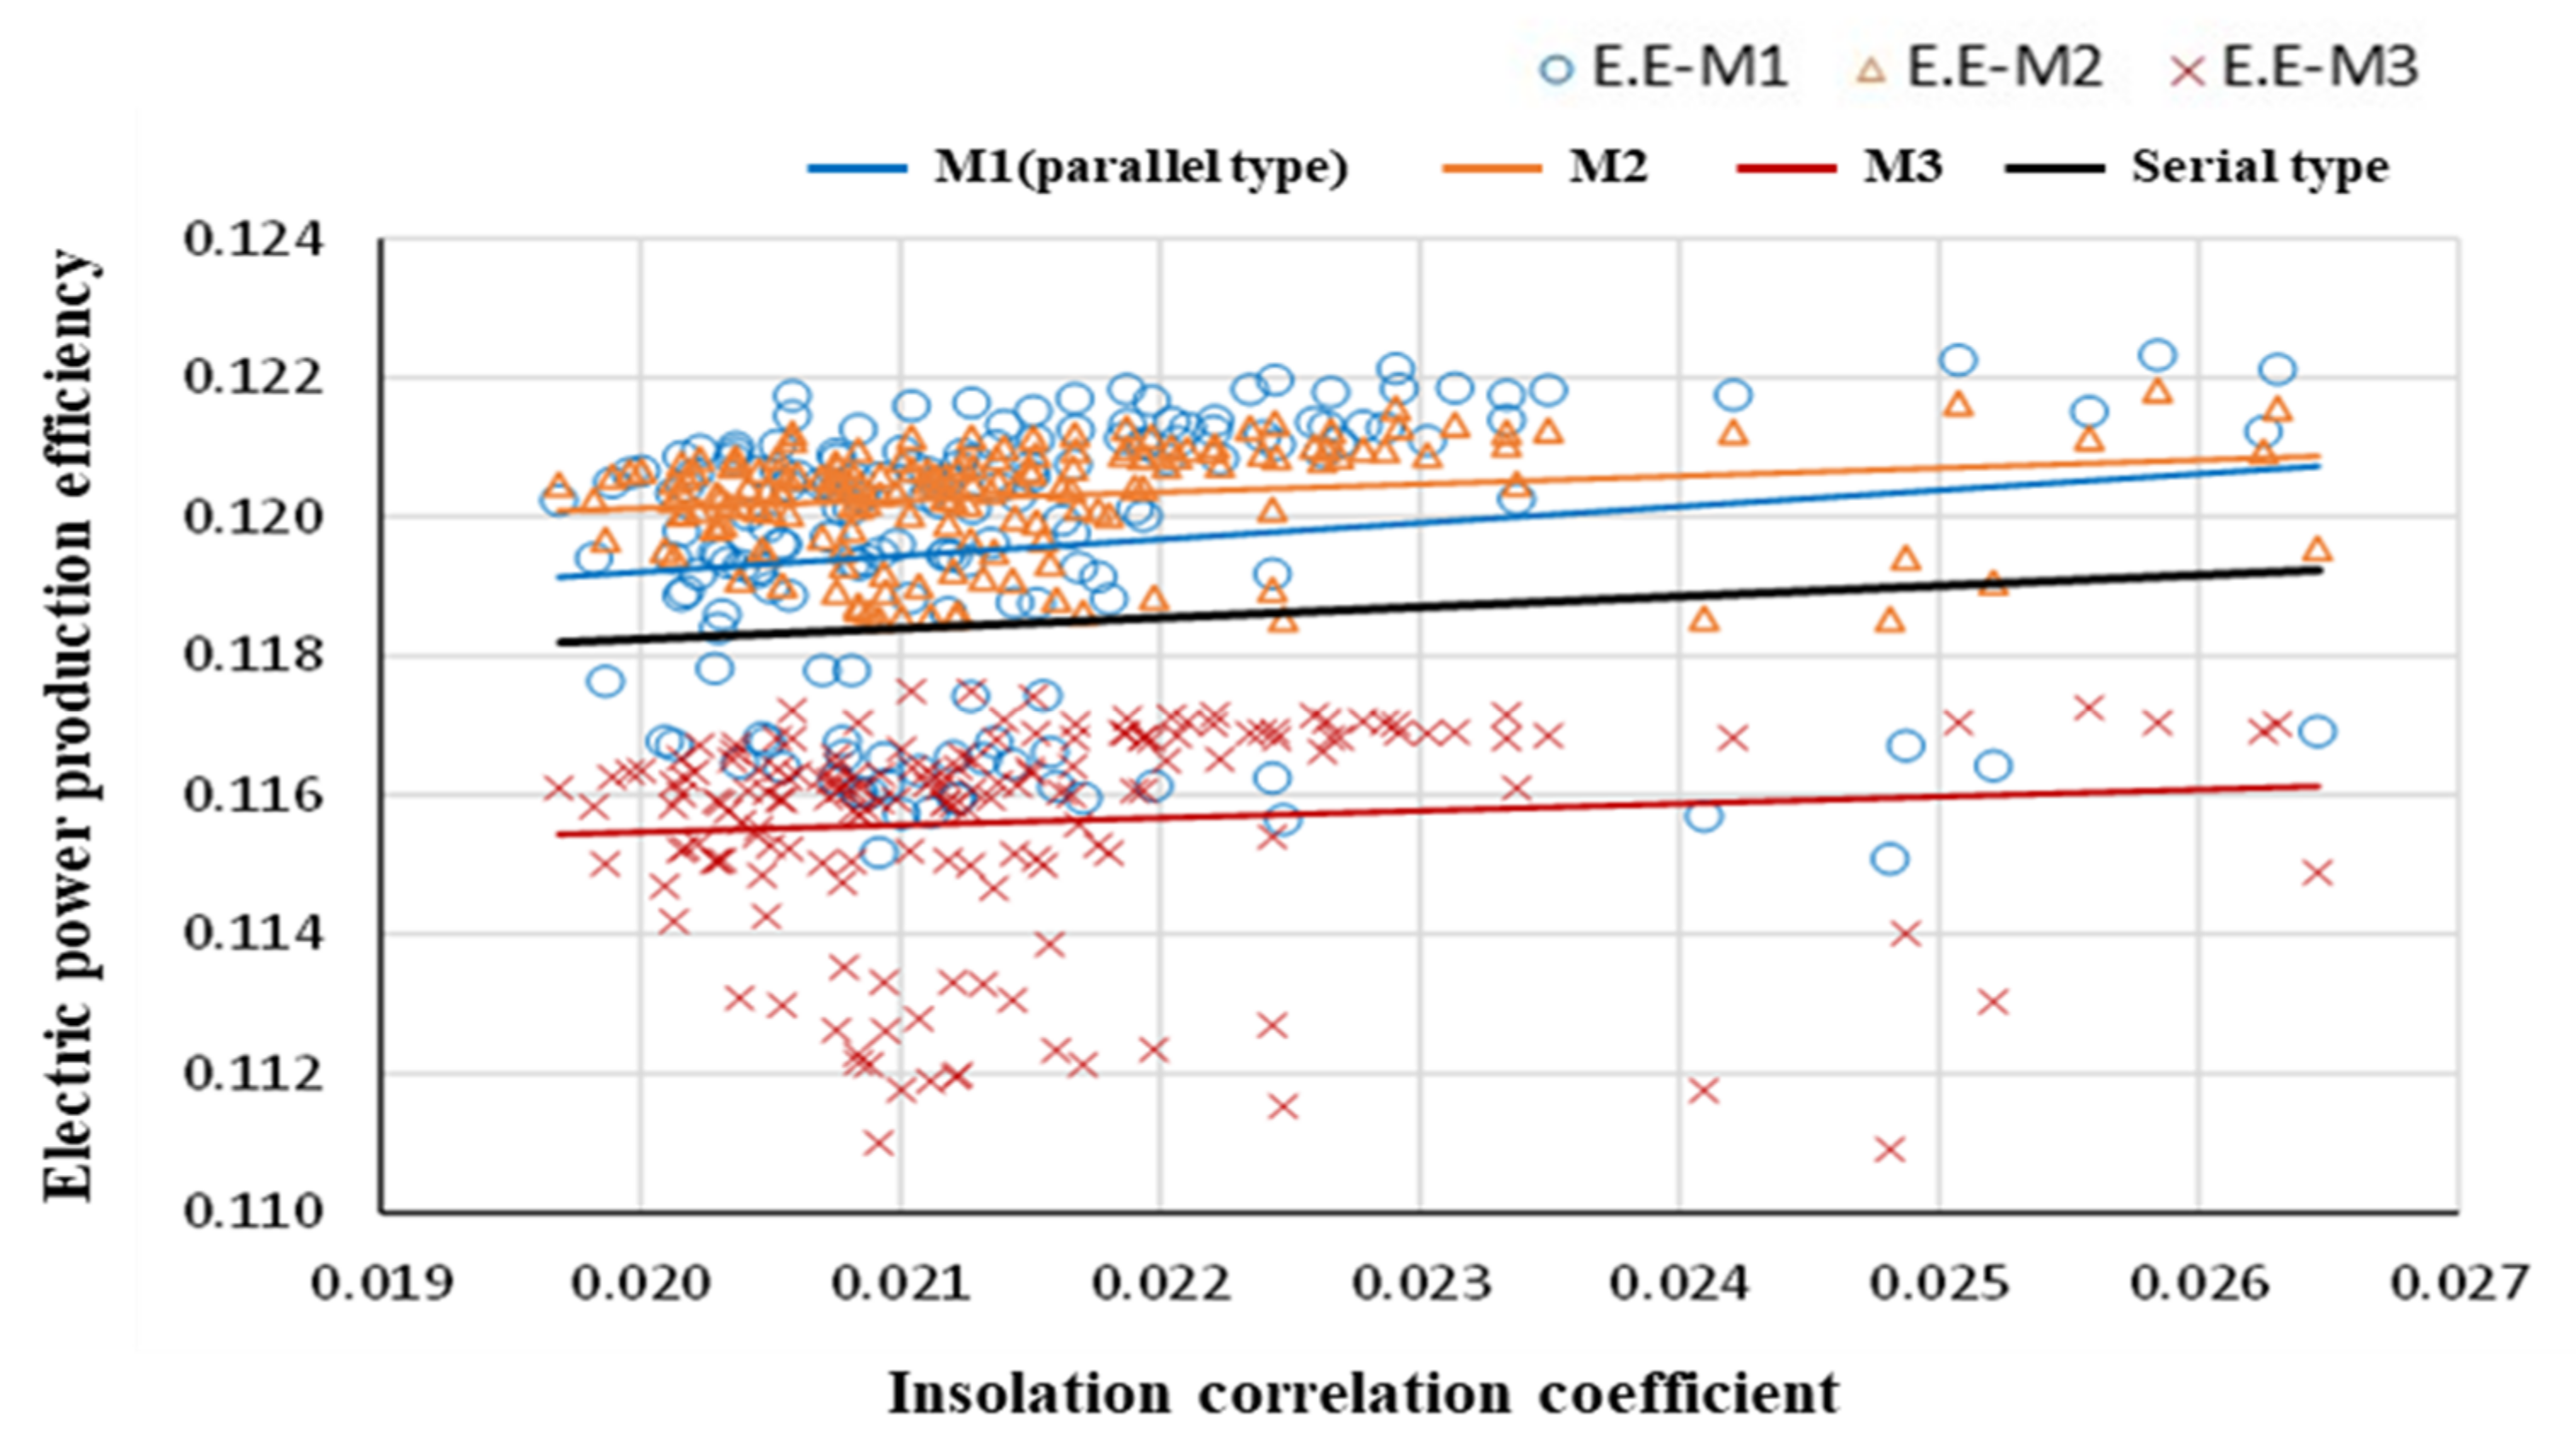
3.2.1. Electrical Efficiency

To analyze the efficiency of electrical energy generation using the unit connection method, the electrical energy generation efficiency of each module was calculated with respect to the insolation correlation coefficient. The results are presented in Figure 11. The line graph equations were derived through Equations (5)–(8), and the efficiency coefficient ( η ) and the gain coefficient ( ζ ) were compared using the parallel-type and serial-type unit connection methods.
For the parallel-type method, as all modules were the same as M 1 , the efficiency of M 1 was the same as that of the parallel-type modules. Hence, the parallel-type M 1 ’s electrical efficiency coefficient ( η e l ) was 0.11, and the electric loss coefficient ( ζ e l ) was +0.24.
In addition, η e l of M 2 was 0.12, and ζ e l was 0.12, whereas η e l of M 3 was 0.11, and ζ e l was 0.1. As the coolant temperature increased when the modules were connected in a series, ζ e l dropped, and the energy generation of M 2 and M 3 according to the insolation correlation coefficient decreased faster than that of M 1 .
The total η e l of M 1 , M 2 , and M 3 connected in a series was calculated to be 0.12, and ζ e l to be 0.15. The obtained η e l value was approximately 10% higher, and ζ e l was about 50% higher, compared with those of M 3 . These results indicate that connecting M 1 and M 2 as a unit in the serial-type unit connection method is advantageous for generating electrical energy. Moreover, η e l was about 10% higher than that in the parallel-type unit connection, but ζ e l was about 62% lower, indicating that the parallel-type connection is advantageous for generating electrical energy as the insolation correlation coefficient increases.
Under actual experimental conditions, an average electrical efficiency was calculated to be approximately 12% for M 1 ( I n d e p e n d e n t   t y p e ) and M 2 , 11.6% for M 3 , and 11.8% for the serial type. Compared with the electrical efficiency of a single CW-PVT calculated in Figure 5, M 1 and M 2 had the same efficiency, while M 3 and the serial type were approximately 4% and 2% lower, respectively.
M 1 I n d e p e n d e n t   t y p e = 0.11 + 0.24 T m T a / G
M 2 = 0.12 + 0.12 T m T a / G
M 3 = 0.11 + 0.1 T m T a / G
S e r i a l   t y p e = 0.12 + 0.15 T m T a / G

3.2.2. Thermal Efficiency

As shown in Figure 12, the thermal energy efficiency was examined in the same way as the electrical energy generation efficiency for each unit connection method. The line graph equations were also calculated in the same way through Equations (9)–(12) and compared.
η t h of parallel-type M 1 was calculated to be 0.33, and ζ t h to be +4.5, indicating that the thermal energy generation efficiency increased with the insolation correlation coefficient.
In addition, η t h of M 2 was 0.44, and ζ t h was −0.16, whereas η t h of M 3 was 0.77, and ζ t h was −21.2. This indicated that in the serial-type connection, as the insolation correlation coefficient increased, the thermal energy generation efficiencies of M 2 and M 3 sharply dropped to 5% and 25%, respectively, compared with that of M 1 .
As the total η t h of the serial-type connection was 0.51, and ζ t h was −5.6, η t h was 20% lower than that of M 3 . However, ζ t h was 378%, indicating that heat gain decreased as the insolation correlation coefficient increased. In addition, although η t h was about 55% higher than that of the parallel-type connection, as heat loss occurred as the insolation correlation coefficient increased, the parallel-type connection was determined to be advantageous in terms of thermal energy generation efficiency.
M 3 yielded the highest η t h at 0.77 but the greatest heat loss rate, at ζ t h of −21.2. This is likely because, although the difference between the inlet and outlet fluid temperatures of M 3 is smaller than that of M 1 and M 2 , the thermal efficiency is high because it changes at a higher temperature. Regarding the heat loss rate, as the average fluid temperature of M 3 was higher than that of M 1 and M 2 , the change in fluid temperature according to the module temperature and the outside temperature was low.
M 1 I n d e p e n d e n t   t y p e = 0.33 + 4.5 T m T a / G
M 2 = 0.44 0.16 T m T a / G
M 3 = 0.77 21.2 T m T a / G
S e r i a l   t y p e = 0.51 5.6 T m T a / G
According to Abdul-Ganiyu et al., the PVT efficiency changes according to the flow rate of the fluid. When the flow rate was 0.063 kg/s m2, the maximum electrical and thermal energy was generated regardless of the insolation and outside temperature, although the temperature of the generated fluid was the lowest. When the flow rate was 0.033 kg/s m2 under average insolation conditions, both electricity and heat generation were stable, and the fluid temperature was also suitable [8]. Although the standards for the production volume and stable temperature of the fluid have not been precisely presented, it seems necessary to apply an appropriate flow rate depending on the module by analyzing the change in efficiency as a function of the flow rate. The conventional PVT flow rate was applied to the developed CW-PVT and used in the experiment of this study, even though it was about 1/3 the size of the conventional commercial PVT. As such, excessive heat loss likely occurred in the M 3 module because a flow rate not optimized for the CW-PVT structural characteristics was applied. Since the flow rate used was applied as an experimental condition in this study, the change in efficiency as a function of flow rate does not affect the results of this study.
Under actual experimental conditions, the average thermal efficiency was calculated to be approximately 43% for M 1 (independent type) and M 2 , 28% for M 3 , and 38% for the serial type. Compared with the 43% thermal efficiency of single CW-PVT calculated in Figure 5, M 1 and M 2 had the same efficiency, while 3 and the serial type were approximately 35% and 12% lower.

4. Conclusions

In this study, the performance of the CW-PVT unit developed in a previous study was derived and analyzed according to the pipe connection method. Meteorological variable data and the inlet and outlet fluid temperatures, surface temperature, electrical energy generation of the modules were measured in an outdoor field study according to the module pipe connection method. These data were analyzed to derive the performance of each module for the parallel-type and serial-type connections through equations. The results of this comparative study are summarized as follows:
(1)
For the parallel-type unit connection, the maximum daily surface temperature was 20.1 °C, and the module was uniformly cooled by the coolant to 16.2 °C on average. For the serial-type unit connection, however, the maximum daily module surface temperature of M 2 increased by 15% higher than that of M 1 , and that of M 3 increased by 12% higher than that of M 2 . Thus, the parallel-type method demonstrated a higher module surface cooling efficiency than the serial-type method.
(2)
Although the parallel-type and serial-type methods yielded the same electrical efficiency coefficient, the electric loss coefficient of the serial-type method was approximately 62% lower. Furthermore, in comparison to the thermal efficiency coefficient in the serial-type method, which was about 55% higher than that in the parallel-type method, the heat loss coefficient of the serial-type method was −5.6, indicating that heat loss occurred as the insolation correlation coefficient increased. Therefore, the parallel-type connection method yielded both excellent electrical energy generation efficiency and thermal energy generation efficiency according to the insolation correlation coefficient.
(3)
Through a field study of the CW-PVT unit, the performances of the parallel-type and serial-type connection methods were derived, compared, and analyzed. The results indicated that the parallel-type method was approximately 10% more efficient for both electrical and thermal energy generation. However, when comparing the coolant temperatures, the serial-type method produced water with a temperature approximately 47% higher than that of the parallel-type method. Consequently, it is advantageous to apply the parallel-type connection method to maximize energy generation efficiency and the serial-type connection method to produce hot water at high temperatures.
As electricity and the thermal energy production efficiency of each module differs by the connection type of the CW-PVT unit, it is considered to be most efficient in energy supply and use if the characteristics of electricity and thermal energy consumption of the target building are considered in selecting the connection methods of the CW-PVT unit. Further, if the serial-type and parallel-type connection methods are controlled in real time in accordance with the electricity and thermal energy consumption of the building, it is expected to have a positive effect on the energy supply of the entire building.
Future studies should focus on developing an efficient energy supply system by controlling the coolant temperature and module pipe connection types depending on meteorological variables and building energy consumption using a CW-PVT control algorithm developed on the data obtained from the experiments of this study.

Author Contributions

Writing—original draft preparation, Y.K.; writing—review and editing, Y.K., S.B. and Y.N.; project administration, Y.K. and Y.N.; supervision, J.H. All authors have read and agreed to the published version of the manuscript.

Funding

This work was supported by the National Research Foundation of Korea (NRF) grant funded by the Korea government (MSIP) (No. 2019R1A2C2006605).

Institutional Review Board Statement

Not applicable.

Informed Consent Statement

Not applicable.

Conflicts of Interest

The funders had no role in the design of the study; in the collection, analyses, or interpretation of data; in the writing of the manuscript; in the decision to publish the results.

References

  1. Ministry of Foreign Affairs of KOREA, The Republic of Korea’s Enhanced Update of its First Nationally Determined Contributionits. 2021. Available online: https://www.mofa.go.kr/www/brd/m_4080/view.do?seq=371966 (accessed on 23 December 2019).
  2. Ministry of Trade, Industry and Energy of KOREA, Industry and Energy (New Renewable Energy Policy Division). New Energy and Renewable Energy Development, Use, and Spread Promotion Law. 2005. Available online: https://www.law.go.kr/lsInfoP.do?lsiSeq=231683#0000 (accessed on 4 December 1987).
  3. Ministry of Land, Infrastructure and Transport of KOREA, Building Energy Certification Rules. 2017. Available online: https://www.law.go.kr/lsInfoP.do?lsiSeq=191338#0000 (accessed on 20 May 2013).
  4. Kim, H.; Nam, Y.; Bae, S.; Cho, S. Study on the Performance of Multiple Sources and Multiple Uses Heat Pump System in Three Different Cities. Energies 2020, 13, 5211. [Google Scholar] [CrossRef]
  5. Park, C.-H.; Ko, Y.-J.; Kim, J.-H.; Hong, H. Greenhouse Gas Reduction Effect of Solar Energy Systems Applicable to High-rise Apartment Housing Structures in South Korea. Energies 2020, 13, 2568. [Google Scholar] [CrossRef]
  6. Kern, E.C., Jr.; Russell, M.C. Combined Photovoltaic and Thermal Hybrid Collector Systems. In Proceedings of the IEEE Photovoltaic Specialists Conference, Washington, DC, USA, 5–8 June 1978. [Google Scholar]
  7. Moradi, K.; Ebadian, M.A.; Lin, C.-X. A review of PV/T technologies: Effects of control parameters. Int. J. Heat Mass Transf. 2013, 64, 483–500. [Google Scholar] [CrossRef] [Green Version]
  8. Abdul-Ganiyu, S.; Quansah, D.A.; Ramde, E.W.; Seidu, R.; Adaramola, M.S. Study effect of flow rate on flat-plate water-based photovoltaic-thermal (PVT) system performance by analytical technique. J. Clean. Prod. 2021, 321, 128985. [Google Scholar]
  9. Arora, S.; Singh, H.P.; Sahota, L.; Arora, M.K.; Arya, R.; Singh, S.; Jain, A.; Singh, A. Performance and cost analysis of photovoltaic thermal (PVT)-compound parabolic concentrator (CPC) collector integrated solar still using CNT-water based nanofluids. Desalination 2020, 495, 114595. [Google Scholar] [CrossRef]
  10. Lee, K.-S.; Putrayudha, S.A.; Kang, E.-C.; Lee, E.-J. An Experimental Comparison Study of PVT Water and PVT Air Modules for Heat and Power Co-Generation. J. KJACR 2014, 26, 559–564. [Google Scholar] [CrossRef]
  11. Kim, J.-H.; Kang, J.-G.; Kim, J.-T. Experimental Performance Comparison of Water Type Glazed and Unglazed PV-Thermal Combined Collectors. J. KIAEBS 2009, 9, 37–42. [Google Scholar]
  12. Chun, J.-A.; Jeong, S.-O.; Kim, J.-H.; Kim, J.-T.; Cho, I.-S.; Nam, S.-B. A Study on Performance of Flat Water-type PVT Modules According to Absorber Type. In Proceedings of the KSES Annual Autumn Conference, Seoul, Korea, 24 November 2011. [Google Scholar]
  13. Jeong, S.-O.; Kim, J.-H.; Kim, J.-S.; Park, S.-H.; Kim, J.-T. The Heating Performance Evaluation of Heating System with Building-Integrated Photovoltaic/Thermal Collectors. J. Korean Sol. Energy Soc. 2012, 32, 113–119. [Google Scholar] [CrossRef]
  14. Kim, Y.-H.; Hwang, J.-H. The Performance Analysis of Curtain Wall-Type Liquid-Type Photovoltaic Thermal Systems through Field Study. J. KIAEBS 2020, 14, 779–790. [Google Scholar]
  15. Kim, Y.-H.; Hwang, J.-H. The Performance Analysis of Curtain Wall-type Liquid-type Photovoltaic Thermal System Based on Module Arrangement. J. KIAEBS 2021, 15, 350–360. [Google Scholar]
  16. Bandaru, S.H.; Becerra, V.; Khanna, S.; Radulovic, J.; Hutchinson, D.; Khusainov, R. A Review of Photovoltaic Thermal (PVT) Technology for Residential Applications: Performance Indicators, Progress, and Opportunities. Energies 2021, 14, 3853. [Google Scholar] [CrossRef]
  17. Kim, Y.-H.; Dai, L.-C.; Nam, Y.-J.; Hwang, J.-H. A proposal for optimal liquid solar and thermal systems (l-pvts) and analysis of seasonal energy production. J. KIAEBS 2019, 13, 55–70. [Google Scholar]
  18. Dai, L.-C.; Kim, Y.-H.; Yoon, M.-J.; Hwang, J.-H. Economic analysis of solar energy system in factory buildings in national industrial complexes. J. Korean Inst. Archit. Sustain. Environ. Build. Syst. 2019, 13, 609–620. [Google Scholar]
  19. Kallio, S.; Siroux, M. Energy Analysis and Exergy Optimization of Photovoltaic-Thermal Collector. Energies 2020, 13, 5106. [Google Scholar] [CrossRef]
  20. Korean Standards Association, KS B ISO 9806, Solar Energy—Solar Thermal Collectors—Test Methods. 2016. Available online: https://e-ks.kr/streamdocs/view/sd;streamdocsId=72059235313975366 (accessed on 28 December 2016).
  21. ASHRAE 93–77; Methods of Testing to Determine the Thermal Performance of Solar Collectors; American Society of Heating, Refrigerating and Air Conditioning Engineers, Inc.: Corners, GA, USA, 1991. Available online: https://www.osti.gov/biblio/575023 (accessed on 22 November 1985).
  22. Kim, J.-H.; Chun, J.-A.; Kim, J.-T. The Experimental Performance of an Unglazed PV-Thermal Module with Fully Wetted Absorber. J. KIEAE 2011, 11, 69–73. [Google Scholar]
Figure 1. Basic concept model of CW-PVT.
Energies 15 02317 g001
Figure 2. Drawings of each part of CW-PVT.
Energies 15 02317 g002
Figure 3. Cross-sectional diagram and structure of CW-PVT.
Energies 15 02317 g003
Figure 4. Blueprint of the CW-PVT.
Energies 15 02317 g004
Figure 5. Thermal and electrical performance analysis according to the insolation correlation coefficient.
Energies 15 02317 g005
Figure 6. Schematic diagram of the experimental environment.
Energies 15 02317 g006
Figure 7. Measuring points according to the serial-type unit connection method.
Energies 15 02317 g007
Figure 8. Measuring points according to the parallel-type unit connection method.
Energies 15 02317 g008
Figure 9. Selection of measuring points in the CW-PVT module.
Energies 15 02317 g009
Figure 10. Insolation and outdoor temperature with respect to time.
Energies 15 02317 g010
Figure 11. Analysis of the electrical efficiency by the module and the unit connection method.
Energies 15 02317 g011
Figure 12. Analysis of the thermal efficiency by the module and the unit connection method.
Energies 15 02317 g012
Table 1. Specification details of the CW-PVT.
DescriptionValue
Collector size (mm)700 × 1100
Absorber plate thickness (mm)3
Thermal conductivity of the absorber (W/mK)401
Number of tubes (line)8
Tube diameter (mm)8
Thermal conductivity of the heat insulating material (W/mK)0.05
Thickness of the heat insulating material (m)0.3
PV efficiency under the reference condition (%)16.4
Module Angle (°)15
PV cells per set24
Table 2. Experimental criteria according to ISO 9806 (test methods for assessing solar thermal collectors).
DescriptionStandardTolerance
Wind speed1–4 m/s1 m/s
Solar radiation700 W/m250 W/m2
Inlet flowrate0.02 kg/s·m21%
Diagonal angle~20°-
Table 3. Capacity of the experimental equipment.
Equipment NameCapacityRemarks
Circulating pump2.5 LPM
Cooler3/4 HP
Electric heater3 kW
Table 4. Specifications of the measurement equipment.
Equipment NameModel NameSpecification
Flow meterMX09P-1TEMeasurement range (flow rate)15~500 L/h
Precision±0.5%
Repeatability±0.03%
PyranometerLPPYRA 02Measurement range (insolation)0–2000 W/m2
Precision±10 W/m2
ISO 9060 classificationFirst class
Nonstability1.5%/years
Type T thermocoupleTT-T-30-SLEOperating temperature−267~260 °C
Precision±0.5 °C
Standard limits of error±0.75%
Data loggerDAQ970AMeasurement dataTemperature, voltage, current, resistance
Analog output−10 V–+10 V, 20 mA
Power meterWT310E-FMeasurement dataVoltage, current, electricity, resistance
Precision±0.1%
Table 5. Module surface temperature distribution with respect to time (°C).
Time8910111213141516171819Average (%)Maximum (%)
Measurement Point
M 1 = M 1 -1 = M 1 -2113.614.515.416.116.316.517.216.315.514.913.613.5−5.9−8.7
213.814.715.616.316.616.717.516.615.815.113.813.7−4.3−6.9
314.115.216.317.217.517.718.717.616.515.714.113.9Criteria
414.315.617.018.118.518.719.918.517.316.314.314.2+3.9+6.0
514.515.817.218.418.719.020.118.817.516.514.514.4+5.1+7.0
Average 14.115.216.317.217.517.718.717.616.515.714.113.9
M 2 114.716.017.518.719.019.320.519.117.816.714.714.5−4.8−6.8
214.916.317.819.019.319.620.919.418.117.014.914.7−3.2−4.8
315.116.718.419.820.220.521.920.218.717.415.114.9Criteria
415.317.119.020.521.021.322.921.019.317.915.315.0+2.8+4.4
515.517.319.220.821.321.623.221.319.618.215.515.3+4.2+5.6
Average 15.116.718.419.820.220.521.920.218.717.415.114.9
M 3 115.617.519.521.121.622.023.621.619.818.415.615.4−3.8−5.1
215.917.719.821.421.922.323.922.020.118.715.915.6−2.3−3.8
316.018.120.322.022.623.024.822.720.719.016.015.7Criteria
416.218.420.822.723.223.725.723.321.219.416.115.9+2.2+3.5
516.418.621.023.023.624.126.023.721.519.716.416.1+3.6+4.6
Average 16.018.120.322.022.623.024.822.720.719.016.015.7
Publisher’s Note: MDPI stays neutral with regard to jurisdictional claims in published maps and institutional affiliations.

