
FEM Analysis: A Review of the Most Common Thermal Bridges and Their Mitigation


Abstract
:1. Introduction
Authors’ Contribution
- to decrease their linear thermal transmittance and associated heat losses;
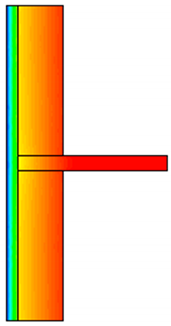
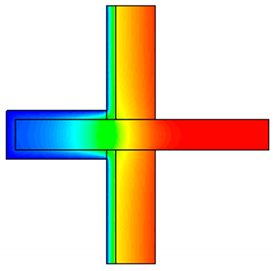
- to evaluate with isotherms the temperature distributions in all areas of the TB;
- to identify any anomalies and hot spots.
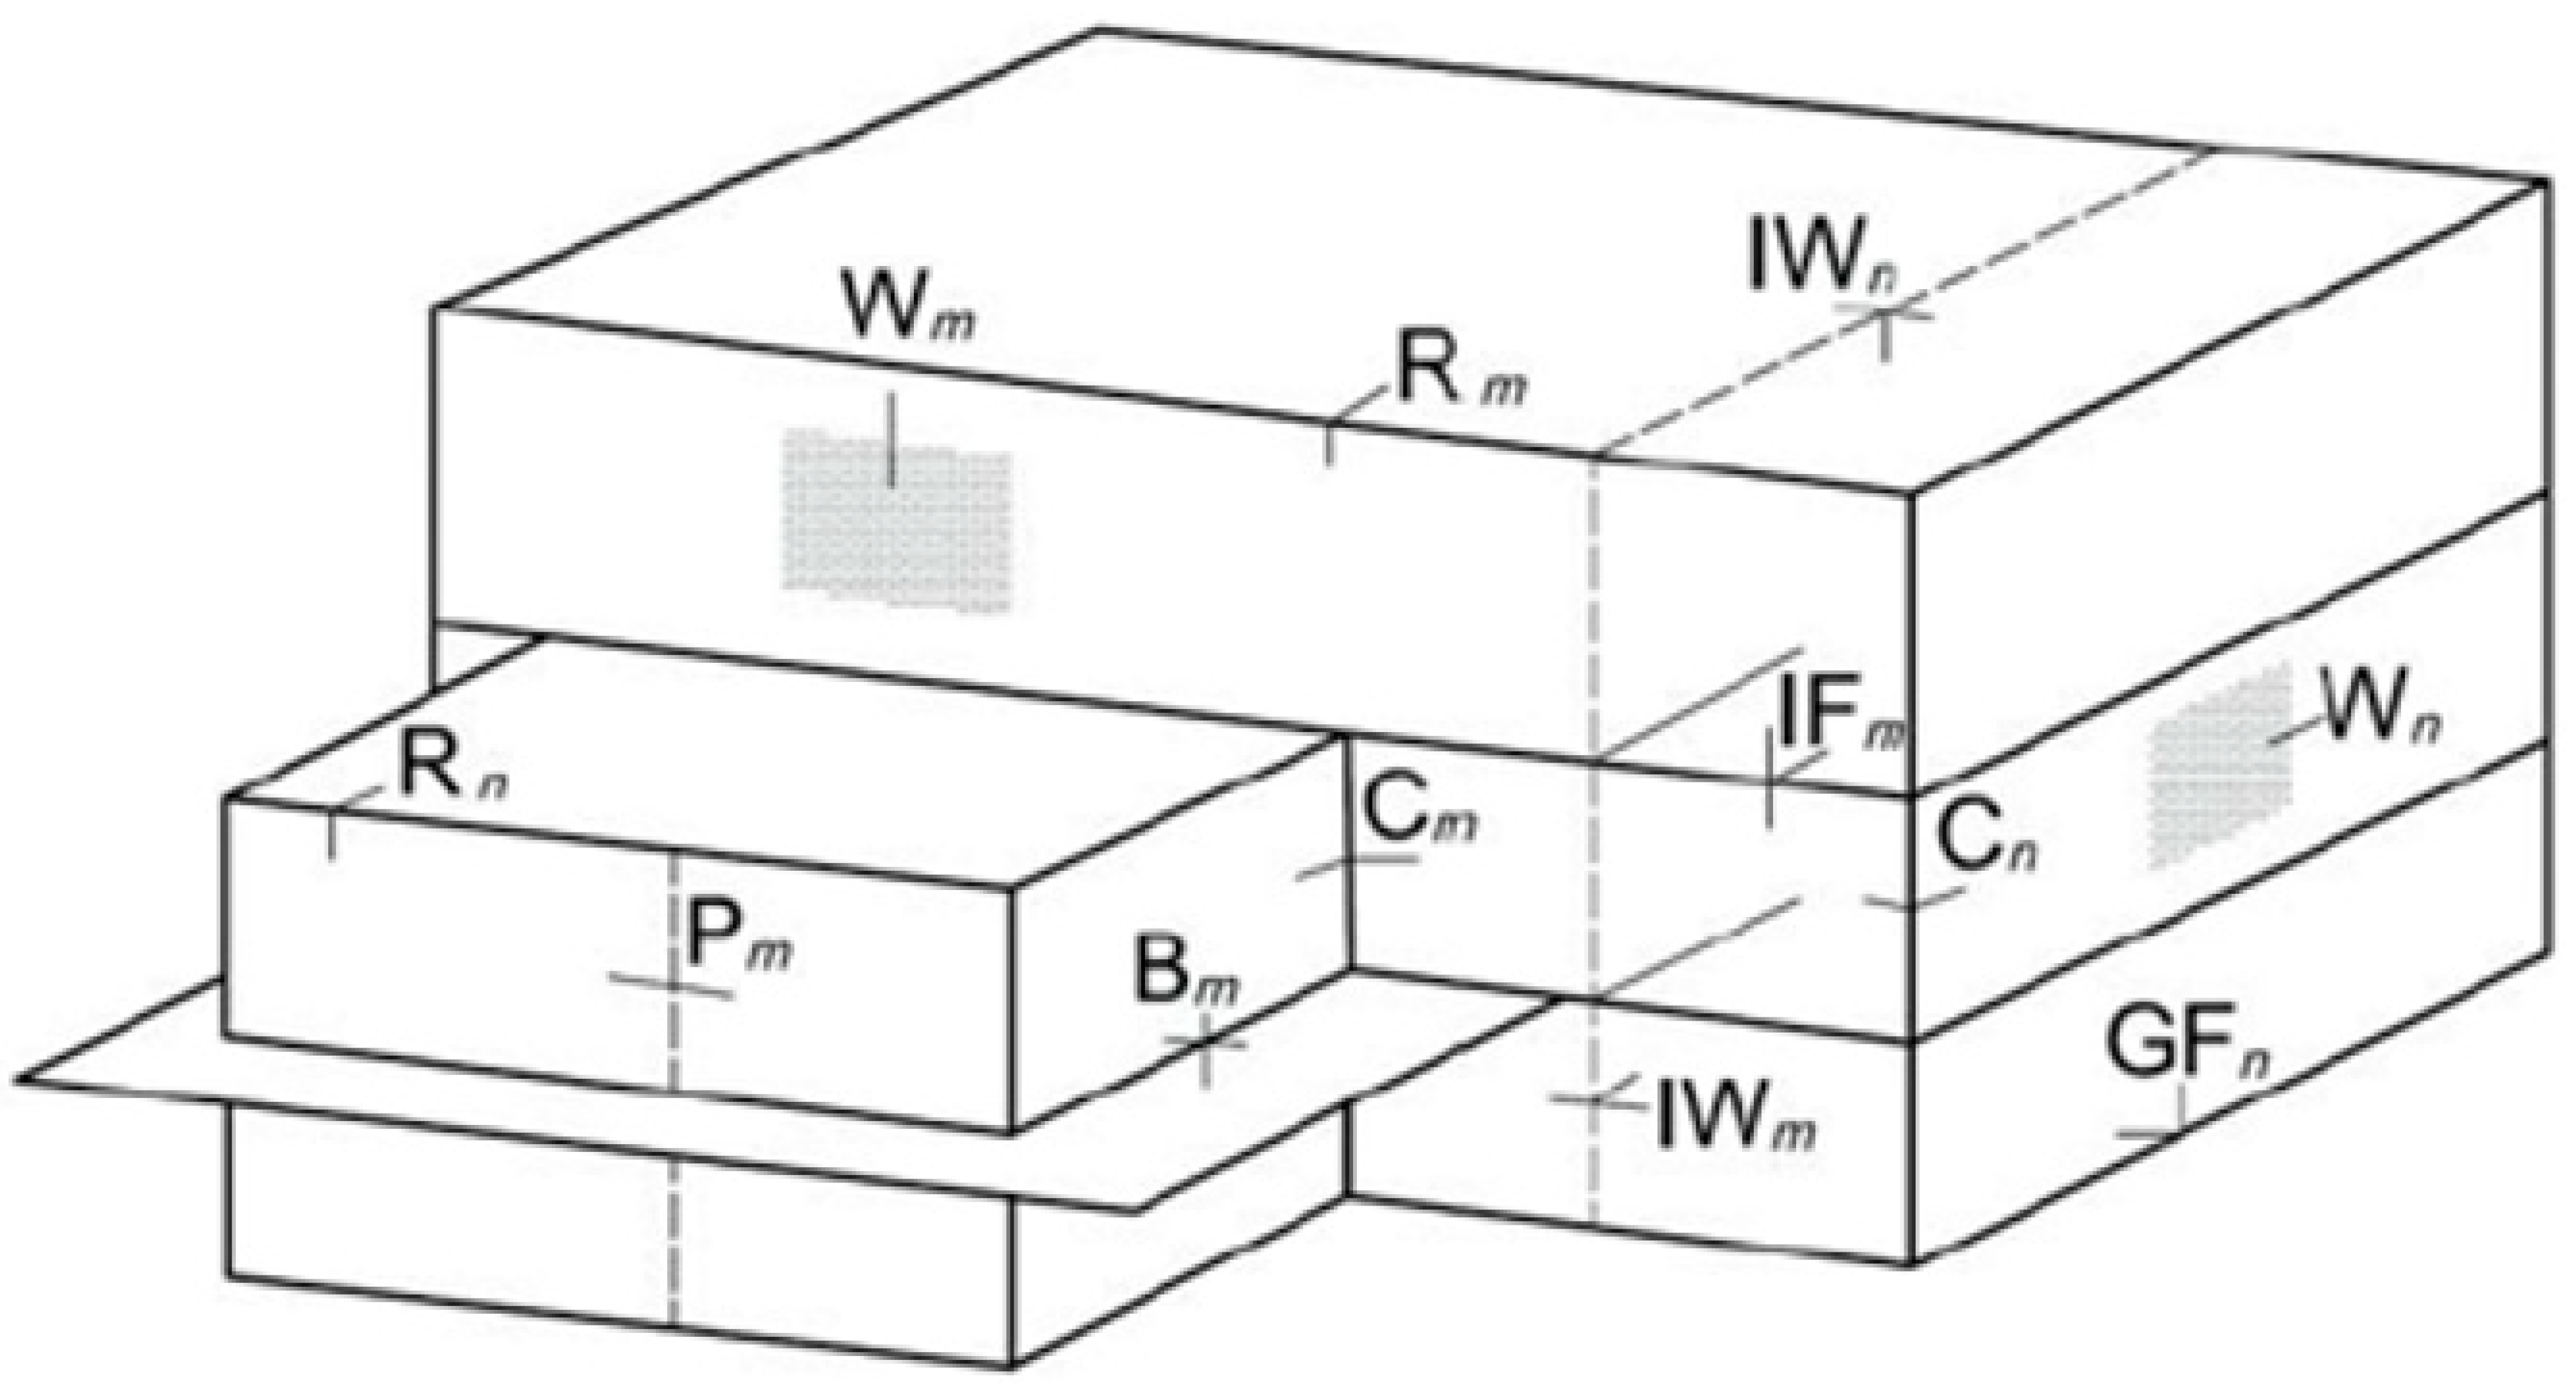
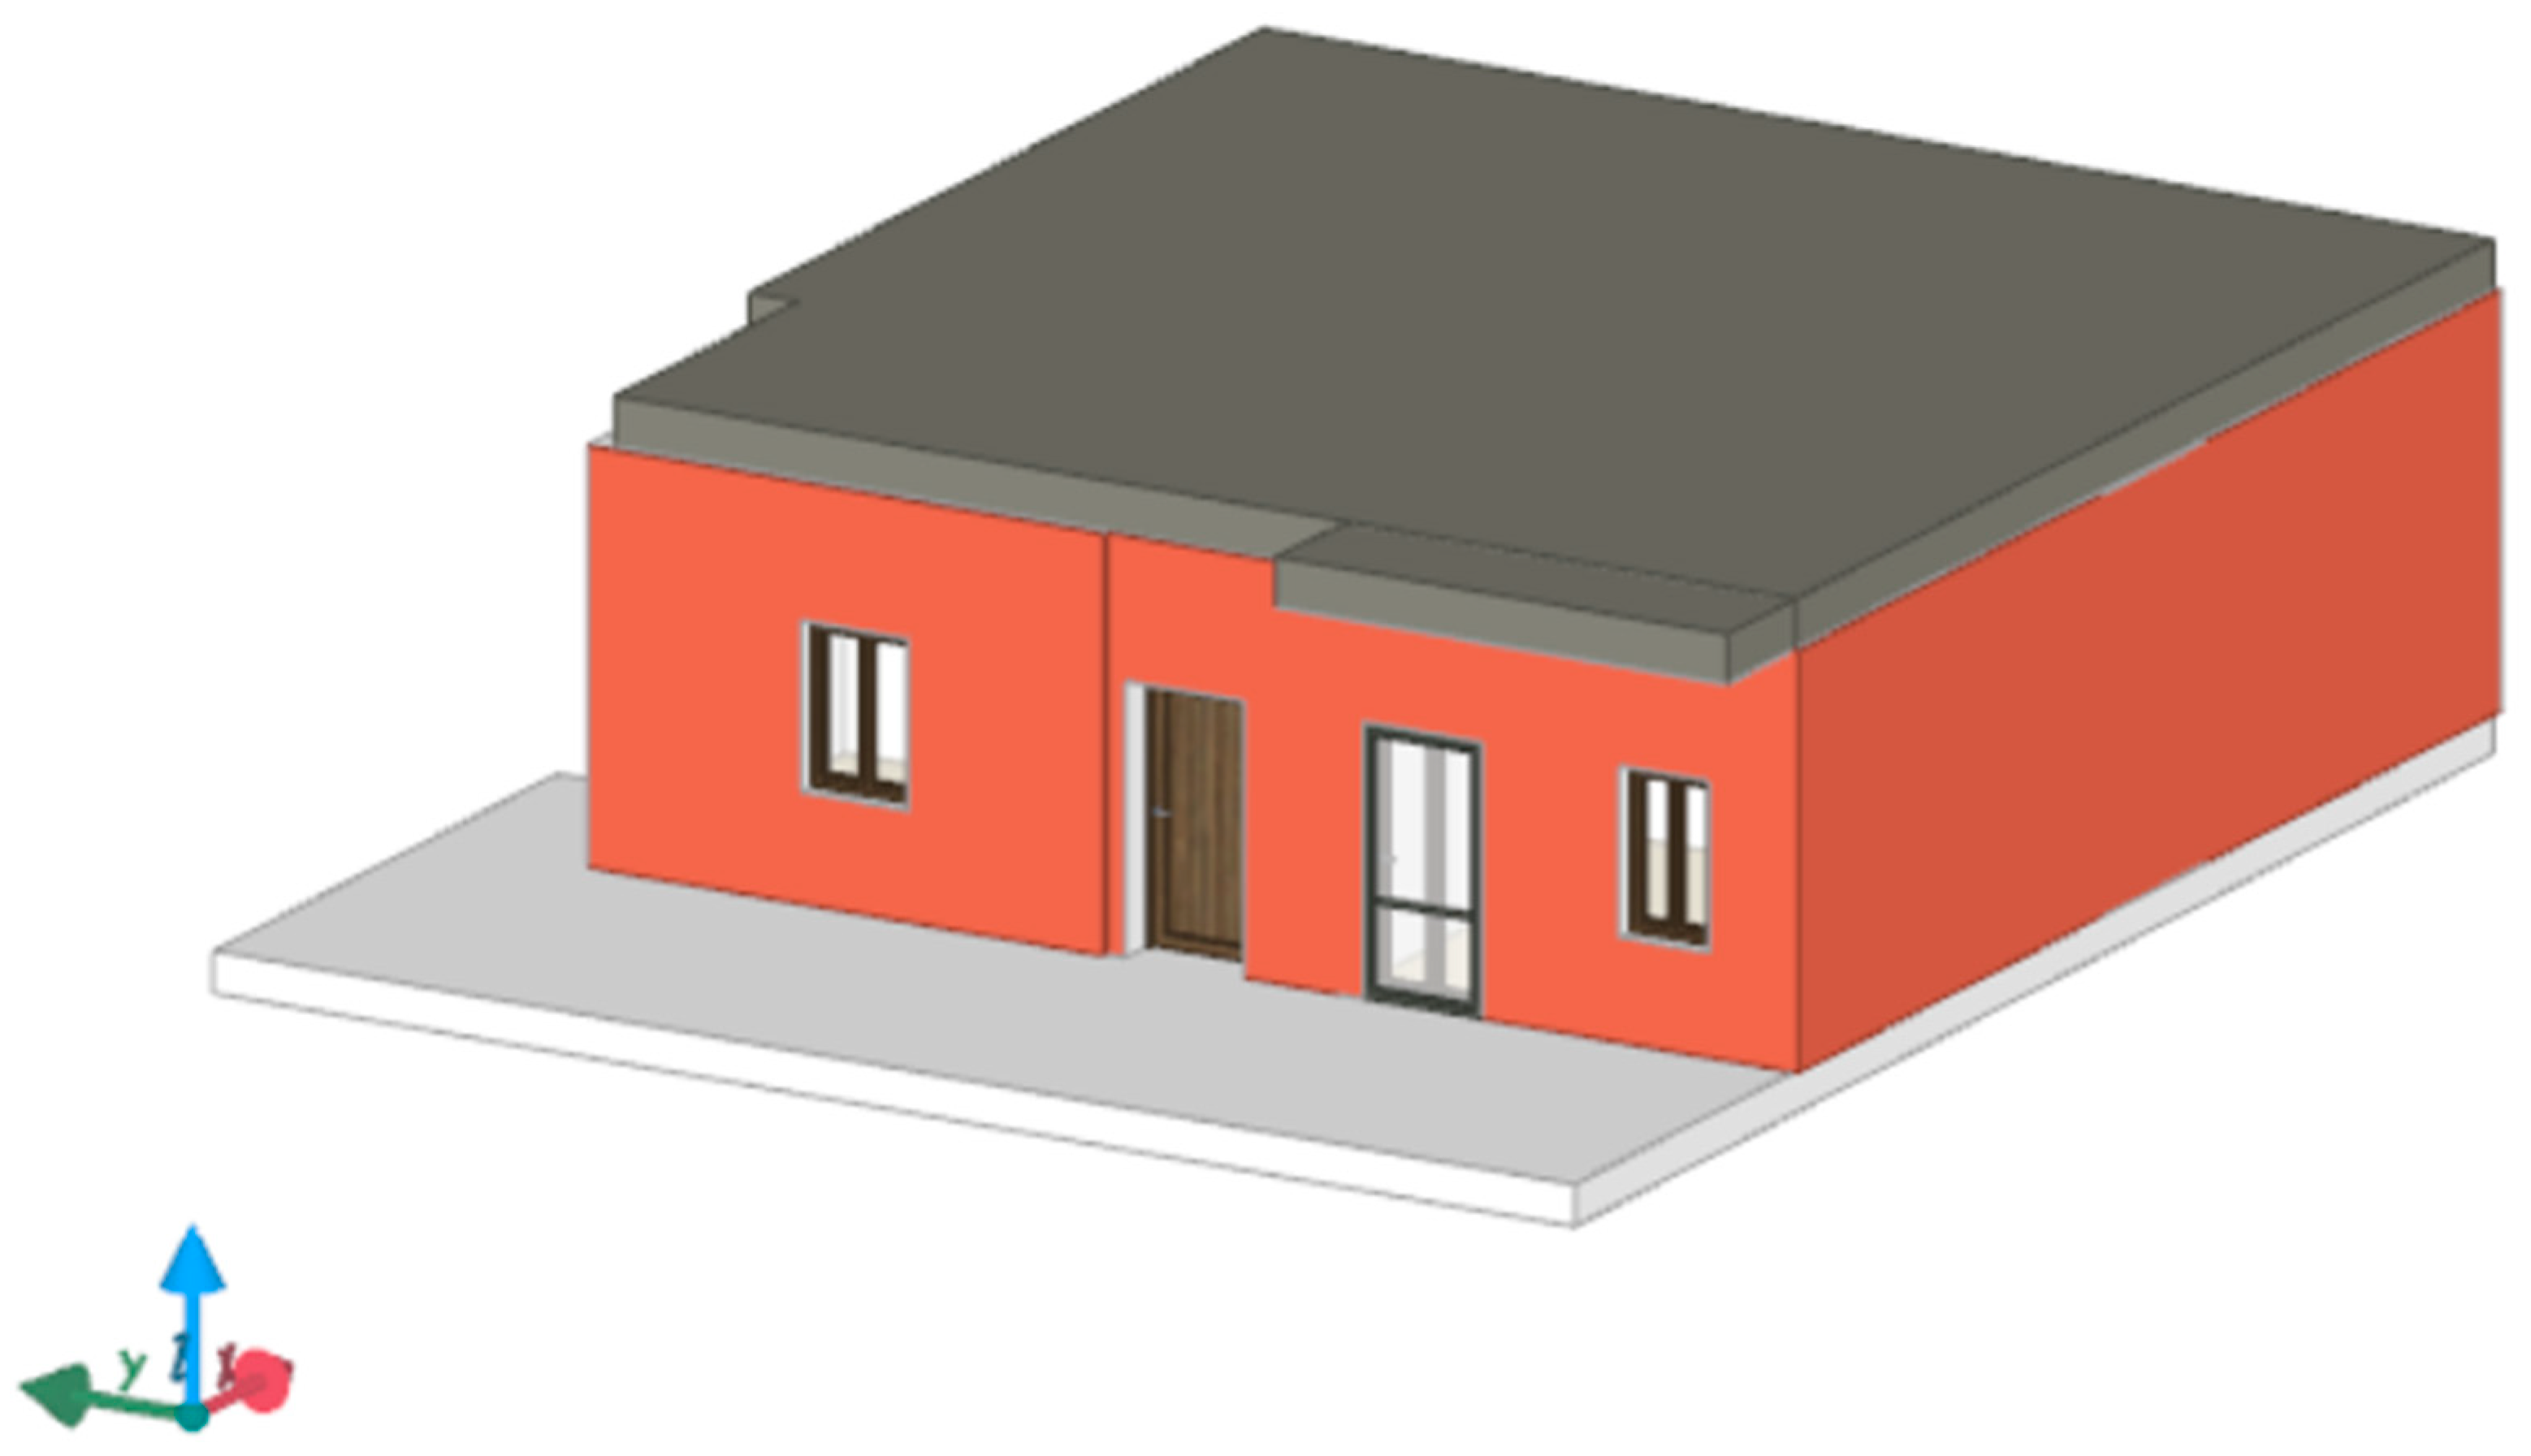
2. Case Study
- External wall
- Internal wall
- Floor on ground and internal floor
- Windows
3. Methodology
FEM Theory
4. Results and Discussions
4.1. TBs FEM Analysis
- IW: internal wall
- B: Balcony
- W: Windows
- R: Roof
- IF: Internal floor
- GF: On ground floor
- P: Pillar
- Cm: External bridges
4.2. FEM Analysis Validation
4.3. Correct Installation of Thermal Insulation
5. Conclusions
- The percentage incidence of TBs on the total heat loss in this study is approximately 10%, whereas the incidence of the study by Sara Aghasizadeh et al. is estimated at 12%;
- There are also contrasting results, as in this study the values calculated using the FEM method and those of the national atlas are comparable. In the Stefano Bergero and Anna Chiari study, however, the atlas values are eight times lower than the calculation ones.
Author Contributions
Funding
Acknowledgments
Conflicts of Interest
Nomenclature
| B | Balcony |
| Cm | External corner |
| Cn | Internal corner |
| EPBD | Energy Performance of Buildings Directive |
| EPS | Sintered expanded polystyrene |
| FEM | Finite element method |
| Fig. | Figure |
| GF | On ground floor |
| IF | Internal floor |
| IW | Internal wall |
| P | Pillar |
| PNRR | National Recovery and Resilience Plan |
| TB | Thermal bridge |
| W | Window |
Appendix A. Definitions
- Determination of the design based on the outdoor temperature, and annual average temperature of the area in which the building is located;
- Distinction between heated and unheated spaces and their internal temperatures;
- Dimensional characterisation of all building elements;
- Calculation of heat loss through transmission;
- Calculation of heat loss through ventilation;
- Calculation of the heating capacity, i.e., the additional capacity required to compensate for the effects of intermittent heating;
- Calculation of the total heat load.
- Transmission heat loss to the outside through the envelope, (W/K);
- Transmission heat loss to the unheated space, (W/K);
- Transmission heat loss to the ground, (W/K);
- Transmission heat loss to a heated space at a different temperature, (W/K);
- Ventilation heat loss, (W/K).
- IW: internal wall;
- B: balcony;
- W: window;
- R: roof;
- IF: internal floor;
- GF: on ground floor;
- P: Pillar;
- Cm: external corner;
- Cn: internal corner.
References
- Ibañez Iralde, N.S.; Pascual, J.; Salom, J. Energy retrofit of residential building clusters. A literature review of crossover recommended measures, policies instruments and allocated funds in Spain. Energy Build. 2021, 252, 111409. [Google Scholar] [CrossRef]
- Commission, E. Directive of the European Parliament and of the Council on the Energy Performance of Buildings; European commission: Brussel, Belgium, 2021. [Google Scholar]
- European Commision Directive 2010/31/EU of the European Parliament and of the Council of 19 May 2010 on the energy performance of buildings (recast). Off. J. Eur. Union 2010, 3, 13–35.
- Governo Italiano. Presidenza del Consiglio dei Ministri Piano Nazionale di Ripresa e Resilienza. 2021. Available online: https://www.governo.it/sites/governo.it/files/PNRR.pdf (accessed on 15 February 2022).
- Stampa, A. Delle Entrate Sezione Pubblicazioni on Line dell’Ufficio Comunicazione e Detrazioni per Interventi di Efficientamento Energetico, Sisma Bonus, Fotovoltaico, Colonnine di Ricarica di Veicoli Elettrici, Eliminazione delle Barriere Architettoniche; Agenzia delle Entrate: Rome, Italy, 2021. [Google Scholar]
- Curto, D.; Franzitta, V.; Guercio, A.; Panno, D. Energy Retrofit. A Case Study—Santi Romano Dormitory on the Palermo University. Sustainability 2021, 13, 13524. [Google Scholar] [CrossRef]
- Curto, D.; Guercio, A.; Franzitta, V. Investigation on a Bio-Composite Material as Acoustic Absorber and Thermal Insulation. Energies 2020, 13, 3699. [Google Scholar] [CrossRef]
- UNI EN ISO 14683; Thermal Bridges in Building Construction—Linear Thermal Transmittance—Simplified Methods and Default Values. European Standard: Milano, Italy, 2018.
- Borelli, D.; Cavalletti, P.; Marchitto, A.; Schenone, C. A comprehensive study devoted to determine linear thermal bridges transmittance in existing buildings. Energy Build. 2020, 224, 110136. [Google Scholar] [CrossRef]
- Kim, S.; Seo, J.; Jeong, H.; Kim, J. In situ measurement of the heat loss coefficient of thermal bridges in a building envelope. Energy Build. 2022, 256, 111627. [Google Scholar] [CrossRef]
- Bergero, S.; Chiari, A. The influence of thermal bridge calculation method on the building energy need: A case study. Energy Procedia 2018, 148, 1042–1049. [Google Scholar] [CrossRef]
- Terentjevas, J.; Šadauskaitė, M.; Šadauskienė, J.; Ramanauskas, J.; Buska, A.; Fokaides, P.A. Numerical investigation of buildings point thermal bridges observed on window-thermal insulation interface. Case Stud. Constr. Mater. 2021, 15, 1–10. [Google Scholar] [CrossRef]
- Romero, M.J.; Aguilar, F.; Vicente, P.G. Analysis of design improvements for thermal bridges formed by double-brick façades and intermediate slabs for nZEB residential buildings in Spain. J. Build. Eng. 2021, 44, 103270. [Google Scholar] [CrossRef]
- Aghasizadeh, S.; Kari, B.M.; Fayaz, R. Thermal performance of balcony thermal bridge solutions in reinforced concrete and steel frame structures. J. Build. Eng. 2022, 48, 103984. [Google Scholar] [CrossRef]
- Zhang, X.; Jung, G.J.; Rhee, K.N. Performance Evaluation of Thermal Bridge Reduction Method for Balcony in Apartment Buildings. Buildings 2022, 12, 63. [Google Scholar] [CrossRef]
- Ge, J.; Xue, Y.; Fan, Y. Methods for evaluating and improving thermal performance of wall-to-floor thermal bridges. Energy Build. 2021, 231, 110565. [Google Scholar] [CrossRef]
- Zaccaro, F.; Littlewood, J.R.; Hayles, C.S. Thermal Bridge Analysis for Offsite Manufactured Closed Panel Timber Frame Walls. Smart Innov. Syst. Technol. 2021, 203, 443–453. [Google Scholar] [CrossRef]
- Alayed, E.; Kinnane, O.; O’Hegarty, R. Analysis of thermal bridging in Arabian houses: Investigation of residential buildings in the Riyadh area. In Proceedings of the 35th Passive and Low Energy Architecture (PLEA) Conference, Coruña, Spain, 1–3 September 2020. [Google Scholar] [CrossRef]
- UNI EN ISO 10211:2018; Heat Flows and Surface Temperatures. Italian Organization for Standardization: Milano, Italy, 2018.
- Rockwool (Ed.) ROCKWOOL Red Book; Version 2; CF35 &NY; Pencoed Bridgend: Welsh, UK, 2022. [Google Scholar]
- UNI. Metodo per il Calcolo del Carico Termico di Progetto—Parte 2: Spiegazione e Motivazione della EN 12831-1; Italian Organization for Standardization Prestazione Energetica Degli Edifici: Milano, Italy, 2021. [Google Scholar]

| Layer | Description | Thickness (mm) | Conductivity (W/my) | Thermal Transmittance (W/m2 K) | Vapour Resistance | Specific Heat (J/kgK) |
|---|---|---|---|---|---|---|
| Internal conductance | 0 | 7.7000 | ||||
| 1 | Lime and gypsum plaster | 20 | 0.7000 | 35.0000 | 10.7222 | 1000 |
| 2 | Tuff blocks | 260 | 0.5500 | 2.1154 | 100.0000 | 1000 |
| 3 | Lime and gypsum plaster | 20 | 0.7000 | 35.0000 | 10.7222 | 1000 |
| External conductance | 0 | 25.0000 |
| Layer | Description | Thickness (mm) | Conductivity (W/mK) | Thermal Transmittance (W/m2 K) | Vapour Resistance | Specific Heat (J/kgK) |
|---|---|---|---|---|---|---|
| Internal conductance | 0 | 7.7000 | ||||
| 1 | Lime and gypsum plaster | 15 | 0.7000 | 46.6667 | 10.7222 | 1000 |
| 2 | Hollow brick | 80 | 0.5500 | 4.2553 | 9.3826 | 1000 |
| 3 | Lime and gypsum plaster | 15 | 0.7000 | 46.6667 | 10.7222 | 1000 |
| External conductance | 0 | 25.0000 |
| Layer | Description | Thickness (mm) | Conductivity (W/mK) | Thermal Transmittance (W/m2 K) | Vapour Resistance | Specific Heat (J/kgK) |
|---|---|---|---|---|---|---|
| Internal conductance | 0 | 7.7000 | ||||
| 1 | Lime and gypsum plaster | 50 | 0.7000 | 14.0000 | 10.7222 | 1000 |
| 2 | Stone masonry | 750 | 2.2800 | 3.0400 | 100.0000 | 1000 |
| 3 | Lime and gypsum plaster | 50 | 0.7000 | 14.0000 | 10.7222 | 1000 |
| External conductance | 0 | 25.0000 |
| Layer | Description | Thickness (mm) | Conductivity (W/mK) | Thermal Transmittance (W/m2 K) | Vapour Resistance | Specific Heat (J/kgK) |
|---|---|---|---|---|---|---|
| Internal conductance | 0 | 25.0000 | ||||
| 1 | Concrete substrate | 100 | 1.4000 | 14.0000 | 74.2308 | 1000 |
| 2 | Flat concrete slab | 210 | 1.9048 | 10.1579 | 1000 | |
| 3 | Interior plastering | 10 | 0.7000 | 70.0000 | 10.7222 | 1000 |
| External conductance | 0 | 10.0000 |
| Window Single Layer Glass and Frame without Thermal Break | |
|---|---|
| GLASS | FRAME |
| Glass type = Single | Frame type = metal without thermal break |
| Thermal transmittance = 5.40 W/m2K | Thermal transmittance = 2.20 W/m2K |
| Total window thermal transmittance 3.4872 W/m2K | |
| Thickness (mm) | Conductivity (W/mK) | Density (kg/m3) | Specific Heat (J/kgK) | Compressive Strength (kPa) |
|---|---|---|---|---|
| 80 | 0.035 | 90 | 1030 | 0.10 |
| Thermal Heat Loads | ||
|---|---|---|
| Winter design outdoor temperature | 5.00 | °C |
| Maximum dispersion through transmission | 5876.01 | W |
| Maximum dispersion through ventilation | 585.84 | W |
| PROJECT heat load (transmission + ventilation + recovery factor) | 6461.85 | W |
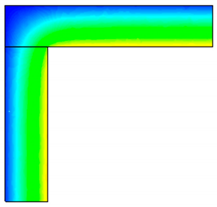
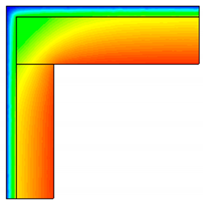
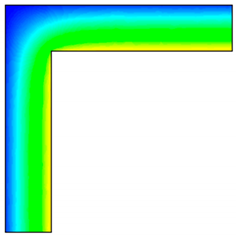
| Not Mitigated TB | Mitigated TB | Temperature Scale | |
 |  | Temperature | |
| Linear thermal transmittance-kl | 0.12 | 0.03 | (W/mK) |
| Total thermal flux-F | 48.41 | 14.19 | (W/m) |
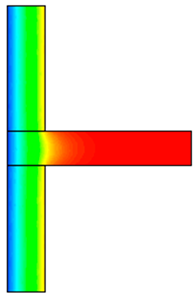
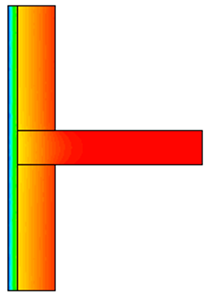
| Not Mitigated TB | Mitigated TB | Temperature Scale | |
|---|---|---|---|
 |  | Temperature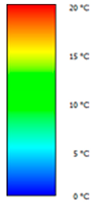 | |
| Linear thermal transmittance-kl | 0.23 | 0.13 | (W/mK) |
| Total thermal flux-F | 66.53 | 15.85 | (W/m) |
| Not Mitigated TB | Mitigated TB | Temperature Scale | |
|---|---|---|---|
 |  | Temperature | |
| Linear thermal transmittance-kl | 0.19 | 0.14 | (W/mK) |
| Total thermal flux-F | 35.89 | 12.79 | (W/m) |
| Not Mitigated TB | Mitigated TB | Temperature Scale | |
|---|---|---|---|
 |  | Temperature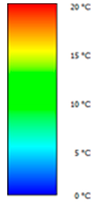 | |
| Linear thermal transmittance-kl | 0.17 | 0.15 | (W/mK) |
| Total thermal flux-F | 70.17 | 17.48 | (W/m) |
| Not Mitigated TB | Mitigated TB | Temperature Scale | |
|---|---|---|---|
 |  | Temperature | |
| Linear thermal transmittance-kl | 0.32 | 0.09 | (W/mK) |
| Total thermal flux-F | 68.39 | 15.36 | (W/m) |
| Not Mitigated TB | Mitigated TB | Temperature Scale | |
|---|---|---|---|
 |  | Temperature | |
| Linear thermal transmittance-kl | 0.21 | 0.10 | (W/mK) |
| Total thermal flux-F | 48.40 | 16.80 | (W/m) |
| Not Mitigated TB | Mitigated TB | Temperature Scale | |
|---|---|---|---|
 |  | Temperature | |
| Linear thermal transmittance-kl | 0.20 | 0.01 | (W/mK) |
| Total thermal flux-F | 76.69 | 16.25 | (W/m) |
| Not Mitigated TB | Mitigated TB | Temperature Scale | |
|---|---|---|---|
 |  | Temperature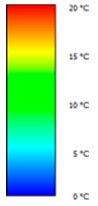 | |
| Linear thermal transmittance-kl | 0.19 | 0.15 | (W/mK) |
| Total thermal flux-F | 76.31 | 18.94 | (W/m) |
| TB | kl Reduction | F Reduction | Kl FEM Simulation (W/mK) | Kl UNI Abacus (W/mK) |
|---|---|---|---|---|
| IW | 75% | 71% | 0.03 | 0.10 |
| B | 44% | 77% | 0.13 | Not present |
| W | 27% | 65% | 0.14 | 0.10 |
| R | Minimum variation | 75% | 0.15 | 0.75 |
| IF | 72% | 78% | 0.09 | 0.10 |
| GF | 50% | 66% | 0.10 | 0.8 |
| P | 95% | 79% | 0.01 | Not present |
| Cm | 22% | 74% | 0.15 | 0.15 |
| Thermal Heat Loads after Envelope Insulation | ||
|---|---|---|
| Winter design outdoor temperature | 5.00 | °C |
| Maximum dispersion through transmission | 4705.60 | W |
| Maximum dispersion through ventilation | 632.90 | W |
| PROJECT heat load (transmission + ventilation + recovery factor) | 5338.51 | W |
Publisher’s Note: MDPI stays neutral with regard to jurisdictional claims in published maps and institutional affiliations. |
© 2022 by the authors. Licensee MDPI, Basel, Switzerland. This article is an open access article distributed under the terms and conditions of the Creative Commons Attribution (CC BY) license (https://creativecommons.org/licenses/by/4.0/).
Share and Cite
Curto, D.; Franzitta, V.; Guercio, A.; Martorana, P. FEM Analysis: A Review of the Most Common Thermal Bridges and Their Mitigation. Energies 2022, 15, 2318. https://doi.org/10.3390/en15072318
Curto D, Franzitta V, Guercio A, Martorana P. FEM Analysis: A Review of the Most Common Thermal Bridges and Their Mitigation. Energies. 2022; 15(7):2318. https://doi.org/10.3390/en15072318
Chicago/Turabian StyleCurto, Domenico, Vincenzo Franzitta, Andrea Guercio, and Pierluca Martorana. 2022. "FEM Analysis: A Review of the Most Common Thermal Bridges and Their Mitigation" Energies 15, no. 7: 2318. https://doi.org/10.3390/en15072318