Article

Developing an Advanced PVT System for Sustainable Domestic Hot Water Supply

Department of Mechanical Engineering, University of New Mexico, Albuquerque, NM 87131, USA
*
Author to whom correspondence should be addressed.
Energies 2022, 15(7), 2346; https://doi.org/10.3390/en15072346
Submission received: 26 January 2022 / Revised: 8 March 2022 / Accepted: 14 March 2022 / Published: 23 March 2022
(This article belongs to the Special Issue Hybrid Solar Collector)

Abstract

:
Energy consumption is steadily increasing with the ever-growing population, leading to a rise in global warming. Building energy consumption is one of the major sources of global warming, which can be controlled with renewable energy installations. This paper deals with an advanced evacuated hybrid solar photovoltaic–thermal collector (PVT) for simultaneous production of electricity and domestic hot water (DHW) with lower carbon emissions. Most PVT projects focus on increasing electricity production by cooling the photovoltaic (PV). However, in this research, increasing thermal efficiency is investigated through vacuum glass tube encapsulation. The required area for conventional unglazed PVT systems varies between 1.6–2 times of solar thermal collectors for similar thermal output. In the case of encapsulation, the required area can decrease by minimizing convective losses from the system. Surprisingly, the electrical efficiency was not decreased by encapsulating the PVT system. The performance of evacuated PVT is compared to glazed and unglazed PVTs, and the result shows a 40% increase in thermal performance with the proposed system. All three systems are simulated in ANSYS 18.1 (Canonsburg, PA, USA) at different mass flow rates and solar irradiance.

1. Introduction

The energy consumption and CO2 emissions decreased in 2020 by 4.5% and 6.3% [1]; however, it is not necessarily a good indication of efficient energy management as the primary reason was due to COVID-19 pandemic lockdowns [2]. In 2018, the world experienced the highest increase in primary energy consumption since 2010 [3]. Energy-related environmental issues are also becoming more prominent as global warming is gradually showing its effects on the climate in different parts of the world. In this context, commercial and residential buildings have the highest contribution to primary energy consumption, and the use of non-renewable energy sources has led to large CO2 emissions from this sector [4]. It has been predicted that by 2035, the building sector will be responsible for 42.1% of total energy consumption in the US [5]. In cold climate regions, the space heating sector has been known as the major energy consumer in buildings. However, the share of this sector is continuously decreasing as the efficiency of heating systems is improving. Additionally, national building regulations are becoming more restricted, leading to the better thermal insulation of the buildings. On the other hand, energy consumption for domestic hot water (DHW) has been almost constant. Energy use for this sector is likely to increase in the future due to the higher demand for better hygiene and comfort. As a result, the share of DHW in the total energy use of buildings is steadily increasing [6].
Different types of DHW systems exist including electrical heaters, natural gas burners, heat pumps, district heating, hybrid systems, and solar thermal collectors. Whether the systems are equipped with a storage tank or not, they should be able to supply hot water at a temperature of 55 °C to avoid Legionella growth. However, in district heating systems, for better thermal efficiency and higher potential for using renewable energies and water heat, supply temperature can be as low as 35 °C. In these cases, local heating systems such as electrical heaters or heat pumps can be used for boosting the temperature for hygiene considerations [6,7]. Three main categories have been considered for energy consumption of the DHW systems, including end-use energy, distribution energy, and storage/conversion energy. The end-use energy is the required energy for heating the water to supply DHW. The required energy to compensate for the heat and pressure losses in the piping system is distribution energy, and the energy that dissipates from the storage tank or heat exchanger is considered as storage/conversion energy [6]. Jingjing et al. [8] analyzed and compared different centralized systems considering hot water usage, gas, and electricity consumption. They concluded that centralized systems have much lower efficiency than natural gas heaters due to considerable heat losses from the pipes in centralized systems. They suggested that centralized systems are advantageous when high COP heat pumps, renewable energies, or waste heat are available for the heat source. In centralized systems, to decrease the waiting time for hot water, the distribution system is equipped with a circulation loop. Because of the scattered locations of the taps and the long distance of the end-users, circulation is the most dominant factor of energy loss in DHW centralized systems [6]. Boait et al. [9] investigated different DHW systems with heat sources. They suggested that the existence of tank storage makes the system flexible in the case of the heat source diversity (e.g., solar thermal) and optimization of the efficiency. They also concluded that in electrically heated systems with a well thermally insulated tank, it is possible to warm up the water when the electricity cost is lowest.
The biggest problem with electrical and gas fueled DHW systems is their high energy consumption and related carbon emissions. Carbon emissions and the use of non-renewable energy sources can be decreased by utilizing solar thermal systems in DHW production; however, entirely renewable energy-based systems seem to be expensive [6]. Several researchers explored techniques to integrate solar energy systems to achieve better energy efficiency and decrease emissions. Biaou and Bernier [10] analyzed and compared four entirely renewable energy-based systems for zero net energy houses and suggested the best solution was solar thermal collectors with electric backup. Rommel et al. [11] examined the application of the unglazed PVT systems for domestic hot water preheating. They reported that 1 m2 of PVT installation per person can deliver 230 kWh of thermal energy and 150 kWh of electrical energy, which is 4% higher than a PV-alone module. Gunerhan and Hepbasli [12] conducted an exergy analysis on a solar DHW system and they stated that exergy analysis is a useful tool to detect the location and true magnitude of the energy losses in the system. They also concluded that solar collectors have the highest improvement potential in terms of exergy losses in the system. Martorana et al. [13] investigated supplying DHW with solar thermal collectors and solar-assisted heat pumps driven by PV and PVT. They stated that the primary energy ratio covered by non-renewable sources decreased in all three systems and solar thermal systems showed high potential for primary energy saving. Huang and Lee [14] developed and validated a method for the performance evaluation of solar-assisted heat pumps. Dannemand et al. [15] demonstrated the concept of the solar-assisted heat pump with cold buffer storage. Researchers have also utilized phase change materials for thermal energy storage in solar DHW to increase the duration of energy delivery to the system and improve the solar collector efficiency by decreasing temperature fluctuations [16]. These research works prove that the integration of solar thermal collectors and heat pumps plays a vital role in reducing the non-renewable energy share in the building’s primary energy consumption.
PVT systems have been utilized for the simultaneous production of heat and electricity from solar energy. PVT systems can be unglazed or glazed and heat transfer fluid can be water, air, nanofluid, or refrigerants. By removing heat from the PV panel, the electrical efficiency of the panel increases, and absorbed heat can be used for heating purposes [17,18]. Emmanuel et al. [19] reviewed influential parameters on the PVT performance, and they introduced the PV cell as the most determinant factor. They also pointed out the significant impact of PVT’s design structure on the performance of the system; however, high costs of PVT structure are still a barrier to the commercialization of the technology. It has been reported that for a limited rooftop space, integrated PVT systems have higher performance than side by side standard PV and solar thermal collectors in terms of total energy saving and energy and exergy outputs [20]. Yuan et al. [21] studied the effect of connection mode and mass flow rate on a PVT hot water system. They concluded that the power output is optimum when two PVT collectors are connected in series and the mass flow rate of water is 0.035 kg.m−2.s−1. Researchers have investigated the application of nanofluids and phase change materials in PVT systems and reported an improvement in both thermal and electrical efficiencies [22,23]. In many cases, the focus is on improving the electrical production of the PV panel by absorbing heat from it; however, in the case of supplying domestic hot water systems via PVT systems, supplying the required hot water temperature may be considered as a priority. Rommel et al. [11] demonstrated utilizing large unglazed PVT systems for preheating of DHW. Brottier and Bennacer [24] investigated 28 PVT systems for preheating DHW in Western Europe. They reported that for supplying DHW, the required area of the PVT systems is generally 1.6–2 times of the solar thermal collectors. In this research, we focus on developing an evacuated hybrid solar collector integrated with a heat pump that can produce the required thermal output with a lower collector area compared to a conventional PVT system by reducing convective heat losses.

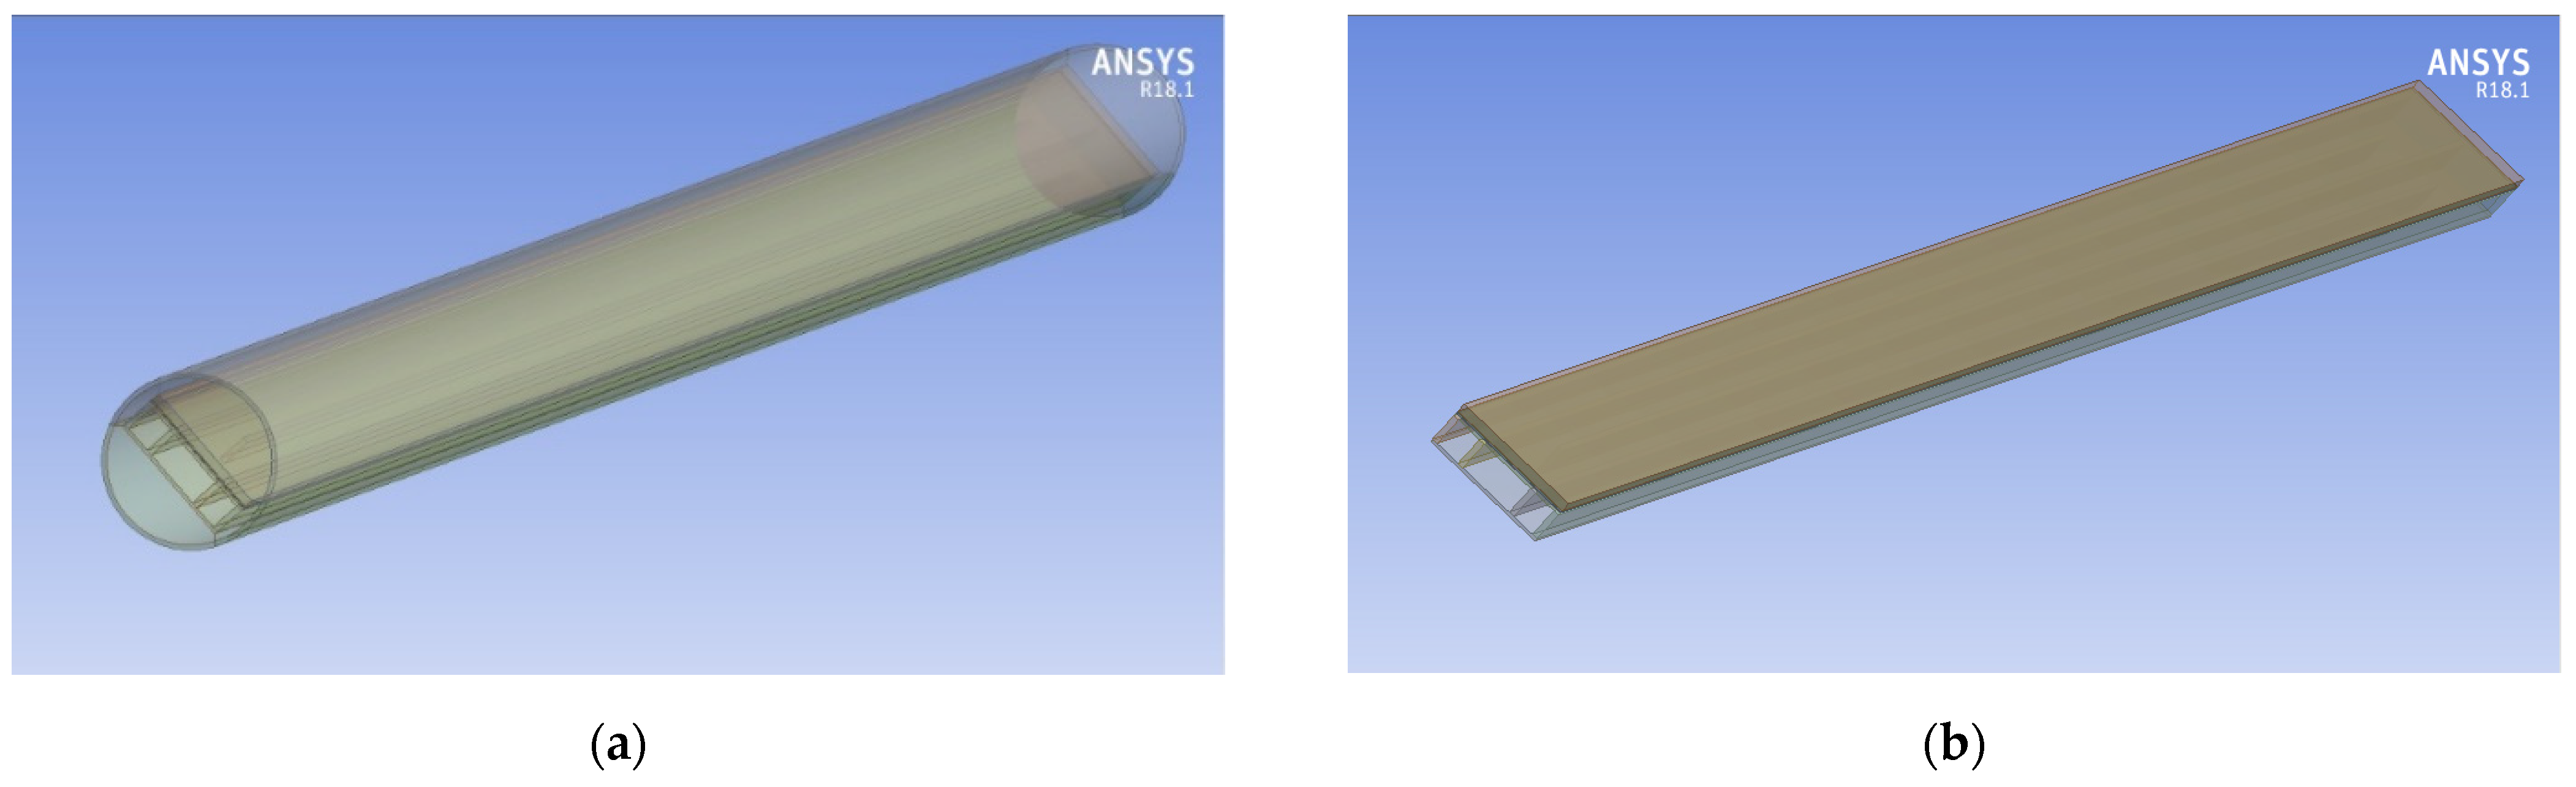
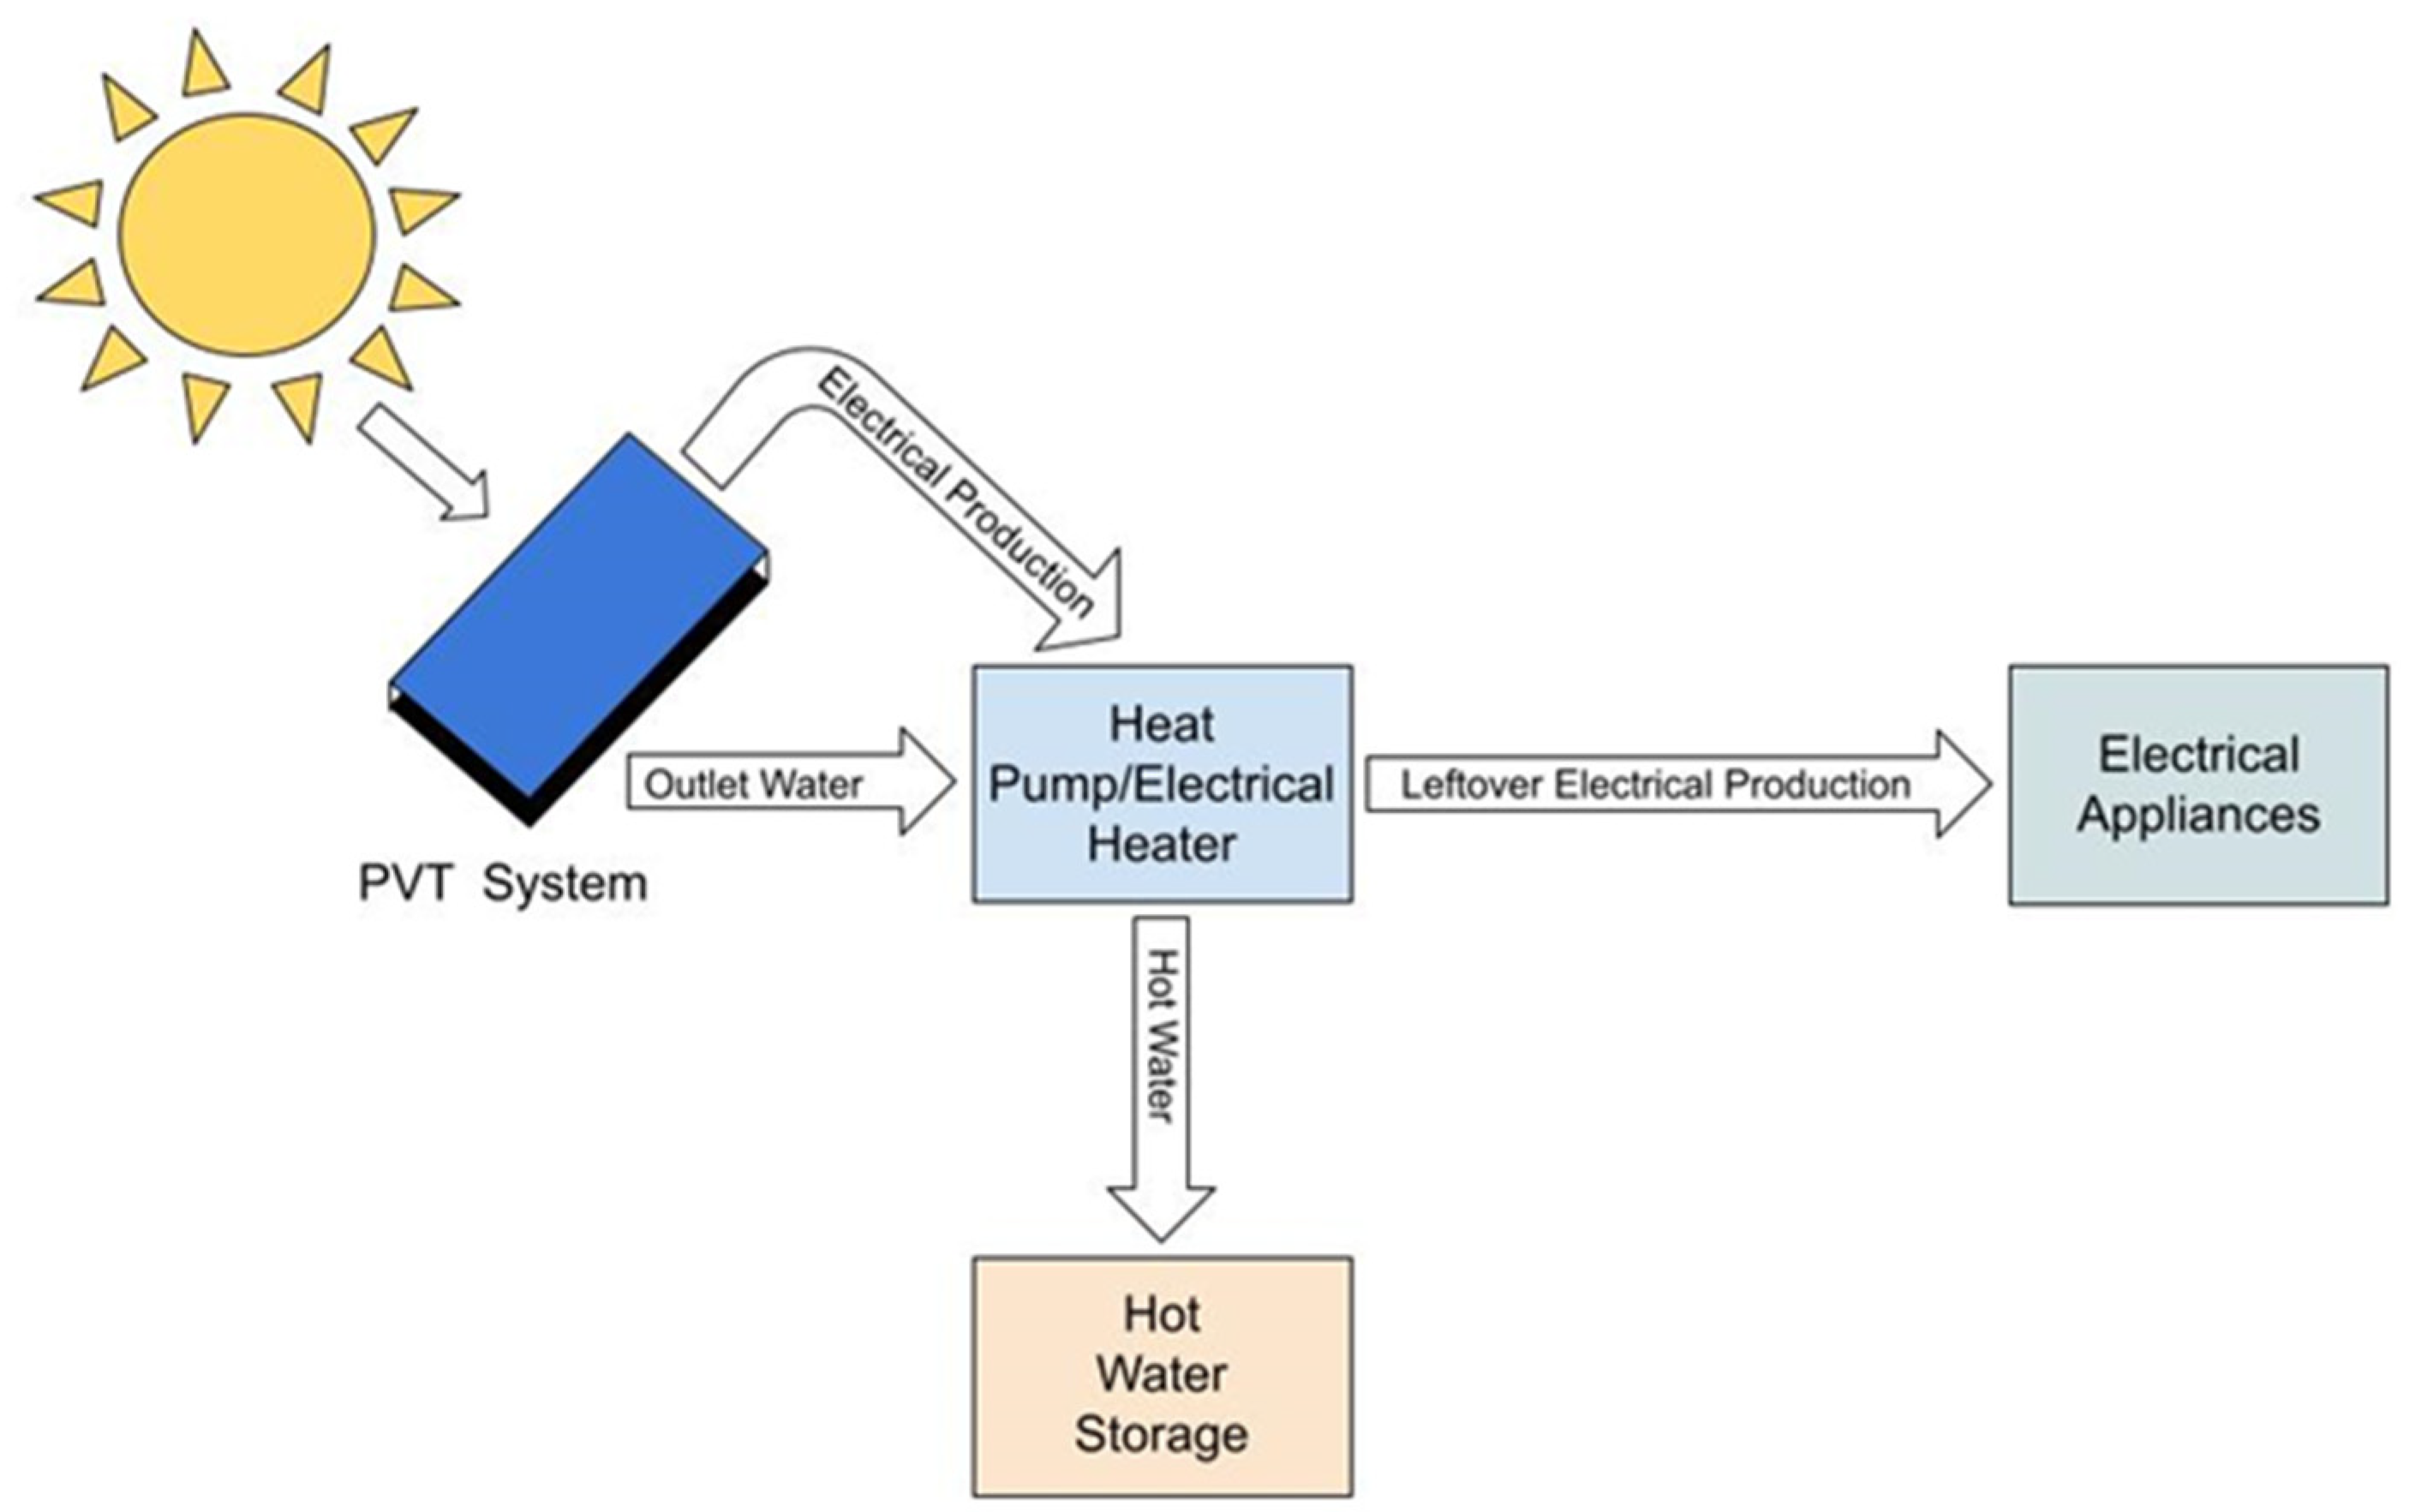
2. System Description

The primary focus of this paper is to improve the thermal efficiency of the PVT system to supply the DHW. Three different PVT systems with the same length and width are simulated with computational fluid dynamics (CFD). All systems are equipped with a heat exchanger attached to the bottom of a PV to extract heat efficiently. To achieve higher thermal efficiency, the first PVT system is encapsulated inside a vacuum glass tube to minimize heat losses from the system. In the second system, PVT is encapsulated in a glass tube with atmospheric air pressure to evaluate the effect of vacuum on the performance of the system. The third system is an unglazed PVT. These systems are depicted in Figure 1. For the evacuated and glazed systems, it was assumed that the commercial glasses available for evacuated tube collectors are utilized for encapsulating the PVT system. Commercial evacuated tube collectors have a length of 1.5–2.4 m and a diameter of 25–75 mm [25]. Accordingly, the length and width of the PV and heat exchanger are selected as 1.8 m and 45 mm, respectively. The heat exchanger material is copper and thermophysical characteristics of the PV layers are provided in Table 1.
The electricity produced from the PVT can be used for daily consumption or delivered to the grid. However, the electricity can be utilized to support DHW as well. In this concept, DHW is preheated using heat extracted from the PVT system. The water temperature is further increased by using the electrical heater or heat pump for comfort and hygiene purposes using the electricity produced by the PV as an additional option. This technique allows heating the water to moderate temperatures and storing it in a storage tank, leading to lower thermal losses and higher thermal efficiency in the PVT and tank [6]. The size of the tank can be considered as 0.05 m3 per unit area of the PV as suggested by Ref. [27]. For increasing the water temperature by electricity, two options are investigated: heat pumps and electrical heaters. Heat pumps can deliver more heat due to their coefficient of performance (COP). For the heat pumps coupled with solar collectors, achieving a COP of 3–5 is possible [28]. Accordingly, three sets of heat pumps with COPs of 3, 4, and 5 were selected in this study. Parametric studies were conducted for all the three PVT systems with different mass flow rates of water and solar heat fluxes of 700, 800, 900, and 1000 W/m2 normal to the panel surface. When hot water is not required, produced electricity can be used for other purposes or connected to the grid. Figure 2 shows how the PVT system and electrical backup system work together to supply the DHW.

3. Mathematical Modeling

3.1. Thermal Modeling and Thermal Efficiency

For analyzing the energetic performance of the PVT systems, one can write the energy balance for each system as follows:
d E d t = Q ˙ i n Q ˙ o u t
where Q ˙ i n   is the energy coming from the solar irradiance on the top plane of the PVT system, and Q ˙ o u t is the total heat loss from the system ( Q ˙ l o s s ). dE/dt is the change of energy inside the control volume which consists of useful heat absorbed by the PVT system ( Q ˙ u s e f u l ) and electrical production of the PVT system ( E ˙ PVT ). For a steady-state condition, the energy balanced equation can be written as follows:
Q ˙ u s e f u l + E ˙ PVT = Q ˙ i n Q ˙ l o s s
Q ˙ i n can be calculated using Equation (3):
Q ˙ i n = τ α I A C
where τ and α are the transmissivity of the glass and absorptivity of the photovoltaic panel. For the unglazed model τ = 1 as there is no glazing for this system. For the evacuated PVT and glazed PVT, the transmissivity is 0.92 [29]. The absorptivity of the photovoltaic panel is considered 0.7 [30]. I is the solar irradiance and A C is the aperture area which is simply equal to the area of the PV in this paper. Total heat loss from the evacuated system consists of radiation and convective losses that can be expressed as follows:
Q ˙ r a d = σ ε h A A ( T m 2 + T s k y 2 ) ( T m + T s k y ) ( T m T s k y )
where σ is the Stephan–Boltzmann constant 5.67 × 10⁻⁸ W/(m2.K4), ε is the emissivity of the PVT surface, Tm is the average temperature of the PVT system, Tsky is the sky temperature T s = 0.0552 T a 1.5 [31], and AA is the surface area of the PVT system.
Q ˙ c o n v = A A h ( T m T a )
where Ta is ambient temperature, and h is the convective heat loss coefficient. For the evacuated and glazed systems, h can be calculated as:
h = N u a   k a D g l a s s
where ka stands for thermal conductivity of air, Dglass represents the diameter of the outer glass tube, and Nua is the Nusselt number which can be calculated as follows [32]:
N u a = { 0.4 + 0.54 R e a 0.52         0.1 < R e a < 1500 0.3 R e a 0.6             1500 < R e a < 50,000
where Rea is the Reynolds number of the air around the glass tube. For the unglazed system, h is considered 8.63 W/m2.K [33].
Thermal efficiency of the system is the ratio of useful heat absorbed by the PVT system to the total solar heat available on the collector:
η t h = Q ˙ u s e f u l Q ˙ i n = A c ( τ α ) I Q ˙ c o n v Q ˙ r a d A c I

3.2. Electrical Modeling and Electrical Efficiency

The electrical efficiency ηe of the PV panels changes by surface temperature variations. Equation (9) can be used to evaluate electrical efficiency [34].
η e = η T r e f [ 1 β r e f ( T c T r e f ) ]
The variable ηc represents the electrical efficiency when the surface temperature of the PV (Tc) is greater than the reference temperature (Tref). The reference temperature is the temperature at which the ηTref is measured. Tref is announced by the PV’s manufacturer, and in most cases is equal to 25 °C. ηTref stands for the electrical efficiency at or below the reference temperature. The temperature coefficient, βref, is a material property and accounts for the change in electrical efficiency by temperature variations.
β r e f = 1 T 0 T r e f
where, T0 is the temperature at which the electrical efficiency of PV drops to zero. For calculating the efficiency in this paper, the values of 0.178 and 0.00375 were used for ηTref and βref, respectively [34]. The electrical efficiency is then used to calculate the electricity production from the PVT system:
E PV = η e I   A PV
where APV is the area of the PV.
For increasing the water temperature by electricity, the specific heat equation was used to calculate the heat gains for the electrical heater and the heat pump.
Q = m . c ( T 2 T 1 )
For both heating systems, the inlet temperature (T1) is the outlet temperature of the PVT system, and T2 is the final temperature of the water after heating by the electrical heater or heat pump. The working fluid is water which has a specific heat (c) of 4180 J/kgK and the mass flow rate (ṁ) is based on CFD simulations.
For the electric heater, Q is equal to the electricity production of the PVT system.
Q EH = E PV
For the heat pump, Q is equal to the electricity production of the PVT system multiplied by the COP of the heat pump.
Q HP = E PV . COP

3.3. Fluid Modeling and Computational Fluid Dynamics (CFD)

For simulating the flow and heat transfer, ANSYS Fluent software (Canonsburg, PA, USA) was utilized which uses the finite volume method for the discretization of the conservation laws. The geometry and mesh for all systems were realized in Design Modeler and ANSYS meshing 18.1. Conservation laws and solar load modeling were executed in ANSYS Fluent utilizing a pressure-based solver. The laminar viscous model selected as the Reynolds number is low because of the low mass flow rate and small hydraulic diameter of the channel. The SIMPLE algorithm was used for pressure–velocity coupling, and the second order upwind scheme was used for spatial discretization of momentum, pressure, and energy. Conservation of mass or continuity equation in an incompressible flow can be stated as follows:
u x + v y + w z = 0
where u, v, and w are fluid velocity components in x, y, and z directions, and conservation laws for momentum in x, y, and z directions are presented in Equations (16)–(18).
ρ [ u t + u u x + v u y + w u z ] = p x + μ ( 2 u x 2 + 2 v y 2 + 2 w z 2 ) + ρ g x
ρ [ v t + u v x + v v y + w v z ] = p y + μ ( 2 u x 2 + 2 v y 2 + 2 w z 2 ) + ρ g y
ρ [ w t + u w x + v w y + w w z ] = p z + μ ( 2 u x 2 + 2 v y 2 + 2 w z 2 ) + ρ g z
where µ,   ρ , and p are viscosity, density, and pressure of the fluid, and g is the gravity. The conservation of energy is shown in Equation (19).
ρ c ( u T x + v T y + w T z ) = k ( 2 T x 2 + 2 T y 2 + 2 T z 2 )

Mesh and Boundary Conditions

In order to produce high-quality hexahedral elements, the geometry of PVT systems was split into several control volumes and O-grid mesh was applied to the tube geometry. Producing hexahedral mesh elements allows to reduce the total number of elements, while it has the highest accuracy with a specific number of elements. In contrast, using unstructured mesh can lead to high skewness cells. However, producing hexahedral mesh takes more time and needs more effort. For reducing the total number of mesh elements, calculations are made only for one unit of each PVT system. Then, mass flow rates are calculated for the unit area of each system by assuming multiple units are connected in parallel. Figure 3 shows the mesh cross-section view for the PVT systems. In the evacuated and glazed systems, the total number of nodes and cells are 440,319 and 390,600, respectively. The maximum cell skewness for these systems is 0.374. In the unglazed system, there are 81,449 nodes and 63,180 cells with maximum skewness of zero. Mesh independency results for the evacuated PVT at 800 W/m2 and 16.769 kg/h.m2 are provided in Table 2. Three different mesh sets with 781,200, 390,600, and 143,190 cells were selected and compared. Based on the results, the grid set with 390,600 cells was selected for the simulation with acceptable accuracy and computational costs. After satisfying the mesh independence, the same mesh sizing procedure was adopted for the glazed and unglazed systems.
In all systems, velocity inlet and pressure outlet boundary conditions were used for the inlet and outlet of the PVT. The outlet temperature of 40–60 °C from the PVT systems was used as a criterion for determining velocity inlet magnitude. In most cases, the value used for velocity inlet fits between 0.003–0.011 m/s2 for each single PVT module. In the unglazed system, the bottom and sidewalls of the PVT system were assumed as adiabatic walls. In the evacuated and glazed systems, bottom and side walls of the heat exchanger and top surface of the PV were considered as coupled walls in the Fluent solver. For the evacuated system, the vacuum was modeled as air with low thermal conductivity of 1.0 × −18 W/m-K. Density and specific heat of the vacuum were also assumed to be constant at 1.225 kg/m3 and 1.0 × −5 J/kg-K [29]. These assumptions are necessary for the simulation to prevent natural conduction and heat conduction in the vacuum domain.

4. Results and Discussion

4.1. System Validation

To validate the CFD simulation, a similar PVT system was selected to validate conservation laws and solar load in this modeling. Hudisteanu et al. [35] conducted a CFD simulation on the air-cooling of photovoltaic panels for building integration. They used ANSYS Fluent solver with K-ε RNG turbulence modeling, and specified turbulence intensity and hydraulic diameter, and solar irradiance of 500 W/m2. In the case of the flat heat sink, they reported an average temperature of 55.5 °C and a maximum temperature of 59 °C. This system was simulated with the same geometry and setup configurations, and values obtained for these parameters were 55.08 °C and 58.65 °C, respectively. The relative difference is less than 1%, which shows the high fidelity of the work.

4.2. Domestic Hot Water Production by Solar Heat

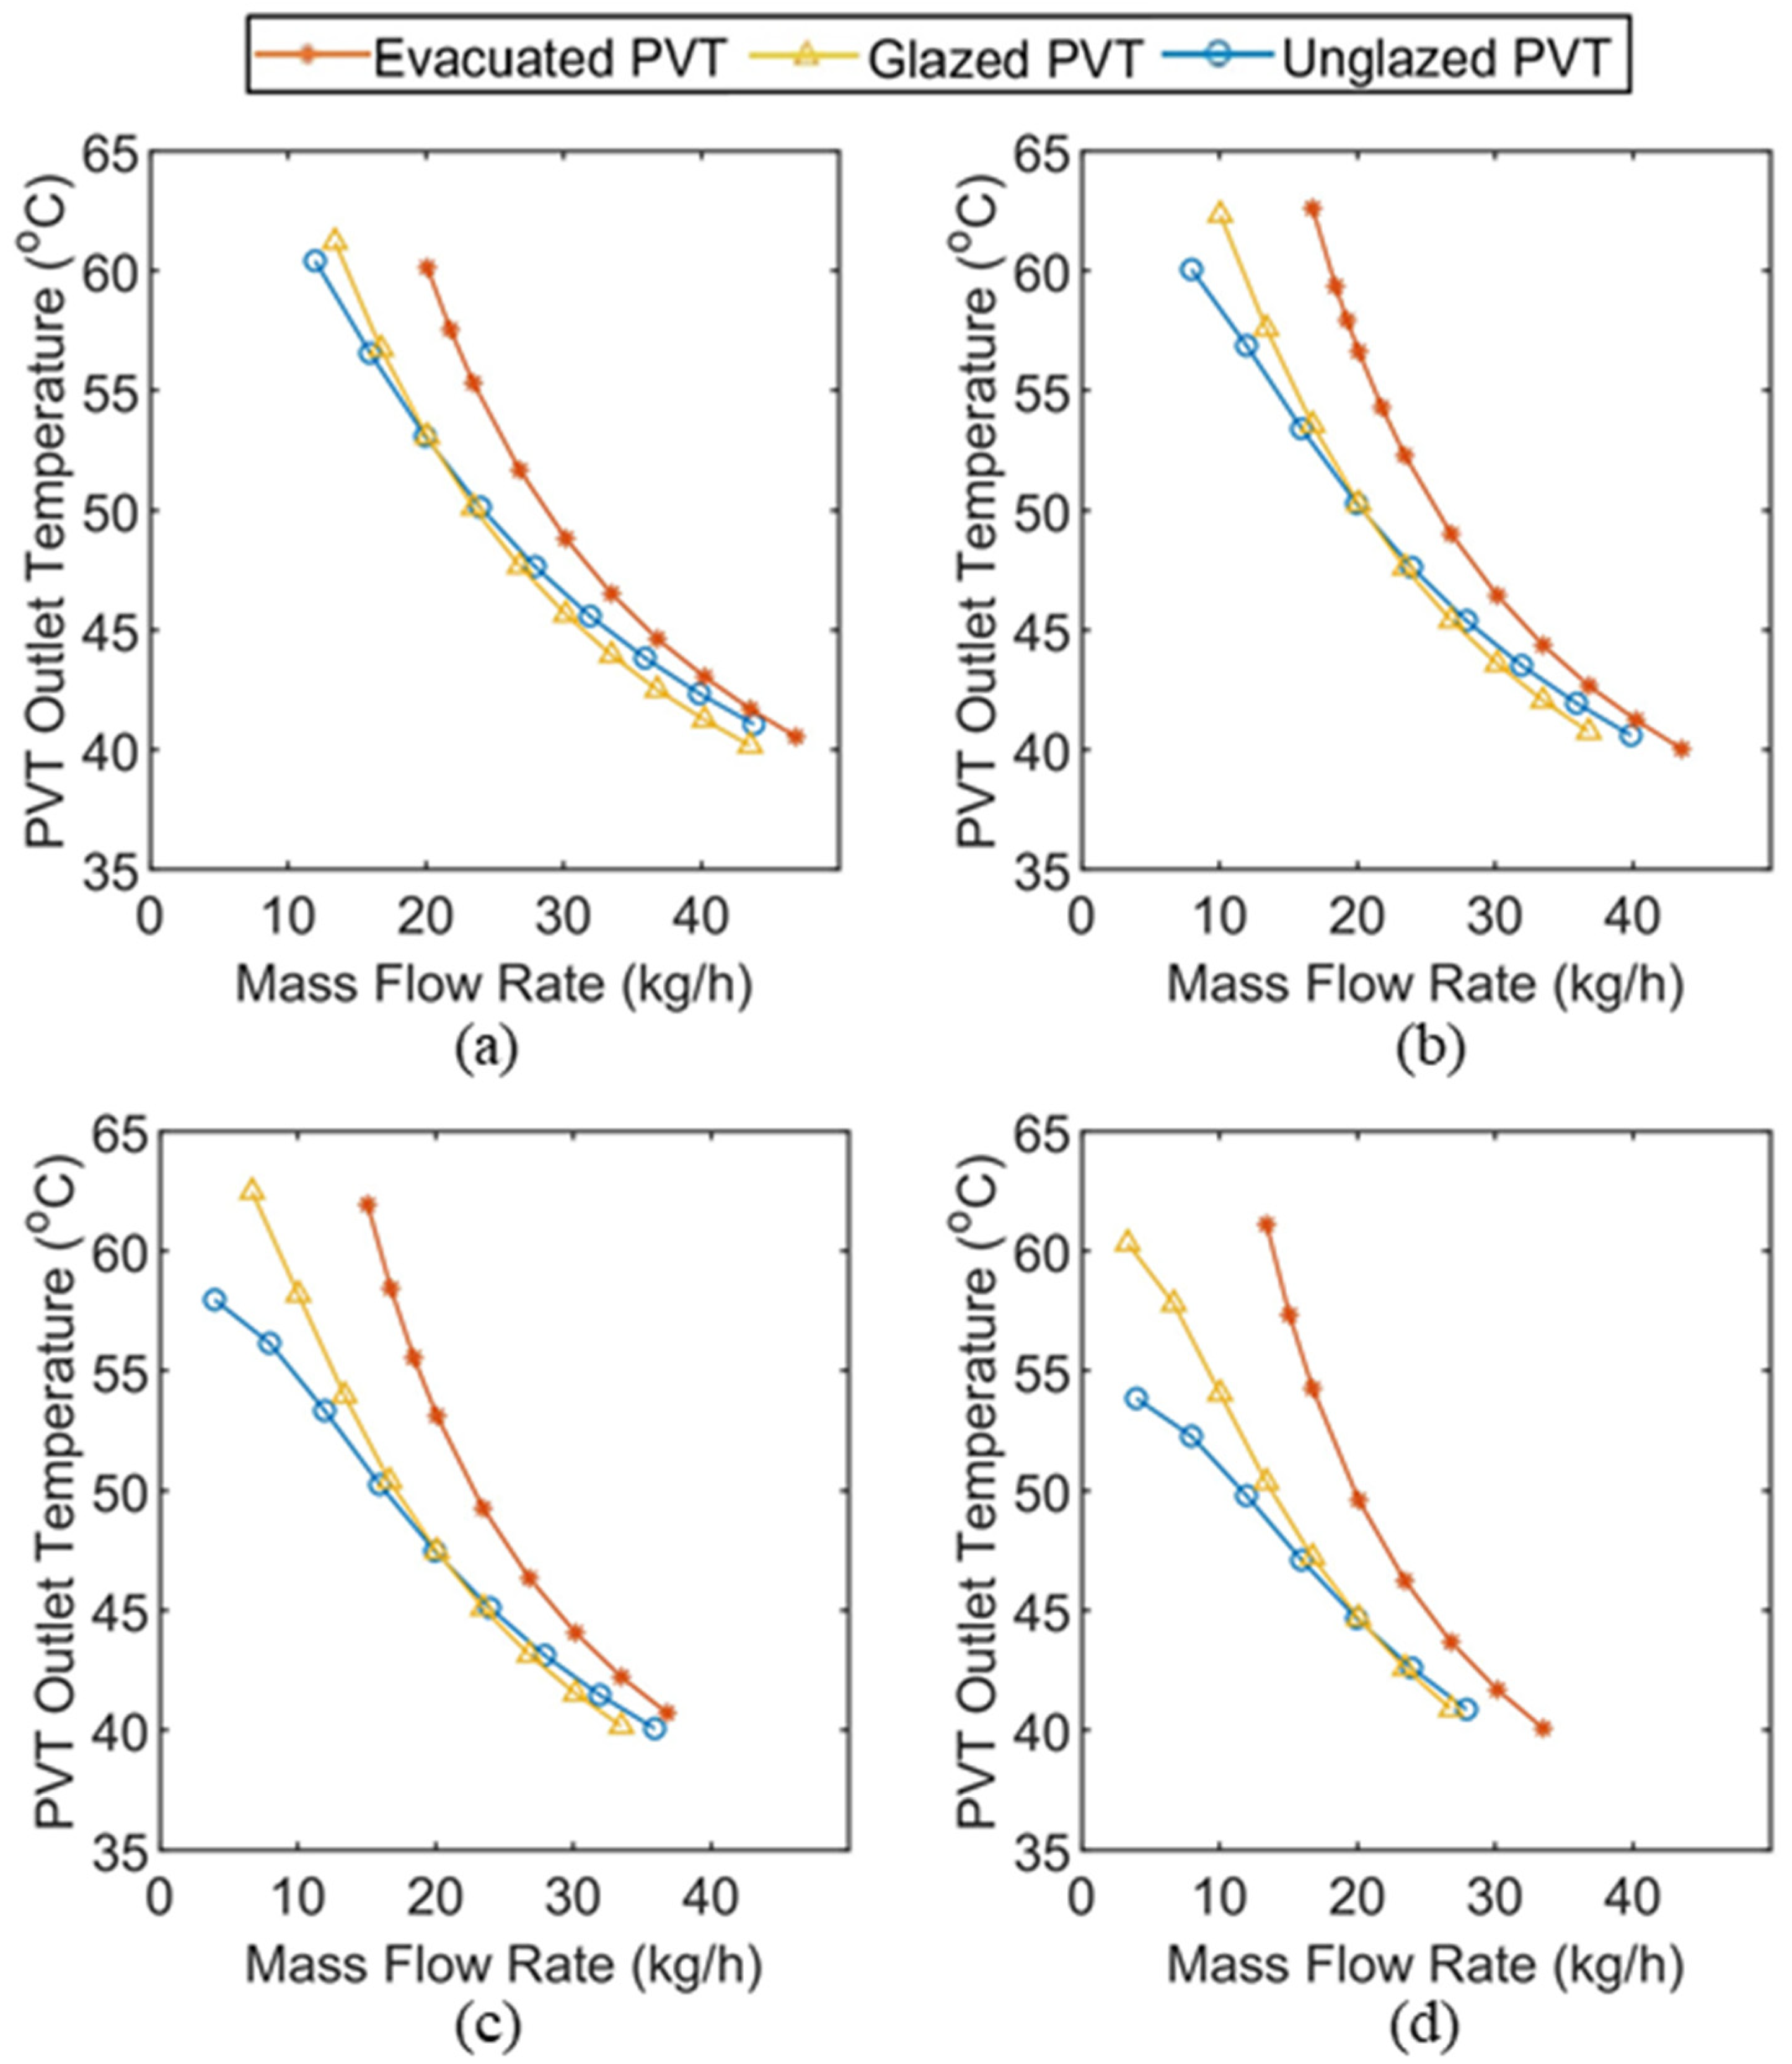
4.2.1. Parametric System Analysis

In this section, different PVT systems are simulated to increase inlet water temperature from 25 °C by absorbing solar heat. Evacuated PVT, glazed PVT, and unglazed PVT systems are compared at different mass flow rates and solar irradiance. Figure 4 shows hot water production per unit area of the PV with these three systems. The results show that the evacuated PVT system has the highest thermal performance. This system can supply the required domestic water temperature at all solar irradiances and deliver up to 3.26 times more hot water than unglazed PVT. The glazed PVT can also deliver the required temperature; however, it has higher thermal losses than the evacuated system, so it must operate at lower mass flow rates. The unglazed system displayed poor performance at higher outlet temperatures. The hot water production of the unglazed system decreases significantly at higher outlet temperature and lower solar irradiance as it approaches its stagnation temperature. However, at lower outlet temperatures the unglazed system has acceptable thermal performance, especially with higher solar irradiance. At an outlet temperature of 40 °C and solar irradiance of 1000 W/m2, the hot water production of the unglazed system advances towards the evacuated system. However, lower water outlet temperature may not satisfy comfort and hygiene purposes. In these cases, the PVT system is preheating the water by increasing temperature to 40–50 °C. The unglazed system is suitable for preheating the water, especially at lower solar irradiance as this system is unable to produce the required outlet temperature at 700 W/m2. The glazed PVT showed better performance than the unglazed system at higher outlet temperatures, but it was not advantageous at higher mass flow rates.

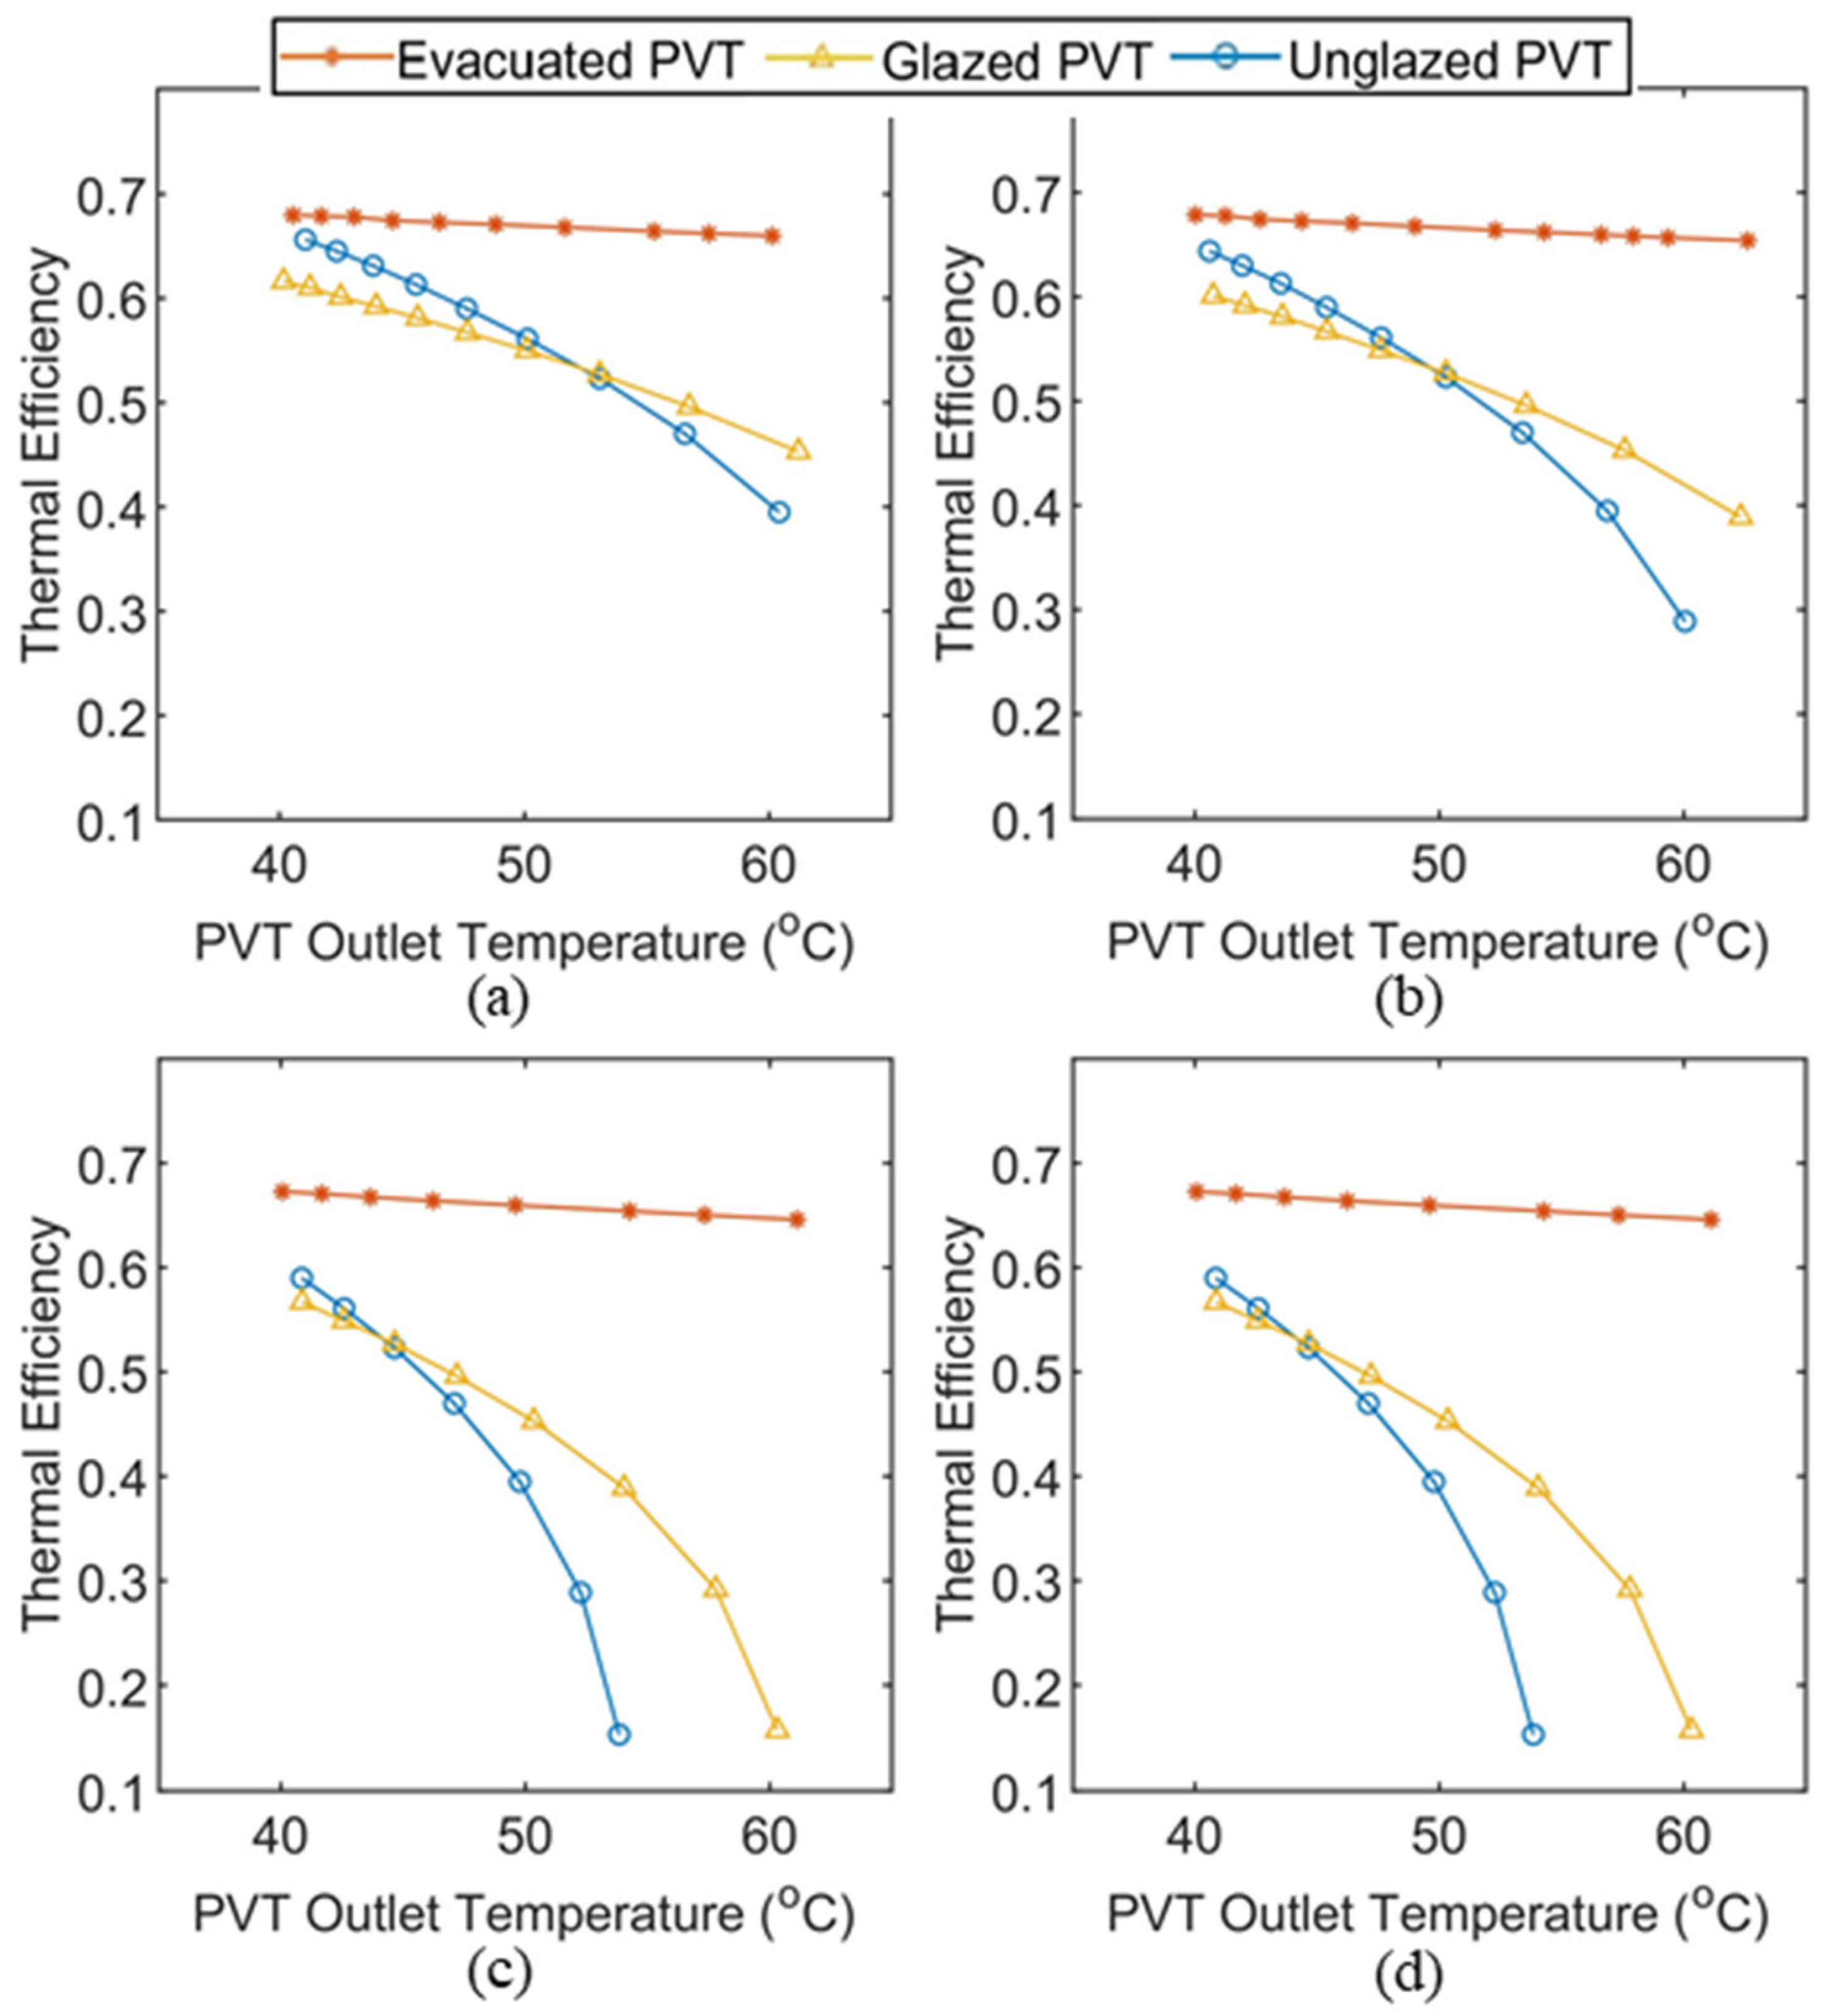
4.2.2. Thermal Efficiency Variations

The thermal efficiency variations with different operating temperatures are evaluated for all three systems as shown in Figure 5. The evacuated PVT system has the highest thermal efficiency, as expected. The thermal efficiency of this system is less sensitive to solar irradiance and water temperature. These characteristics make the evacuated PVT the best choice for higher water temperature demands and regions with lower solar irradiance. The thermal performance of the unglazed system is more sensitive to solar irradiance. At a solar irradiance of 700 W/m2, the unglazed PVT shows 7–37% lower thermal efficiency than 1000 W/m2. The thermal behavior of the glazed PVT is similar to the unglazed system. At higher outlet temperatures it shows slightly higher thermal efficiency than the unglazed system but much lower than the evacuated PVT. At lower outlet temperatures, the glazed PVT has the lowest thermal efficiency among these systems. The glazed system is not taking advantage of the low thermal conductivity of the evacuated system while it has more optical losses compared to the unglazed model.

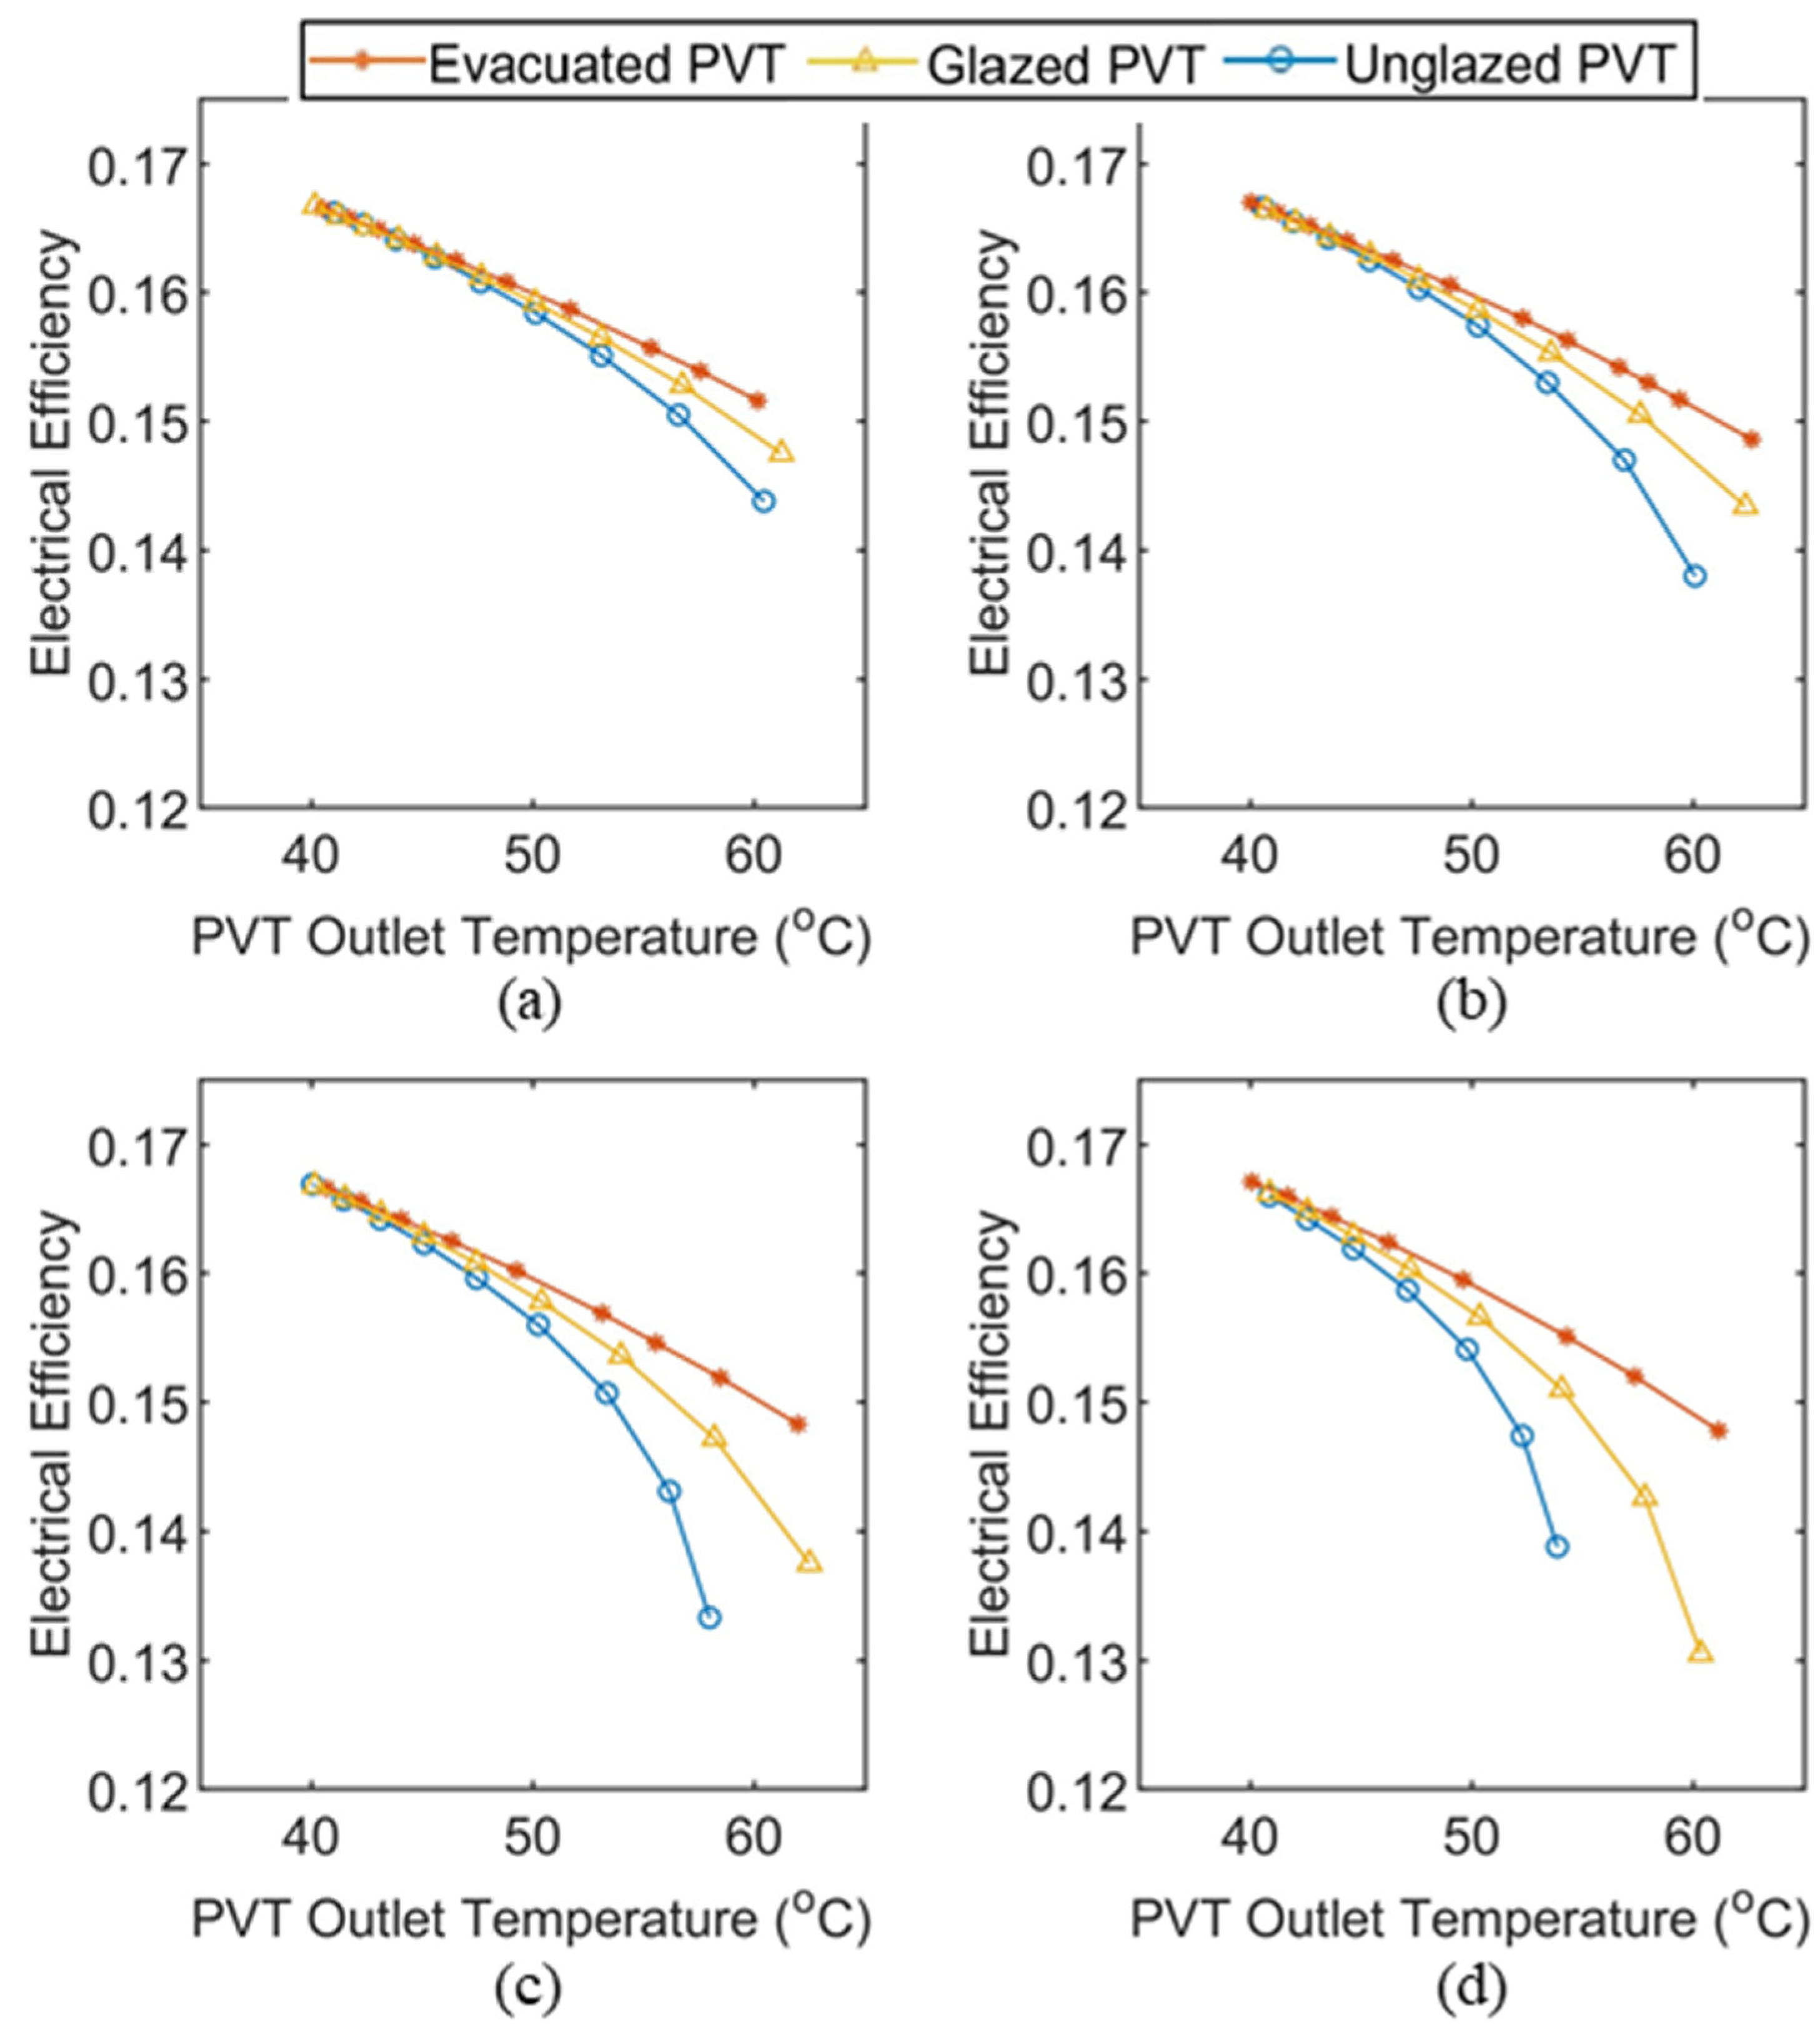
4.2.3. Electrical Efficiency Variations

Figure 6 shows the electrical efficiency of the PVT systems at different outlet temperatures and solar irradiances. The results show that the electrical efficiency of all systems decreases at higher outlet temperatures because of an increase in the surface temperature of the PV.
In conventional PV systems, the electrical efficiency of the panels often decreases with an increase in solar irradiance. The reason for this phenomenon is that the surface temperature of the PV increases at higher irradiances. However, the results showed that the electrical efficiency of PVT systems increased with solar irradiance. At higher solar irradiance, the mass flow rate of the water is higher, leading to a higher rate of heat removal from the PV. As a result, for the same outlet temperature, the surface temperature of the PV is surprisingly lower at higher solar irradiances, leading to higher electrical efficiency. Another interesting point is that one may think encapsulating the PVT system in an evacuated tube leads to a higher surface temperature of PV and lower electrical efficiency. However, at higher outlet water temperature, the evacuated PVT system has the highest electrical efficiency. The reason for this phenomenon is that this system works with higher mass flow rates (as it has higher thermal efficiency), which leads to higher heat removal from the bottom of the PV. This higher heat removal is compensating for the low convective cooling from the top surface. It should be noted that all three systems have almost the same electrical efficiency at lower outlet temperatures, as they are working with almost the same mass flow rates.

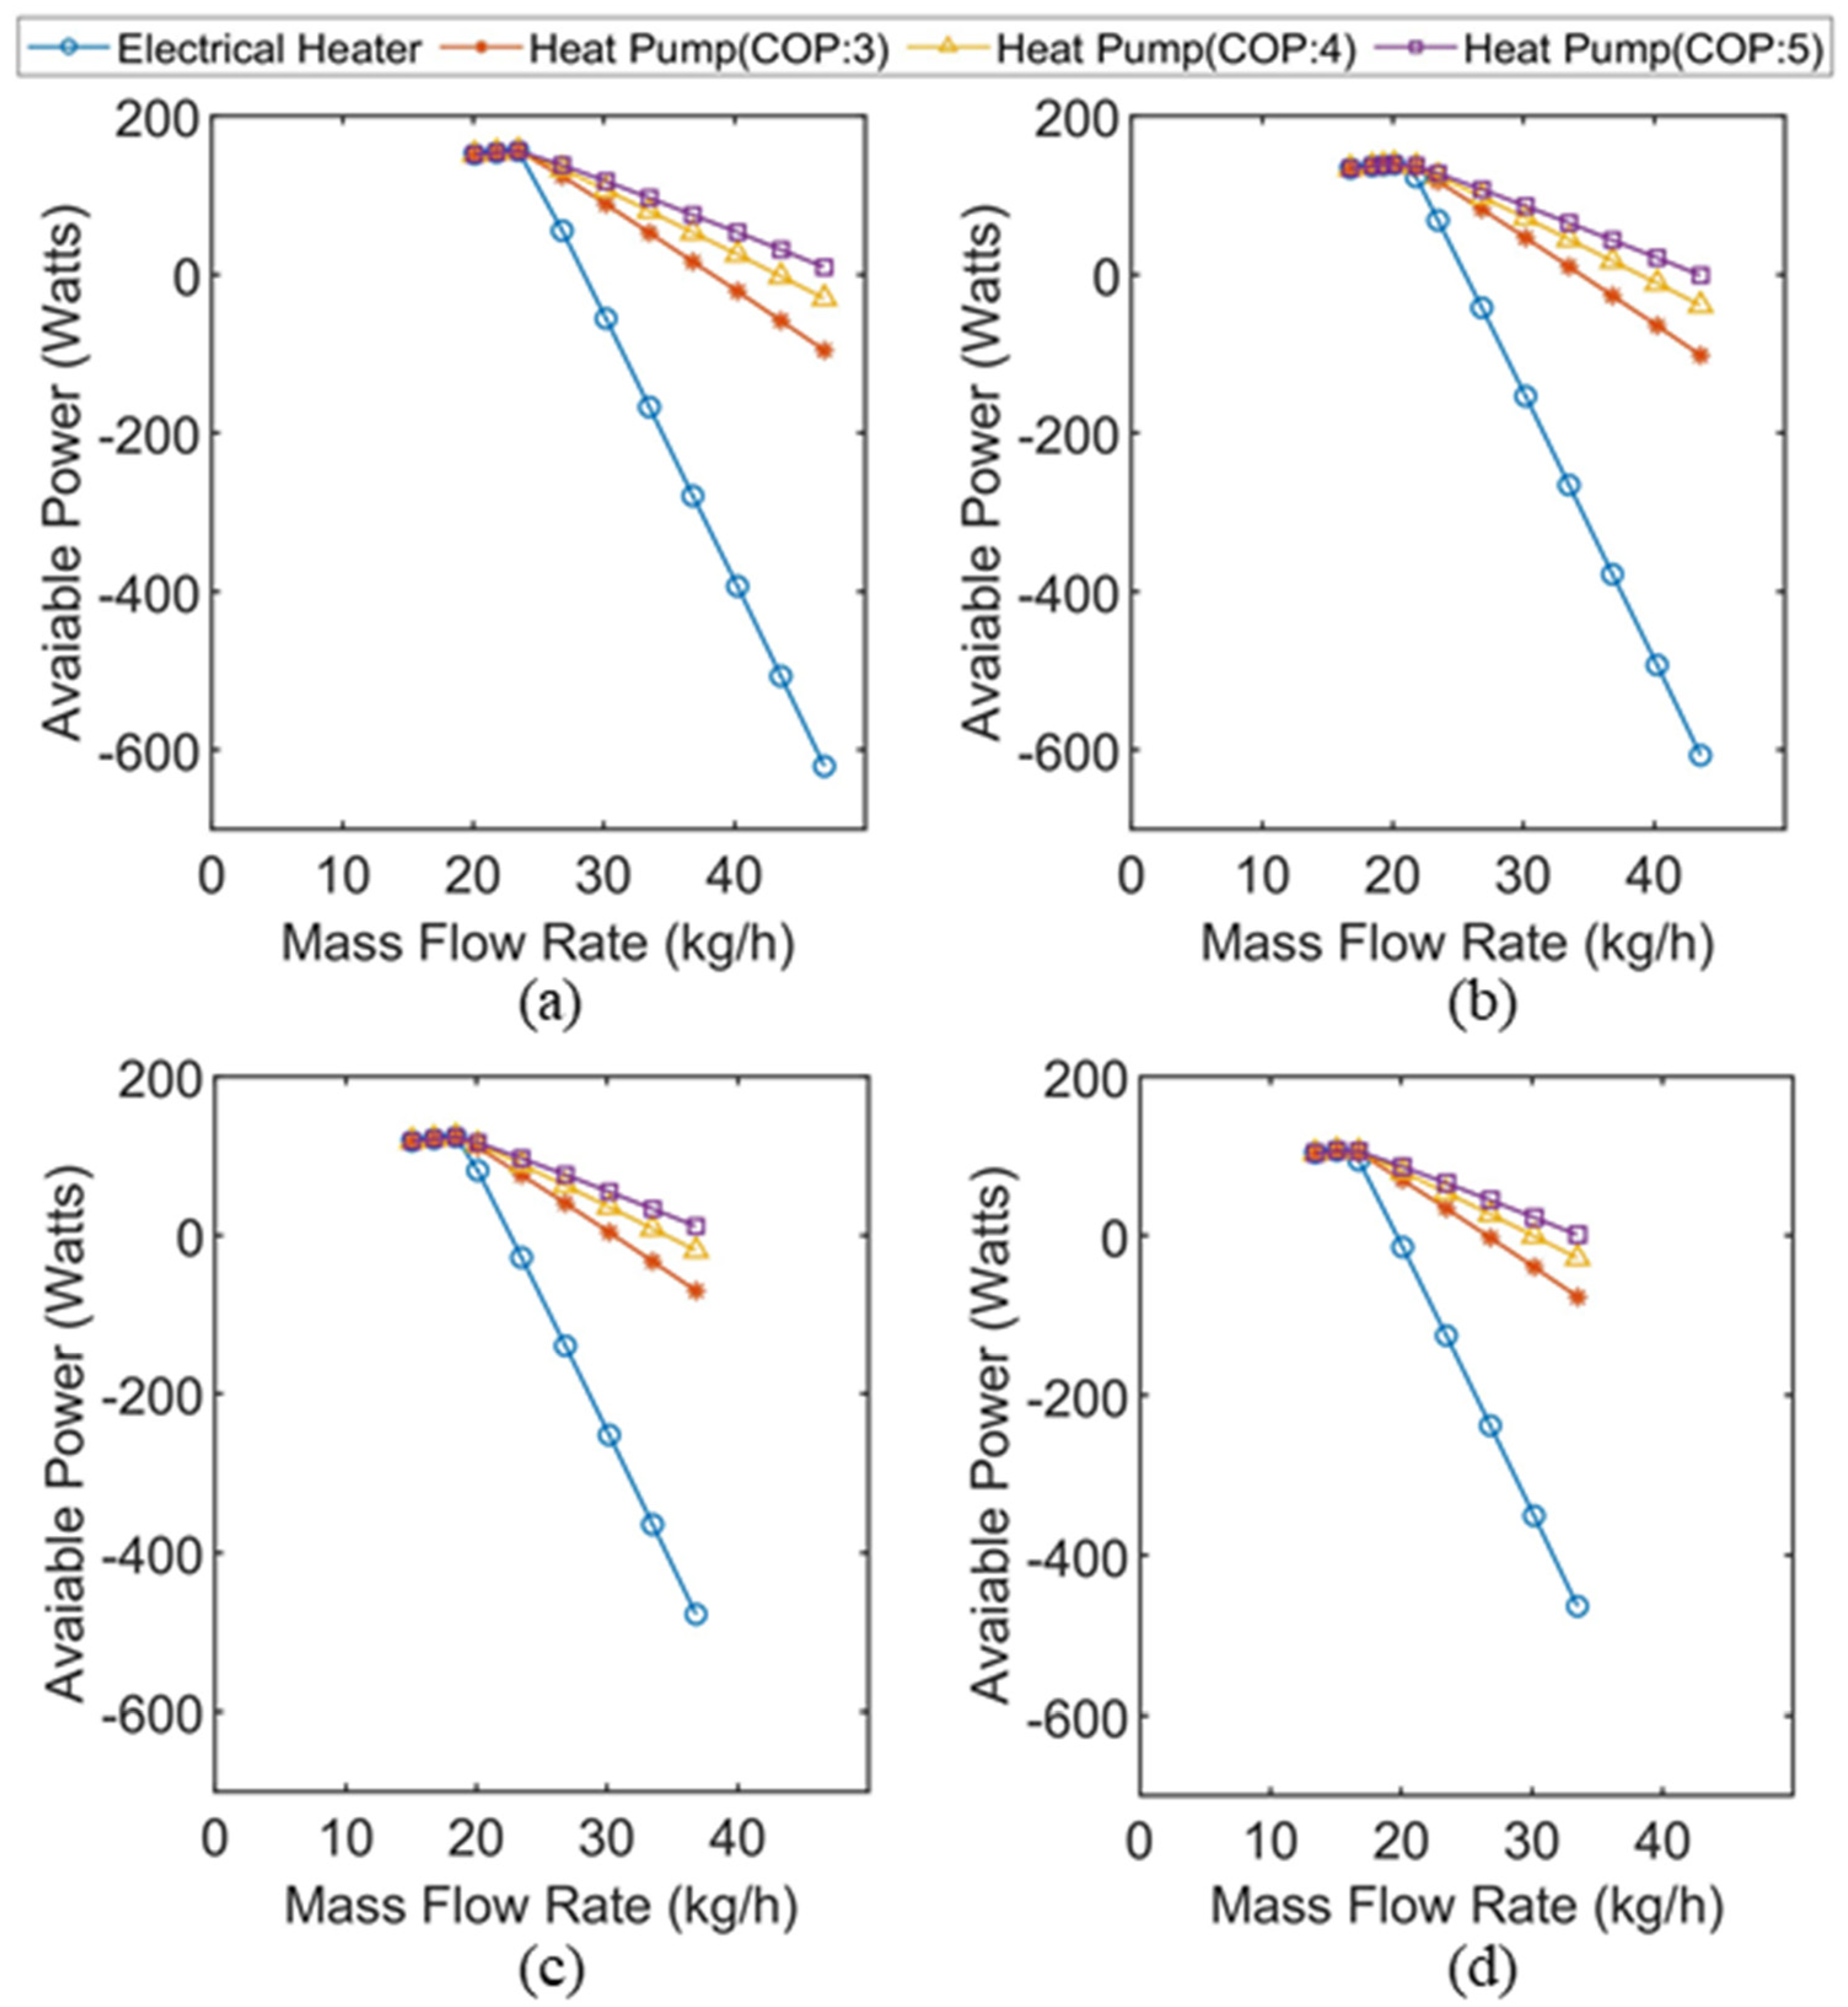
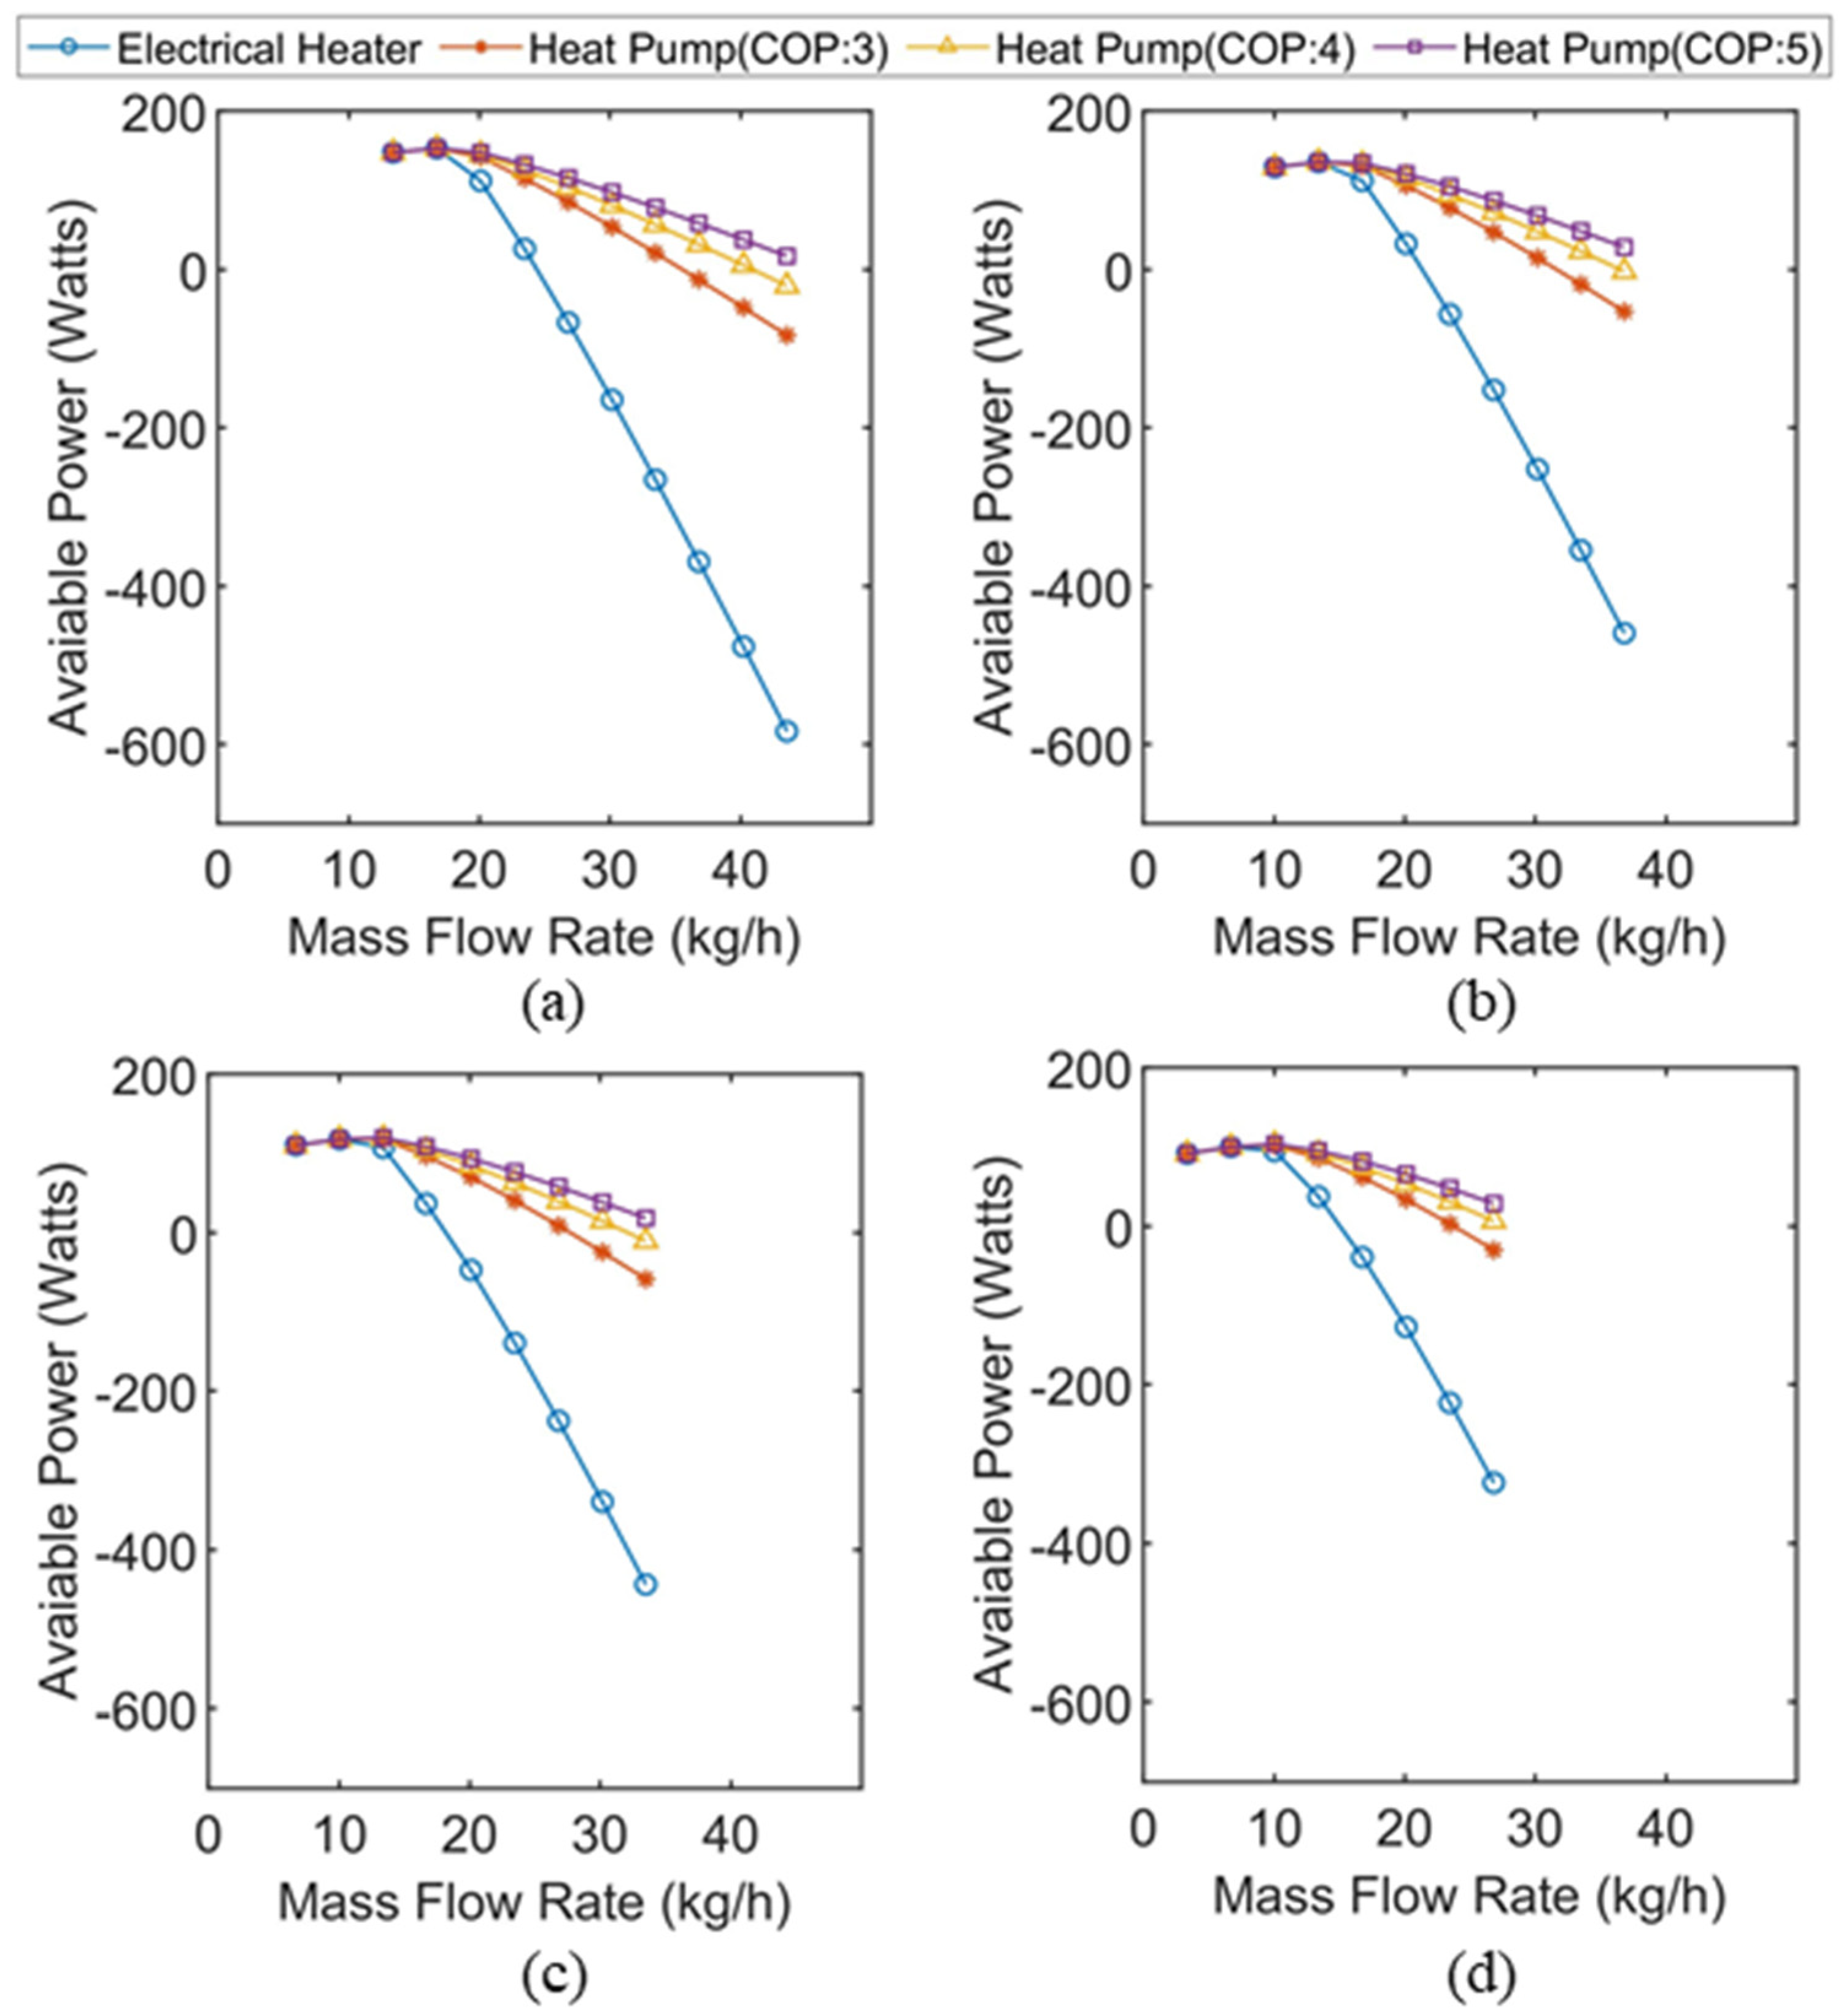
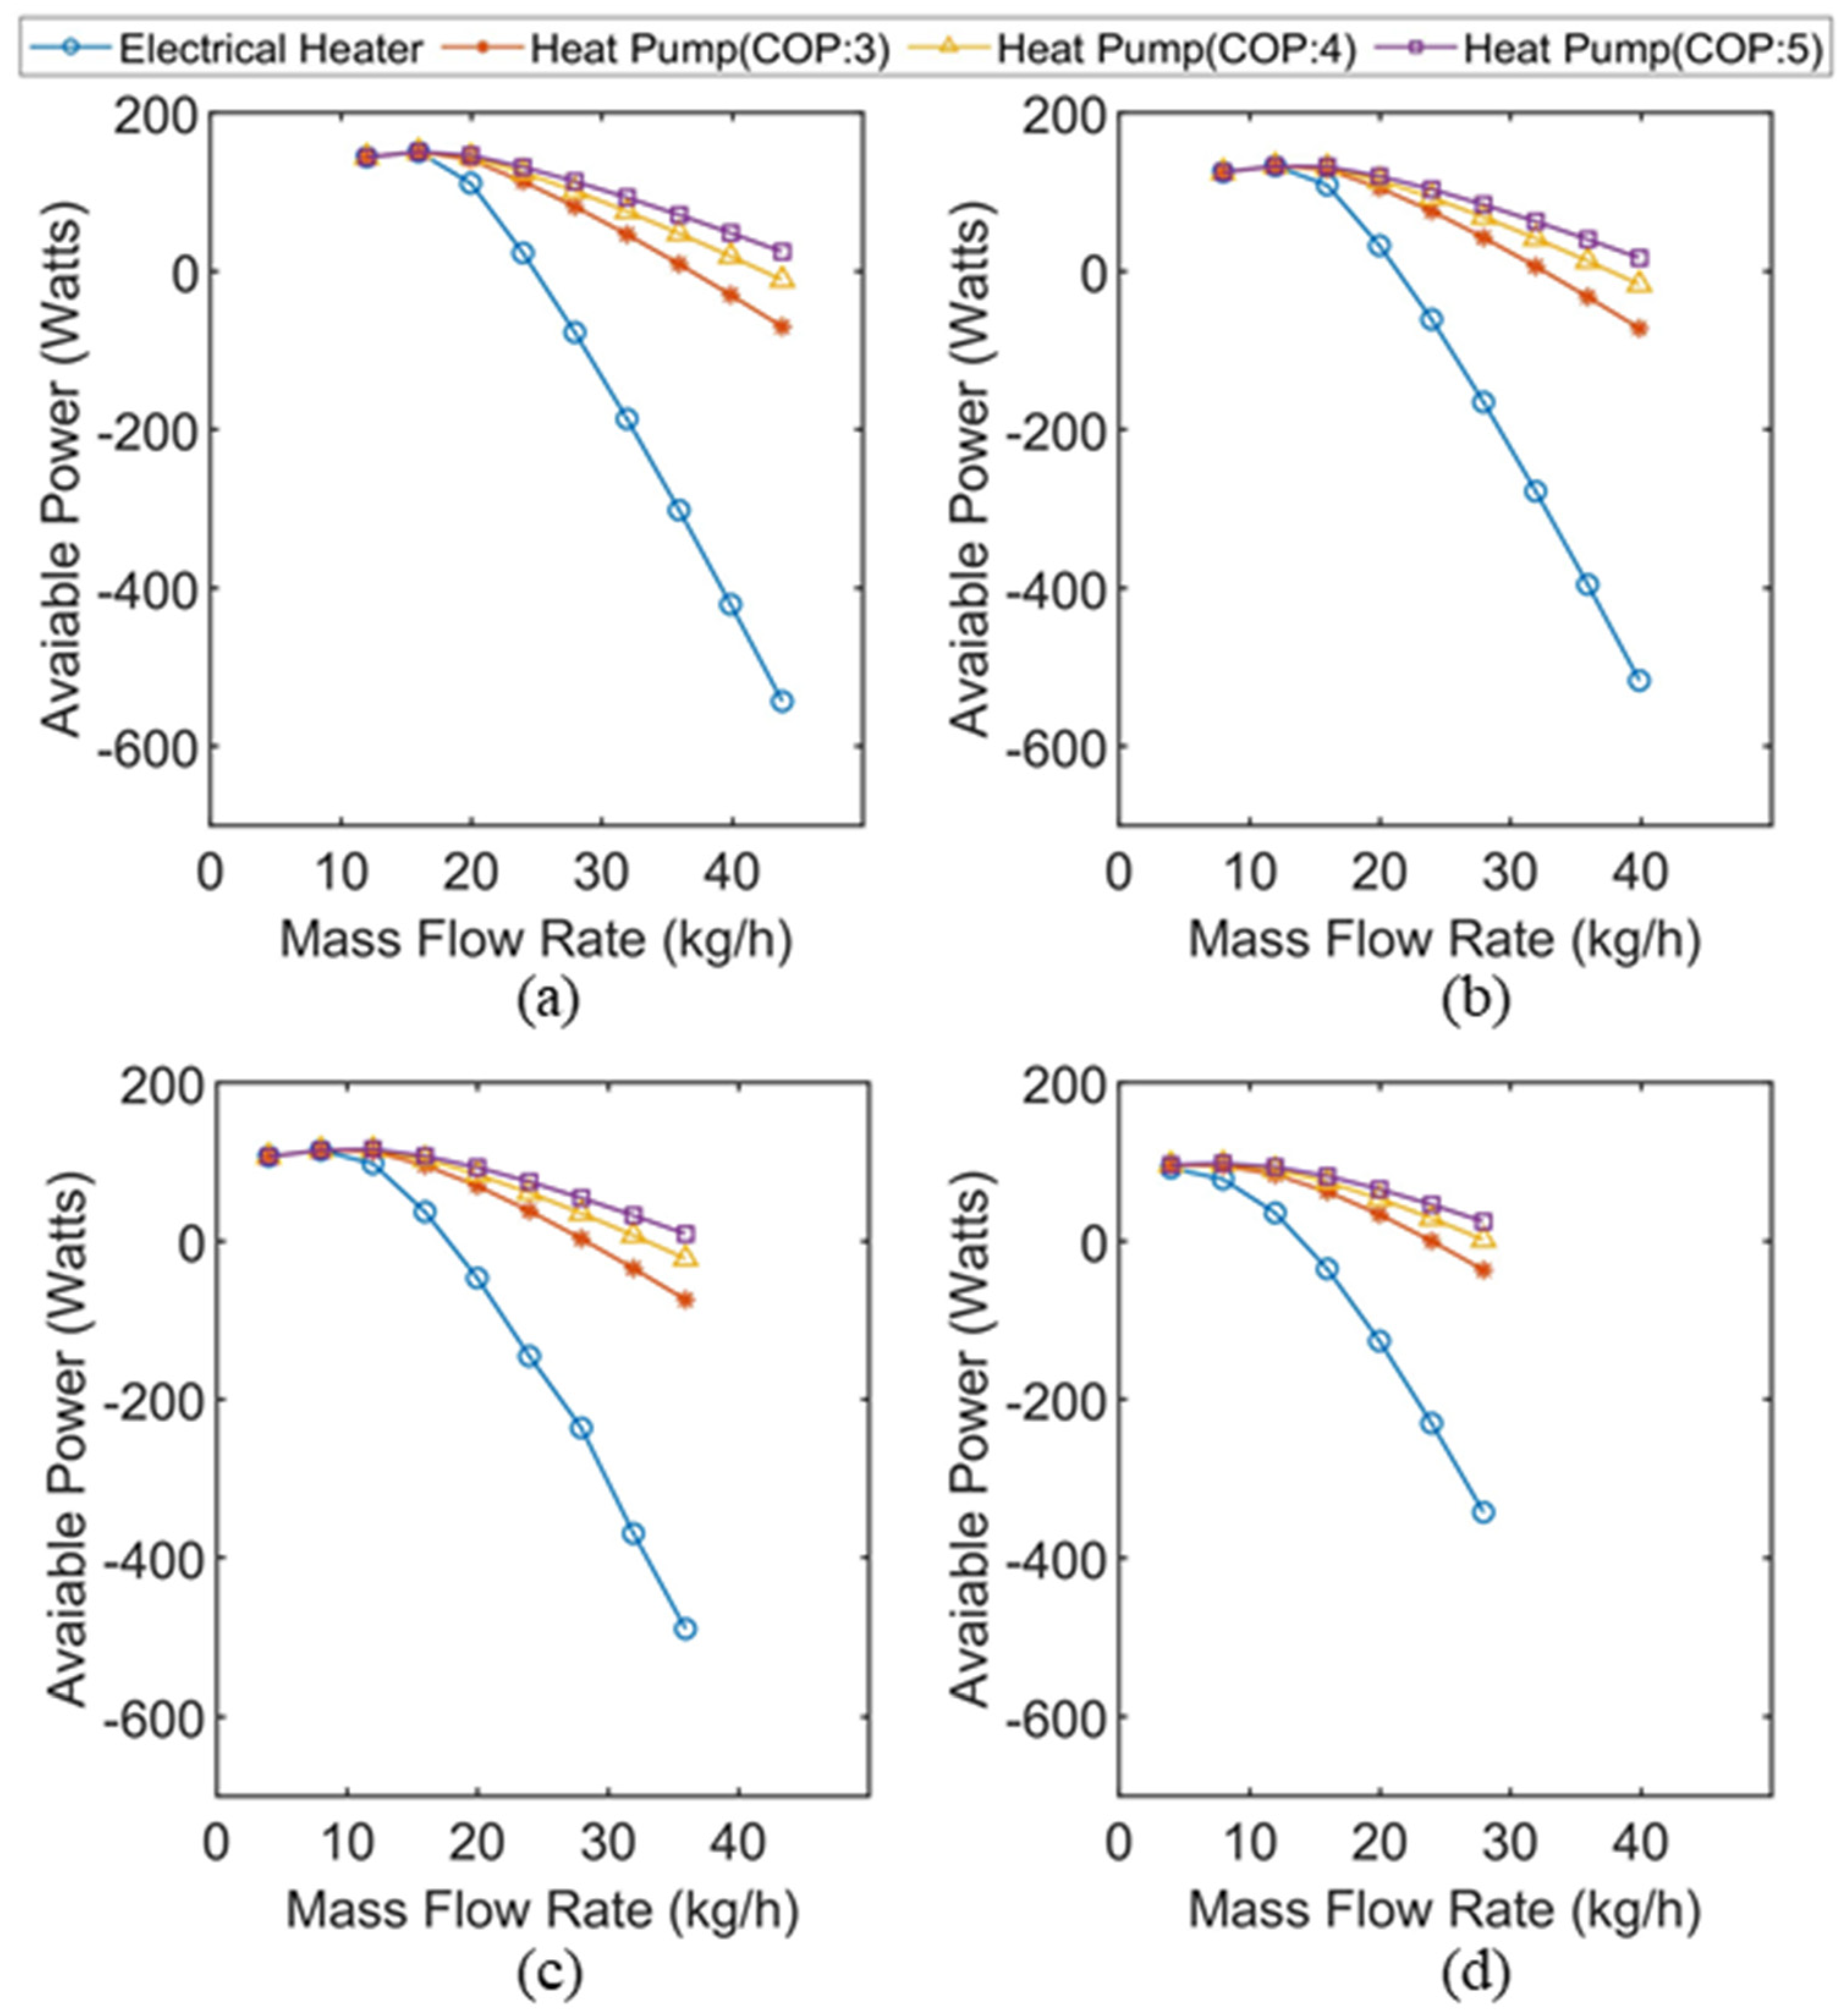
4.3. Electricity Production and Further Increase of Water Temperature by Electricity

As it is shown in Figure 4, despite having higher thermal efficiency at higher mass flow rates, PVT systems cannot reach the required temperature for hygiene and comfort purposes. In these cases, two options have been considered to further increase the water temperature by utilizing the generated electricity. The electrical heaters and heat pumps can warm up the water to the desired temperature by converting electricity to heat. The efficiency of electricity conversion to heat can be considered 100%, but the heat pump can produce 3–5 times the amount of heat as it has a positive COP. When the outlet temperature of the PVT system is 55 °C or above, the backup system will not be heating the water, and the generated electricity will be utilized for other purposes or delivered to the grid. However, at lower temperatures, the electrical heater or heat pump is used to supply the water temperature of 55 °C. The performance of the heater and heat pump with different COPs are compared in Figure 7, Figure 8 and Figure 9. These figures show available power versus mass flow rate of water. Available power is the surplus electricity available after heating or required additional electricity from the grid (negative values) at different mass flow rates. These calculations are based on the unit area (m2) of the PV.
In Figure 7, Figure 8 and Figure 9, positive values for the available power show the remaining electricity after heating the water. In certain cases, additional electricity is required from the grid to increase the water temperature to 55 °C, denoted with negative values. In all cases, the electricity demand increases with the mass flow rate as the quantity increases.
The highest extra electricity demands are related to the unglazed system equipped with an electrical heater at lower solar irradiance and higher mass flow rates. At higher mass flow rates, all PVT systems equipped with an electrical heater require a large portion of additional electricity from the grid to heat the water. However, integrating a heat pump can dramatically decrease the electricity consumption of the system. The performance of the auxiliary heating system depends on the COP of the heat pump, as the system with a COP of 5 does not require additional electricity. PVT systems equipped with a heat pump COP of 5 can reduce electricity consumption up to 670 W more than the electrical heater, 112.26 W more than a heat pump with a COP of 3, and 42.5 W more than a heat pump with a COP of 4. Additionally, the effect of the high-performance evacuated PVT on the electricity consumption of the auxiliary system should be highlighted. At a specific mass flow rate and solar irradiance, the evacuated PVT system delivers the highest outlet temperature compared to the other systems. Accordingly, an evacuated PVT system requires less electricity to meet hot water demands and requirements. At a solar irradiance of 700 W/m2 and mass flow rate of 20 kg/h, the evacuated PVT system equipped with an electrical heater uses 88.6% less electricity than the unglazed model equipped with an electrical heater. However, at higher mass flow rates and solar irradiances, the difference is reduced as the thermal performance of the unglazed system increases.

5. Conclusions

Three different PVT systems are compared to evaluate the performance of each one at different solar irradiances and mass flow rates. These systems were also equipped with an electrical heater, and heat pumps with a COP of 3, 4, and 5. At higher mass flow rates, all the systems display high thermal and electrical efficiencies. The thermal and electrical performance of PVT systems also depend on solar irradiance, and an increase in both efficiencies was apparent with an increase in solar intensity. Some major findings of the paper are listed as below:
  • The evacuated PVT system showed the highest thermal performance and flexibility compared to the other systems. This system can reach the thermal efficiency of 64–67% at different solar irradiances and water mass flow rates for DHW supply.
  • Interestingly, encapsulating the PVT system did not decrease the electrical efficiency of the system. The evacuated PVT can operate at higher mass flow rates of water, which leads to higher heat removal from the bottom of the PV. The electrical efficiency of the evacuated PVT was measured between 14.2–16.7%.
  • The unglazed system showed poor performance at higher outlet water temperature or low solar irradiance. However, this system has a good performance at higher mass flow rates (i.e., lower outlet water temperature), which makes this system a good choice for preheating water. At a solar irradiance of 800 W/m2, the unglazed system can reach to an outlet temperature of 40.06 °C with a thermal efficiency of 63.10%, while at an outlet temperature of 56.16 °C, the thermal efficiency is only 28.98%.
  • The glazed system has slightly better performance than the unglazed system only at higher outlet water temperatures, but much lower than the evacuated system. At lower outlet temperatures, it showed the lowest thermal performance. In general, this system does not have a significant advantage over the unglazed system.
  • The application of heat pumps can significantly decrease the dependency of the backup system on the electrical grid. Coupling a high-performance PVT system with a heat pump is a promising idea for sustainable DHW production. The heat pump with COP of 5 coupled with an evacuated PVT system could supply the required water temperature with minimum dependency on the grid. This combination can reduce the required external power up to 620 W/m2.
This study provided a steady-state analysis to develop a new PVT concept for sustainable hot water supply. The unglazed PVT system showed high thermal and electrical performance at all solar irradiances. However, for better evaluation of the system, a transient simulation considering solar irradiance fluctuations during the day seems to be necessary. Additionally, economic analysis can give insight into the feasibility of the project. These topics can be considered for further research and development.

Author Contributions

Conceptualization, G.M. and B.R.; methodology, B.R. and G.M.; software, B.R. and L.R.P.; validation, B.R.; formal analysis, B.R. and L.R.P.; investigation, B.R. and L.R.P.; resources, B.R. and L.R.P.; data curation, B.R. and L.R.P.; writing—original draft preparation, B.R.; writing—review and editing, B.R., L.R.P. and G.M.; visualization, L.R.P. and B.R.; supervision, G.M.; project administration, G.M. and B.R.; funding acquisition, G.M. All authors have read and agreed to the published version of the manuscript.

Funding

This research received no external funding.

Institutional Review Board Statement

Not applicable.

Informed Consent Statement

Not applicable.

Data Availability Statement

Not applicable.

Conflicts of Interest

The authors declare no conflict of interest.

Nomenclature

aambient
Aarea (m2)
cspecific heat (J/kg.K)
convconvection
COPcoefficient of performance
Dhydraulic diameter (m)
eelectrical
Eenergy (kJ)
EHelectrical heater
ggravity (m/s2)
henthalpy (kJ/kg)
HPheat pump
Isolar irradiance (W/m2)
kthermal conductivity (W/m.K)
mmean
NuNusselt number
ppressure (kPa)
Qheat (kJ)
radradiation
ReReynolds number
refreferences
Ttemperature (K)
u, v, wvelocity in x, y, z (m/s)
x, y, zspatial coordinates
αabsorptivity
βthermal coefficient (K−1)
εemissivity
τtransmissivity
ηefficiency
ρ density (kg/m3)
µviscosity (N.s/m2)
σStephan–Boltzmann constant (W/m2.K4)

References

  1. BP p.l.c. Statistical Review of World Energy 2021, Bp. 2021. Available online: https://www.bp.com/en/global/corporate/energy-economics/statistical-review-of-world-energy.html (accessed on 25 January 2022).
  2. DNV. The Impact of Covid-19 on the Energy Transition. 2020. Available online: www.dnv.com (accessed on 25 January 2022).
  3. BP p.l.c. Statistical Review of World Energy 2019, Bp. 2019. Available online: https://www.bp.com/en/global/corporate/news-and-insights/press-releases/bp-statistical-review-of-world-energy-2019.html (accessed on 25 January 2022).
  4. Zouaoui, A.; Zili-Ghedira, L.; Nasrallah, S.B. Open solid desiccant cooling air systems: A review and comparative study. Renew. Sustain. Energy Rev. 2016, 54, 889–917. [Google Scholar] [CrossRef]
  5. el Hourani, M.; Ghali, K.; Ghaddar, N. Effective desiccant dehumidification system with two-stage evaporative cooling for hot and humid climates. Energy Build. 2014, 68, 329–338. [Google Scholar] [CrossRef]
  6. Pomianowski, M.Z.; Johra, H.; Marszal-Pomianowska, A.; Zhang, C. Sustainable and energy-efficient domestic hot water systems: A review. Renew. Sustain. Energy Rev. 2020, 128, 109900. [Google Scholar] [CrossRef]
  7. Köfinger, M.; Basciotti, D.; Schmidt, R.R.; Meissner, E.; Doczekal, C.; Giovannini, A. Low temperature district heating in Austria: Energetic, ecologic and economic comparison of four case studies. Energy 2016, 110, 95–104. [Google Scholar] [CrossRef]
  8. An, J.; Yan, D.; Deng, G.; Yu, R. Survey and performance analysis of centralized domestic hot water system in China. Energy Build. 2016, 133, 321–334. [Google Scholar] [CrossRef]
  9. Boait, P.J.; Dixon, D.; Fan, D.; Stafford, A. Production efficiency of hot water for domestic use. Energy Build. 2012, 54, 160–168. [Google Scholar] [CrossRef]
  10. Biaou, A.L.; Bernier, M.A. Achieving total domestic hot water production with renewable energy. Build. Environ. 2008, 43, 651–660. [Google Scholar] [CrossRef]
  11. Rommel, M.; Zenhäusern, D.; Baggenstos, A.; Türk, O.; Brunold, S. Application of unglazed PVT collectors for domestic hot water pre-heating in a development and testing system. Energy Procedia 2014, 48, 638–644. [Google Scholar] [CrossRef] [Green Version]
  12. Gunerhan, H.; Hepbasli, A. Exergetic modeling and performance evaluation of solar water heating systems for building applications. Energy Build. 2007, 39, 509–516. [Google Scholar] [CrossRef]
  13. Martorana, F.; Bonomolo, M.; Leone, G.; Monteleone, F.; Zizzo, G.; Beccali, M. Solar-assisted heat pumps systems for domestic hot water production in small energy communities. Sol. Energy 2021, 217, 113–133. [Google Scholar] [CrossRef]
  14. Huang, B.J.; Lee, C.P. Performance evaluation method of solar-assisted heat pump water heater. Appl. Therm. Eng. 2007, 27, 568–575. [Google Scholar] [CrossRef]
  15. Dannemand, M.; Perers, B.; Furbo, S. Performance of a demonstration solar PVT assisted heat pump system with cold buffer storage and domestic hot water storage tanks. Energy Build. 2019, 188–189, 46–57. [Google Scholar] [CrossRef]
  16. Douvi, E.; Pagkalos, C.; Dogkas, G.; Koukou, M.K.; Stathopoulos, V.N.; Caouris, Y.; Vrachopoulos, M.G. Phase change materials in solar domestic hot water systems: A review. Int. J. Thermofluids 2021, 10, 100075. [Google Scholar] [CrossRef]
  17. Joshi, S.S.; Dhoble, A.S. Photovoltaic -Thermal systems (PVT): Technology review and future trends. Renew. Sustain. Energy Rev. 2018, 92, 848–882. [Google Scholar] [CrossRef]
  18. Hamzat, A.K.; Sahin, A.Z.; Omisanya, M.I.; Alhems, L.M. Advances in PV and PVT cooling technologies: A review. Sustain. Energy Technol. Assess. 2020, 47, 101360. [Google Scholar] [CrossRef]
  19. Emmanuel, B.; Yuan, Y.; Maxime, B.; Gaudence, N.; Zhou, J. A review on the influence of the components on the performance of PVT modules. Sol. Energy 2021, 226, 365–388. [Google Scholar] [CrossRef]
  20. Dupeyrat, P.; Ménézo, C.; Fortuin, S. Study of the thermal and electrical performances of PVT solar hot water system. Energy Build. 2014, 68, 751–755. [Google Scholar] [CrossRef]
  21. Yuan, Y.; Ouyang, L.; Sun, L.; Cao, X.; Xiang, B.; Zhang, X. Effect of connection mode and mass flux on the energy output of a PVT hot water system. Sol. Energy 2017, 158, 285–294. [Google Scholar] [CrossRef]
  22. Nasrin, R.; Rahim, N.A.; Fayaz, H.; Hasanuzzaman, M. Water/MWCNT nanofluid based cooling system of PVT: Experimental and numerical research. Renew. Energy 2018, 121, 286–300. [Google Scholar] [CrossRef]
  23. Carmona, M.; Bastos, A.P.; García, J.D. Experimental evaluation of a hybrid photovoltaic and thermal solar energy collector with integrated phase change material (PVT-PCM) in comparison with a traditional photovoltaic (PV) module. Renew. Energy 2021, 172, 680–696. [Google Scholar] [CrossRef]
  24. Brottier, L.; Bennacer, R. Thermal performance analysis of 28 PVT solar domestic hot water installations in Western Europe. Renew. Energy 2020, 160, 196–210. [Google Scholar] [CrossRef]
  25. Evacuated Tube Collector. Available online: https://www.alternative-energy-tutorials.com (accessed on 25 January 2022).
  26. Duan, J. A novel heat sink for cooling concentrator photovoltaic system using PCM-porous system. Appl. Therm. Eng. 2021, 186, 116522. [Google Scholar] [CrossRef]
  27. Rodríguez-Hidalgo, M.C.; Rodríguez-Aumente, P.A.; Lecuona, A.; Legrand, M.; Ventas, R. Domestic hot water consumption vs. solar thermal energy storage: The optimum size of the storage tank. Appl. Energy 2012, 97, 897–906. [Google Scholar] [CrossRef] [Green Version]
  28. Yang, L.W.; Xu, R.J.; Hua, N.; Xia, Y.; Zhou, W.B.; Yang, T.; Belyayev, Y.; Wang, H.S. Review of the advances in solar-assisted air source heat pumps for the domestic sector. Energy Convers. Manag. 2021, 247, 114710. [Google Scholar] [CrossRef]
  29. Pawar, V.R.; Sobhansarbandi, S. CFD modeling of a thermal energy storage based heat pipe evacuated tube solar collector. J. Energy Storage 2020, 30, 101528. [Google Scholar] [CrossRef]
  30. Santbergen, R. Optical Absorption Factor of Solar Cells for PVT Systems; Technische Universiteit Eindhoven: Eindhoven, The Netherlands, 2008; Volume 176. [Google Scholar] [CrossRef]
  31. Nasrin, R.; Hasanuzzaman, M.; Rahim, N.A. Effect of high irradiation and cooling on power, energy and performance of a PVT system. Renew. Energy 2018, 116, 552–569. [Google Scholar] [CrossRef]
  32. Kumar, A.V.; Arjunan, T.V.; Seenivasan, D.; Venkatramanan, R.; Vijayan, S. Thermal performance of an evacuated tube solar collector with inserted baffles for air heating applications. Sol. Energy 2021, 215, 131–143. [Google Scholar] [CrossRef]
  33. Rosli, M.A.M.; Sopian, K.; Mat, S.B.; Sulaiman, M.Y.; Salleh, E. Heat Removal Factor of an Unglazed Photovoltaic Thermal Collector with a Serpentine Tube; Springer: Cham, Switzerland, 2016. [Google Scholar]
  34. Dubey, S.; Sarvaiya, J.N.; Seshadri, B. Temperature dependent photovoltaic (PV) efficiency and its effect on PV production in the world—A review. Energy Procedia 2013, 33, 311–321. [Google Scholar] [CrossRef] [Green Version]
  35. Hudisteanu, S.; Mateescu, T.; Popovici, C.; Chereces, N.-C. Numerical study of air cooling photovoltaic panels using heat sinks. Rev. Romana Ing. Civ. 2015, 6, 11–21. [Google Scholar]
Figure 1. Different PVT systems evaluated in this paper: (a) Evacuated PVT and glazed PVT; (b) unglazed PVT.
Energies 15 02346 g001
Figure 2. Domestic hot water supply with PVT system equipped with an electrical backup.
Energies 15 02346 g002
Figure 3. Hexahedral mesh cross view for: (a) evacuated PVT and glazed PVT; (b) unglazed PVT.
Energies 15 02346 g003
Figure 4. Hot water production with different PVT systems at irradiance of: (a) 1000 W/m2; (b) 900 W/m2; (c) 800 W/m2; (d) 700 W/m2.
Energies 15 02346 g004
Figure 5. Thermal efficiency of different PVT systems versus outlet temperature at irradiance of: (a) 1000 W/m2; (b) 900 W/m2; (c) 800 W/m2; (d) 700 W/m2.
Energies 15 02346 g005
Figure 6. Electrical efficiency of different PVT systems versus outlet temperature at irradiance of: (a) 1000 W/m2; (b) 900 W/m2; (c) 800 W/m2; (d) 700 W/m2.
Energies 15 02346 g006
Figure 7. Available electrical power after delivering domestic hot water by different backup systems coupled with evacuated PVT system at irradiance of: (a) 1000 W/m2; (b) 900 W/m2; (c) 800 W/m2; (d) 700 W/m2.
Energies 15 02346 g007
Figure 8. Available electrical power after delivering domestic hot water by different backup systems coupled with glazed PVT system at irradiance of: (a) 1000 W/m2; (b) 900 W/m2; (c) 800 W/m2; (d) 700 W/m2.
Energies 15 02346 g008
Figure 9. Available electrical power after delivering domestic hot water by different backup systems coupled with unglazed PVT system at irradiance of: (a) 1000 W/m2; (b) 900 W/m2; (c) 800 W/m2; (d) 700 W/m2.
Energies 15 02346 g009
Table 1. Thermophysical characteristics of PV layers [26]. “This article was published in Elsevier, 186, Duan, J, A novel heat sink for cooling concentrator photovoltaic system using PCM-porous system, 116522, Copyright Elsevier (2021)”.
MaterialThickness (mm)Density (Kg/m3)Thermal Conductivity (W/m.K)Specific Heat (J/kg.K)
Glass3.030002500
EVA0.59600.352070
Cell0.22330148677
Tedlar0.312000.21250
Table 2. Mesh independency check for the evacuated PVT system.
No. of CellsNo. of NodesOutlet Temperature (K)
781200876609331.24
390600440319331.54
143190168756333.19
Publisher’s Note: MDPI stays neutral with regard to jurisdictional claims in published maps and institutional affiliations.

