Abstract
Credit rating bias would affect the capital funding of oil and gas companies, and thus influence the development of the whole economy. Credit rating bias has been mostly analyzed based on different quantitative data sources, and inconsistent results have been obtained. This study first analyzes credit rating bias from the perspective of qualitative textual risk disclosures. By comparing the external credit rating with the internal risk perception expressed in the textual risk disclosures of Form 10-K filings, we can study the consistency of risk assessment of the company by the company’s management and the third-party rating agency. To be specific, four internal textual risk measures and one external risk measure are constructed to quantify the internal risk perception and external risk assessment on oil and gas companies. Then, Spearman’s rho is applied to measure the direction and magnitude of credit rating bias. In the experiment, based on the 357 samples of 174 U.S. oil and gas companies, ranging from 2009 to 2018, we find that the credit ratings mostly overestimate the internal risks perceived by the company managers, and the bias is becoming larger with the credit ratings downgraded from AAA to D.
1. Introduction
Oil and gas are the most basic support for the economic development of a country [1,2,3,4]. Credit ratings that act as a signal of companies’ overall quality from a neutral body are an essential part of the oil and gas sectors [5]. However, credit ratings are mostly inaccurate in reflecting companies’ overall risk, and this gap is defined as credit rating bias in this study. This bias would affect investors’ judgment of companies’ overall quality and then improve companies’ cost of capital [6]. Therefore, analyzing the bias in the credit ratings of oil and gas companies is important for the development of the whole economy.
Researchers have already realized credit rating bias in companies. More criticism on low-quality or erroneous ratings has been raised, especially during the financial crisis [7]. A noted credit rating bias event that occurred in the energy sector is that three credit ratings, which were compiled by Standard and Poor’s (S&P’s), Moody’s, and Fitch Ratings, failed to predict the collapse of the US energy corporation Enron. Each of the three leading Credit Rating Agencies (CRAs) provided Enron with an investment-grade rating until just four days prior to its collapse [8].
A company’s credit rating is increasingly important to its development, and companies with higher credit ratings are more likely to achieve higher returns on investment [9]. Kim and An [10] found that companies may have incentives for opportunistic disclosure to gain favorable credit ratings during the initial credit rating evaluation. The extant studies have mostly analyzed credit rating bias based on quantitative data. Hilscher and Wilson [7] and Blöchlinger and Leippold [11] found that the S&P credit ratings cannot accurately assess companies’ default risk compared with the measure constructed by accounting data and stock market prices. Strobl and Xia [12] analyzed S&P credit rating bias with the ratings compiled by another CRA and discovered that the conflict of interest caused by the issuer-pays rating model leads to inflated credit ratings. In contrast, Hilscher and Wilson [7] and Abad and Robles [13] found that credit ratings are strongly related to companies’ non-diversifiable risk measured by the stock price. Bonsall et al. [14] found that rating agencies will improve their rating quality when the credit risk information from credit default swaps threatens to expose inaccuracies in their ratings. Moon et al. [15] analyzed unsecured bonds rating samples and found that higher disclosure quality results in less credit rating bias among CRAs. Hasen et al. [16] found that acquirers with bigger bias ratings experience significantly lower announcement returns on the merger and acquisition (M&A) market. Generally, whether there is bias in credit ratings is inconsistent, and the results are related to the data source utilized.
In addition to quantitative data, textual data that reflects more detailed information about the process of a risk event or managers’ risk perception is used to quantify companies’ risk conditions. Specifically, textual Form 10-K filings are utilized to analyze credit rating bias. The Form 10-K is an annual report that covers, in detail, all the financial and business aspects of a company, required by and filed with the Securities and Exchange Commission (SEC). Bozanic and Kraft [17] showed that credit ratings are worse for companies that include many credit risk keywords in their Form 10-Ks. Friberg and Seiler [18] constructed the textual risk measure by calculating the proportion of uncertainty words in Form 10-Ks and found that it is negatively associated with S&P credit ratings. Bennett et al. [19] measured the legal risk by counting the number of litigious words in Form 10-Ks and found that the legal risk has negative effects on S&P credit ratings. Shu et al. [20] deconstructed the customer-perceived risk from comment data in social media and provided a new tool for the multi-dimensional capture of risk. However, other than the risk information, more information included in Form 10-Ks, such as the business, history, and staff comment section of companies, would disturb the risk measurement. Thus, these risk measures based on the whole Form 10-K cannot accurately reflect the true risk condition of companies.
The textual risk factor disclosure (RFD) of Form 10-Ks, which solely discusses a company’s risk factors, is disclosed by company managers to describe companies’ risk conditions. Since 2005, the SEC extended the requirement for RFDs to all U.S.-listed companies by requiring the inclusion of a new section, Item 1A, in their annual Form 10-K filings, to discuss “the most significant factors that make the company speculative or risky” [21,22]. Specifically, the RFD consists of two parts, whereby the headings discuss companies’ risk factors and the detailed description of headings explain why they face these risk factors. Generally, these voluntarily disclosed RFDs reflect managers’ internal risk perception of their companies, while credit ratings reflect the external risk assessment of these companies. Chin et al. [23] already found that the credit risk discussed in the RFD is correlated with credit ratings. Therefore, RFDs are a great source to analyze credit rating bias.
Therefore, this study aims to analyze the credit rating bias of oil and gas companies based on qualitative textual risk disclosures. By comparing the textual RFDs of Form 10-Ks and CRAs’ credit ratings, we can analyze the consistency of risk assessment of the company by the company’s management and the third-party rating agency. As far as we know, this is the first paper to analyze the credit rating bias from the perspective of companies’ internal risk perception contained in textual RFDs of Form 10-Ks. To achieve this, four internal risk measures, i.e., the number of headings, the total length, and the number of specificity- and uncertainty-related words, are constructed based on the textual RFD of Form 10-Ks to quantify companies’ risk perception. In addition, one external risk measure is constructed by transforming the credit ratings compiled by S&Ps into scores to quantify the CRA’s risk assessment. Then, Spearman’s rho is applied to measure the credit rating bias, and the normalized risk measures’ values are used to obtain the bias direction and magnitude. In the experiment, 357 samples of 174 U.S. oil and gas companies with both Form 10-Ks and S&P credit ratings between 2009 and 2018 are collected for empirical analysis.
2. Research Design
This section designs an experimental procedure to analyze the credit rating bias in oil and gas companies based on the textual RFD of Form 10-Ks. First, four internal textual risk measures, i.e., the number of headings, the total length, and the number of specificity- and uncertainty-related words, are constructed to quantify the magnitude of internal managers’ risk perception, and one external risk measure is obtained by transforming the credit ratings into a score to quantify the magnitude of the CRA’s risk assessment. Second, Spearman’s rank correlation coefficient is applied to measure the credit bias, and these risk measure values are normalized to obtain the bias direction and magnitude. In the following, we will describe the methods in detail.
2.1. Construct Risk Measures
To analyze credit rating bias based on the textual RFD, we first constructed internal textural risk measures to capture the company’s risk perceived by the internal company managers. RFD consists of headings and descriptions that only discuss the risk information about the company. Thus, four internal textual risk measures were constructed based on textual risk disclosures according to previous studies. Specifically, the first measure is the number of headings (denoted as Headings) constructed by counting the number of headings in the RFD. Each heading in RFD discusses one risk factor faced by the companies [24], and more headings indicate that managers perceive more risks in the company. Thus, the total number of headings of RFD constructed in this study could be used to reflect the whole risk condition of the company.
The second measure is the total length (denoted as Length) obtained by counting the total words in the RFD. Extant studies suggest that longer risk disclosures are riskier [25,26]. On the one hand, managers tend to explain why they disclose these risk factors using more words when they perceive more risks. On the other hand, managers might seek to obfuscate some information using longer sentences to mask the poor performance when the company possesses more risks. Thus, a longer RFD length implies that the company faces more risks.
The third measure is specificity (denoted as Specificity) measured by the total number of specific words. Specificity was first constructed by Hope et al. [27] to measure the specificity of RFDs. Their underlying idea is that disclosures using more specific language, i.e., terms that describe organizations, locations, dates, and monetary amounts, are more likely to reveal the extent of risks faced by companies. Wang et al. [28] also suggested that companies with more-specific RFDs face a greater level of risk. Thus, higher specificity indicates that managers perceive higher risks. Following Hope et al., this measure was calculated by utilizing the Stanford Named Entity Recognition (NER) package.
The last measure is the tone of uncertainty (denoted as Uncertainty) calculated by the total number of uncertain words in the RFD. This uncertainty words list is the main part of the LM dictionary [29], which was created by systematically analyzing the words used in Form 10-Ks and 10-Qs (another financial statement) to precisely measure the sentiment of financial texts. Specifically, 297 words are related to uncertainty, such as “risky”, “uncertainty”, “approximate”, “might”. These words are associated with company returns, trading volume, and return volatility. Thus, RFDs with a greater number of words associated with risk and uncertainty suggest that the company possesses a high level of risk profiles [18,28].
Then, the credit ratings were transformed into a score to quantify the external risk assessment by CRA. The credit rating levels are numerical transformations of the alphanumerical rating codes issued by S&Ps, i.e., AAA = 1, AA+ = 2, AA = 3, AA− = 4, A+ = 5, A = 6, A− = 7, BBB+ = 8, BBB = 9, BBB− = 10, BB+ = 11, BB = 12, BB− = 13, B+ = 14, B = 15, B− = 16, CCC+ = 17, CCC = 18, CCC− = 19, CC = 20, C = 21, and D = 22, where a higher rating score corresponds to higher risk [7,18]. In fact, S&P’s website (www.standardandpoors.com, available at 9 March 2022.) suggests that the highest rating AAA is described as having “extremely strong capacity to meet financial commitments”, while the lowest rating D means “payment default on a financial commitment or breach of an imputed promise”. In addition, the investment grade (BBB− to AAA) and speculative grade (D to BB+) are classified to present a lower or much higher risk of default [30]. This classification is mainly for conservative or aggressive investors to make investment decisions.
2.2. Measure the Credit Rating Bias
The correlation coefficient method is a numerical measure to describe the correlational relationship between two variables, and the value range from −1 to +1 represents the extent that one variable varies with the other variable. Three popular correlation coefficient methods are mostly used by previous studies, i.e., Pearson, Kendall, and Spearman rank correlation coefficient methods. Among them, Spearman’s rank correlation coefficient (also called Spearman’s rho), which calculates the Pearson correlation coefficient value of two variables’ ranks, can measure the consistency of two variables’ ranks. It has been widely used in studies involving ranking comparisons and the measurement of consistency between two variables [31]. Thus, in this paper, we calculate Spearman’s rho between the constructed internal risk measure and external risk measure to describe the credit rating bias.
Specifically, in this study, we denote the credit rating score and internal risk as and () with size . These two variables are converted into their ranks and (), respectively. The Spearman’s rho is calculated from the Pearson correlation coefficient () as follows:
where is the Pearson correlation coefficient of two ranked variables, is the covariance of these two rank variables, and and are the standard deviations of the ranked variables [32].
Spearman’s rho ranges between −1 and +1. A value of +1 indicates a perfect positive correlation, i.e., if the ranking on one variable is increased (decreased), the ranking for the other variable is also increased (decreased). In contrast, a value of −1 indicates a perfect negative correlation. The value of 0 means that there is no relationship between these two variables. In addition, Spearman’s rho is statistically significant at a pre-determined 0.05 significance level suggesting that the linear relationship between two ranked variables is significant [31].
In this study, a value of +1 means that the internal risk perception and external risk assessment are consistent, and there is no bias in credit ratings in general. However, if there is a bias in the credit rating of individual companies, its direction and magnitude should be then analyzed. Due to the scale of internal and external risk measures being rather different, the normalization method should thus be utilized to compare these two variables on the same scale. The Min–Max normalization technique, which shifts the minimum and maximum value into 0 and 1, respectively, is best suited for the case where the bounds of variables are known. Specifically, for the original data scores , the normalized score (denoted as ) is obtained as follows:
where and represent the minimum and maximum value of the original data, respectively. After this normalization, the minimum and maximum values were shifted to 0 and 1, respectively. A value of 0 indicates that the original data value is the minimum, which indicates the lowest risk. A value of 1 represents that the original data value is the maximum one, which indicates the highest risk. The normalization diminishes the effect of two variables’ scales. Thus, the normalized data could be directly used to analyze the direction and magnitude of the credit rating bias.
Finally, the credit rating bias (denoted as ) is calculated by subtracting two normalized variables as follows:
where and represent the normalized external and internal risk measures.
The provides both the direction and the magnitude. The sign reflects the direction of the bias, means the external risk is higher than the internal risk , indicating that the credit ratings overestimate the internal risks, and vice versa, while means that the company’s credit rating has no bias. The absolute value represents the magnitude of the bias, whereby the higher the absolute value, the larger the bias. Based on the bias measure, the total bias direction and magnitude can also be obtained by averaging the individual value.
3. Sample Selection
The data collection process consisted of three steps. First, the research companies and time range were determined. Based on Wei et al. [2], a total of 617 U.S. oil and gas companies were selected. Due to the fact that only the most recent 10 years of S&P credit rating data can be downloaded from the Thomson Reuters DataStream, the time range selected was 2009 to 2018.
Then, the credit ratings and RFD data sources were collected separately. For credit ratings, the long-term issuer credit ratings compiled by S&Ps, which is one of the three largest CRAs, were utilized to measure the company’s risks. The S&P credit rating datasets of the oil and gas companies were downloaded from the Thomson Reuters DataStream. For the RFD information, we first obtained the Form 10-K from the EDGAR Database on the SEC’s website according to the SIC code (including 1221, 1311, 1381, 1382, 1389, 2890, 2911, 3533, 4610, 4911, 4922, 4923, 4924, 4931, 4932) provided by Wei et al. [22], and then extracted the RFD section from the Form 10-K. Two examples of headings and their description in the RFD of Oasis Petroleum Inc, Delaware, USA. disclosed on February 21, 2014, are shown in Table 1, and four internal textual risk measures could be constructed based on the properties of discussing the risk conditions in RFD.

Table 1.
The examples of Headings and their description in RFD of Form 10-K.
Finally, the credit ratings and RFD data sources are matched according to the closest disclosure time. It is noteworthy that the disclosure times of S&P credit ratings and Form 10-Ks are different. For S&P credit ratings, they are infrequently updated after the client company solicited the rating, while the Form 10-Ks are disclosed within 90 days after the end of the company’s fiscal year required by the SEC, mostly in February or March. In order to analyze the credit bias avoiding the effect of the disclosure time, we matched the S&P credit ratings and RFDs of the Form 10-K with the closest disclosure time. The oil and gas companies that disclose Form 10-Ks but are not rated by S&Ps were removed. Through these three steps, a total of 357 samples of 157 U.S. oil and gas companies was obtained.
4. Empirical Results
4.1. Descriptive Statistics of Risk Measures
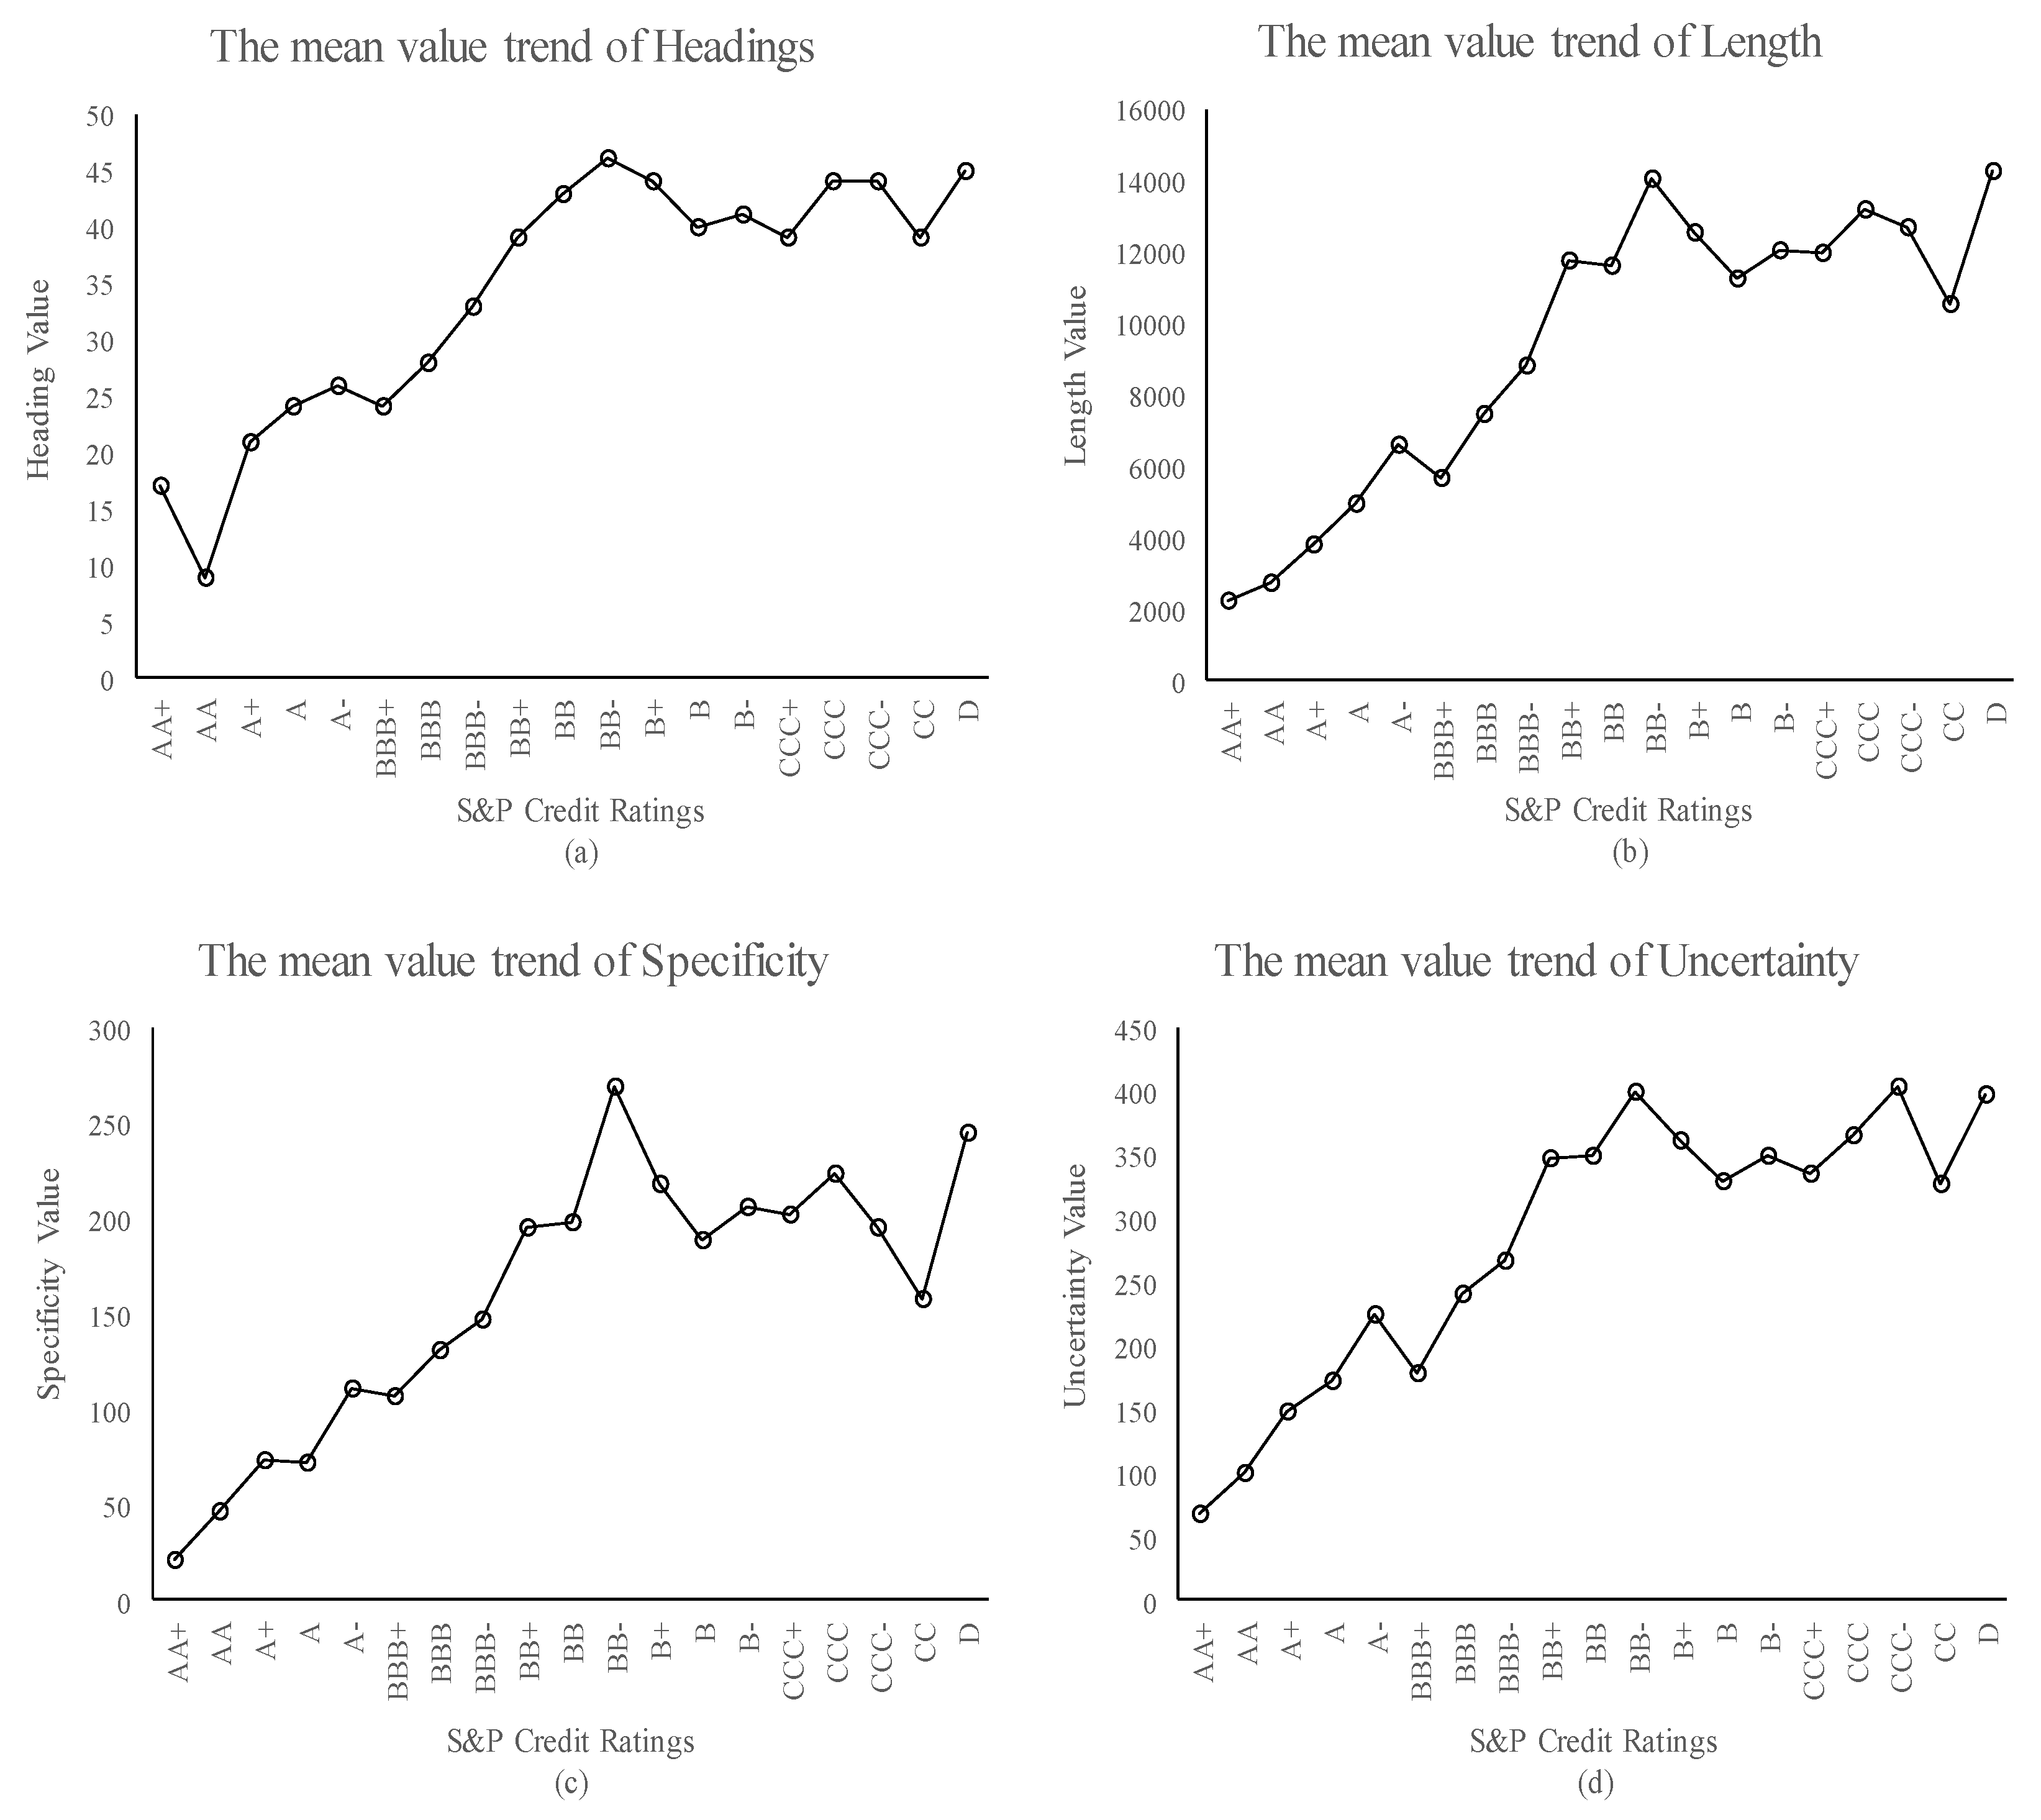
In order to analyze credit rating bias based on the constructed internal textual risk measures, we first give detailed information of four internal textual risk measures for different S&P credit rating grades. Figure 1 and Table 2 present the mean value of four internal textual risk measures, i.e., the headings, length, specificity, and uncertainty, located at AAA to D levels. Figure 2 presents the boxplot of the distribution of four internal textual risk measures by credit ratings, which includes the maximum, 75th percentile, median, 25th percentile, minimum, and mean values.

Figure 1.
The four internal textural risk measures of different rating grades.
Table 2.
Four internal textual risk measures’ mean values located at each credit rating.
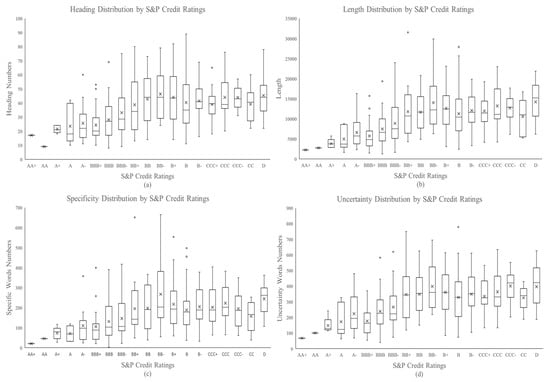
Figure 2.
Four internal textural risk measures’ distribution of different rating grades.
As shown in Figure 1, four internal risk measures are almost similar to the credit ratings downgraded from AA+ to D. To be specific, two stages are divided in general, and the mean value of four internal textual risk measures increased with the credit rating ranges from AA+ to BB− and were then located at a high level.
According to Table 2, the mean headings of each credit rating range from 9 to 46, which decreased from 17 to 9 when the credit ratings were downgraded from AA+ to AA and increased to the highest level of 46 at BB−, then fluctuated at a high level. For the mean length of each credit rating, it increased from the lowest level of 2229 at AA+ to the highest level of 14,018 at BB− with two small decreases at A− and BB+, and then increased to 14,222 at D. The mean specificity and uncertainty ranged from 21 to 268 and 67 to 402, with the highest points of 268 and 399 at BB−, respectively.
These results indicate that general internal managers’ risk perception and external CRAs’ risk assessment on oil and gas companies are consistent when they all perceive lower risks, while the managers do not perceive more risks when their credit ratings are downgraded to lower risk levels.
Although the internal risk perception and external risk assessment are consistent under the general mean level, the values of internal risk measures are rather different within each credit rating grade. The box distributions of headings, length, specificity, and uncertainty show that four internal textual risk measures all have a change interval at each credit rating grade. Take Figure 1d, for example; the uncertainty value of credit rating A ranges from approximately 60 and 300, and the uncertainty value of 150 might be located at both level A and level BBB+. This result indicates that there might be credit rating bias in oil and gas companies, and a deeper analysis of the credit rating bias is needed.
4.2. The Bias in the Credit Rating
This section utilizes Spearman’s rho to measure the credit rating bias in oil and gas companies. Specifically, the biased results of three major classes are provided. The first class is the total research sample; this result is given to display the general condition of credit rating bias. The second class includes four subclasses, A, B, C, and D, ranging from A− to AAA, B− to BBB+, CC to CCC+, and D, respectively. This class is used to analyze bias changes when the credit rating is downgraded. The analysis of subclass D is isolated in this section for only one credit rating level, because Spearman’s rho cannot be calculated. The third class includes the investment (BBB− to AAA) and speculative (D to BB+) grades; these credit rating bias results are given as an investment suggestion for investors.
Table 3 presents Spearman’s rho of the above three classes of credit ratings and four internal textual risk measures, whereby the lower the value, the larger the bias. Generally, the correlation coefficients of the four internal risk measures and credit rating scores have consistent results, other than the value of headings and subclass A at 0.19, which expressed a rising tendency wen the rating grade was upgraded from C to A. The results indicated that for companies with good credit rating grades, the higher the consistency of internal and external risk perception.
Table 3.
Spearman’s rho of credit ratings and four internal textual risk measures in seven classes.
From the perspective of the entire oil and gas sector, the correlation values of all companies’ credit ratings and four internal textual risk measures are 0.34, 0.40, 0.35, and 0.36 at the 0.01 significance level, which indicates that the credit ratings and internal risk measures have positive correlations. Meanwhile, compared with stronger correlations with a value of 1, the correlation of credit ratings and internal risk measures is weaker, indicating that there is bias in credit ratings. From the perspective of subclasses according to the credit ratings, the correlation coefficient value decreased with the increase in risk level subclasses. In addition to the correlation coefficient value of headings and subclass A, the correlation value of four internal risk measures and subclasses A, B, and C all show a decreasing trend from 0.27 to 0.11, from 0.50 to 0.02, from 0.32 to −0.12, and from 0.42 to 0.11, respectively, and the results of the internal risk measure of subclass C are not significant. These results indicate that more bias existed in the higher-risk-level credit rating classes. From the perspective of investment and speculative grades, the correlation coefficient values all increased from 0.30 to −0.01, from 0.37 to 0.04, from 0.29 to 0.02, and from 0.33 to 0.11, which indicates that bias is lower in the investment grade than the speculative grade.
4.3. The Direction and Magnitude of the Credit Rating Bias
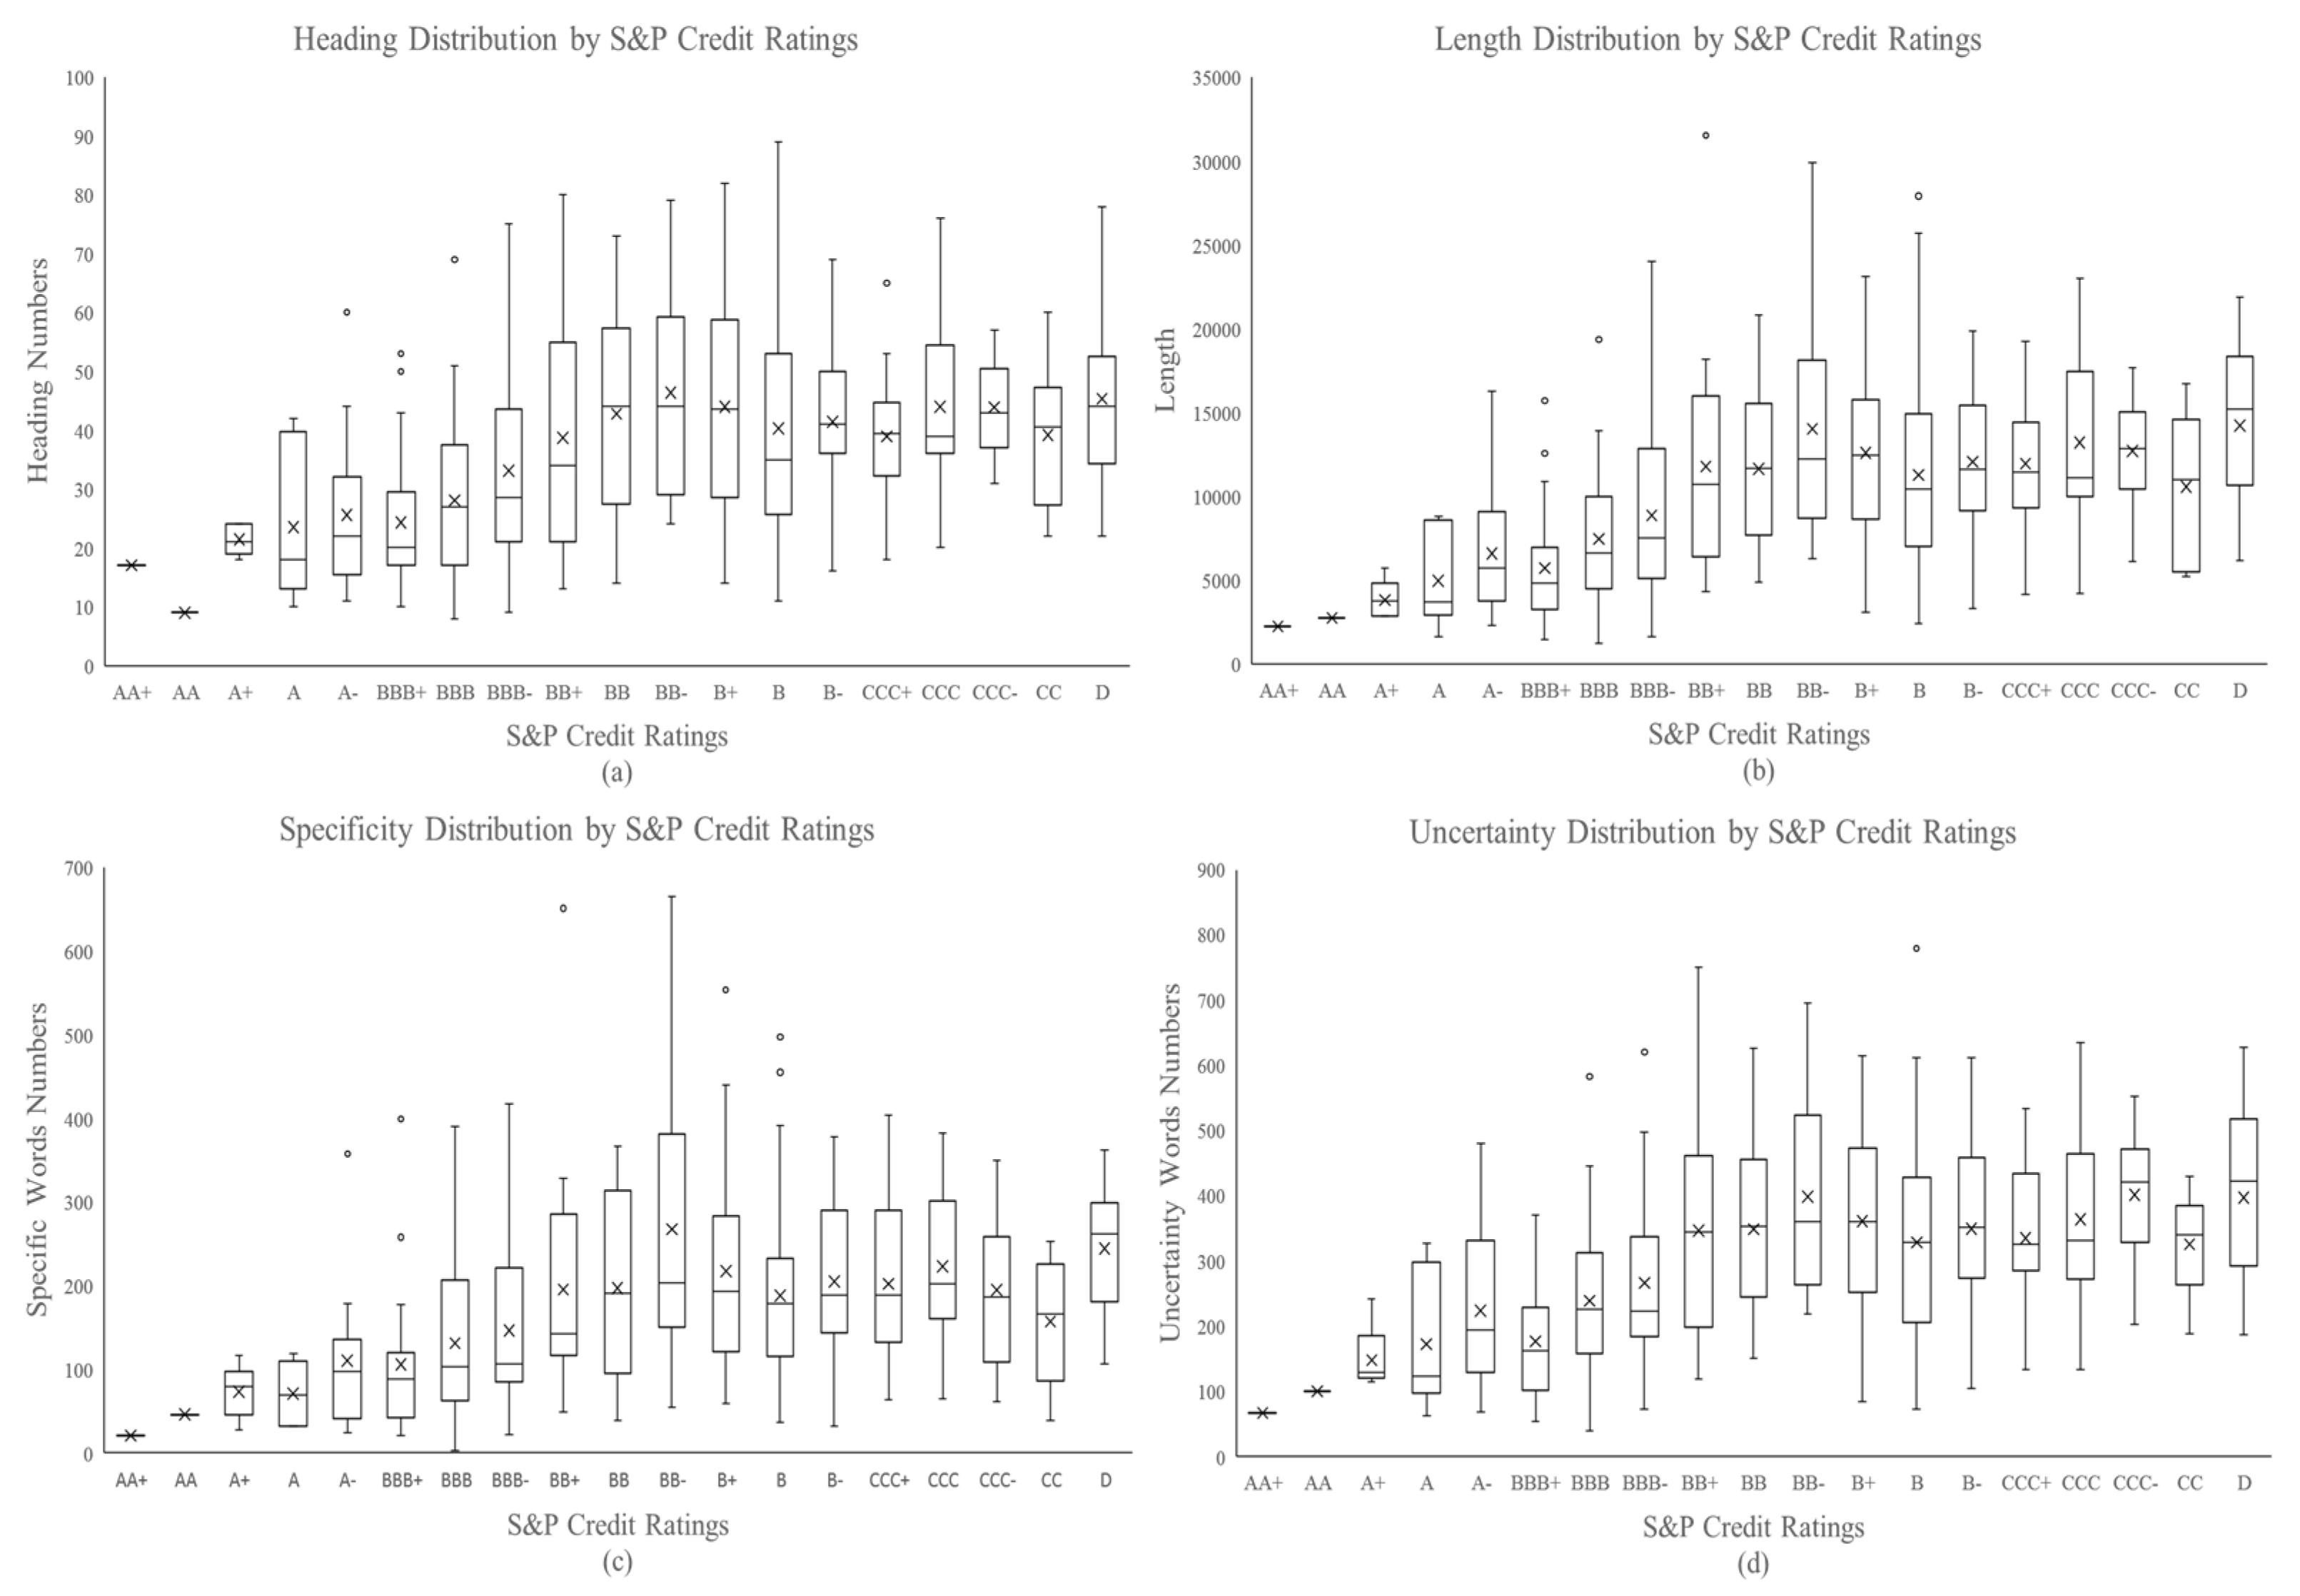
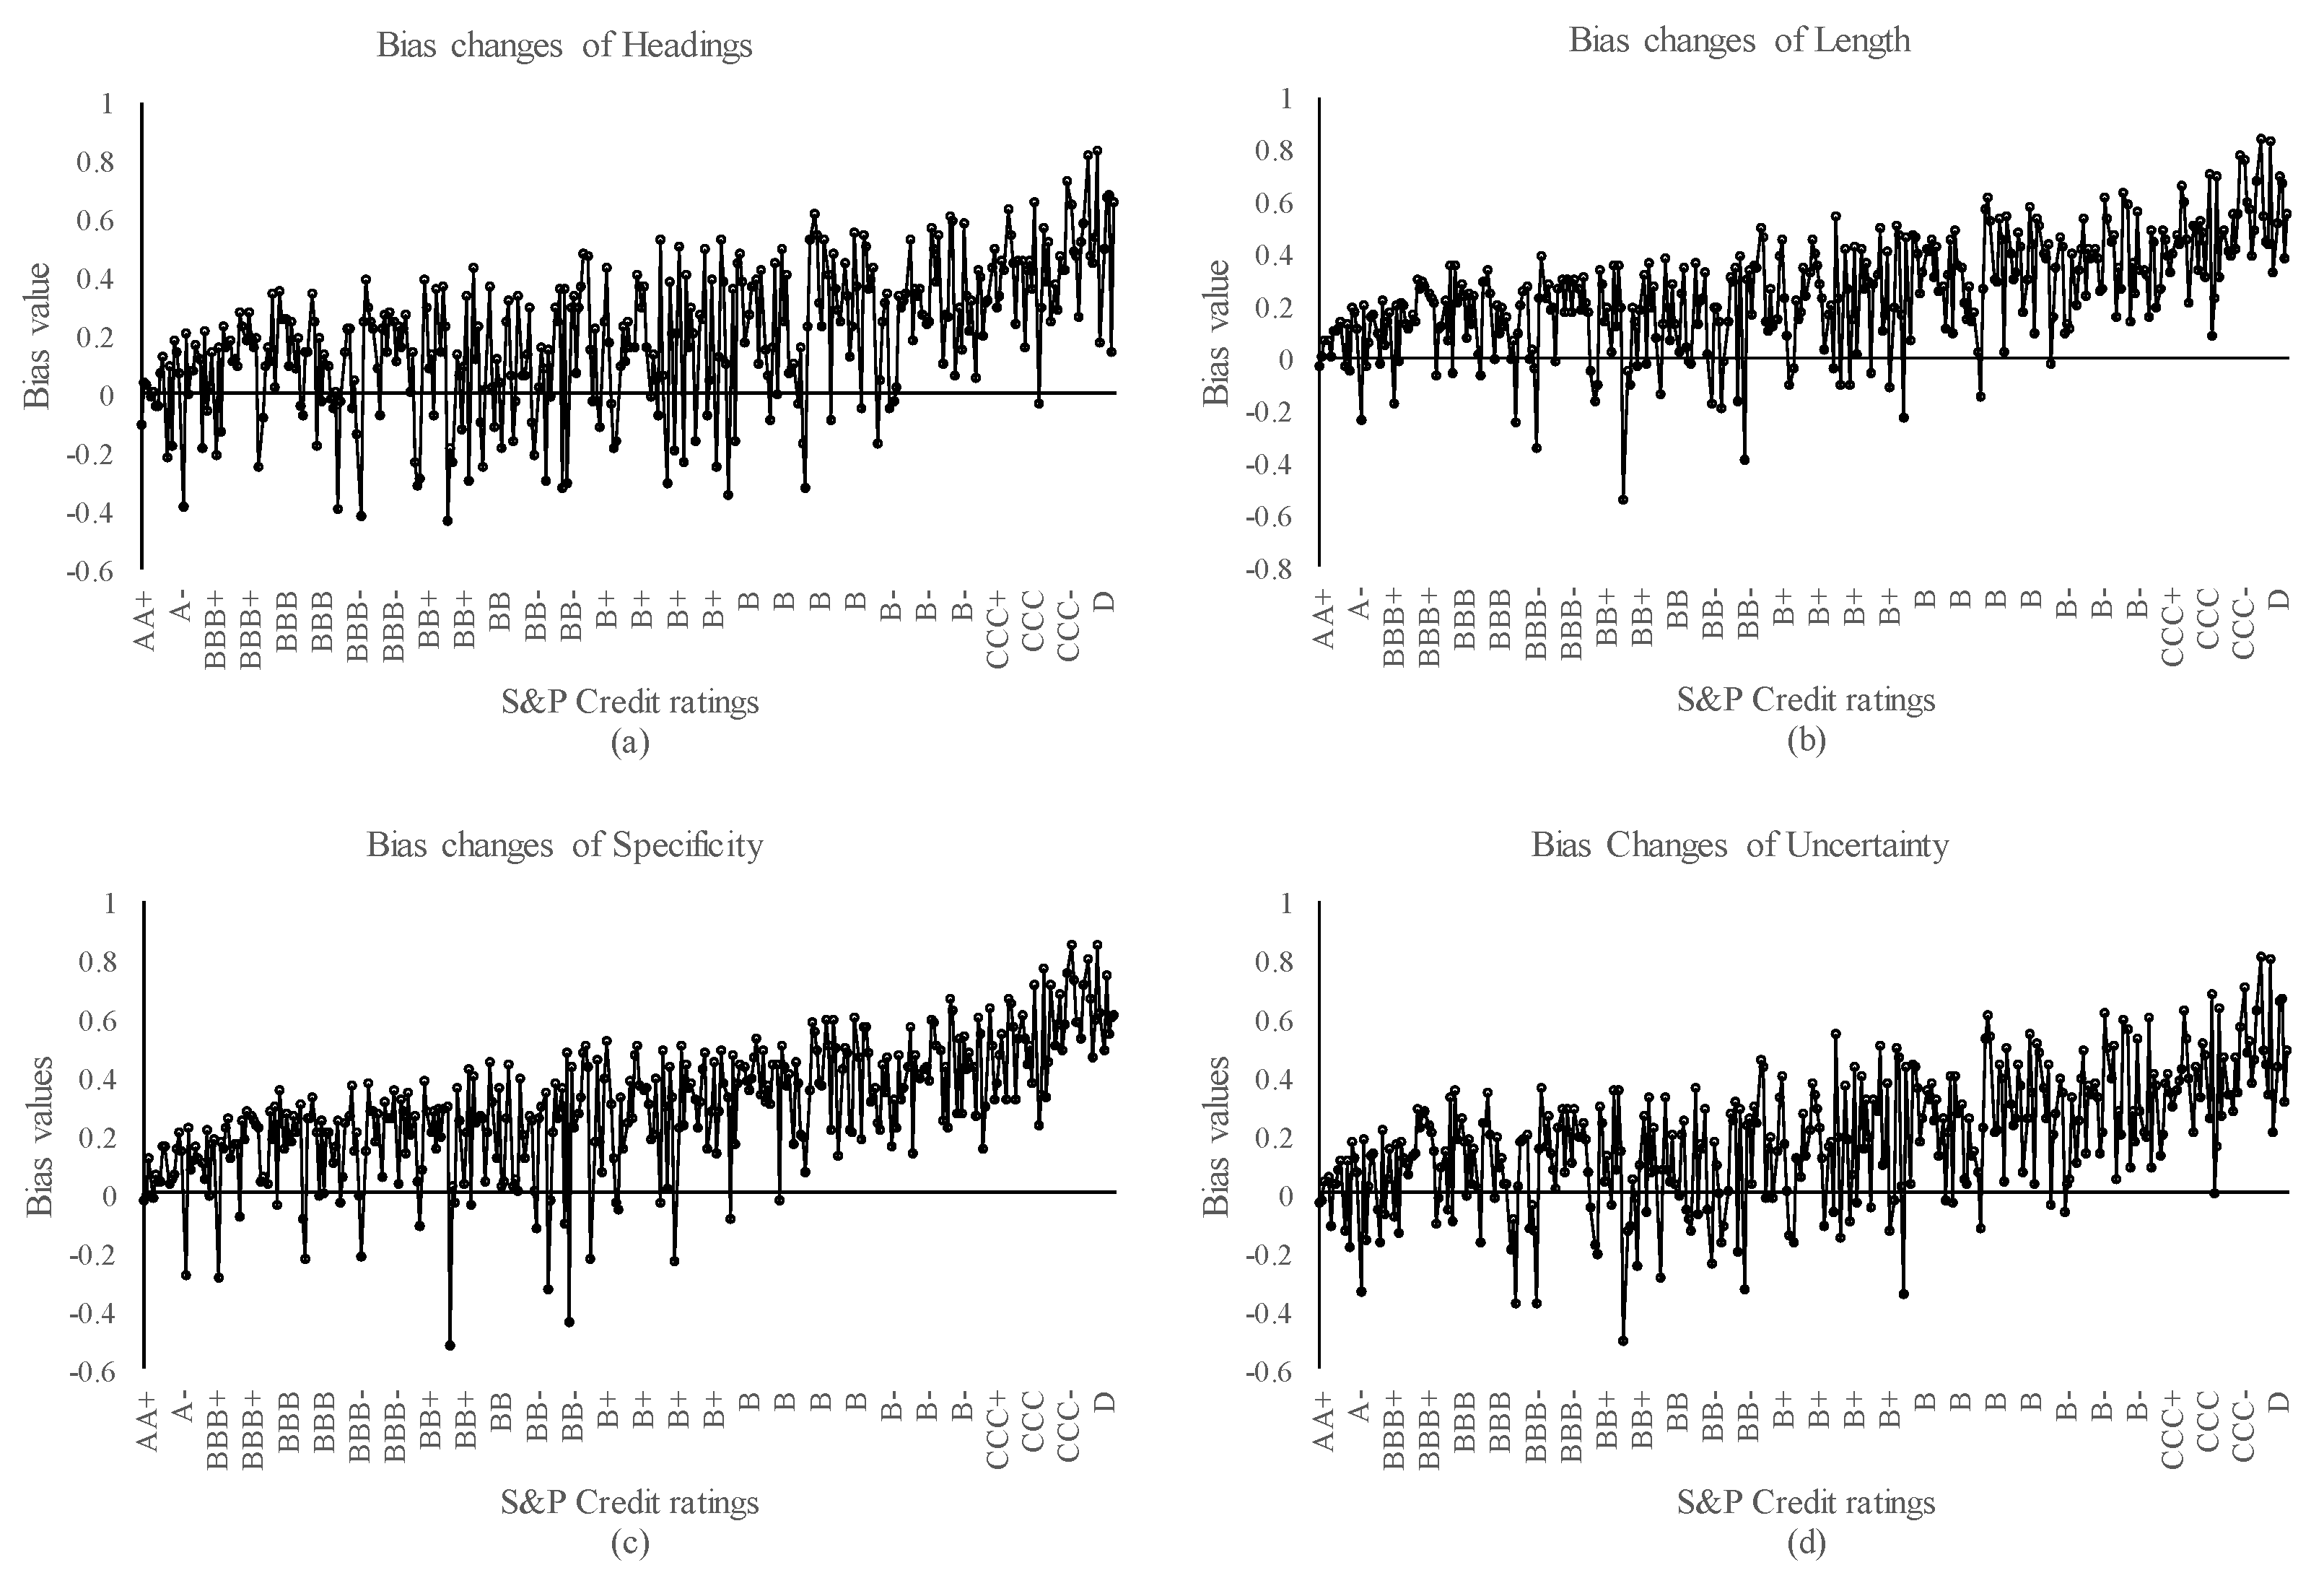
The direction and magnitude of credit rating bias are calculated according to Formula (3) introduced in Section 2.2, and the results are shown in Figure 3. The absolute bias value represents the magnitude of credit rating bias, whereby the bigger the absolute value, the larger the bias. A positive value indicates that the credit rating score is larger than the internal risk measures, indicating that the credit rating overestimates the internal risks; a negative score indicates that the credit rating score is less than the internal risk measure, indicating that the credit rating underestimates the internal risk measure. As shown in Figure 3, these four Figure 3a–d are similar, which shows that the credit rating results are mostly overestimated compared to the internal risks, and the positive magnitude increases when the credit ratings are downgraded from AAA to D. Taking Figure 3b as an example, during the low-risk level credit rating, the bias of uncertainty fluctuates around zero with an absolute small value, while the positive value increased when the credit rating was lower than BB−.

Figure 3.
The bias of four internal risk measures under different rating grades.
Next, more detailed statistical results of the bias changes of uncertainty are shown in Table 4, which provides the values of the mean, maximum, minimum, overestimated proportion, overestimated mean, underestimated proportion, and underestimated mean of the bias, while the statistics of headings, length, and specificity are shown in Appendix A. For all oil and gas companies, the mean bias value of 0.19 indicates that the credit ratings overestimate companies’ risk in general, and the largest value is up to 0.8. Specifically, 81% of the credit ratings overestimate the risk, with a mean value of 0.26, while 19% of the credit ratings underestimate the risk, with a mean value of −0.13. These results indicate that credit ratings mostly overestimate companies’ risk, and the overestimated value is larger than the absolute underestimated value.
Table 4.
Statistical results of the bias of uncertainty.
For the three divided subclasses, the overestimated proportion and value increase with the increase in risk level classes. Specifically, 60%, 79%, 98%, and 100% of the credit ratings overestimate the risk, with mean values of 0.1, 0.23, 0.39, and 0.52, while the underestimated proportion and value decrease with the increase in risk level classes. In subclass A, the mean value is nearly equal to 0, and the overestimated and underestimated proportions are approximately 50%, which indicates that credit rating bias is not obvious in the lowest risk level of A. Meanwhile, in subclass D, the mean value is up to 0.52, and the overestimated proportion is up to 100%, indicating all credit ratings overestimate companies’ risk and that the bias is very significant, with the magnitude of the bias being large at 0.52.
For the classes of investment and speculative grades, credit rating bias in the speculative grade is larger than the investment grade. Typically, the mean bias values are 0.07 and 0.23, and the overestimated proportions are 72% and 85% with mean values of 0.15 and 0.30, respectively. In contrast, the underestimated proportions are 29% and 15% with mean values of −0.13 and −0.12.
To summarize, we found that the company’s internal risk perception and the external credit rating grades are not consistent. Generally, there are differences between them, with a lower value of Spearman’s rho. Furthermore, the credit ratings mostly overestimate the internal risks perceived by company managers. For companies with poor credit ratings, the overestimation of risk becomes particularly prominent. Credit rating bias increases when the credit ratings are downgraded from AAA to D. The reason may be that, for companies with poor credit ratings, their operation faces severe risks. However, the managers of these companies may have the motivation to underestimate the risks and do not disclose the real risks. Thus, the difference between the internal risk perception and external credit rating becomes larger for companies with poor credit ratings.
5. Conclusions
This study aims to analyze the bias in credit ratings of oil and gas companies by comparing the company’s internal risk perception contained in the textural RFD of Form 10-K and the external CRA. To our best knowledge, this is the first paper to analyze credit rating bias from the perspective of companies’ internal risk perception contained in the textual RFD of Form 10-K. Specifically, four internal textual risk measures, namely the headings, length, specificity, and uncertainty, are constructed to measure internal managers’ risk perception. The external risk measure is obtained by transforming the credit ratings into a score to quantify the external CRA’s risk assessment. In the experiment, based on 357 samples of 174 U.S. oil and gas companies between 2009 and 2018, we found that the internal risk perceptions and external risk assessments are consistent under the general mean level. However, the credit ratings mostly overestimated the risk perceived by internal managers, and the bias increases when the credit ratings are downgraded from AAA to D. Energy companies face many different kinds of risks (such as the oil price, interest rate, leverage, competition, and so on) in the process of operation. In future research, we will further study the differences in the cognition of which types of risks lead to the deviation in the final credit rating, which is useful to oil and gas companies to manage the company’s risk better.
Author Contributions
Conceptualization, L.W. and Y.Y.; methodology, Y.Y.; software, L.W.; validation, L.W., Y.Y. and C.H.; formal analysis, C.H.; investigation, C.H.; resources, Y.Y.; data curation, L.W.; writing—original draft preparation, Y.Y. and C.H.; writing—review and editing, L.W.; visualization, C.H.; supervision, L.W.; project administration, L.W.; funding acquisition, L.W. and Y.Y. All authors have read and agreed to the published version of the manuscript.
Funding
This study was supported by grants from the National Natural Science Foundation of China (72001223, 72101166).
Institutional Review Board Statement
Not applicable.
Informed Consent Statement
Not applicable.
Data Availability Statement
Not applicable.
Conflicts of Interest
The authors declare no conflict of interest.
Appendix A
Table A1.
Statistical results of bias of length, headings, and specificity.
Table A1.
Statistical results of bias of length, headings, and specificity.
| Risk Measures | All | A | B | C | D | Investment | Speculative | |
|---|---|---|---|---|---|---|---|---|
| Headings | Mean | 0.19 | 0.01 | 0.16 | 0.39 | 0.54 | 0.08 | 0.23 |
| Min | −0.44 | −0.39 | −0.44 | −0.04 | 0.14 | −0.43 | −0.44 | |
| Max | 0.83 | 0.21 | 0.61 | 0.73 | 0.83 | 0.39 | 0.83 | |
| Over. percent | 79% | 60% | 77% | 98% | 100% | 72% | 82% | |
| Over. Mean | 0.28 | 0.10 | 0.25 | 0.40 | 0.54 | 0.16 | 0.32 | |
| Under. percent | 21% | 40% | 23% | 2% | 0% | 28% | 18% | |
| Under. mean | −0.15 | −0.13 | −0.16 | −0.04 | -- | −0.15 | −0.16 | |
| Length | Mean | 0.25 | 0.07 | 0.22 | 0.44 | 0.57 | 0.13 | 0.29 |
| Min | −0.55 | −0.25 | −0.55 | 0.08 | 0.32 | −0.35 | −0.55 | |
| Max | 0.84 | 0.22 | 0.63 | 0.77 | 0.84 | 0.39 | 0.84 | |
| Over. percent | 88% | 76% | 86% | 100% | 100% | 80% | 91% | |
| Over. Mean | 0.30 | 0.11 | 0.27 | 0.44 | 0.57 | 0.18 | 0.34 | |
| Under. percent | 12% | 24% | 14% | 0% | 0% | 20% | 9% | |
| Under. mean | −0.11 | −0.07 | −0.12 | -- | -- | −0.09 | −0.13 | |
| Specificity | Mean | 0.29 | 0.07 | 0.26 | 0.51 | 0.64 | 0.14 | 0.35 |
| Min | −0.53 | −0.29 | −0.53 | 0.14 | 0.46 | −0.30 | −0.53 | |
| Max | 0.85 | 0.22 | 0.66 | 0.85 | 0.84 | 0.37 | 0.85 | |
| Over. percent | 91% | 80% | 90% | 100% | 100% | 84% | 94% | |
| Over. Mean | 0.33 | 0.11 | 0.30 | 0.51 | 0.64 | 0.19 | 0.38 | |
| Under. percent | 9% | 20% | 10% | 0% | 0% | 16% | 6% | |
| Under. Mean | −0.12 | −0.07 | −0.13 | -- | -- | −0.10 | −0.15 |
Notes: “over.” means overestimate, “under.” means underestimate.
References
- Zhu, H.; Duan, R.; Peng, C.; Jia, X. The heterogeneous dependence between global crude oil and Chinese commodity futures markets: Evidence from quantile regression. Appl. Econ. 2019, 51, 3031–3048. [Google Scholar] [CrossRef]
- Wei, L.; Li, G.; Zhu, X.; Sun, X.; Li, J. Developing a hierarchical system for energy corporate risk factors based on textual risk disclosures. Energy Econ. 2019, 80, 452–460. [Google Scholar] [CrossRef]
- Olleik, M.; Hamie, H.; Auer, H. Using Natural Gas Resources to De-Risk Renewable Energy Investments in Lower-Income Countries. Energies 2022, 15, 1651. [Google Scholar] [CrossRef]
- Kang, X.; Khan, F.U.; Ullah, R.; Arif, M.; Rehman, S.U.; Ullah, F. Does Foreign Direct Investment Influence Renewable Energy Consumption? Empirical Evidence from South Asian Countries. Energies 2021, 14, 3470. [Google Scholar] [CrossRef]
- Ryan, P.A.; Villupuram, S.V.; Zygo, J.G. The value of credit rating changes across economic cycles. J. Econ. Bus. 2017, 92, 1–9. [Google Scholar] [CrossRef]
- Li, Y.; He, J.; Xiao, M. Risk disclosure in annual reports and corporate investment efficiency. Int. Rev. Econ. Financ. 2018, 63, 138–151. [Google Scholar] [CrossRef]
- Hilscher, J.; Wilson, M. Credit ratings and credit risk: Is one measure enough? Manag. Sci. 2017, 63, 3414–3437. [Google Scholar] [CrossRef] [Green Version]
- Duff, A.; Einig, S. Understanding credit ratings quality: Evidence from UK debt market participants. Br. Account. Rev. 2009, 41, 107–119. [Google Scholar] [CrossRef]
- Hyun, L.; Cho, S.; Se, L. Investment Efficiency and Credit Rating of Firms. Korea Int. Account. Rev. 2020, 89, 113–132. [Google Scholar] [CrossRef]
- Kim, Y.; An, J. Initial credit ratings and voluntary disclosure: Evidence from Korea. Asia-Pac. J. Account. Econ. 2021. [Google Scholar] [CrossRef]
- Blöchlinger, A.; Leippold, M. Are ratings the worst form of credit assessment apart from all the others? J. Financ. Quant. Anal. 2018, 53, 299–334. [Google Scholar] [CrossRef] [Green Version]
- Strobl, G.; Xia, H. The Issuer-Pays Rating Model and Ratings Inflation: Evidence from Corporate Credit Ratings; Working Paper; University of Texas: Austin, TX, USA, 2012. [Google Scholar] [CrossRef]
- Abad, P.; Robles, M.D. Credit rating agencies and idiosyncratic risk: Is there a linkage? Evidence from the Spanish market. Int. Rev. Econ. Financ. 2014, 33, 152–171. [Google Scholar] [CrossRef]
- Bonsall, S.B.; Koharki, K.; Neamtiu, M. The Disciplining Effect of Credit Default Swap Trading on the Quality of Credit Rating Agencies dagger. Contemp. Account. Res. 2022. [Google Scholar] [CrossRef]
- Moon, C.; Lee, S.; Lee, Y. Disagreements of Disclosure Quality and Credit Ratings. Rev. Account. Policy Stud. 2021, 25, 115–144. [Google Scholar] [CrossRef]
- Hasen, I.; Huang, H.; Thomas, Y. Are Credit Rating Disagreements Priced in the M&A Market? J. Int. Financ. Mark. Inst. Money 2021, 72, 101335. [Google Scholar] [CrossRef]
- Bozanic, Z.; Kraft, P. Qualitative Corporate Disclosure and Credit Analysts’ Soft Rating Adjustments; Working Paper 2017; Ohio State University: Columbus, OH, USA; New York University: New York, NY, USA, 2017. [Google Scholar] [CrossRef]
- Friberg, R.; Seiler, T. Risk and ambiguity in 10-Ks: An examination of cash holding and derivatives use. J. Corps Financ. 2017, 45, 608–631. [Google Scholar] [CrossRef]
- Bennett, B.; Milbourn, T.; Wang, Z. Corporate Investment under the Cloud of Litigation; Working Paper; Ohio State University: Columbus, OH, USA, 2018. [Google Scholar] [CrossRef]
- Shu, T.; Wang, Z.; Lin, L.; Jia, H.; Zhou, J. Customer Perceived Risk Measurement with NLP Method in Electric Vehicles Consumption Market: Empirical Study from China. Energies 2022, 15, 1637. [Google Scholar] [CrossRef]
- Securities and Exchange Commission (SEC). Securities and Exchange Commission Final Rule, Release No. 33-8591 (FR-75). Available online: http://www.sec.gov/rules/final/33-8591.pdf (accessed on 20 December 2018).
- Wei, L.; Li, G.; Zhu, X.; Li, J. Discovering bank risk factors from financial statements based on a new semi-supervised text mining algorithm. Account. Financ. 2019, 59, 1519–1552. [Google Scholar] [CrossRef]
- Chin, M.; Liu, Y.; Moffitt, K. Voluntary Disclosure through the Ranking of Risk Factors in the 10K; Working Paper; Rutgers University: New Brunswick, NJ, USA, 2018. [Google Scholar] [CrossRef]
- Bao, Y.; Datta, A. Simultaneously discovering and quantifying risk types from textual risk disclosures. Manag. Sci. 2014, 60, 1371–1391. [Google Scholar] [CrossRef]
- Campell, J.L.; Chen, H.; Dhaliwal, D.S.; Lu, H.; Steele, L.B. The information content of mandatory risk factor disclosures in corporate filings. Rev. Account. Stud. 2017, 19, 396–455. [Google Scholar] [CrossRef]
- Cazier, R.A.; Pfeiffer, R.J. Why are 10-K fillings so long? Account. Horiz. 2016, 30, 1–21. [Google Scholar] [CrossRef]
- Hope, O.-K.; Hu, D.; Lu, H. The benefits of specific risk-factor disclosures. Rev. Account. Stud. 2016, 21, 1005–1045. [Google Scholar] [CrossRef]
- Wang, V. Risk Factor Disclosures and Accounting Conservatism. Working Paper. In Proceedings of the 2019 Canadian Academic Accounting Association (CAAA) Annual Conference, Long Beach, CA, USA, 9 January 2019. [Google Scholar] [CrossRef]
- Loughran, T.; McDonald, B. When is a liability not a liability? Textual analysis, dictionaries, and 10-Ks. J. Financ. 2011, 66, 35–65. [Google Scholar] [CrossRef]
- Oh, F.D.; Park, J. Credit ratings and corporate disclosure behavior: Evidence from regulation fair disclosure in Korea. Appl. Econ. 2016, 49, 3481–3494. [Google Scholar] [CrossRef]
- Chan, D.W.M.; Chan, A.P.C.; Lam, P.T.I.; Yeung, J.F.Y.; Chan, J.H.L. Risk ranking and analysis in target cost contracts: Empirical evidence from the construction industry. Int. J. Proj. Manag. 2011, 29, 751–763. [Google Scholar] [CrossRef] [Green Version]
- Ashok, K.J.; Abirami, S. Aspect-based opinion ranking framework for product reviews using a Spearman’s rank correlation coefficient method. Inf. Sci. 2018, 460–461, 23–41. [Google Scholar] [CrossRef]
Publisher’s Note: MDPI stays neutral with regard to jurisdictional claims in published maps and institutional affiliations. |
© 2022 by the authors. Licensee MDPI, Basel, Switzerland. This article is an open access article distributed under the terms and conditions of the Creative Commons Attribution (CC BY) license (https://creativecommons.org/licenses/by/4.0/).