Article

The Role of Electric Vehicle Charging Technologies in the Decarbonisation of the Energy Grid

Department of Architecture & Built Environment, Faculty of Engineering, The University of Nottingham, Nottingham NG7 2RD, UK
*
Authors to whom correspondence should be addressed.
Energies 2022, 15(7), 2447; https://doi.org/10.3390/en15072447
Submission received: 20 February 2022 / Revised: 10 March 2022 / Accepted: 23 March 2022 / Published: 26 March 2022

Abstract

:
Vehicle-to-grid (V2G) has been identified as a key technology to help reduce carbon emissions from the transport and energy sectors. However, the benefits of this technology are best achieved when multiple variables are considered in the process of charging and discharging an electric vehicle. These variables include vehicle behaviour, building energy demand, renewable energy generation, and grid carbon intensity. It is expected that the transition to electric mobility will add pressure to the energy grid. Using the batteries of electric vehicles as energy storage to send energy back to the grid during high-demand, carbon-intensive periods will help to reduce the impact of introducing electric vehicles and minimise carbon emissions of the system. In this paper, the authors present a method and propose a V2G control scheme integrating one year of historical vehicle and energy datasets, aiming towards carbon emissions reduction through increased local consumption of renewable energy, offset of vehicle charging demand to low carbon intensity periods, and offset of local building demand from peak and carbon-intensive periods through storage in the vehicle battery. The study included assessment of strategic location and the number of chargers to support a fleet of five vehicles to make the transition to electric mobility and integrate vehicle-to-grid without impacting current service provision. The authors found that the proposed V2G scheme helped to reduce the average carbon intensity per kilowatt (gCO2/kWh) in simulation scenarios, despite the increased energy demand from electric vehicles charging. For instance, in one of the tested scenarios V2G reduced the average carbon intensity per kilowatt from 223.8 gCO2/kWh with unmanaged charging to 218.9 gCO2/kWh using V2G.

1. Introduction

According to the Department for Business, Energy & Industrial Strategy (BEIS) [1], the transport sector is the largest emitter of greenhouse gases (GHG) in the UK, responsible for 27% of emissions in 2019. The energy supply sector was the second largest emitter, responsible for 21% of UK GHG emissions. The increase in renewable energy generation, the reduction in the use of coal for electricity generation, and the closure of the largest deep coal mines were some of the factors that influenced the reduction in emissions from energy, as this was the largest emitter until 2016, when transport took over [1].
The Intergovernmental Panel on Climate Change (IPCC) reaffirmed the near-linear relationship between carbon (CO2) emissions and global warming, as well as the need to reach net zero to stabilise the increase in global temperature [2]. According to the IPCC [3], net-zero emissions are achieved when GHG emissions caused by human activities are balanced by anthropogenic removals [2]. The UK has established a pathway to achieve net zero in the transport sector and the energy sector. The goal is to decarbonise all forms of transport [4] by increasing cycling and walking, supporting the adoption of zero-emission buses, decarbonising railways, phasing out petrol and diesel cars, and accelerating maritime and aviation decarbonisation. On the other hand, the UK energy sector aims to support renewable energy generation using smart and flexible energy systems [5], defined as “one which uses smart technologies to provide flexibility to the system, to balance supply and demand and manage constrains on the network” [6] (p. 9). It has been highlighted that this flexibility can be provided by electricity storage, flexible demand, and flexible generation [5].
Integral to both transport and energy plans is the transition to electric mobility. For instance, from the transport perspective, in the UK, plans are in place to stop the sale of diesel and petrol cars by 2030 [6] and to support the deployment of charging infrastructure to fulfil drivers’ needs and establish a circular economy for the batteries of electric vehicles (EVs) [7]. The plan for the decarbonisation of transport recognises the need to expand the electricity system to absorb the load from EVs, which may increase energy demand by up to 20% by 2050, compared to a system without EVs [7].
From the energy system’s perspective, it is recognised that EVs will represent a significant increase in energy demand; however, it also represents an opportunity to add flexibility to the energy system [8]. For instance, it is expected that technologies such as smart charging could support the grid by avoiding charging during peak time, and vehicle-to-grid (V2G) could be used to send the energy stored in EVs back to the grid on demand (e.g., at peak electricity demand) [8].
The concept of using electric vehicles as energy storage and support for the energy grid was first published by Kempton and Letendre in 1997 [9]. According to the authors, some of the benefits of this new technology are the capacity to support the grid as a backup in case of power outages and the low cost that EVs would represent in comparison to electric generation infrastructure. In 2001, Kempton et al. [10] defined vehicle-to-grid (V2G) as “…using the electric storage and/or generation capacity of battery, hybrid and fuel cell vehicles to send power to the grid” (p. 1). The authors also described that this technology would provide air-pollution benefits in three ways: (i) incentivising drivers to switch to EVs by generating an economic revenue from selling the energy stored in their vehicles; (ii) supporting the energy grid during peak times and emergency generation, conditions that are usually covered by fossil fuel plants; and (iii) storage of renewable sources, such as wind and solar [10].
According to Waldron et al. [11], despite V2G technology being developed more than 20 years ago, studies and publications have been ramping up over the last few years. This recent deployment of the technology is explained by the increasing uptake of EVs, the increased capacity of renewable energy generation, technology development (e.g., battery capacity), and the need to reduce carbon emissions from the transport and energy sectors [11].
There are currently multiple V2G trials in the UK, developing different business cases. For instance, EDF Energy proposed V2G for business by providing the charger, installation, and maintenance [12]. The benefits for the end user are estimated to be around 9000 miles per year of electric fuel to run their vehicle for free if they connect every day from 4:30 p.m. to 8:00 a.m. of the next day. Octopus Energy, with the project Powerloop [13], offered a bundle for domestic users, including leasing of a vehicle, providing a charger and the option to connect the vehicle 12 times per month between 6:00 p.m. and 5:00 a.m. to obtain a cashback benefit of GBP 30 on the user’s energy bill. Project Sciurus [14] offered a charger and an app to control and schedule the charging sessions. The energy from the vehicle would be used to power the user’s home, and any excess would go back to the grid. The economic incentive was 30 pence per kilowatt hour discharged [15]. The Electric Nation V2G trial [16] offered users a minimum reward of GBP 120 per year and the possibility to keep the V2G charger for GBP 250 at the end of the trial.
However, according to Sovacool et al. [17], environmental performance is one of the underexamined topics of vehicle-to-grid. In a review of 197 publications between 2015 and 2017, the authors observed that only 10% of studies reviewed carbon emissions [17]. The carbon emissions generated during the operation of an EV come from the carbon intensity of the electricity used to charge them [17]. It is estimated that whereas an internal combustion engine light car emits between 95 and 147 gCO2/km, an EV with unmanaged charging and smart charging would emit between 35 and 52 gCO2/km [18]; however, these figures would be reduced as the grid is decarbonised. Moreover, V2G-enabled vehicles would allow for a reduction in overall system emissions through offset of grid demand, with studies suggesting they can have effective negative carbon emissions between −116 and −243 gCO2/km [18]. In the report Future Energy Scenarios for the UK [19], it is forecasted that unmanaged EV charging could increase peak electricity demand by more than 25 GW by 2040, implementing smart charging would result in a peak demand of around 10 GW, whereas V2G could reduce the peak demand by nearly −8 GW by 2040. Additionally, O’Malley et al. [20] estimated that V2G-enabled fleets can reduce system operation costs by up to GBP 12,000 and CO2 emissions by up to 60 tonnes per year.
The carbon reductions from optimally managed vehicle-to-grid come from several sources:
-
(i) Managing charging demand of the vehicle: as with one-directional (V1G) smart charging, recharging the vehicle battery after use of the vehicle itself is timed to offset charging to when the grid carbon intensity is low. This reduces carbon emissions relative to unmanaged charging of the same vehicle.
-
(ii) EVs as battery storage: using any available battery capacity from EVs to store energy at times when system carbon intensity is low allows for strategic discharging of this stored energy when carbon intensity is high. In this way, the EV battery can be used to effectively offset carbon emissions from its surrounding system (applicable at the scale of local buildings, the local energy grid, or the wider national grid).
-
(iii) EVs to support renewable energy application: as renewable energy is an intermittent source, using EVs as storage when renewable generation is high can facilitate the most effective use of low-carbon generated energy. This method is particularly important in localised energy systems where renewable generation can exceed local demand. V2G can increase local self-consumption of renewables and potentially offset the need for dedicated local battery storage.
-
(iv) Optimising the battery ageing process: it has been shown that managed V2G charging schedules could reduce EV battery ageing [21], potentially reducing the embedded carbon associated with EV battery production across a vehicle’s lifetime. Given the complexity of modelling required to determine effects of charging on the vehicle battery, this source is beyond the scope of this paper and is not considered further in the methods presented.
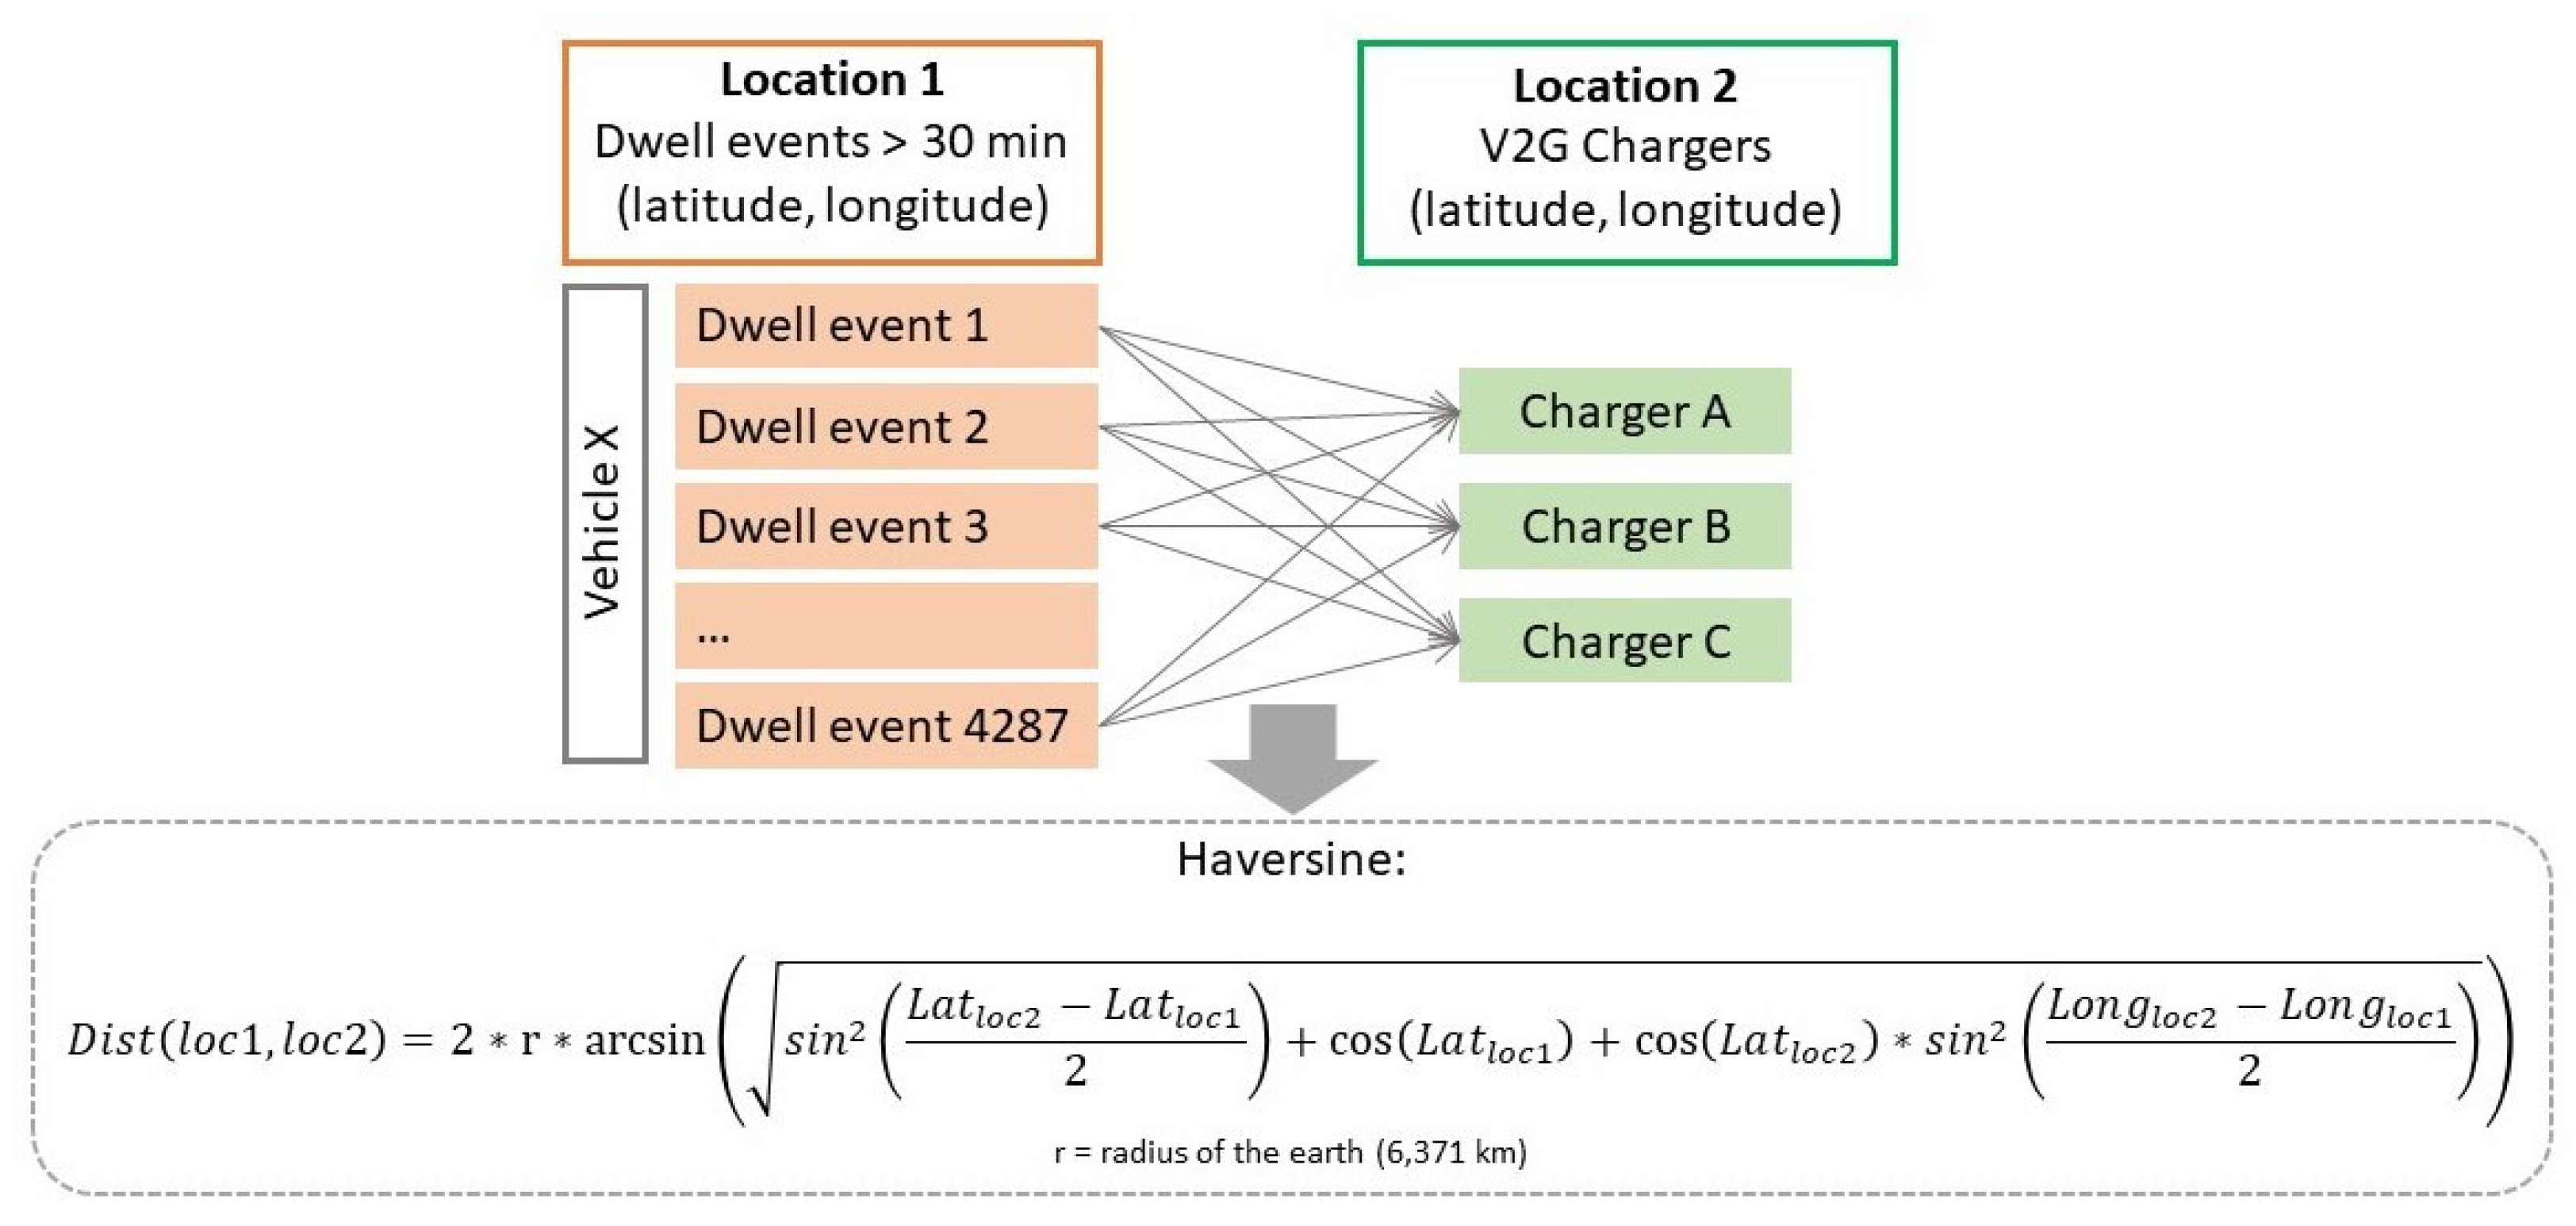
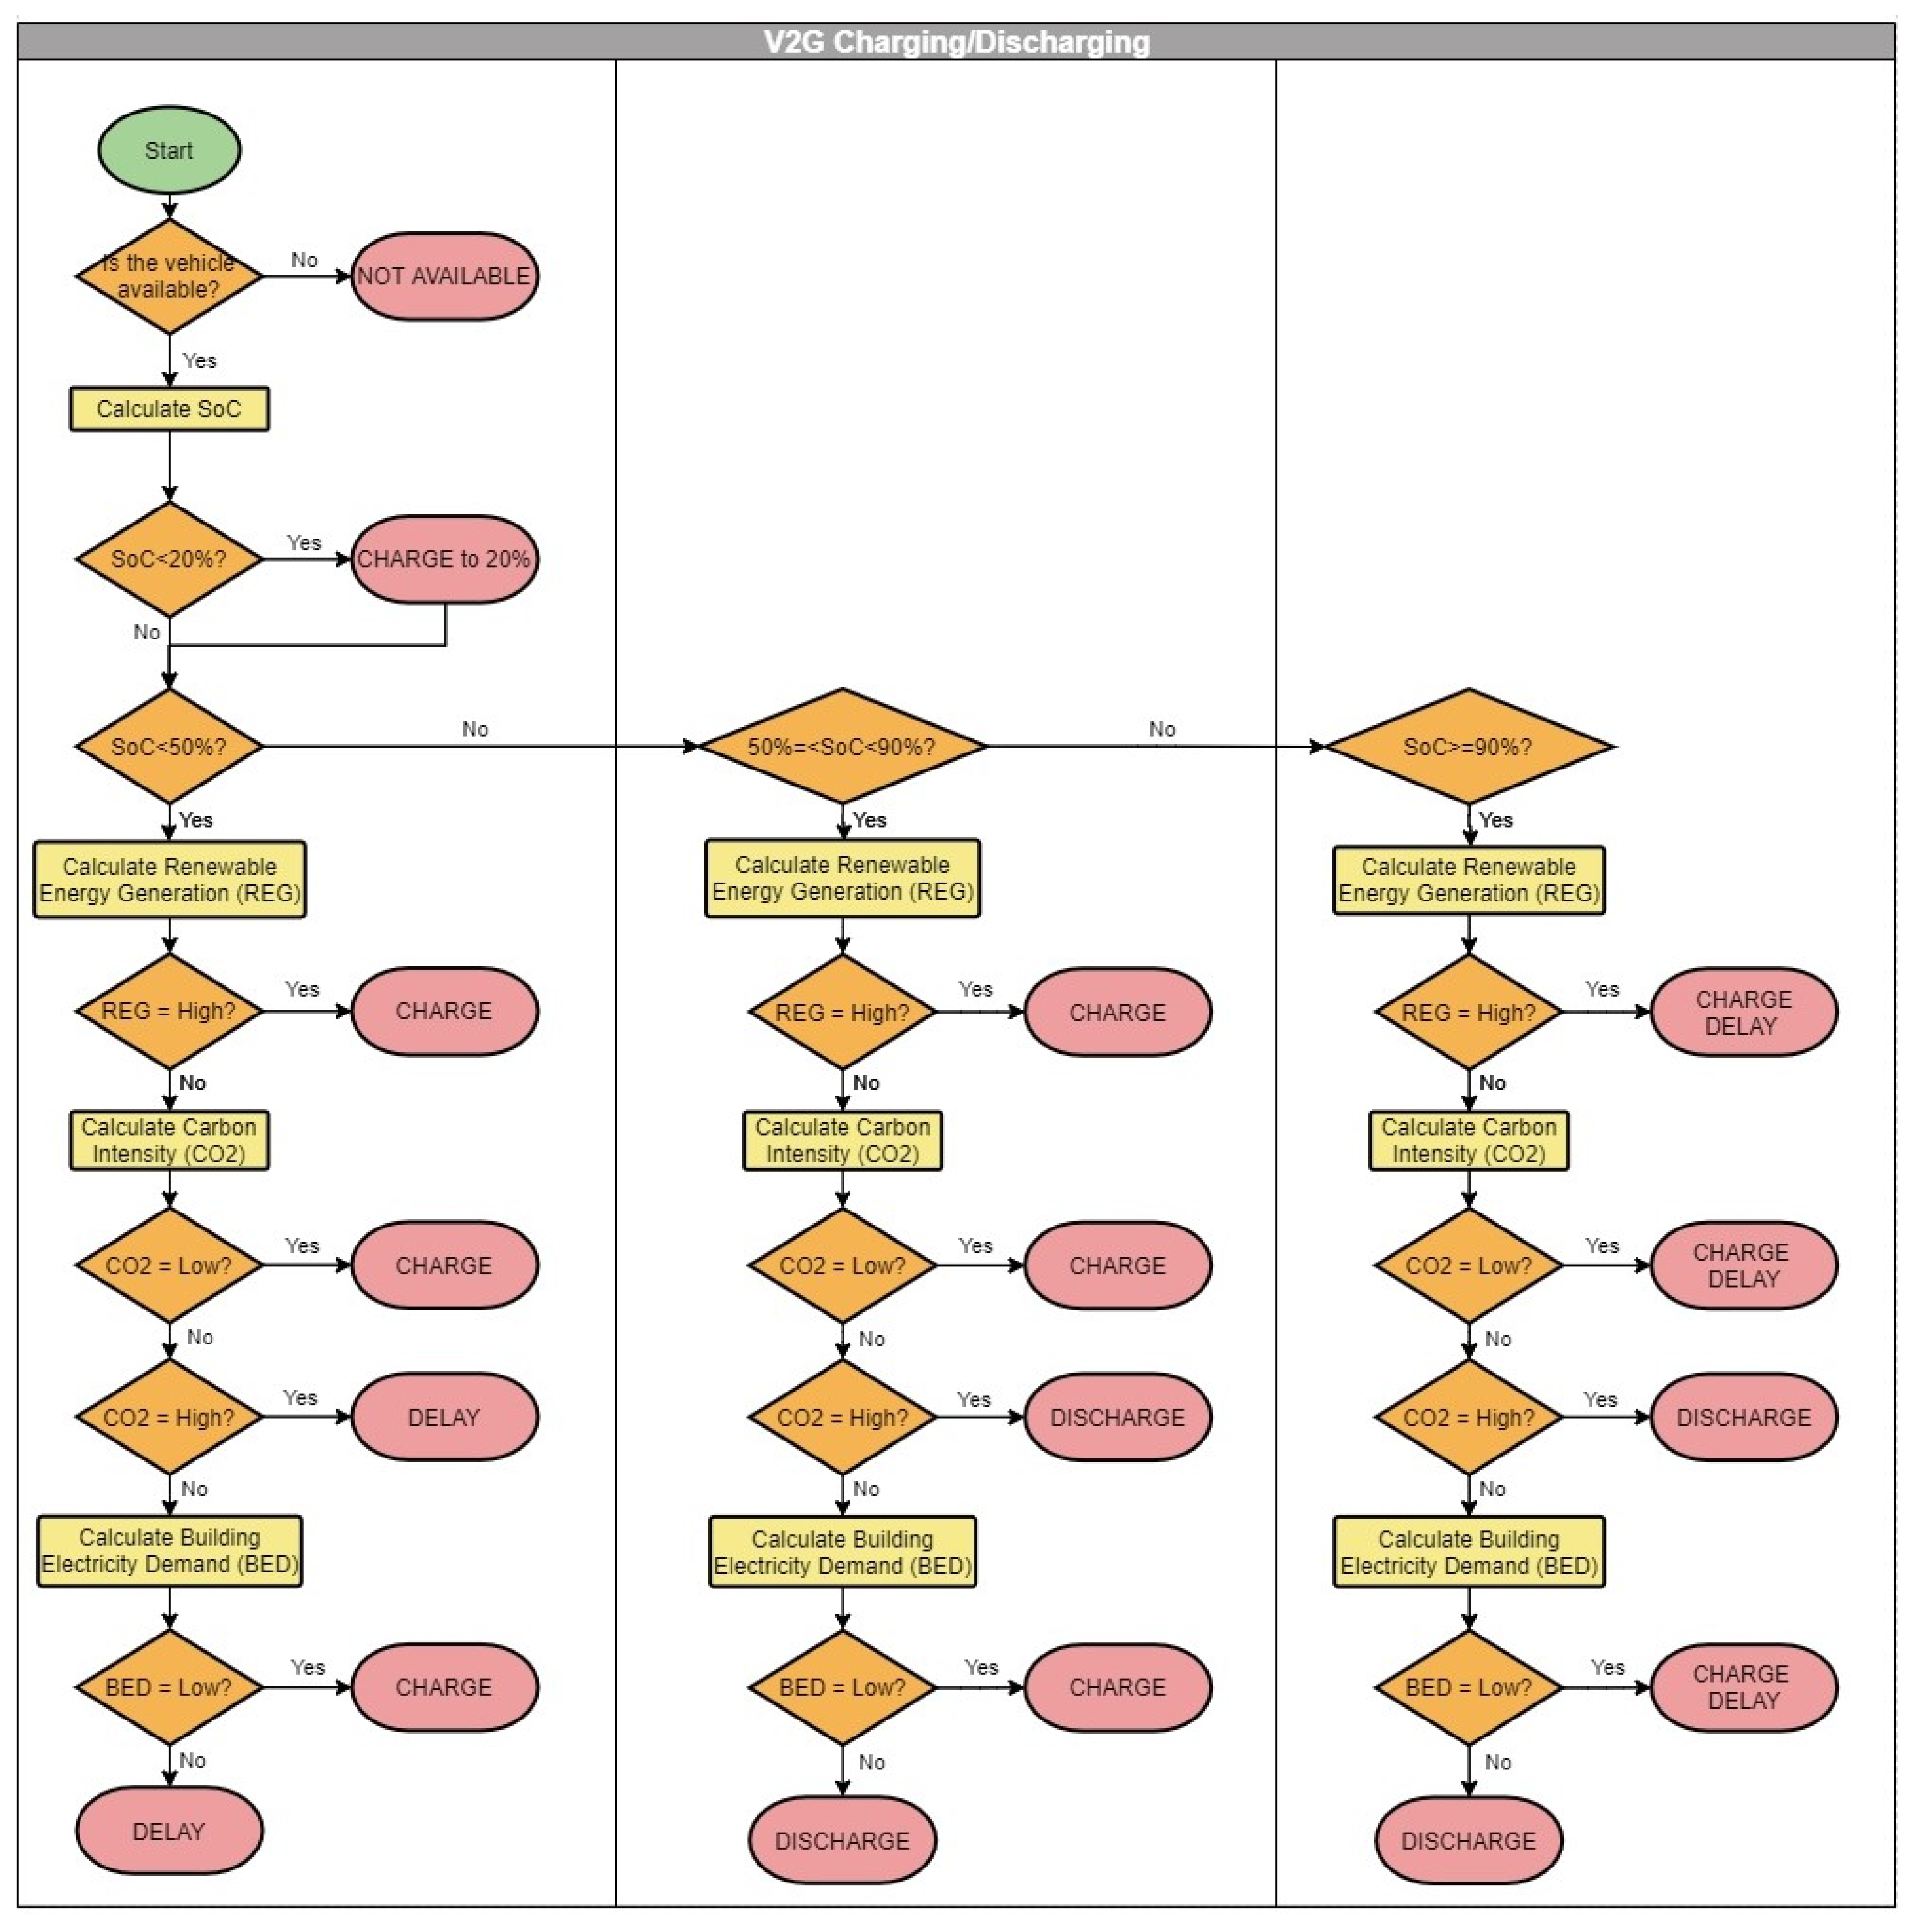
In this paper, the authors present a scenario of integrating vehicle-to-grid in an existing fleet without affecting current service provision, with the aim of reducing carbon emissions from the building energy demand and vehicle operation. To achieve this, the following method was developed: (1) assessment of the strategic location of charging infrastructure based on the vehicles’ behaviour; (2) definition of the charging/discharging profile, prioritising CO2 emission reduction according to the building’s energy demand, renewable energy generation, and grid carbon intensity; and (3) calculation of the carbon savings of the system through simulation. The outcomes of this paper indicate that vehicle-to-grid can reduce the average CO2 intensity per kilowatt in all the scenarios tested. Additionally, it was found that the vehicles analysed can easily make the transition to electric and integrate V2G, as 99.5% of the time, the vehicles fulfilled the charge required for their journeys.

2. Materials and Methods

In this work, the authors designed a method to quantify the benefits of charging and discharging electric vehicles to reduce carbon emissions, simulating scenarios for vehicle-to-grid using real-world data from vehicle behaviour, electricity demand, energy generation, and grid carbon intensity. The University of Nottingham was selected as a case study due to its infrastructure and access to data, which allowed us to focus on the nexus of transport, buildings, and energy. The University has 50 vehicles providing different services around the campuses (Figure 1) in Nottingham, such as estates, security, mailroom, transport, grounds, and catering services. For this work, one subsection of the fleet was selected for further analysis due to its suitability for V2G operation, with vehicles that remained stationary for long periods of the day, each parked in a consistent location on campus. This fleet comprises five vehicles, for which one year of historic data was available. Four of the vehicles of this fleet are diesel, and one is a non-V2G-compatible electric vehicle. The V2G scenarios explored in this paper are simulated, assuming V2G-compatible vehicles undertaking the same usage behaviours.

2.1. Data Sources

  • Telematics: This dataset was gathered by a telematics system installed in the fleet [22] and filtered by Shipman et al. [23,24]. The dataset of the five vehicles contains details of 23,449 journeys made between 1 January 2019-00:00:00 and 31 December 2019-23:59:59. The variables registered in the dataset were the start and end date/time of each journey, start and end latitude and longitude, start and end odometer, and distance travelled.
  • Building Energy Demand (BED): The data from the University buildings were facilitated by the Energy Management team from the University of Nottingham. The dataset contained the energy consumed in kilowatt hours every 30 min per building during the period from 1 January 2019-00:00:00 to 31 December 2019-23:59:59.
  • Renewable Energy Generation (REG): The data from the renewable energy generation at the university campuses was facilitated by the Energy Management team from the University of Nottingham. The datasets contained the energy in kilowatt hours every 30 min generated by the solar photovoltaics (PV) installed at different sites between 1 January 2019-00:00:00 and 31 December 2019-23:59:59. For the University Park campus, renewable energy generation from three buildings was considered, and for the Jubilee campus, generation from eight buildings was included.
  • Grid Carbon Intensity (CO2): These dataset was retrieved from the National Energy Grid Carbon Intensity API [25], which allows for download of UK data in batches of 30 days. The raw data from January to December 2019 contained the actual carbon intensity in grams of CO2 per kilowatt hour (gCO2/kWh), the forecast carbon intensity (gCO2/kWh), and an index (very low, low, moderate, high, very high). The index was developed by Bruce et al. [26] to illustrate times when carbon intensity is high or low.
  • Exceptions: Bank holidays and university holidays were treated as weekends, as the data showed they were not significantly different. This included the following dates:
    • Bank holidays: 1 January 2019, 19 April 2019, 22 April 2019, 06 May 2019, 27 May 2019, 26 August 2019, 25 December 2019, and 26 December 2019.
    • University holidays: 23 April 2019, 23 December 2019, 24 December 2019, 27 December 2019, 30 December 2019, and 31 December 2019.
  • Sensitive information: data such as individual characteristics of the vehicles/drivers or tasks were anonymised. This study was approved by the Ethics Committee of the Faculty of Engineering of the University of Nottingham and the University Estates team.

2.2. Data Analysis

The data analysis was conducted in four stages:

2.2.1. Stage 1: Vehicle Behaviour Analysis

  • Descriptive statistics: The dataset was filtered to exclude journeys when the vehicles were idling (distance below 0.01 miles). Descriptive statistics of the journeys were generated using SPSS to understand the driving patterns of the different vehicles.
  • Location of the chargers: The ‘dwell events’ refer to the moments when the vehicles were stationary. As the dataset was only integrated by the journeys of the vehicles, the dwell events were estimated by calculating the difference between the start time of a journey and the end time of the previous journey. Initially, the dataset was filtered to only include dwell events longer than 60 min to identify the location where the vehicles were stationary for longer periods. The list with the coordinates of these events was processed using the Folium library in Python. In this analysis, Folium allowed for visualisation of the location datapoints in a Leaflet map [27]. This analysis provided the identification of three strategic locations for chargers for the five vehicles. The locations were identified as A, B, and C, with location A being the primary dwell location for one vehicle, B the primary location for three vehicles, and C the location for one vehicle. As all vehicles were found to typically dwell overnight at these locations, concurrent overnight use of chargers at Location B required three chargers at this location. Locations A and C were assigned one charger each. Connection to the V2G system was assumed to only occur at the primary dwell location for each vehicle.
  • Vehicle availability: As not every dwell event would allow an electric vehicle to charge or discharge, the first parameter to define vehicle availability for V2G was assessed by filtering the cases to only include dwell events longer than 30 min, providing a reasonable assumption that drivers are less likely to plug in their vehicles for short dwells. This dataset and the location of the chargers identified as A, B, and C in the previous section were used to calculate the distance between vehicles and chargers using the Haversine tool in Python, which uses the equation described by Shipman et al. [23] (Figure 2).
Figure 2. Process to calculate the distance between vehicles and chargers.
Energies 15 02447 g002
  • Haversine calculates the distance between two points on earth using the latitude and longitude (equation presented in Figure 2). After this calculation, a filter was created to check whether the distance between the vehicle and the charger was below 100 m (distance < 100 m, 1, 0) and would be available to connect.
  • Primary dwell location: The data was filtered to identify the location of the vehicles during each dwell event. The outcomes were recorded per minute as: A, B, C, other, or driving/short dwell. The letters refer to the location of the V2G charger. The analysis also included ‘other’ dwell events longer than 30 min that occurred at different locations and ‘driving/short dwell’, which was driving times or dwells shorter than 30 min. The analysis was filtered per location to identify the dwell pattern of the vehicles at each site.
  • Battery state of charge: Although the vehicles analysed were not V2G-compatible, (four diesel and one electric), the simulated V2G scenario assumed operation of V2G-compatible vehicles making the same journeys as those in the historic dataset. In the UK, there are few V2G compatible vehicles on the market, including the Nissan LEAF, Nissan e-NV200, and Mitsubishi Outlander PHEV, due to their CHAdeMO charging technology. As the closest comparable V2G-compatible vehicle, the technical specifications of the Nissan e-NV200 40 kWh were considered to calculate the battery state of charge (SoC). The electricity consumption of the vehicles was estimated based on an average consumption of the Nissan e-NV200 at 417 Wh/mile [28].

2.2.2. Stage 2: Building Energy Demand, Renewable Energy Generation, and Carbon Intensity Analysis

  • Building Energy Demand (BED): The energy demand from the buildings located next to the V2G chargers was analysed. The buildings identified as A, B, and C contained energy readings every 30 min. Therefore, to match the vehicle data, which were available per minute, the half-hour values were copied to provide readings per minute. These data were only used to support a clustering analysis to identify times of low, medium, and high energy demand. The datasets of the three buildings were processed to obtain the descriptive statistics and k-means cluster analysis in SPSS, where k = 3 was defined to identify the thresholds of the building energy demand when this was low, medium, or high.
  • Renewable Energy Generation (REG): Building A is located at Jubilee Campus, and buildings B and C are located at University Park Campus (Figure 1). The available renewable energy generation data from each campus was analysed. The data contained readings every 30 min; therefore, the values were copied as described for the BED. Similarly, the dataset was processed using k-means clusters, where k = 3 was defined to identify the thresholds of the renewable energy generation of the campuses when the energy generation was null/low, medium, or high.
  • Grid Carbon Intensity (CO2): Like the BED and REG analyses, the 30 min CO2 dataset was expanded. Bruce et al. [26] categorised the grid carbon intensity as very low (0–59 gCO2/kWh), low (60–159 gCO2/kWh), moderate (160–259 gCO2/kWh), high (260–359 gCO2/kWh), and very high (360+ gCO2/kWh); in this research, we used the thresholds for low, medium, and high.

2.2.3. Stage 3: Data Integration and V2G Assessment

The previously described datasets were integrated to define the possible scenarios for vehicle-to-grid by prioritising the environmental benefits. The data were computed considering the status of the vehicles, battery state of charge, renewable energy generation, carbon intensity, and building energy demand per minute to determine whether the vehicle should charge, discharge, or delay charge/discharge.
Table 1 presents the parameters used for the calculations. The vehicle availability was defined by two factors: (i) whether the vehicle was stationary and (ii) whether the vehicle was close to a V2G charger. The minimum state of charge accepted was defined by the mean battery percentage required to operate the vehicle in a day; this was extracted from the maximum mean daily distances of the vehicles in the descriptive statistics, and it was established to guarantee that the vehicle would always top up to reach the minimum. The battery state of charge (SoC) allowed for determination of whether the vehicle would have capacity to charge or discharge as follows:
If the SoC < 50%, then the vehicle would require charging.
If the SoC was between 50% and 90%, then the vehicle would be available to charge or discharge.
If the SoC > 90%, then the vehicle would be mainly available to discharge (however, the option to complete charging up to 100% was also included for the times when the carbon intensity of the grid was low).
The BED, REG, and CO2 thresholds were also integrated to determine the V2G scenarios.
Figure 3 presents a flowchart of the steps proposed to compute the variables for a vehicle-to-grid model that prioritises the reduction in carbon emissions from the grid and the vehicle by minimising interaction with the outside grid and stress on local infrastructure. The first step checked whether the vehicle was available to connect to the V2G charger. The second and third steps estimated the state of charge of the battery. Then, the fourth step checked the generation of renewable energy, the fifth step revised the grid carbon intensity, and the final step checked the building energy demand. This process determines whether the vehicle was ‘not available’ or should ‘charge’, ‘discharge’, or ‘delay’.
The charging/discharging scheme represented in Figure 3 was then applied to the vehicle historic data through simulation to assess the effect of vehicle charging on the system carbon emissions. A model of vehicle charge/discharge using the previously described parameters was implemented in Python.

2.2.4. Stage 4: Carbon Emissions Calculations

To assess the carbon emissions of the system, a separate simulation was completed for each location (A, B, and C) with their corresponding vehicles.
The simulation was run by iterating through the historical datasets of vehicle usage, building energy demand, renewable generation, and grid carbon intensity to simulate operation of the control system in real time. The battery state charge of each vehicle was updated for each minute of the time period according to the estimated demand from driving and V2G energy transactions with the building/grid system. Charge instructions for each vehicle were then recalculated at each timestep based on the state of charge. Net energy supply or demand from the fleet to each building location was then calculated for each timestep. The carbon emissions per timestep were calculated based on the sum of building energy demand, renewable generation, and fleet energy. In timesteps where the total transaction with the renewables–building–vehicle system was an energy import, carbon intensity was taken as the UK grid carbon intensity at that timestep. Where the total system transaction was an energy export, this was counted as a carbon saving equal to the grid carbon intensity at that timestep.
The analysis was conducted by integrating the data per building; for each building, three scenarios were tested:
  • Baseline System Demand: the buildings’ energy demand minus the renewable energy generation with no EVs present in the system.
  • Unmanaged EV Charging: the energy demand and carbon emissions added by charging the EVs immediately upon their arrival to the building.
  • V2G Charging: estimated energy demand and carbon imports by applying the V2G ruleset described in Figure 3.
The outcomes include the following measures:
-
Total Net Energy Import (kWh): the sum of all imports to and exports from the system of buildings, renewables, and vehicles over the simulated year.
-
CO2 from 1 year System Net Import (kg): sum of CO2 released by energy imports minus CO2 saved by exports from the system at each timestep over the year.
-
Average CO2 Intensity (campus energy only) (gCO2/kWh): sum of CO2 divided by the sum of energy used by the system.
-
Instances of Vehicle Battery Depletion: the number of times that a simulated vehicle ran out of battery within the simulated year.
-
CO2 from 1 year external top up (kg): where vehicles were unable to fulfil their demand from driving, using the simulated on-campus charging hardware and rulesets, it was assumed that the vehicles would need to rely on external charging when the battery became very low. This was counted as an ‘external’ energy cost, with CO2 intensity calculated based on grid intensity at the time of battery depletion.
-
Average CO2 intensity (campus + external): sum of CO2 from the system and from external energy caused by battery-depletion events divided by the sum of energy used by the system and external energy used for battery recharge.
As the impact of one vehicle on the energy demand can be low in comparison to the total energy of the system, additional simulation scenarios were completed assuming 10 vehicles connected at each of the buildings. This was calculated by extrapolating vehicle behaviour at each building based on the available vehicles.

3. Results

The results are presented and discussed for each stage.

3.1. Stage 1: Vehicle Behaviour Analysis

Descriptive statistics: The analysed dataset contained 23,449 journeys from five vehicles. Table 2 shows the descriptive statistics of the vehicles and the journeys. The mean distance travelled by the fleet per day was 14.3 miles, and the maximum distance registered by a vehicle in a single day was 70.6 miles.
Figure 4 presents the distribution of the journeys per hour of the day, per day of the week, and per month. In the 24 h period, it was observed that the vehicles started activities at 6 h and finished at 22 h. Vehicle 5 was the most active vehicle at the end of the day. The peak time in the morning was between 11 h and 12 h. The activity decreased at 13 h, and the peak of the afternoon occurred at 14 h. Most of the activity was reduced after 17 h. In the weekly analysis, it is observed that the activity is highly reduced over weekends, and vehicle 5 is the least used overall. In the monthly analysis, the activity of the vehicles was reduced during August, corresponding to university holidays.
Location of V2G chargers: The evaluated vehicles provide services on campus, such as delivering items or patrolling around. In this context, there are numerous events when the vehicles were stationary during the day; nevertheless, not all these dwell events would allow a vehicle to charge due to the short duration of the stop and/or the proximity to a charger. Table 3 shows the total dwell events per vehicle, as well as the number of events shorter than or equal to 60 min and longer than 60 min. It is observed that only 9% to 20% of the stops are longer than 60 min.
Figure 5 presents a geospatial analysis of the main dwell locations of the five vehicles using the dwell events longer than 60 min (n = 2460). The map captures the campuses of the University of Nottingham in the city (University Park Campus, Jubilee Campus, King’s Meadow Campus, and Queens Medical Centre—Medical School). In the heatmap, red means a high number of dwell events in that specific location. The most frequent locations for long dwell events were identified as A, B, and C. A radius of 100 m was defined to consider when a vehicle was close to any of these charging locations.
Vehicle Availability: The availability of the vehicles to connect to a charger is presented in Figure 6. Dark blue means that all vehicles were available to connect. This fleet is mainly available to connect during the evenings, as the vehicles were away from the charger between 08:00 to 13:00 h and 14:00 and 16:00 h.
Table 4 presents the percentage of time that vehicles of the fleet were available for a V2G connection. For example, the vehicles were simultaneously stationary next to a charger 55% of the time. This percentage was even higher during weekends (72%). Only 2% of the time were none of the vehicles available to connect.
Primary dwell location: Table 5 contains the percentage of time per vehicle spent at each charger. Other dwell locations and the time spent driving are also included. The primary dwell location for vehicle 1 was A; for vehicles 2, 3 and 4 was B; and for vehicle 5 was C.
Figure 7 presents the average dwell in a 24 h period of the vehicles at locations A, B, and C. The results are differentiated between weekdays and weekends. In these graphs, a value of 100% would mean that the vehicle was parked at that specific location for the whole year. The results indicate that the vehicles typically each parked at their primary location (A, B, or C) overnight. Vehicle 1 was away from the charger after 6:00 h and returned around 16:00 h. Vehicles 2, 3, and 4 presented a similar operational pattern, starting activities at 6:00 h, returning to location B between 13:00 and 15:00 h, and ending operation around 16:00 h. This pattern indicates a possibility of using the vehicles as storage for renewable energy generated during the daytime. Vehicle 5 presented a variable starting time between 7:00 and 11:00 h and a lower probability to be in operation over the rest of the day until 23:00 h.

3.2. Stage 2: Building Energy Demand, Renewable Energy Generation, and Carbon Intensity

  • Building Energy Demand: The electricity demand from the buildings located near A, B, and C was analysed. Building A is used for academic and research activities, and it is located at the Jubilee Campus. Buildings B and C are student halls located at the University Park Campus. The descriptive statistics for the buildings’ electricity demand (kWh) are summarised in Table 6. The results were differentiated between seasons. The average demand for building A was 58 kWh, for building B was 34 kWh, and for building C was 38 kWh.
Table 6. Electricity demand (kWh) of buildings A, B, and C.
All YearWinterSpringSummerAutumn
Building A (kWh)
mean5857615758
minimum2032422024
maximum105968810596
std. deviation10108910
Building B (kWh)
mean3435342938
minimum1010121110
maximum101997474101
std. deviation1415121116
Building C (kWh)
mean3847412440
minimum1131611
maximum9898896097
std. deviation1614111216
Table 7 summarises the results of the cluster analysis, defining the low, medium, and high threshold of electricity demand for buildings A, B, and C. These thresholds were used as parameters for the V2G assessment.
Figure 8 corresponds to the heatmap of the electricity demand for buildings A, B, and C during 2019. Building A presented a uniform pattern across the year, with higher electricity demand during the day between 8:00 h and 18:00 h. The demand from building C was also higher during daytime, with peaks between 6:00 and 11:00 h and between 15:00 and 19:00 h. Conversely, Building C presented high energy demand from midnight to 6:00 a.m, with another peak between 15:00 and 19:00 h. The electricity demand from buildings B and C was highly reduced during the university holidays (April and June to September). Building C presented high electricity demand during the early hours of winter. It is also observed that the electricity demand was lower during summer for buildings B and C.
  • Renewable Energy Generation: Energy generation from photovoltaics is available at different buildings on the University of Nottingham campuses. Each campus works as an independent grid, where the surplus generated from one building is transferred to the university grid and used by other buildings. Therefore, the total energy generated by three buildings at the University Park and eight buildings at Jubilee campuses was analysed. The energy generation over the year and per season is summarised in Table 8. The maximum energy generated at the University Park campus was 61 kWh, and the maximum for Jubilee campus was 35 kWh.
Table 8. Renewable energy generation from photovoltaics at the University Park and Jubilee campuses (kWh per 30 min).
All YearWinterSpringSummerAutumn
University Park Campus (kWh)
mean739104
maximum6144606148
std. deviation11713139
Jubilee Campus (kWh)
mean41565
maximum3521343534
std. deviation63777
Note: Total data from three buildings from University Park and eight buildings from Jubilee Campus.
The results of the REG cluster analysis are shown in Table 9, defining the low, medium, and high threshold of electricity demand for buildings A, B, and C. These thresholds were used as parameters for the V2G assessment.
Figure 9 presents a heatmap of the energy generated across the year in and over a 24 h period. Both sites present a similar pattern; however, the capacity to generate energy at the University Park campus is higher. The generation time during summer is from 06:00 h to 18:00 h. This period is reduced to 09:00 to 15:00 h over winter. The highest peaks are achieved between 09:00 h and 15:00 h from March to September.
  • Grid Carbon Intensity: The carbon intensity of electricity import is a measure of the CO2 g produced per kilowatt hour of electricity consumed [26] (Bruce et al., 2021).
  • Table 10 summarises the descriptive statistics of the UK grid carbon intensity during 2019. The mean carbon intensity was 213.9 gCO2/kWh. Also presented are the carbon intensity thresholds for low, medium, and high emissions.
Table 10. UK energy grid carbon intensity (2019) and carbon intensity thresholds.
Grid Carbon Intensity (gCO2/kWh)All Year
mean213.9
minimum48
maximum447
std. deviation61.3
Carbon Intensity Thresholds
low0–159
medium160–259
high260+
Figure 10 corresponds to the UK carbon intensity during 2019. This analysis used the actual CO2 values; values missing in the data were replaced by the forecasted CO2 values for this timestep. It is evidenced that the intensity is variable across the days. However, there is a faded pattern, indicating a general trend towards higher intensity between 06:00 and 09:00 h and between 16:00 and 20:00 h.

3.3. Stage 3: Data Integration and V2G Assessment

Figure 11 shows the resulting charging and discharging instructions supplied to each vehicle under the charging scheme described in Figure 3. These instructions were calculated as part of the V2G simulation process described in Section 2.2.4. in which the battery state of charge was simulated through the full year of historic data and charge instructions were recalculated at each timestep based on the current status of the battery, building demand, renewables, and grid intensity. The results are presented per vehicle and differentiated between weekdays and weekends.
It is observed that the option to ‘discharge’ is recommended before the start of the shifts of vehicles 1–4. This is explained by the high carbon intensity of the grid at that time. According to the miles travelled per day and the battery state of charge of the vehicles at the end of the day, it can be assumed that the vehicles could support the grid by discharging between 6:00 a.m. and 8:00 a.m. The exception occurs for vehicle 5, where the option to ‘discharge’ is occasionally suggested in the early morning, which can be explained by the high electricity demand from building C at that time.
The analysis suggests that all vehicles could be used to support the storage of renewable energy from photovoltaics by charging during short stops in the daytime between April and October.
The recommended charging behaviour after the daily shifts for vehicles 1 to 4 was found to be dependent on their arriving state of charge (Figure 11). The primary action during the hours of 15:00–21:00 h was to delay charge, effectively offsetting charging load to lower-intensity times of the night. Due to the morning discharge event and the lack of daytime charging during winter, these vehicles were not at a sufficiently high state of charge to discharge during the evening CO2 peak. During the summer months, vehicles were typically discharged during the hours of 16:00–18:00 h and then delayed recharging until after 21:00 h. This outcome suggests that an option to further reduce CO2 emissions from a charging scheme would be reducing or delaying the morning discharge to ensure the daily CO2 peak intensity in the evening can be supported by a battery discharge from all vehicles.

3.4. Stage 4: Carbon Emission Calculations

The analysis was conducted for three locations: building A, B, and C. The calculations included the building energy demand, total renewable energy generation from each campus, the behaviour of the vehicles charging and discharging, and the grid carbon intensity.
The carbon emissions from energy import and energy demand analyses for each building are presented in Table 11, Table 12 and Table 13, including the ‘baseline system demand’, which refers to the buildings’ energy demand minus the renewable energy generation, with no electric vehicles. ‘Unmanaged EV charging’ indicates the energy demand and carbon emissions added by charging the EVs immediately upon arrival to a charger location, as well as the V2G, which estimated the energy demand and carbon imports by applying the V2G ruleset described in Figure 3.
It is observed that the total net energy import and CO2 from 1 year of system net imports increased with unmanaged charging. However, V2G allowed for a reduction in the average gCO2 per kWh despite adding additional energy demand from charging of the electric vehicles into the system. For instance, in Building A, this was reduced from 217.08 gCO2/kWh with unmanaged charging to 216.85 gCO2/kWh; this is further reduced to 214.97 gCO2/kWh when the fleet is increased to 10 vehicles. In Building B, the average CO2 intensity per kWh was reduced from 223.88 gCO2/kWh to 222.55 gCO2/kWh; this was further reduced to 218.93 gCO2/kWh when increasing the fleet size to 10 vehicles. Finally, Building C also presented a reduction from 222.13 gCO2/kWh with unmanaged charging to 221.83 gCO2/kWh with V2G; this was further reduced to 218.93 gCO2/kWh with 10 vehicles. Instances of battery depletion were observed for Buildings B and C; this occurred two times in a year for the V2G scenarios, which is equivalent to 0.2–0.5% of the time. The battery depletion caused a small increase in the average CO2 intensity, as the vehicle would require immediate charging.
In order to understand the impact of scaling up V2G, the carbon emissions with an increased fleet size of 10 vehicles for each building were also calculated. The simulation of vehicle charging/discharging over a 1-year period was repeated for the increased fleet size for both an unmanaged charging scheme and the proposed V2G scheme (Figure 12). For Buildings A and C, it is observed that one vehicle does not significantly impact the average CO2 emissions. Nevertheless, it is observed that in the case of Building B, three vehicles start to impact emissions, with the unmanaged charging scenario increasing energy demand and thus emissions during the higher-intensity periods during the daytime. The V2G scenario reduced emissions at peak times, concentrating charge activity towards lower-carbon-intensity periods during the night.
It is observed that the impact of unmanaged charging with a larger fleet was to further increase load during the daytime for Buildings A and B (Figure 12), including during periods of peak grid carbon intensity. Conversely, the V2G scheme was able to significantly flatten the average energy import load throughout the day by the combined mechanisms of diverting vehicle charging demand to times of lower carbon intensity and reduction in the existing buildings’ daily peak CO2 emission by discharging from the fleet’s batteries to reduce peak grid import.
The three cases in Figure 12 suggest higher carbon emissions than baseline for V2G from 9:00 p.m. to 4:00 a.m. This is explained both by the fact that the vehicles prioritise charging when the grid carbon intensity is lower and that battery capacity discharged during peak grid intensity must be recovered during low-intensity periods. As shown by the calculation results, the overall effect of this activity is a reduction in average CO2 intensity of the system.

4. Discussion

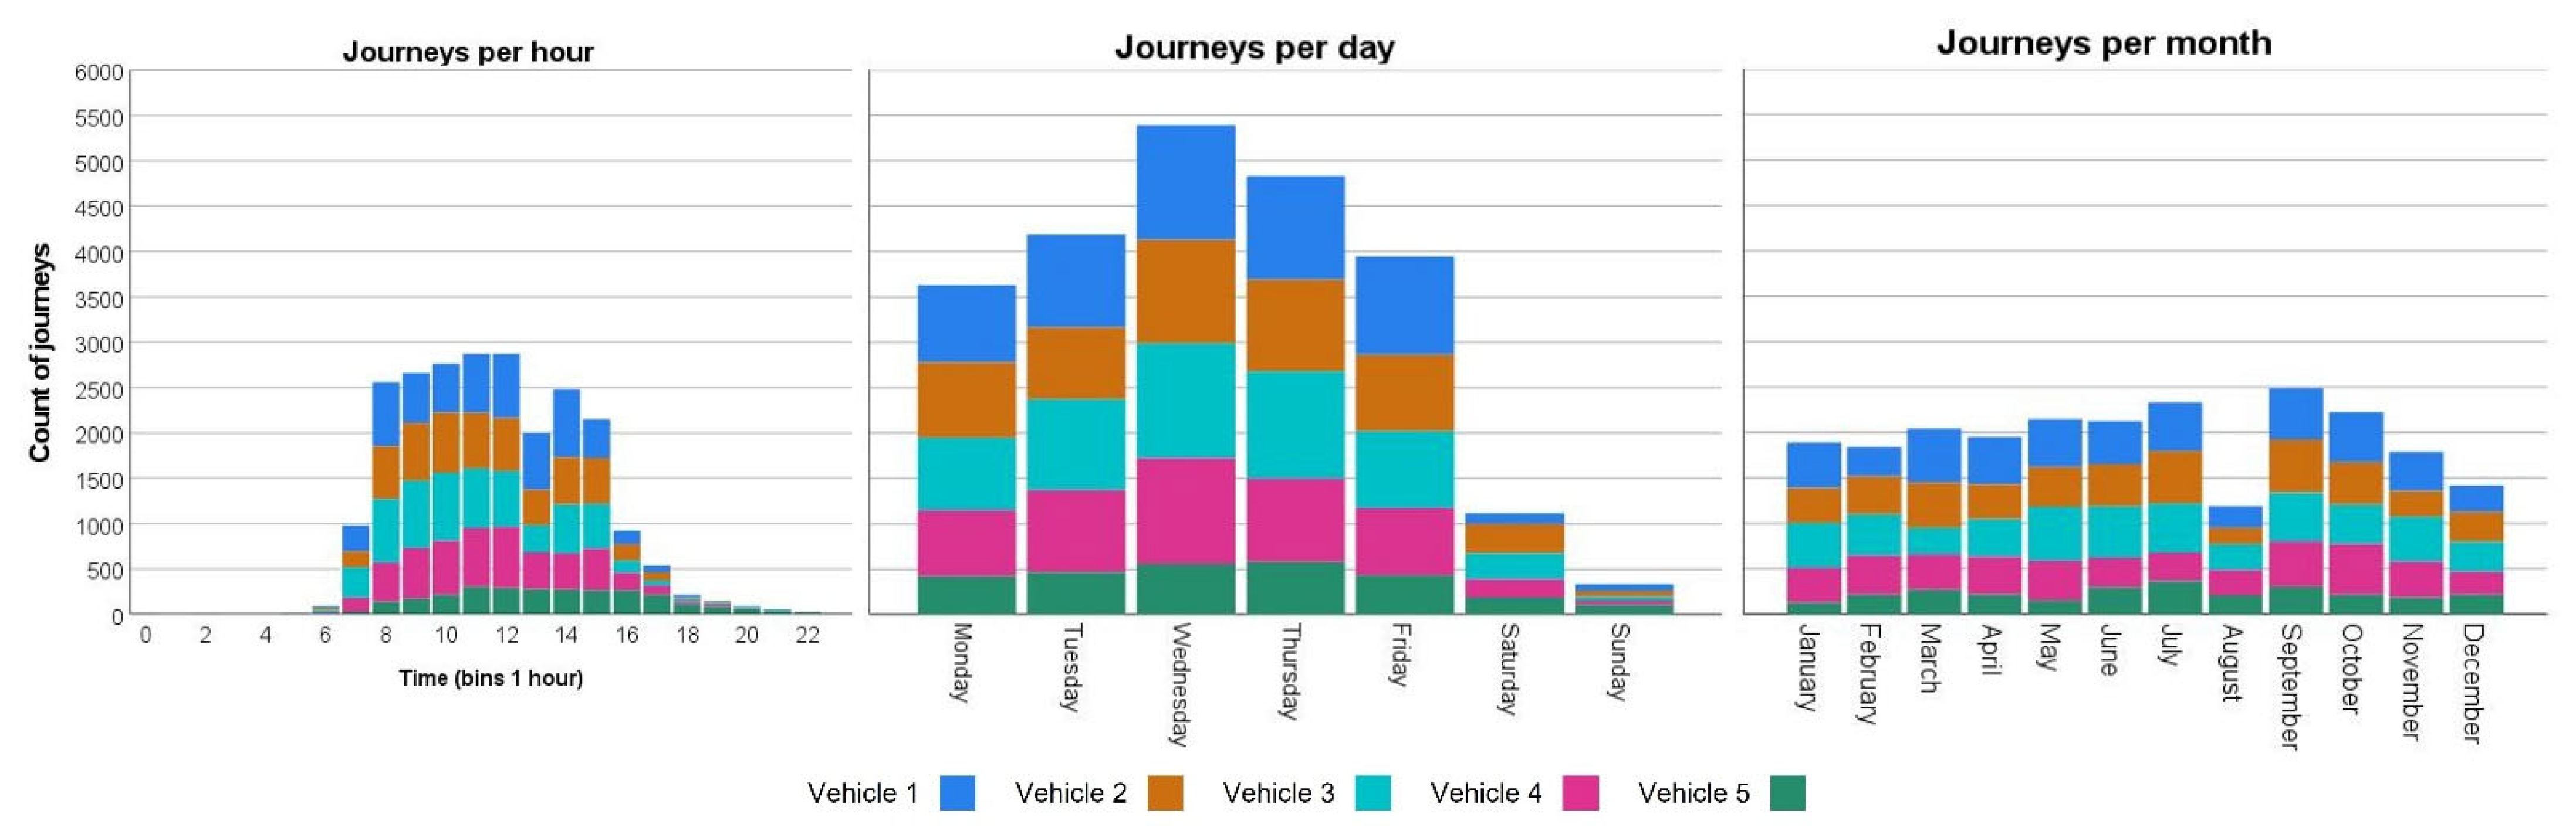
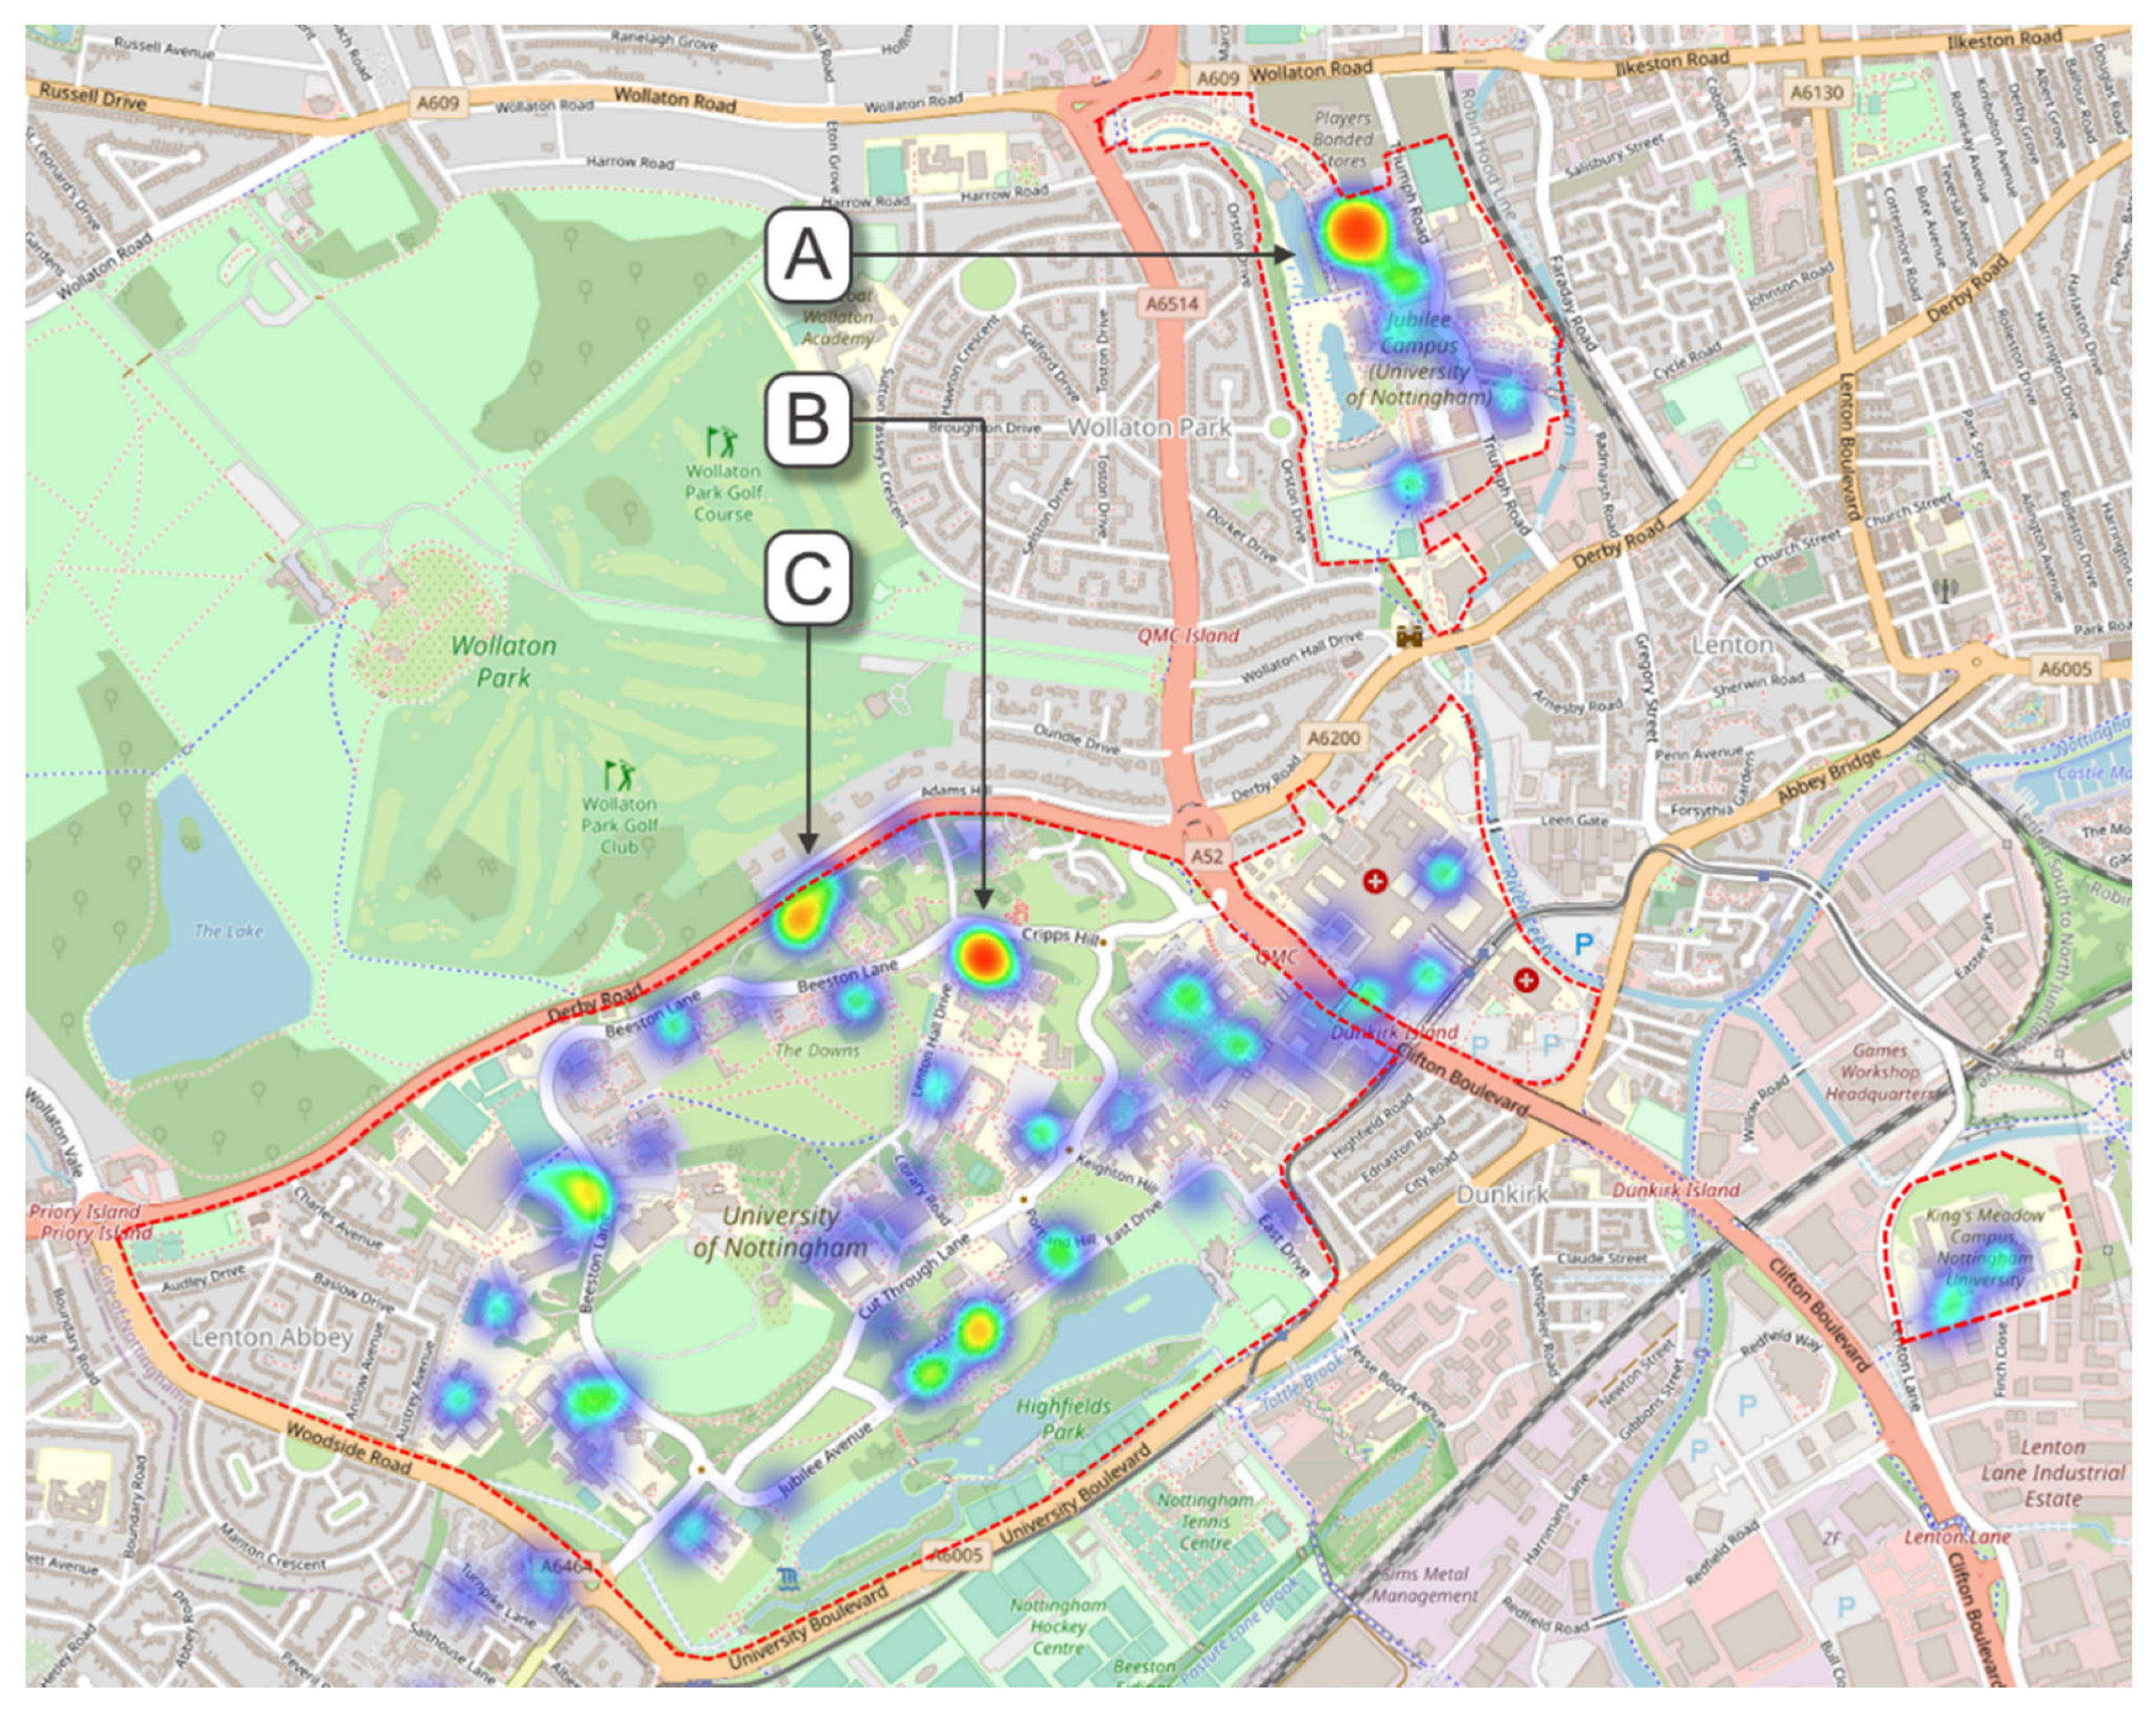
This research presented the potential contribution that charging infrastructure can make to reduce carbon emissions when integrating the energy storage capacity of EVs with the fluctuations of local energy demand and renewable energy generation. The vehicle behaviour analysis introduced the potential of using behaviour data to optimise the location of charging infrastructure and vehicle availability to store and discharge energy. Multiple different approaches to plan electric vehicle charging infrastructure are reported in the literature, such as the node-based approach to minimise the number of chargers while fulfilling the demand of all users; the path-based approach, which aims to provide charging services in common pathways; and the tour-based approach, which estimates charging demand based on parking demand [29]. For the case of vehicle-to-grid, it was found that only 10% of the stops of the vehicles were longer than one hour, which means that not every stop represents an opportunity to connect to a charger. In this way, a tour-based approach to parking demand considering vehicles energy storage assets would be the most suitable pathway to identify strategic locations for V2G infrastructure.
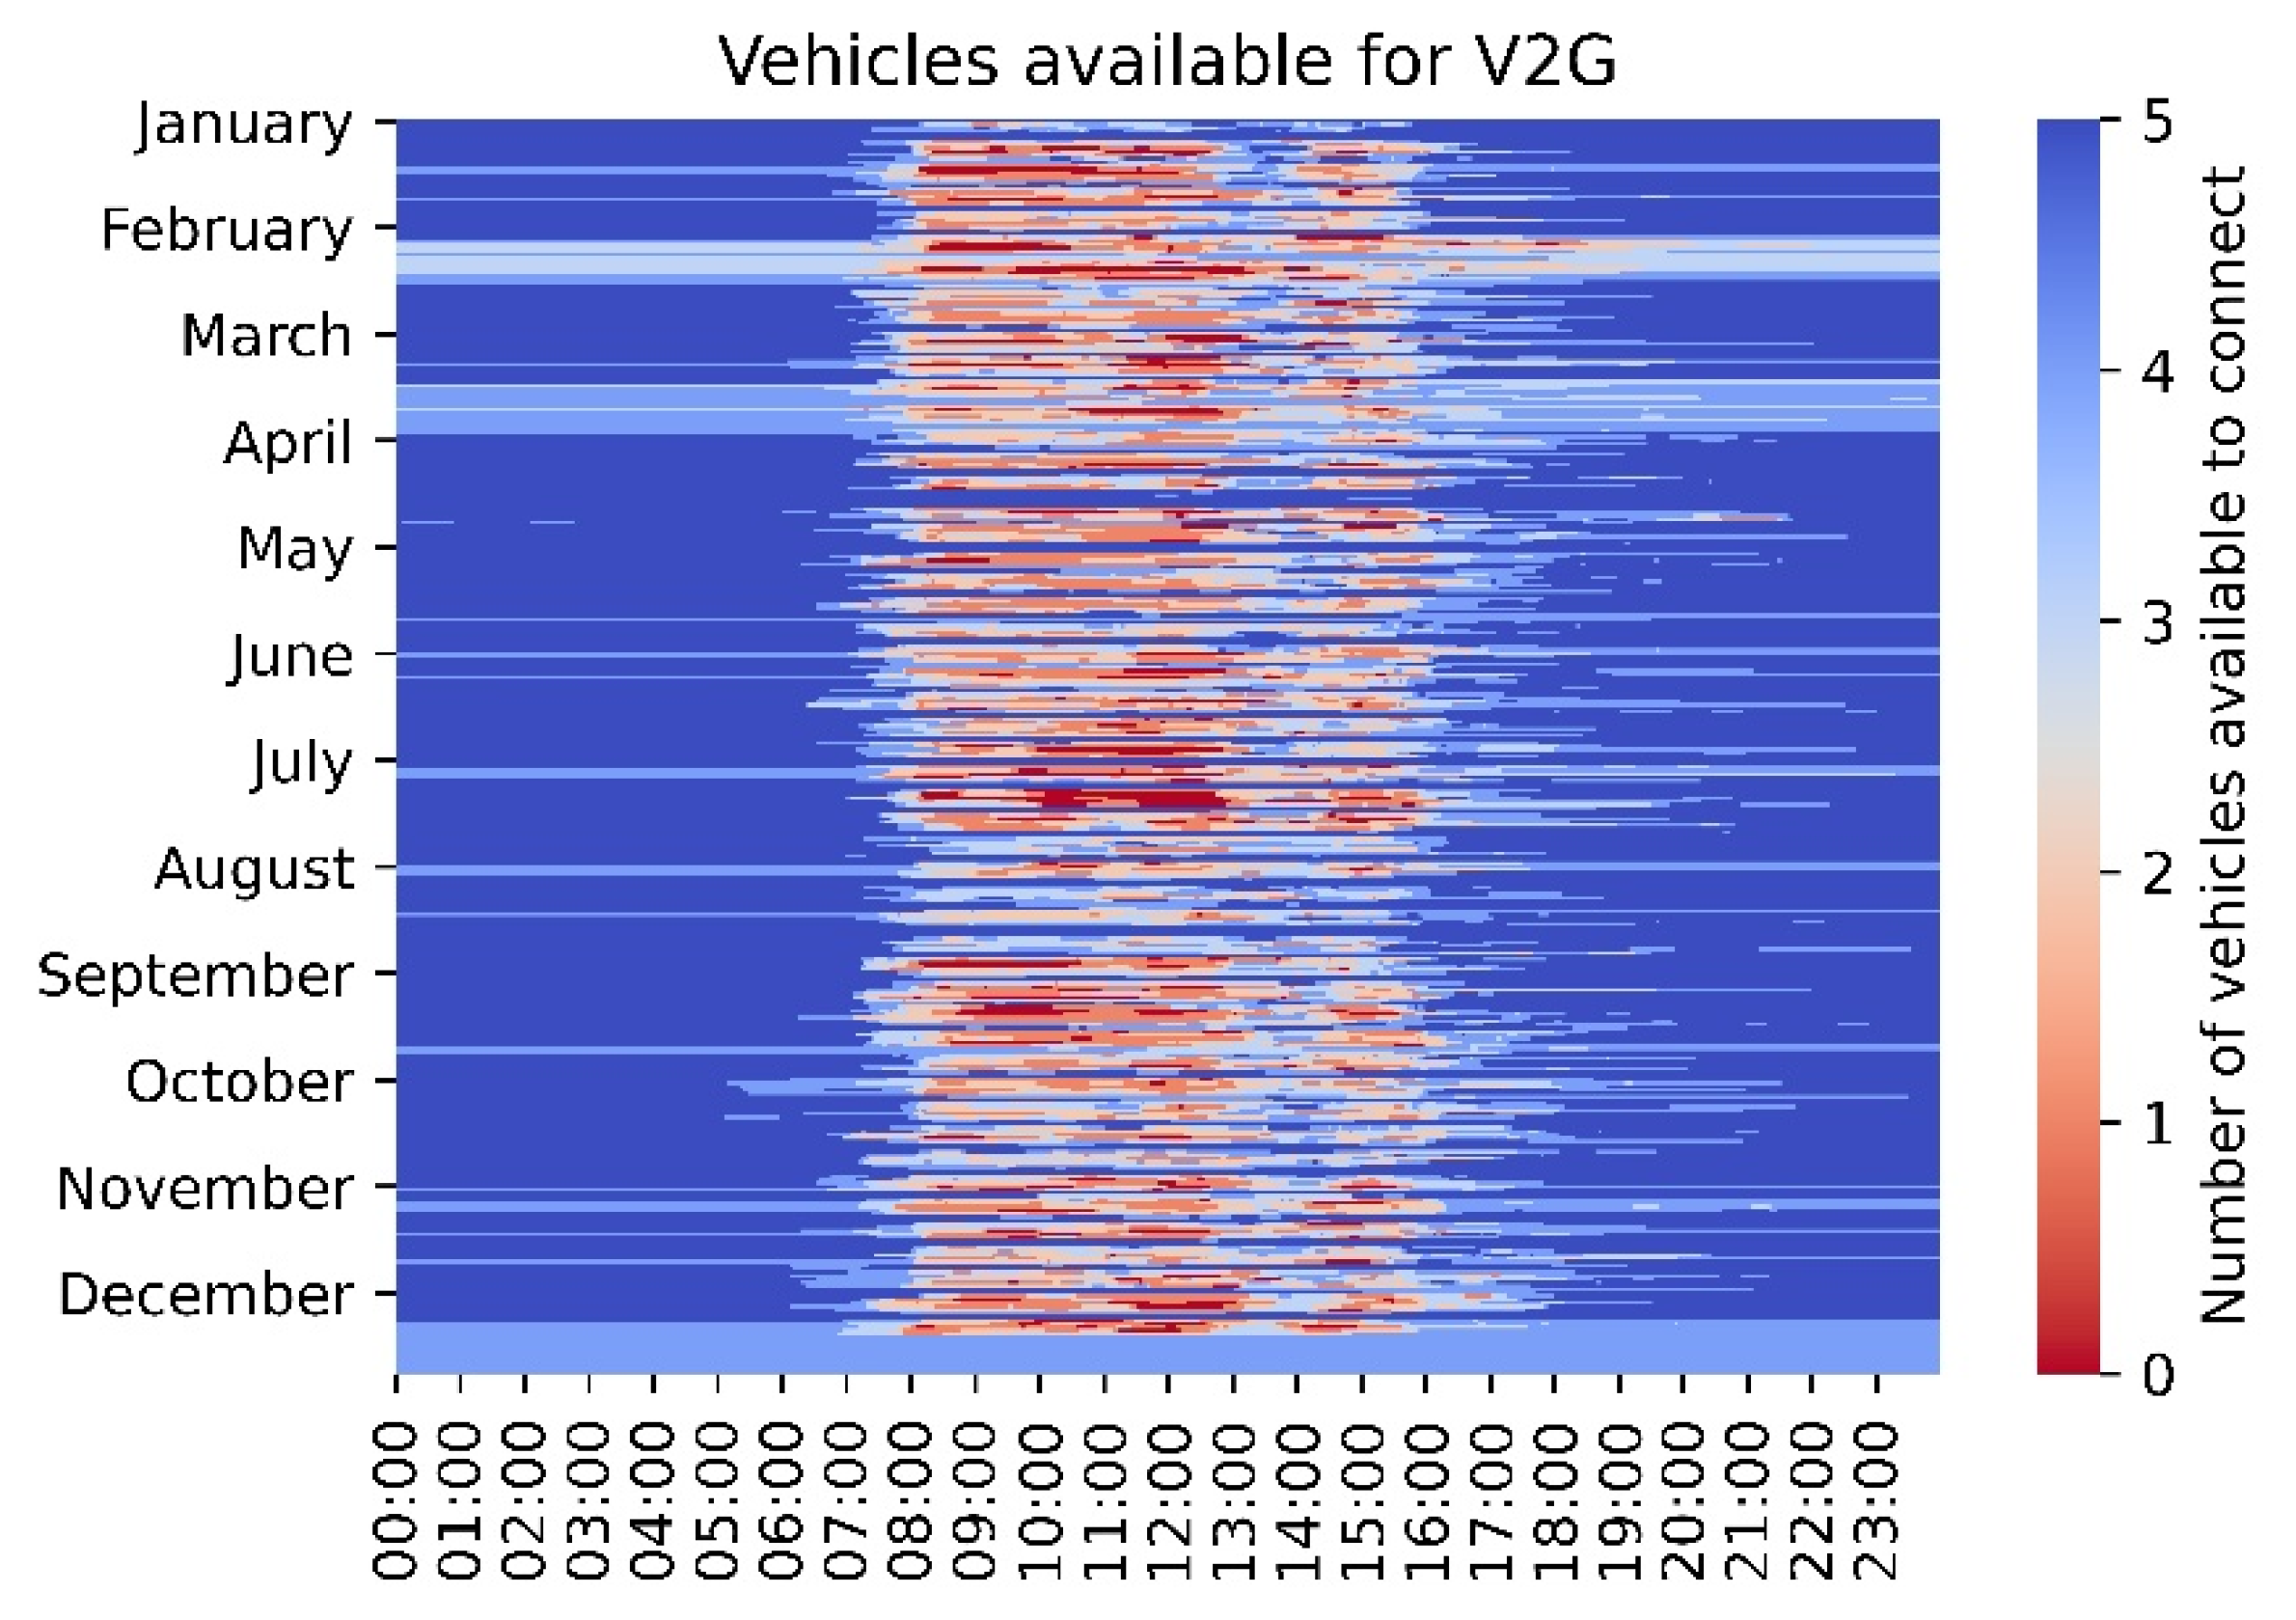
It was estimated that the five vehicles would be simultaneously available to connect to a V2G charger 55% of the time during the year. This means an equivalent of up to 200 kWh battery storage capacity without requiring additional investment in battery storage. According to Comello and Reichelstein [30], the U.S. market price of lithium-ion batteries is around USD 171 per kWh and USD 970 per kW. If we consider the entire fleet of 50 vehicles, the battery storage capacity would theoretically be more than 2 MWh, which would correspond to USD 1.94M in traditional battery storage. To provide a scale of battery storage capacity for 50 vehicles, it would be almost the equivalent capacity of the battery installed at the Community Energy Scheme Project SCENe (2.1 MWh), which, over the course of one year, generated 152.8 MWh, which is enough to cover the annual electricity consumption of 64 average properties in the community energy scheme [31].
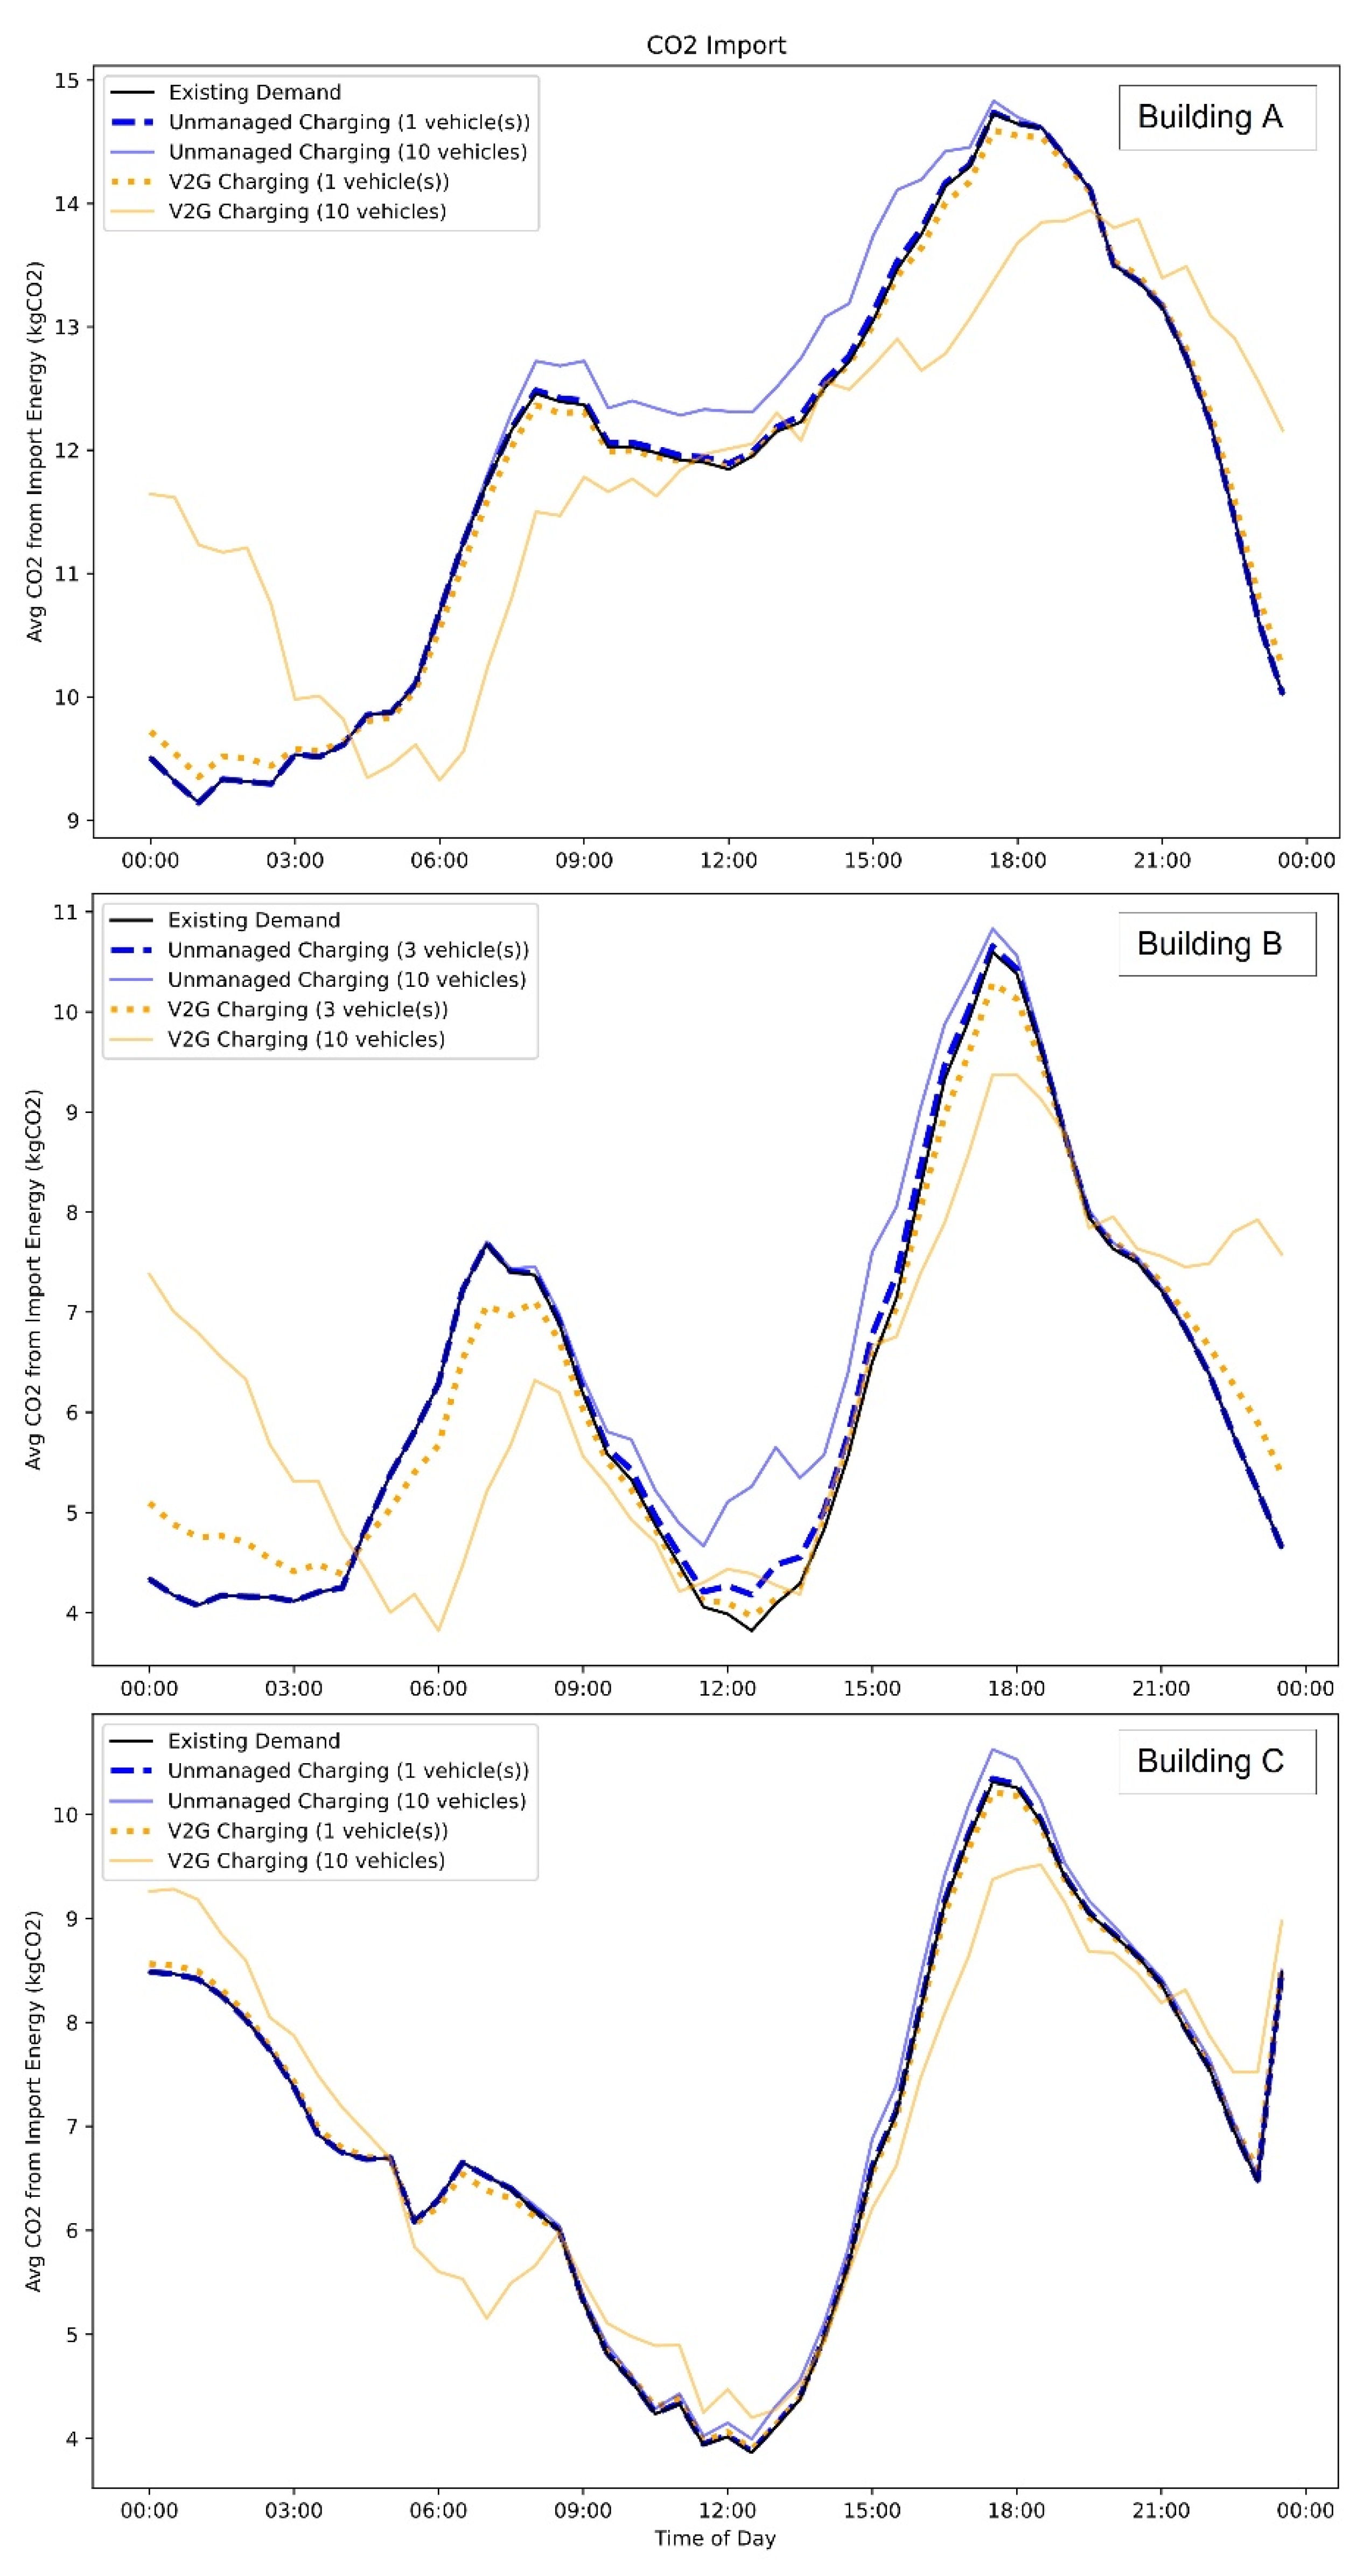
According to the presented carbon emissions and energy demand calculations, it was observed that although the total energy demand of the system was increased by the introduction of vehicle charging, the way that this charging was managed had a significant impact on carbon intensity. The aim of reducing the average carbon emissions was achieved, and the model with the increased fleet (×10) allowed further understanding of how V2G could support a reduction in CO2 emissions. In agreement with Alsharif et al. [32], the V2G scenarios with an increased fleet (10 vehicles) showed a load shifting, valley filling, and peak shaving (Figure 12); these benefits of V2G are presented in Table 14.
As presented in the introduction, V2G programmes usually require the end user to commit connecting to a charger for a certain amount of time to make the business case feasible. Nevertheless, these clauses may add complexity to the relationship with the end user and disincentivise the adoption of V2G. The analysis presented in this paper suggests that by determining a minimum state of charge required per day based on vehicle usage and assuming a connection of the vehicles every time they are near a charger and remaining over 30 min, it is possible for the diesel and non-V2G compatible electric vehicles to make the transition to EVs and integrate V2G without affecting most of their current operation. However, there were a few events of battery depletion, representing 0.5% of the entire year in the simulated V2G scenarios. These events can be addressed in advance by allowing the end user to manually opt out of the V2G scheme and charge their vehicle to fulfil their travelling requirements. It is also important to note that the simulated scenarios only included the V2G chargers proposed to cover the fleet demand; however, it is expected that V2G infrastructure will be part of a wider charging ecosystem that may offer other types of charging technologies to fulfil charging demand (e.g., smart, fast, rapid, and wireless charging).
In comparison to the results from the existing five-vehicle fleet, the increased impact on carbon intensity of the larger simulated fleet demonstrates that V2G will provide the most benefit in application over larger populations. Whereas the impact of an individual vehicle may be relatively small, there is significant potential for larger aggregated groups of vehicles to act as a single energy storage unit while maintaining their existing use patterns.
Therefore, analysing a wider group of vehicles and buildings would provide a further understanding of how other type of fleets [4] can support energy storage based on their proximity to charging infrastructure.
This research presented the integration of different sources of data to address the best possible scenarios for vehicle-to-grid. However, this system will need to be improved in terms of capturing and centralising data to allow for larger-scale calculation of the most suitable scenarios according to user needs, building energy demand, renewable energy generation, and grid carbon intensity. According to Alsharif et al. [32], the integration of electric vehicles into the energy grid may cause regulation issues and peak load rising, but this can be addressed by integrating an advanced power management system and using machine learning to predict the charging scheme 24 h in advance. The findings of this research show how a system can support the transition of integrating EVs without affecting the current operation of vehicles and addressing the issues of peak load demand.
The V2G strategy presented is a scheme based on fixed thresholds calculated from historical data. This scheme can be further optimised in several ways:
-
Defining thresholds per season to allow for maximisation of the benefits of vehicle-to-grid. This will allow for better capture of vehicle and energy usage per season.
-
Calculating the V2G scenarios 24h to 48h in advance. This will require integration of grid carbon intensity and building energy demand forecasts. This will also require integration of prediction of vehicle availability to connect to V2G chargers, as developed by Shipman et al. using machine learning techniques [23,24,33].
The analysis was focused on the use of historical datasets. However, the same parameters could be used in real-time applications if V2G chargers run as ‘data aggregators’ to optimise the operation of the system. This system would require predictions of grid carbon intensity, such as the carbon intensity API [25], which provides a forecast 96 h in advance for each region in Great Britain, and predictions of energy demand, local renewable energy generation, and vehicle availability, which could be integrated using machine learning (e.g., [23,24,33,34]).
According to the report “Understanding the true value of V2G” [35], a user can achieve around GBP 436 of annual revenue with smart charging (with a plug-in rate of 75%). This economic incentive represents the feasibility of the business model. However, the capacity of vehicle-to-grid to reduce carbon emission from the grid seems to be the only charging alternative to decarbonise the transport system in the pathway to achieve net zero and support the energy grid as presented in the Future Energy Scenarios Report [19].

5. Conclusions

This paper presents an overview of the role of V2G to support decarbonisation of the transport and energy sectors in the UK. The authors presented a method to assess V2G scenarios using real-world behaviour data from non-V2G-compatible vehicles, building electricity demand, local renewable energy generation data, and grid carbon intensity.
The outcomes of the simulated scenarios suggest that unmanaged charging increased the net energy demand and CO2 imports of the system, whereas V2G allowed for a reduction in average CO2 imports despite adding the energy demand of charging EVs.
It was possible for the diesel and non-V2G-compatible electric vehicles to operate in a simulated V2G scenario; therefore, it is expected that this fleet would be EV-V2G compatible in the real application without affecting most of its operation. However, instances of battery depletion were observed for Buildings B and C; this occurred two times in a year for the V2G scenarios, which is equivalent to 0.2–0.5% of the time. Therefore, an opt-out mechanism is suggested for V2G schemes to allow users to charge on demand on busy days.
The impact of unmanaged charging was further increased with a larger fleet (10 vehicles). Conversely, the V2G scheme was able to significantly flatten the average energy import load throughout the day by the combined mechanisms of diverting vehicle charging demand to times of lower carbon intensity.
The location analysis suggested that all vehicles were at the proposed V2G locations more than 55% of the time. These stationary vehicles equate to a 200 kWh battery storage capacity, which would be available without requiring further infrastructure investment. Although the impact of an individual vehicle may be relatively small, there is a significant potential for larger aggregated groups of vehicles to act as a single energy storage unit while maintaining their existing use patterns.
The proposed optimisation of the system would rely on access to different sources of data from vehicles, building energy demand, renewable energy generation, and grid carbon intensity with 24–48 h forecasts and the implementation of optimisation models using machine learning and artificial intelligence techniques.
Future charging schemes aiming to optimise carbon emissions should take battery degradation parameters into account; for instance, Truong M. N. Bui et al. [21] propose a VxG charging model that can optimise battery ageing.

Author Contributions

Conceptualization, J.W., L.R., M.G. and S.N.; methodology, J.W., L.R. and S.N.; software J.W., L.R. and S.N.; formal analysis, J.W., L.R., M.G., S.N. and R.S.; investigation, J.W., L.R., M.G., S.N. and R.S.; resources, J.W., L.R. and M.G.; data curation, J.W., L.R., M.G., S.N. and R.S.; writing—original draft preparation, J.W., L.R. and S.N.; writing—review and editing, J.W., L.R., M.G., S.N. and R.S.; visualization, J.W., L.R., M.G. and S.N.; supervision, L.R. and M.G.; project administration, L.R.; funding acquisition, L.R. and M.G. All authors have read and agreed to the published version of the manuscript.

Funding

This work is part of the Project EV-elocity (project number 104250), funded by the Department for Business Energy and Industrial Strategy (BEIS) and the Office for Zero Emission Vehicles (OZEV), in partnership with Innovate UK, part of UK Research and Innovation; and Project AMiCC (project number 105688), funded by the Office for Zero Emission Vehicles (OZEV) and supported by Innovate UK.

Institutional Review Board Statement

The study was conducted in accordance with the Declaration of Helsinki and approved by the Ethics Committee from the Faculty of Engineering of the University of Nottingham on the 5 March 2021.

Informed Consent Statement

Informed consent was obtained from all subjects involved in the study.

Data Availability Statement

The grid carbon intensity analysis included data published by the Carbon Intensity API available at https://carbonintensity.org.uk/ (accessed on 2 February 2022) (National Grid ESO, EDF Environmental Defense Fund, Department of Computer Science—University of Oxford, WWF).

Acknowledgments

The authors would like to acknowledge the contribution of the Estates, Sustainability, Infrastructure and Security teams from the University of Nottingham, who provided support, data and feedback for this research. The authors would like to thank the EV-elocity project partners: Cenex, University of Warwick, Leeds City Council, Nottingham City Council and CrowdCharge; and AMiCC project partners: Sprint Power, 4th Dimension Technology, Leeds City Council, Loughborough University and University of Warwick.

Conflicts of Interest

The authors declare no conflict of interest.

References

  1. Department for Business, Energy & Industry Stratege. 2019 UK Greenhouse Gas Emissions, Final Figures. 2021. Available online: https://www.ipcc-nggip.iges.or.jp/public/wetlands/index.html (accessed on 22 October 2021).
  2. Masson-Delmotte, V.; Zhai, P.; Pirani, A.; Sarah, L.; Connors, C.P.; Chen, Y.; Goldfarb, L.; Gomis, M.I.; Matthews, J.B.R.; Berger, S.; et al. IPCC: Climate Change 2021: The Physical Science Basis. 2021. Available online: https://www.ipcc.ch/report/ar6/wg1/ (accessed on 7 October 2021).
  3. Masson-Delmotte, V.; Zhai, P.; Pirani, A.; Sarah, L.; Connors, C.P.; Chen, Y.; Goldfarb, L.; Gomis, M.I.; Matthews, J.B.R.; Berger, S.; et al. Annex I: Glossary. In Global Warming of 1.5 °C. An IPCC Special Report on the Impacts of Global Warming of 1.5 °C above Pre-industrial Levels and Related Global Greenhouse Gas Emission Pathways, in the Context of Strengthening the Global Response to the Threat of Climate Crefhange; Matthews, J.B.R., Ed.; Intergovernmental Panel on Climate Change: Geneva, Switzerland, 2018; p. 24. [Google Scholar]
  4. Department for Transport. Decarbonising Transport: A Better, Greener Britain; Department of Transport: London, UK, 2021. [Google Scholar]
  5. Department for Business Energy & Industrial Strategy. Transitioning to a Net Zero Energy System: Smart Systems and Flexibility Plan 2021; Department for Business Energy & Industrial Strategy: London, UK, 2021. [Google Scholar]
  6. Department for Transport, Office for Zero Emission Vehicles, Department for Business Energy and Industrial Strategy, The Rt Hon Alok Sharma MP, and The Rt Hon Grant Shapps MP. Government Takes Historic Step towards Net-Zero with End of Sale of New Petrol and Diesel Cars by 2030. 2020. Available online: https://www.gov.uk/government/news/government-takes-historic-step-towards-net-zero-with-end-of-sale-of-new-petrol-and-diesel-cars-by-2030 (accessed on 25 October 2021).
  7. Waldron, J.; Rodrigues, L.; Gillott, M.; Naylor, S.; Shipman, R. Decarbonising Our Transport System: User Behaviour Analysis to Assess the Transition to Electric Mobility. In Proceedings of the PLEA 2020—Planning Post Carbon Cities: 35th PLEA Conference on Passive and Low Energy Architecture, A Coruña, Spain, 1–3 September 2020; pp. 689–694. [Google Scholar]
  8. Department for Business, Energy & Industrial Strategy. Energy White Paper: Powering our Net Zero Future. 2020. Available online: http://www.ret.gov.au/energy/facts/white_paper/Pages/energy_white_paper.aspx (accessed on 25 October 2021).
  9. Kempton, W.; Letendre, S.E. Electric Vehicles as a new source for electric utilities. Transp. Res. Part D Transp. Environ. 1997, 2, 157–175. Available online: http://www1.udel.edu/V2G/docs/Kempton-Letendre-97.pdf (accessed on 22 October 2021).
  10. Kempton, W.; Tomic, J.; Letendre, S.; Brooks, A.; Lipman, T. Vehicle-to-Grid Power: Battery, Hybrid, and Fuel Cell Vehicles as Resources for Distributed Electric Power in California. University of California Research Reports. 2001. Available online: http://escholarship.org/uc/item/0qp6s4mb.pdf (accessed on 25 October 2021).
  11. Waldron, J.; Rodrigues, L.; Gillott, M.; Naylor, S.; Shipman, R. Towards an electric revolution: A review on vehicle- to-grid, smart charging and user behaviour. In Proceedings of the 18th International Conference on Sustainable Energy Technologies, Kuala Lumpur, Malaysia, 20 August 2019; pp. 1–9. Available online: https://nottingham-repository.worktribe.com/output/2597268 (accessed on 26 March 2021).
  12. Edf. Vehicle to Grid (V2G): Generate Savings from Your Electric Vehicles. Available online: https://www.edfenergy.com/electric-cars/vehicle-grid#footnote-ev-b2b-v2g-9-000-miles (accessed on 27 October 2021).
  13. Octopus. Powerloop-V2G | Octopus Electric Vehicles. Available online: https://www.octopusev.com/powerloop (accessed on 27 October 2021).
  14. Cenex. Sciurus Project—Domestic V2G Demonstration-Cenex. 2021. Available online: https://www.cenex.co.uk/projects-case-studies/sciurus/ (accessed on 27 October 2021).
  15. OVO Energy. Vehicle to Grid Export Rates. Available online: https://www.ovoenergy.com/electric-cars/V2G-export-rates (accessed on 27 October 2021).
  16. Electric Nation. Electric Nation: Vehicle To Grid. Available online: https://electricnation.org.uk/ (accessed on 27 October 2021).
  17. Sovacool, B.K.; Noel, L.; Axsen, J.; Kempton, W. The Neglected Social Dimensions to a Vehicle-to-grid (V2G) Transition: A Critical and Systematic Review; IOP Publishing Ltd.: Bristol, UK, 2018. [Google Scholar] [CrossRef]
  18. Oldfield, F.; Kumpavat, K.; Corbett, R.; Price, A.; Aunedi, M.; Strbac, G.; O’Malley, C.; Gardner, D.; Pfeiffer, D.; Kamphus, J.T. The Drive towards a Low-Carbon Grid: Unlocking the Value of Vehicle-to-Grid Fleets in Great Britain; NISSAN Motor Corporation, e-on Drive, Imperial College London: London, UK, 2021. [Google Scholar] [CrossRef]
  19. National Grid ESO. Future Energy Scenarios. 2021. Available online: https://www.nationalgrid.com/NR/rdonlyres/C7B6B544-3E76-4773-AE79-9124DDBE5CBB/56766/UKFutureEnergyScenarios2012.pdf (accessed on 1 November 2021).
  20. O’malley, C.; Aunedi, M.; Teng, F.; Strbac, G. Value of Fleet Vehicle to Grid in Providing Transmission System Operator Services. 2020. Available online: https://ieeexplore.ieee.org/stamp/stamp.jsp?tp=&arnumber=9242990 (accessed on 1 November 2021.).
  21. Bui, T.M.N.; Sheikh, M.; Dinh, T.Q.; Gupta, A.; Widanalage, D.W.; Marco, J. A Study of Reduced Battery Degradation through State-of-Charge Pre-Conditioning for Vehicle-to-Grid Operations. IEEE Access 2021, 9, 155871–155896. [Google Scholar] [CrossRef]
  22. Trakm8. Trakm8 Solutions | Trakm8. Available online: https://www.trakm8.com/solutions/?creative=458668707590&keyword=trakm8&matchtype=e&network=g&device=c&gclid=EAIaIQobChMI5KHDgp3r8wIVW-ztCh1QuQmsEAAYASAAEgIJo_D_BwE (accessed on 27 October 2021).
  23. Shipman, R.; Waldron, J.; Naylor, S.; Pinchin, J.; Rodrigues, L.; Gillott, M. Where Will You Park? Predicting Vehicle Locations for Vehicle-to-Grid. Energies 2020, 13, 1933. [Google Scholar] [CrossRef] [Green Version]
  24. Shipman, R.; Roberts, R.; Waldron, J.; Naylor, S.; Pinchin, J.; Rodrigues, L.; Gillott, M. We got the power: Predicting available capacity for vehicle-to-grid services using a deep recurrent neural network. Energy 2021, 221, 119813. [Google Scholar] [CrossRef]
  25. National Grid ESO, Environmental Defense Fund Europe, University of Oxford Department of Computer Science, and WWF, “Carbon Intensity API”. Available online: https://carbonintensity.org.uk/ (accessed on 27 October 2021).
  26. Bruce, A.R.W.; Ruff, L.; Kelloway, J.; MacMillan, F.; Rogers, A. Carbon Intensity Forecast Methodology. Available online: https://carbonintensity.org.uk/ (accessed on 1 April 2021.).
  27. R. Story. Folium. 2013. Available online: https://python-visualization.github.io/folium/ (accessed on 7 March 2022).
  28. Nissan Motor Corp. e-NV200. 2020. Available online: https://www-europe.nissan-cdn.net/content/dam/Nissan/gb/brochures/Vehicles/Nissan_e-NV200_van_UK.pdf (accessed on 27 October 2021).
  29. Metais, M.O.; Jouini, O.; Perez, Y.; Berrada, J.; Suomalainen, E. Too much or not enough? Planning electric vehicle charging infrastructure: A review of modelling options. Renew. Sustain. Energy Rev. 2022, 153, 1–16. Available online: https://reader.elsvier.com/reader/sd/pii/S136403212100993X?tken=C90AB5C8CC670705DE3C73B5D3C86A3F9B02F03E8ABE3A55DD94784AB59A25D0E4772B40757A3C94D1A98092E0DDBBC9&originRegion=eu-west-1&originCretion=20211103202912 (accessed on 3 November 2021). [CrossRef]
  30. Comello, S.; Reichelstein, S. The emergence of cost effective battery storage. Nat. Commun. 2019, 10, 1–9. [Google Scholar] [CrossRef] [PubMed] [Green Version]
  31. Rodrigues, L.; Gillott, M.; Waldron, J.; Cameron, L.; Tubelo, R.; Shipman, R.; Ebbs, N.; Bradshaw-Smith, C. User engagement in community energy schemes: A case study at the Trent Basin in Nottingham, UK. Sustain. Cities Soc. 2020, 61, 102187. [Google Scholar] [CrossRef]
  32. Alsharif, A.; Tan, C.W.; Ayop, R.; Dobi, A.; Lau, K.Y. A comprehensive review of energy management strategy in Vehicle-to-Grid technology integrated with renewable energy sources. Sustain. Energy Technol. Assess. 2021, 47, 101439. [Google Scholar] [CrossRef]
  33. Shipman, R.; Roberts, R.; Waldron, J.; Rimmer, C.; Rodrigues, L.; Gillott, M. Online Machine Learning of Available Capacity for Vehicle-to-Grid Services during the Coronavirus Pandemic. Energies 2021, 14, 7176. [Google Scholar] [CrossRef]
  34. Salcedo-Sanz, S.; Cornejo-Bueno, L.; Prieto, L.; Paredes, D.; García-Herrera, R. Feature selection in machine learning prediction systems for renewable energy applications. Renew. Sustain. Energy Rev. 2016, 90, 728–741. [Google Scholar] [CrossRef]
  35. Payne, G.; Cox, C. Understanding the True Value of V2G; Cenex: Loughborough, UK, 2019. [Google Scholar]
Figure 1. University of Nottingham campuses in Nottingham, UK.
Energies 15 02447 g001
Figure 3. Flowchart to calculate the best option to charge/discharge EVs, prioritising environmental benefits.
Energies 15 02447 g003
Figure 4. Distribution of the number of journeys for each vehicle per hour of the day, day of the week, and month of the year.
Energies 15 02447 g004
Figure 5. Geospatial analysis of long (>60 min) dwell events at the University of Nottingham campuses in Nottingham, UK. The most frequent locations for long stops were identified as A, B, and C.
Energies 15 02447 g005
Figure 6. Number of vehicles parked close to a proposed V2G charger for more than 30 min over the one-year historical dataset. Dark blue means all vehicles five vehicles were parked next to a charger, and red means that none of the vehicles was available to connect to a V2G charger.
Energies 15 02447 g006
Figure 7. Average 24 h dwelling profile at locations A, B, and C per vehicle (V). 100% means that the vehicle was at that location all year.
Energies 15 02447 g007
Figure 8. Building A, B, and C half-hourly energy demand in kWh during 2019.
Energies 15 02447 g008
Figure 9. Half-hourly renewable energy generation from photovoltaics at University Park and Jubilee campuses, UK.
Energies 15 02447 g009
Figure 10. Half-hourly UK grid carbon intensity 2019.
Energies 15 02447 g010
Figure 11. Simulation result of charging and discharging sessions based on the proposed V2G charging scheme, prioritising environmental benefits.
Energies 15 02447 g011
Figure 12. Simulated average carbon emissions over 24 h from the total import of energy to the building–renewables–vehicles system for Buildings A, B, and C. Scenario presented for ‘baseline system demand (no vehicles)’, ‘unmanaged charging’ (actual fleet), ‘unmanaged charging’ (10 vehicle fleet), ‘V2G charging’ (actual fleet), and ‘V2G charging’ (10 vehicle fleet) at each building.
Energies 15 02447 g012
Table 1. Parameters to calculate the scenarios for V2G.
Vehicle Availabilitynot available
available
Minimum SoC AcceptedSoC < 20%
SoC > 20%
State of Charge (SoC)SoC < 50%
SoC between 50–90%
SoC > 90%
Renewable Energy Generation
(REG)
REG low
REG medium
REG high
Carbon Intensity (CO2)CO2 low
CO2 medium
CO2 high
Building Energy Demand (BED)BED low
BED medium
BED high
Table 2. Descriptive statistics of vehicle journeys and travel distance.
Vehicle ID# Journeys (Year)Mean Daily Distance (mi/Day)Max. Daily Dist.
(mi/Day)
Mean Journey Dist. (mi/Journey)Max. Journey Dist. (mi/Journey)
1556611.741.40.616.9
2500616.270.60.859.9
3541516.255.60.829.0
4470419.156.1131.3
527588.431.20.710.0
Fleet23,44914.370.60.859.9
Table 3. Dwell events per vehicle shorter or longer than 60 min.
Vehicle IDTotal≤60 min>60 min
156915134 (90.2%)557 (9.8%)
251074615 (90.4%)492 (9.6%)
355735081 (91.2%)492 (8.8%)
448104360 (89.7%)450 (10.3%)
528262357 (80.1%)469 (19.9%)
Total Fleet24,03721,577 (89.8%)2460 (10.2%)
Table 4. Percentage of time that vehicles were available to charge/discharge in the one-year historical dataset.
All YearWeekdaysWeekends
none2%3%0%
1 vehicle6%9%0%
2 vehicles8%11%1%
3 vehicles10%12%3%
4 vehicles20%18%23%
5 vehicles55%4772%
Table 5. Percentage of time spent at each charger per vehicle.
Vehicle IDLocation ALocation BLocation COther (>30 min)Driving/Short (<30 min)
180%0%0%4%16%
20%81%0%3%16%
30%78%0%7%15%
40%78%0%7%15%
55%1%78%9%7%
Table 7. BED thresholds (kWh).
Low (kWh)Medium (kWh)High (kWh)
BED A20.0–53.554–6565.5–105
BED B9.9–30.931–48.248.3–101.2
BED C1.0–31.331.5–5151.3–98
Table 9. Renewable energy generation thresholds (kWh per 30 min).
LowMediumHigh
Campus 10–99–26.226.2–61.4
Campus 20–4.94.9–14.814.9–35.3
Table 11. Simulated CO2 emissions of Building A.
Building A (1 Vehicle)Building A (10 Vehicles)
Baseline System DemandUnmanaged EV ChargingV2GBaseline System DemandUnmanaged EV ChargingV2G
Total Net Energy Import (kWh)956,801958,084958,064956,801969,626969,425
CO2 from 1 year System Net Import (kg)207,683207,983207,754207,683210,680208,398
Average CO2 Intensity (campus energy) (gCO2/kWh)217.06217.08216.85217.06217.28214.97
CO2 from 1 year external top up (kg)000000
Average CO2 Intensity (campus + external)217.06217.08216.85217.06217.28214.97
Instances of Vehicle Battery Depletion000000
Table 12. Simulated CO2 emissions of Building B.
Building B (3 Vehicles)Building B (10 Vehicles)
Baseline System DemandUnmanaged EV ChargingV2GBaseline System DemandUnmanaged EV ChargingV2G
Total Net Energy Import (kWh)478,223483,668483,540478,223500,005499,494
CO2 from 1 yr System Net Import (kg)107,033108,284107,613107,033112,037109,354
Avg CO2 Intensity (campus energy only) (gCO2/kWh)223.81223.88222.55223.81224.07218.93
CO2 from 1 yr external top up (kg)0024,8800086,280
Avg CO2 Intensity (campus + external)223.81223.88222.57223.81224.07218.98
Instances of Vehicle Battery Depletion002007
Table 13. Simulated CO2 emissions of Building C.
Building C (1 Vehicle)Building C (10 Vehicles)
Baseline System DemandUnmanaged EV ChargingV2GBaseline System DemandUnmanaged EV ChargingV2G
Total Net Energy Import (kWh)550,615551,344551,326550,615557,903557,723
CO2 from 1 yr System Net Import (kg)122,303122,468122,299122,303123,959122,262
Avg CO2 Intensity (campus energy only) (gCO2/kWh)222.12222.13221.83222.12222.19219.22
CO2 from 1 yr external top up (kg)017,76018,1200177,600181,200
Avg CO2 Intensity (campus + external)222.12222.13221.83222.12222.19219.23
Instances of Vehicle Battery Depletion02202020
Table 14. Observed benefits of vehicle-to-grid.
Load ShiftingValley FillingPeak Shaving
Increased CO2 imports between 9:00 p.m. and 4:00 a.m, as the charging scheme prioritised charging when the CO2 grid intensity was low.A small increase on the CO2 imports during mid-day, when renewable energy generation was high and vehicles were available to charge.This occurred between 6:00 a.m. and 10:00 a.m. and between 5:00 p.m. and 7:00 p.m., when the grid CO2 intensity and/or local building demand was high.
Publisher’s Note: MDPI stays neutral with regard to jurisdictional claims in published maps and institutional affiliations.

