Article

Image Detection of Insulator Defects Based on Morphological Processing and Deep Learning

1
College of electronic engineering and intelligence, Dongguan University of Technology, Dongguan 523808, China
2
Shenzhen Branch, State Grid Electric Power Research Institute, Shenzhen 518057, China
*
Author to whom correspondence should be addressed.
Energies 2022, 15(7), 2465; https://doi.org/10.3390/en15072465
Submission received: 8 February 2022 / Revised: 21 March 2022 / Accepted: 25 March 2022 / Published: 27 March 2022

Abstract

:
Insulators are an important part of transmission lines; failure may threaten the operation of these transmission lines. For insulator defect detection, an optical image detection method based on deep learning and morphological detection is proposed. First of all, the Faster RCNN is used to locate the insulator and extract its target image from the detection image. In the second place, a segmentation method of insulator image is proposed to remove the background of the target image. In order to simplify insulator defect detection, an insulator shape transformation method is proposed to unify all types of insulator detection. Finally, a mathematical model is established in the binary image to describe the defect of the insulator. Experiments show that our proposed Faster RCNN can accurately detect the insulators in the image. Its AP is as high as 0.9175, and its Recall rate is as high as 0.98, which is higher than the common insulator recognition algorithm. The accuracy of the proposed defect detection method is 0.98, which can accurately locate the defect position of the insulator. In order to prove the efficiency of the proposed method, we compared several common detection methods.

Graphical Abstract

1. Introduction

The failure of transmission lines may cause a power system to stop functioning, causing huge economic losses [1]. Therefore, it is necessary to inspect transmission lines regularly. With the development of computer vision, UAV (Unmanned Aerial Vehicle) patrol transmission lines have become the most popular detection method [2,3,4], because of their stronger efficiency and safety performance. In addition, UAV patrol transmission lines function regardless of harsh environmental factors.
The transmission equipment image detection algorithm is the soul of the UAV patrol transmission line. The detected images of the power transmission lines primarily include optical images, infrared images and Lidar images [5,6,7]. Infrared images are responsible for detecting whether the device’s temperature is too high. The Lidar image is responsible for detecting whether there are illegal buildings or tree barriers in the transmission line’s path. Optical images also play an important role in the detection of power transmission lines. These images are responsible for detecting whether the equipment is deformed, contaminated, covered in ice, rusted, or has fallen [8,9,10,11]. Inside the transmission line, the insulator provides mechanical support and electrical insulation for the conducting wire. It is exposed to not only sun and acid rain but also bears the tensile force produced by the conductor. Therefore, the insulation performance and the insulator’s mechanical strength will decline due to environmental erosion, threatening the operation of the power system.
Insulator identification is used to navigate camera displacement and obtain the key image that depicts the insulator defect. In the past, insulator identification was primarily achieved by acquiring a large number of image features [12,13,14]. This method not only needs to obtain a large number of prior insulator features but also needs to find a suitable classification or segmentation model to effectively identify insulators. R. Girshick proposed the target detection RCNN (Regions with CNN features) algorithm, which attracted the attention of the computer vision field [15]. The development of this algorithm announced that regional target detection technology had entered the era of deep learning. At present, there are two widely-used deep learning methods for Regional target detection. One is based on the RCNN, and the other is based on YOLO (You Only Look Once) [16,17,18].
D. Sadykova et al. provided an insulator identification scheme based on YOLOv2 [19]. Y. Liu et al. used YOLOv3 to realize real-time insulator detection, and the average detection speed was 0.018 s per frame [20]. W. Zhao et al. introduced SEnet (Squeeze-and-Excitation Networks) to the Faster RCNN and achieved high-precision insulator detection [21]. These methods are widely used in transmission line detection because of their high detection speed and accuracy. The RCNN’s detection concept obtains a region proposal first and then recognizes the target using classification. YOLO-based target detection uses neural network regression to predict target coordinates and categories. Therefore, YOLO’s detection speed is faster. However, the detection accuracy of the Faster RCNN is higher when detecting multiple small and complex targets.
The insulator defect detection methods include deep learning and morphological detection. Deep learning first marks the abnormal insulator samples and then trains the neural network. In insulator defect detection, the detection results are obtained by inputting the image into the trained model. Q. Zhang et al. combined closed-loop control theory with transfer learning and designed a randomly configured network to detect insulator self-blast states (insulator caps-missing) [22]. Ricardo M. Prates et al. designed a convolutional neural network that detects whether an insulator is broken [23]. The network classifies the material and the state of the detected insulator to identify insulator defects. To increase the accuracy of insulator defect detection, it is beneficial to first locate the insulator and then detect it. C. Shi and Y. Huang designed a deep learning model that simultaneously detects insulators and insulator caps [24]. This model counts the number of insulator caps in the area where the insulator is located and judges whether that number matches the insulator cap target number. G. Kang et al. used the Faster RCNN to obtain a target image of the insulator. Then, the target image is input into a neural network composed of a deep matter classifier and a depth denoising automatic encoder for detection [25]. Similarly, X. Tao used the Faster RCNN to locate the insulator and then designed another Faster RCNN structure that detects insulator defects [26]. Similar to the brain and consciousness, deep neural networks have not yet been fully explained by humans. However, this does not prevent them from being the most popular detection method in the field of transmission line detection.
If deep learning is similar to sensations in the brain, then morphological detection is the ruler used for measurement. Morphological detection first extracts the insulator’s morphological characteristics and then establishes a defect judgment model based on those morphological characteristics. Y. Zhang et al. segmented the insulator and the icicle between an insulation cap using an image [27]. A mathematical model was established to calculate the distance between insulator caps and the length of the icicles in the image, which were used to judge the insulator icing condition. L. Jin et al. designed an infrared information-assisted optical image detection method for insulator contamination [28]. This method analyzes the effects of light and humidity on the color characteristics and establishes a color image correction model based on infrared information. The color image format is YUV, and the average value of the V component is selected to determine the degree of pollution. L. Xin realized insulator coating defect detection by calculating the percentage of the damaged RTV coating area in the insulator caps [29]. W. Chen et al. analyzed both the color and grayscale features of the insulator and then separated the insulator from the detection image [30]. A linear equation is used to analyze an insulator’s spatial characteristics, and a mathematical model detects whether the insulator cap is missing. W. Chen et al. proposed a deep learning-assisted morphological detection method for missing insulator caps [31]. An SSD (Single Shot MultiBox Detector) is used to extract a target image of the insulator. Then, the distance between adjacent insulator caps is calculated to determine whether there are any missing insulator caps.
Glass insulators not only have strong anti-aging ability but also eliminate damaged insulation caps automatically. When the cap of a glass insulator loses its insulation capacity, the cap bursts on its own. Therefore, glass insulators have been widely used in power transmission systems. In addition to self-explosion, missing insulator caps are also caused by external effects. The detection of missing insulation caps is an important part of glass insulator image detection. Aiming at the detection of missing insulator caps, a method combining deep learning and morphological detection is proposed.

2. Materials and Methods

The process of the proposed insulator defect detection method is shown in Figure 1. The transmission line scene is very complex, so regional target detection technology is used to locate the insulator in the detection image. The insulator region in the detection image can be cut out using the information output by regional target detection. To better detect the defect location, the background of the clipped insulator region image is removed. Finally, an insulator defect detection method based on morphology is proposed.
To achieve the detection of missing insulator caps, this research makes the following contributions:
  • A method for detecting the absence of insulator caps combined with neural networks and deep learning is proposed. The proposed method not only detects the location of defects but also counts the number of remaining insulator caps.
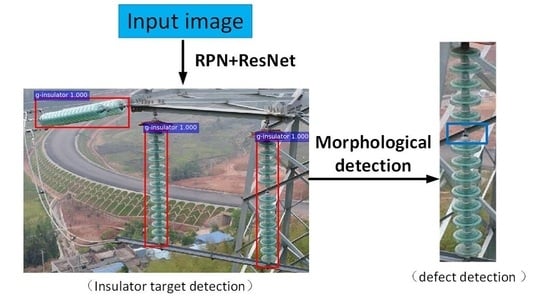
  • A target detection method for insulator regions based on the Faster RCNN is proposed. The residual network performs feature extraction so that the detection accuracy is higher.
  • According to the morphological characteristics of glass insulation, a pixel clustering algorithm for insulator image segmentation is proposed.
  • A method for detecting the insulator inclination angle is proposed. The image is rotated according to the angle between the insulator and the horizontal line, and the inclined insulators are then placed horizontally.
  • The detection problem regarding insulators that are installed side by side is transformed into a detection problem regarding single-row insulators. A method for separating side-by-side insulators is proposed.

3. Insulator Target Detection

3.1. The Faster RCNN

The Faster RCNN is a target detection method based on region proposal [32]. It creatively integrates regional proposal and target recognition using the RPN (Region Proposal Network). Compared with other RCNN detection methods, it has a faster detection speed.
This section may be divided by subheadings. It should provide a concise and precise description of the experimental results, their interpretation, as well as the experimental conclusions that can be drawn.
The structure of the Faster RCNN is shown in Figure 2. First, the detection image is reduced to a fixed size and input into the convolutional layers to obtain the feature maps. Compared with the traditional sliding window and selective search, the RPN obtains candidate regions faster. In the RPN, multiple anchors are generated based on the feature maps and then classified to determine which anchors are positive anchors with targets and which are negative anchors without targets. Using the information from all of the bounding boxes combined with the positive anchors’ regression, which detects the object’s bounding box, the proposal layer is obtained. The feature maps and proposals are input into the ROI to extract the proposal feature maps. The proposal feature maps calculate the category for each proposal using the fully connected layer and Softmax and then output the category probability vector. Simultaneously, each proposal is adjusted so that it can regress to a more accurate target bounding box.
According to the box and class output by the Faster RCNN, the insulator’s target image can be obtained from the detected image. Since the background of the insulator’s target image is relatively simple, it can be detected directly using image morphology.

3.2. Residual Network

In the paper proposing the Faster RCNN, Vggnet (Visual Geometry Group Network) was used for the convolutional layers. Vggnet uses multiple small convolution kernels instead of large convolution kernels. After the network reaches a certain depth, increasing the number of layers does not improve the classification performance but instead causes the network to converge more slowly. To improve the insulator detection accuracy, the Resnet (residual network) is used for the convolutional layers instead of Vggnet.
The residual neural network is composed of multiple residual blocks, and the residual block structure is shown in Figure 3 [33].
The residual block is composed of a two-layer or three-layer convolutional neural network, and relu is used as the activation function. Figure 3 shows the structure of two-layer residual training. It has two paths: f (x) is the residual path, and X is the identity mapping, which is called the "shortcut". Using this network training structure, the gradient does not disappear completely under the influence of the "shortcut". Residual learning makes the residual network solve the problem of increasing depth degradation and can improve the network performance by increasing the network depth.
The Faster RCNN base on Res152 (residual network-152) is shown in Figure 4. The network is composed of RPN and res152 for insulator target detection. It has 3 + 8 + 36 + 3 = 50 residual blocks, and all residual blocks are composed of three convolutional layers. The Res152 input layer is a 7 × 7 × 64 convolution layer, and the output layer is an FC (Fully connected) layer. According to the size of each layer, the network is divided into six parts. The first four layers are used as feature extraction layers for the Faster RCNN. The feature map output by the conv4_x layer is extracted and put into the RPN network, and then ROI pooling is generated. Second, the data from ROI pooling is input into the Conv 5_x layer. Finally, the last two layers (conv5_x and fc) are used to classify the target and regress the box position.

4. Defect Detection

According to the Faster RCNN detection result, the insulator area can be removed from the image. The obtained image is called the “insulator target image”. In a standard insulator, the distance between each insulator cap is equal, and this distance is used to judge whether the insulator has missing caps. To analyze the insulator’s spatial characteristics, it is necessary to extract the insulators from the image at the pixel level.

4.1. Insulator Image Segmentation

To analyze the insulator’s morphological characteristics, it is necessary to segment the insulator from the image. According to the characteristics of glass insulators, a clustering algorithm for insulator image segmentation is designed. To make the background pixel and the insulator pixel more distinguishable, the insulator image is transformed into a feature image. The transformation equation is shown in Equation (1):
I fea = [ ω 1 ( B R ) + ω 2 ( B G ) + ω 3 ( b a ) ]
where “R”, “G” and “B” are the corresponding channels in RGB mode and “a” and “b” are the corresponding channels in lab mode. “ω1”, “ω2” and “ω3” are the weights, which are adjusted according to the color of the insulator.
The image segmentation steps are as follows:
  • According to the median element’s value in   I fea , the I fea elements are divided into two groups. For both groups, the median is found and used as the group’s cluster center. In this way, cluster centers C1 and C2 are obtained.
  • All pixels are mapped to a six-dimensional coordinate system. The coordinate system’s information primarily includes the pixel’s RGB characteristics, the position of the image (X, Y) and the corresponding value in I fea .
  • The Euclidean distance from each pixel to the cluster center is calculated, and the pixel and the nearest cluster center are grouped into a cluster.
  • For each cluster, the mean value of all included samples is used as the new cluster center.
  • Repeat steps (3) and (4) until the cluster center no longer changes or the set number of iterations is reached. One cluster of pixels whose cluster center is more similar to the insulator color feature is marked as “1”, and the other cluster is marked as “0”.
According to the above clustering algorithm, the insulator’s target image can be converted into a binary image, as shown in Figure 5b. There is considerable noise in the obtained binary image, so the open operation is performed to remove the noise. The processed image is shown in Figure 5c. A morphological inspection of the processed binary insulator image determines whether it is defective. To visually show the effect of removing the background, the result of pixel clustering segmentation is mapped back to the original image. That image is shown in Figure 5d.
In the clustering algorithm for glass insulators, the I fea extraction formula weights are ω1 = 0.5, ω2 = 0.7, and ω3 = 1.5. These weights were obtained by analyzing the color characteristics of glass insulators and combining that information with the algorithm’s image segmentation results. To find the appropriate weights, 50 images of glass insulators were analyzed.
This method’s segmentation effect on the glass insulator is shown in Figure 6. It can be seen from the figure that the proposed method has a better insulator segmentation effect. Since the location characteristics of the pixels are considered during image clustering and segmentation, the insulators can still be completely extracted even when there is a small amount of pollutants present on the cap.

4.2. Insulator Space Feature Conversion

After the target image is segmented using the image segmentation method described above, the binary image of the insulator is obtained. To detect insulator defects more conveniently and accurately, the image needs to be preprocessed.
The insulators installed on the tower obliquely need to be rotated at a certain angle so that they lie flat. An algorithm for calculating the insulator’s tilt angle is proposed, and the rotation of the insulator image is realized.
Figure 7 shows the process of the insulator image rotation algorithm. This algorithm is also suitable for the rotation of insulators installed side by side. The specific steps included in the algorithm are as follows:
  • The image is divided into N equal parts, the connected region in each part is found, and its center of gravity is marked.
  • The least-squares method is used to fit the straight line according to the center of gravity. According to the angle between the line and the horizontal line, the angle between the line and the horizontal line is the angle of rotation for the binary image.
  • The rotation angle obtained using this method is also suitable for insulators installed side by side.
  • The image is rotated, and the blank spaces are filled with pixel values of 0. The image is then cut according to the insulator position. The acquired image is shown in Figure 7d.
Insulators installed side by side need to be separated before detection. We treat them as two separate insulators when performing detection and then combine the detection results. Simultaneously, the defect location is mapped back to the target image.
A cutting line is then found to divide the insulators installed side by side into a single row of insulators. The cutting line is a straight line parallel to the insulator. Therefore, fitting the straight line generated in the “binary image rotation” step is used to translate the image. First, the line is moved to the top of the image, and then the number of insulator pixels intercepted each time is recorded. The scan result is shown in Figure 8c, The graphs represent the insulator pixel content at each intercept. According to the scanning result, the position of the cutting line is obtained.

4.3. Location of the Insulator Defect

When detecting missing insulator caps, a detection method based on sliding windows is proposed. The number of insulator pixels in the window is counted to determine whether any insulation caps are missing.
Since the insulator pixels in the binary image have values of 1 and the others have values of 0, the formula for calculating the proportion of insulator pixels in the sliding window is as follows:
P = i = 0 l 1 j = 0 d 1 b i n a r y [ i ] [ j ] l * d
where “l” is the long side of the window, “d” is the short side, and “binary[i][j]” is a pixel in the binary image intercepted by the window. “l” is equal to the short side of the target image, and “d” is determined by the width of the insulator cap. The width of the insulator cap is obtained by scanning the binary image. “P”, the insulator pixel content in an evaluation window, is obtained using this formula. Figure 9 demonstrates the process of detecting missing insulator caps.
The moving step of the window is one-third of “d”. The proposed method then marks the window whose area occupied by “P” is less than 40%. When more than two windows are marked continuously, this position is judged to be the position of the missing insulator. Similarly, the number of insulator caps is counted by marking the window whose “P” is more than 80%. In this way, the number of remaining caps in the insulator can be counted, and the degree of damage can be judged.

5. Experiment

5.1. Data Set and Experimental Environment

One thousand insulator detection images provided by NARI Technology Development Co., Ltd. are used as the data set for this experiment. These images will be made into a dataset in Pascal VOC format. The pictures are divided into a training set and a test set at a ratio of 7:3. In the training set, there are 300 images containing defective insulators and 400 images of normal insulators. There is also a considerable percentage of defective insulators in the test set. We manually label the insulators in the pictures of both the training set and the test set. Defective insulators and normal insulators are both marked as “insulators”.
The experimental platform is a desktop computer. Deep learning training and insulator detection method verification experiments are all carried out on this platform. The parameters of the environment are shown in Table 1.

5.2. Insulator Identification

5.2.1. Training and Testing of the Deep Neural Network

After preparing the deep learning operating environment and data set, the deep neural network is trained. The batch size of the training target detection is 128, and the number of training iterations is 20000. To improve the detection accuracy, the transfer learning method is used for training. The “ImageNet” data set pre-trains the convolutional neural network and then transforms it into the Faster RCNN.
Figure 10 shows the P-R (Precision-Recall) curve of the proposed regional target detection model for insulator detection. The model has a strong insulator detection ability, and the AP (Average Precision) of insulator detection is as high as 0.9175.
Figure 11 shows the detection results of the proposed insulator area target detection method. In Figure 11b, there are many insulators located in one corner of the detection image. However, the proposed method correctly locates each insulator in the image. In addition, the insulator covered by a small area containing obstacles is still correctly identified and located. In Figure 11e, the insulator is deformed due to its own gravity. The deformed insulator is still detected by the proposed method. Therefore, the proposed insulator area target detection method is suitable for detection in various complex situations.

5.2.2. Comparison with Other Target Detection Methods

In the same experimental environment, a variety of target detection models are trained using deep neural networks. In addition, we train the insulator detection model based on feature engineering. For the test set, the detection effects of these methods are shown in Table 2.
It can be seen from the table that the AP (Average Precision) obtained by the Faster RCNN is higher than 0.9, which meets the requirements for high-precision detection of insulator areas. In addition, the recall rate of our method is significantly higher than that of other methods, which is conducive to the subsequent insulator defect detection. According to the comparison of these methods in terms of insulator detection performance, the Faster RCNN based on Res152 has the highest detection accuracy.

5.3. Insulator Defect Detection

5.3.1. Verification of Defect Detection Algorithm

A typical insulator detection process is shown in Figure 12. First, the position of the insulator is detected using a deep neural network, and the insulator is preliminarily segmented. Additionally, in order to remove the background of the insulator target image, an image segmentation algorithm is proposed to extract insulators at the pixel level. Moreover, the position of the insulator is corrected using the morphological transformation method. Finally, the insulator’s defect is judged using shape detection, and the position of the insulator’s defect is marked.
Some defective insulator images detected by our detection algorithm are shown in Figure 13. It can be seen from the figure that the proposed algorithm can accurately detect the defect location of various forms of insulators. So, the proposed defect detection method is suitable for insulators with different spatial characteristics. In addition, when the camera takes pictures at a certain angle, the position of the faulty insulator will be covered by itself. It is impossible to solve these problems only by image processing. In actual transmission line inspection work, insulator “key frame” detection technology is usually used to obtain the best shooting angle of the insulator image. So, this question can be ignored.
Due to the limited insulation capacity of the insulator cap, the voltage of the transmission line is directly proportional to the number of insulator caps. In addition, as the number of caps increases, gravity has a greater impact on the insulator. In some high-voltage transmission lines, the insulator shape will become arced due to gravity. Therefore, the computational complexity of the proposed defect detection method is related to the number of insulators. To verify the feasibility of the proposed method, different types of glass insulators are detected.
For each type of insulator, 50 images are selected for inspection. The number of images depicting defective insulators and normal insulators is equal. The insulator that cannot be detected by Faster RCNN is marked as leakage detection. “Omission” represents the number of insulators that were not detected by the Faster RCNN. "False" represents the detection error.
The detection results are shown in Table 3. It can be seen from the table that the detection accuracy of the proposed method for different types of glass insulators is higher than 90%. These results meet the requirements for transmission line detection. As the number of caps increases, the detection accuracy for side-by-side insulators decreases. This relationship occurs because these insulators deform under the action of gravity, which affects the detection of missing insulator caps.

5.3.2. Robustness Test

To verify the robustness of the proposed defect detection method, the influence of noise on the detection accuracy is tested. According to the length of the insulator, two groups of 100 defective insulator images are selected. Gaussian noise is added to these images, and then defect detection is performed.
The test results are shown in Table 4, where “v” represents the variance of Gaussian noise. It can be seen from the experiment that noise has little effect on the detection of insulators below 110 kV. However, this defect detection method has lower detection accuracy for long insulators, and it is also more susceptible to noise.
To determine the reason for the low detection accuracy for long insulators, the samples that failed to be detected are analyzed. The shape of the insulators in these samples is shown in Figure 14a. The shooting angle and distance cause each insulating cap to stick to each other. Figure 14b shows the insulator image segmentation. Due to the interference of noise, the area containing the defect cannot be completely separated. When the sliding window reaches the defect position, the proportion of insulator pixels in the window may be more than 40%. Thus, the detection of the insulator’s defect fails.
To solve the problem that the detection performance of the proposed method is not ideal for long insulators, two solutions are provided. One solution is to change the threshold value of the sliding window to determine the defect position. Another is to change the judgment condition for the defect location. For this type of insulator, the window with pixel content that is less than 70% is marked. If a window is marked, that position is judged as the defect position. However, this change does not apply to insulators with well-spaced caps. For insulators with well-spaced caps, the gap between the caps will be mistakenly marked as a fault area. Therefore, the new judgment condition is adopted only when it is judged that the insulator caps are stuck together. The other solution is to adjust the camera’s shooting position and angle. According to the box position and box area of the insulator obtained by the Faster RCNN, the position of the insulator and the distance from the camera can be calculated. When the UAV adjusts its position, it detects an image every other period. The detected insulator position information guides the UAV to move until the center of the insulator detection frame overlaps with the image center. In addition, it is necessary to adjust the focal length according to the size of the detection frame to ensure that the gap between each insulator cap is clear. In contrast, this adjustment method is more robust because the larger the gap of the insulating cap is, the smaller the influence of noise on defect location identification. In addition, this adjustment also solves the problem of blind areas due to occlusion.

5.3.3. Comparison with Other Defect Detection Methods

To verify the effectiveness of the proposed detection algorithm, some common detection methods for missing insulator caps are compared. Fifty images of defect insulators and fifty images of normal insulators are used as test data.
Method 1: The Faster RCNN judges whether the insulator is normal or defective. The Faster RCNN’s feature extraction network is Res152. This method’s training images are the same as the training images for insulator target detection in our method. The difference is that this method labels both ordinary insulators and defective insulators. The test set includes the 100 insulator images mentioned above. The training method adopts the transfer learning method.
Method 2: Since [26] detects that the insulator is made of ceramic, we referred to their ideas to test glass insulators as a comparative experiment. Method 2 uses two cascaded Faster RCNNs. First, the Faster RCNN based on VGG16 is used to locate the insulator. Then, the Faster RCNN based on Res101 is used to locate defects in the insulator target image. In addition to defective insulators and normal insulators marked as "insulators", the defect locations are also marked with "defective" labels. This model also uses transfer learning for training.
Method 3: In [30], morphological detection is used to detect insulator defects. First, the B-channel image is extracted in the image lab mode. The improved Otsu algorithm is used to obtain the binary image of the insulator. The insulator is fitted to a linear equation to find the insulator’s starting position and ending position. Finally, the insulator’s pixel content is counted from the beginning to the end along a straight line to achieve the detection of insulator defects. This method is fast but is greatly affected by the detected image’s background content.
The experimental results are shown in Table 5. Although the images used for the comparison method based on deep learning are different from our method’s training set, they are all from the same image set. This experiment proves that our proposed method is more accurate when trained using the same image set. In practical applications, the difficulty of collecting defective insulators is much greater than that for normal insulators. Our method is not highly dependent on the amount of defective insulator data and is more in line with the current transmission line insulator detection requirements. In addition, the proposed method can detect not only the position of the missing insulator cap but also the number of remaining insulators. Currently, the method that directly uses neural networks to detect defects cannot achieve this result.

6. Conclusions

This paper proposes a new algorithm for insulator defect detection based on deep learning and morphological detection. Deep learning is used to identify insulators, and morphological inspection is used to detect defects. To identify and locate insulators in a complex detection environment, an improved Faster RCNN is proposed to identify insulators. The proposed target detection method correctly identifies and locates the insulator. The AP of insulator detection is 0.91, which meets the requirements of insulator identification for transmission lines. Comparative experiments show that the proposed target detection algorithm uses res152 as the feature extraction network, which has higher detection accuracy.
Aiming at the problem of missing insulator caps, a defect detection method based on image processing is proposed. The detection of defective insulators includes insulator segmentation and insulator space feature conversion; this combination establishes a detection model for insulator defects. The proposed insulator segmentation algorithm effectively removes the background from the insulator images. Using the insulator’s spatial feature conversion, defect detection is simplified. The established detection model accurately describes the insulator’s morphological characteristics and locates defects. The experimental results verify the effectiveness of the proposed detection method and that the method is applicable to different types of glass insulators. Most insulator self-explosion defect detection algorithms basically do not have the ability to detect the degree of insulator damage (calculate the number of defects and the number of normal insulator sheds). The method proposed in this paper detects the number of remaining insulator caps, which is more in line with the requirements of the actual inspection task. The proposed method can help power supply companies evaluate whether the remaining insulators can be operated and arranged to replace missing insulators.

7. Patents

This section is not mandatory but may be added if there are patents resulting from the work reported in this manuscript.

Author Contributions

Z.Z. and S.H. conceived the study, designed the Detection algorithm and collected data. All authors analyzed these data and participated in the writing of the manuscript. All authors have read and agreed to the published version of the manuscript.

Funding

This research was funded by NARI Group Technology Project, grant number 524608210265”.

Institutional Review Board Statement

This study does not involve human or animal research and does not require ethical review and approval.

Informed Consent Statement

Informed consent was obtained from all subjects involved in the study.

Data Availability Statement

The data presented in this study are available on request from the Professor Zhang. The data are not publicly available due to the request of NARI TECCHNOLOGY Co. Ltd.

Acknowledgments

Thanks to NARI TECCHNOLOGY Co. Ltd. for providing technical support such as inspection images of transmission lines.

Conflicts of Interest

We declare that we do not have any commercial or associative interest that represents a conflict of interest in connection with the work submitted.

References

  1. Castillo, A. Risk Analysis and Management in Power Outage and Restoration: A Literature Survey. Electr. Power Syst. Res. 2014, 107, 9–15. [Google Scholar] [CrossRef]
  2. Wu, Y.; Zhao, G.; Hu, J.; Ouyang, Y.; Wang, S.; He, J.; Gao, F.; Wang, S. Overhead Transmission Line Parameter Reconstruction for UAV Inspection Based on Tunneling Magnetoresistive Sensors and Inverse Models. IEEE Trans. Power Deliv. 2019, 34, 819–827. [Google Scholar] [CrossRef]
  3. Chen, D.-Q.; Guo, X.-H.; Huang, P.; Li, F.-H. Safety Distance Analysis of 500kV Transmission Line Tower UAV Patrol Inspection. IEEE Lett. Electromagn. Compat. Pr. Appl. 2020, 2, 124–128. [Google Scholar] [CrossRef]
  4. Shao, G.; Liu, Z.; Fu, J.; Tan, J.; Chen, Y.; Zhou, L. Progress in Unmanned Aerial Vehicle Inspection Technology on Overhead Transmission Lines. High Volt. Eng. 2020, 46, 14–22. [Google Scholar] [CrossRef]
  5. Han, S.; Yang, F.; Yang, G.; Gao, B.; Zhang, N.; Wang, D. Electrical Equipment Identification in Infrared Images Based on ROI-Selected CNN Method. Electr. Power Syst. Res. 2020, 188, 106534. [Google Scholar] [CrossRef]
  6. Zhang, S.; Qi, L.; Han, W.; Zhu, X.; Xi, X.; Wang, C.; Wang, P.; Nie, S. Danger Tree Detection and Tree Number Estimation Based on UAV Lidar Data. J. Univ. Chin. Acad. Sci. 2020, 37, 760–766. [Google Scholar]
  7. Serikbay, A.; Bagheri, M.; Zollanvari, A.; Phung, B.T. Accurate Surface Condition Classification of High Voltage Insulators based on Deep Convolutional Neural Networks. IEEE Trans. Dielectr. Electr. Insul. 2021, 28, 2126–2133. [Google Scholar] [CrossRef]
  8. Yue, S.; Yuan, M.; Lu, T.; Shivakumara, P.; Blumenstein, M.; Shi, J.; Kumar, G.H. Rotation Invariant Angle-Density Based Features for An Ice Image Classification System. Expert Syst. Appl. 2020, 162, 113744. [Google Scholar] [CrossRef]
  9. Zhao, Z.; Qi, H.; Qi, Y.; Zhang, K.; Zhai, Y.; Zhao, W. Detection Method Based on Automatic Visual Shape Clustering for Pin-Missing Defect in Transmission Lines. IEEE Trans. Instrum. Meas. 2020, 69, 6080–6091. [Google Scholar] [CrossRef] [Green Version]
  10. Huang, X.; Zhang, X.; Zhang, Y.; Zhao, L. A Method of Identifying Rust Status of Dampers Based on Image Processing. IEEE Trans. Instrum. Meas. 2020, 69, 5407–5417. [Google Scholar] [CrossRef]
  11. Jenssen, R.; Roverso, D. Intelligent Monitoring and Inspection of Power Line Components Powered by UAVs and Deep Learning. IEEE Power Energy Technol. Syst. J. 2019, 6, 11–21. [Google Scholar] [CrossRef]
  12. Huang, X.; Liu, X.; Zhang, Y.; Li, J.; Zhang, H.; Xing, X. Classification Recognition Method of Insulator in Aerial Image Based on the Red-blue Difference and Developed K-means Algorithm. High Volt. Eng. 2018, 44, 1528–1534. [Google Scholar] [CrossRef]
  13. Wang, X.; Zhang, Y. Insulator Identification from Aerial Images Using Support Vector Machine with Background Suppression. In Proceedings of the International Conference on Unmanned Aircraft Systems (ICUAS), Arlington, VA, USA, 7–10 June 2016; pp. 892–897. [Google Scholar]
  14. Zhu, S.; Gao, Q.; Liu, Y.; Sun, D. Identification and Location of Insulator String Based on Frequency-Tuned. Trans. China Electrotech. Soc. 2018, 33, 5573–5580. [Google Scholar] [CrossRef]
  15. Girshick, R.; Donahue, J.; Darrell, T.; Malik, J. Rich Feature Hierarchies for Accurate Object Detection and Semantic Segmentation. In Proceedings of the IEEE Conference on Computer Vision and Pattern Recognition, Columbus, OH, USA, 23–28 June 2014; pp. 580–587. [Google Scholar]
  16. Cui, Z.; Lu, N. Feature Selection Accelerated Convolutional Neural Networks for Visual Tracking. Appl. Intell. 2021, 51, 8230–8244. [Google Scholar] [CrossRef]
  17. Zhao, Z.; Zhen, Z.; Zhang, L.; Qi, Y.; Kong, Y.; Zhang, K. Insulator Detection Method in Inspection Image Based on Improved Faster R-CNN. Energies 2019, 12, 1204. [Google Scholar] [CrossRef] [Green Version]
  18. Gawande, U.; Hajari, K.; Golhar, Y. SIRA: Scale Illumination Rotation Affine Invariant Mask R-CNN for Pedestrian Detection. Appl. Intell. 2022, 2022, 1–19. [Google Scholar] [CrossRef]
  19. Sadykova, D.; Pernebayeva, D.; Bagheri, M.; James, A. IN-YOLO: Real-Time Detection of Outdoor High Voltage Insulators Using UAV Imaging. IEEE Trans. Power Deliv. 2020, 35, 1599–1601. [Google Scholar] [CrossRef]
  20. Liu, Y.; Ji, X.; Pei, S.; Ma, Z.; Zhang, G.; Lin, Y.; Chen, Y. Research on Automatic Location and Recognition of Insulators in Substation Based on YOLOv3. High Volt. 2020, 5, 62–68. [Google Scholar] [CrossRef]
  21. Zhao, W.; Cheng, X.; Zhao, Z.; Zhai, Y. Insulator Recognition Based on Attention Mechanism and Faster RCNN. CAAI Trans. Intell. Syst. 2020, 15, 92–98. [Google Scholar] [CrossRef]
  22. Zhang, Q.; Li, W.; Li, H.; Wang, J. Self-blast State Detection of Glass Insulators Based on Stochastic Configuration Networks and A Feedback Transfer Mechanism. Inf. Sci. 2020, 522, 259–274. [Google Scholar] [CrossRef]
  23. Prates, R.M.; Cruz, R.; Marotta, A.P.; Ramos, R.P.; Filho, E.F.D.S.; Cardoso, J. Insulator Visual Non-Conformity Detection in Overhead Power Distribution Lines Using Deep Learning. Comput. Electr. Eng. 2019, 78, 343–355. [Google Scholar] [CrossRef]
  24. Shi, C.; Huang, Y. Cap-Count Guided Weakly Supervised Insulator Cap Missing Detection in Aerial Images. IEEE Sens. J. 2021, 21, 685–691. [Google Scholar] [CrossRef]
  25. Kang, G.; Gao, S.; Yu, L.; Zhang, D. Deep Architecture for High-Speed Railway Insulator Surface Defect Detection: Denoising Autoencoder with Multitask Learning. IEEE Trans. Instrum. Meas. 2019, 68, 2679–2690. [Google Scholar] [CrossRef]
  26. Tao, X.; Zhang, D.; Wang, Z.; Liu, X.; Zhang, H.; Xu, D. Detection of Power Line Insulator Defects Using Aerial Images Analyzed With Convolutional Neural Networks. IEEE Trans. Syst. Man, Cybern. Syst. 2020, 50, 1486–1498. [Google Scholar] [CrossRef]
  27. Zhang, Y.; Huang, X.; Jia, J.; Zhu, Y.; Zhao, L.; Zhang, X. Detection and Condition Assessment of Icicle Bridging for Suspension Glass Insulator by Image Analysis. IEEE Trans. Instrum. Meas. 2020, 69, 7458–7471. [Google Scholar] [CrossRef]
  28. Jin, L.; Tian, Z.; Ai, J.; Zhang, Y.; Gao, K. Condition Evaluation of the Contaminated Insulators by Visible Light Images Assisted With Infrared Information. IEEE Trans. Instrum. Meas. 2018, 67, 1349–1358. [Google Scholar] [CrossRef]
  29. Xin, L.; Jin, H.; Tu, Y.; Yuan, Z.; Lv, Z.; Wang, C. Defect Detection and Characterization of RTV Silicone Rubber Coating on Insulator Based on Visible Spectrum Image. IEEE Trans. Power Deliv. 2020, 35, 2734–2736. [Google Scholar] [CrossRef]
  30. Chen, W.; Yao, L.; Li, F. Insulator Defect Detection and Location in UAV Grid Inspection. J. Comput. Appl. 2019, 39, 210–214. [Google Scholar]
  31. Chen, W.; Li, C.; Yuan, B.; Jiang, X. Effective Method to Locate Self-Explosion Defects of Insulators. Comput. Eng. Des. 2019, 40, 2346–2352. [Google Scholar] [CrossRef]
  32. Ren, S.; He, K.; Girshick, R.; Sun, J. Faster R-CNN: Towards Real-Time Object Detection with Region Proposal Networks. IEEE Trans. Pattern Anal. Mach. Intell. 2017, 39, 1137–1149. [Google Scholar] [CrossRef] [Green Version]
  33. He, K.; Zhang, X.; Ren, S.; Sun, J. Deep Residual Learning for Image Recognition. In Proceedings of the IEEE Conference on Computer Vision and Pattern Recognition (CVPR), Las Vegas, NV, USA, 27–30 June 2016; pp. 770–778. [Google Scholar]
Figure 1. Insulator defect detection process.
Energies 15 02465 g001
Figure 2. Insulator recognition based on Faster RCNN.
Energies 15 02465 g002
Figure 3. Residual block.
Energies 15 02465 g003
Figure 4. The structure of Faster RCNN base on Res152.
Energies 15 02465 g004
Figure 5. The process of removing the background from the insulator image: (a) Insulator target image, (b) Binary image, (c) Binary image after open operation, (d) Segmentation effect.
Energies 15 02465 g005
Figure 6. The process of removing the background from the insulator image. (a,c,e) are the insulator target images, and (b,d,f) are their corresponding segmented images.
Energies 15 02465 g006
Figure 7. The process of the insulator image rotation algorithm: (a) target image; (b) binary image; (c) obtain the rotation angle; (d) rotated image.
Energies 15 02465 g007
Figure 8. Finding the insulator cutting line: (a) target image; (b) binary image; (c) scan result; (d) cutting line.
Energies 15 02465 g008
Figure 9. Detection of missing insulator caps.
Energies 15 02465 g009
Figure 10. Detection of missing insulator caps.
Energies 15 02465 g010
Figure 11. Insulator target detection result: (ac) are the detection in 35kV Transmission line, (d) is the detection in 110kV, (e,f) is the detection in 220kV.
Energies 15 02465 g011
Figure 12. The process of insulator defect detection.
Energies 15 02465 g012
Figure 13. Verification results of insulator defect detection: (af) are the defect detection effects of insulators in different transmission towers
Energies 15 02465 g013aEnergies 15 02465 g013b
Figure 14. Detection failure analysis: (a) insulator image with Gaussian noise; (b) image segmentation.
Energies 15 02465 g014
Table 1. Experiment environment.
Hardware/SoftwareParameter
CPUIntel Core i7-8700K @3.7 GHz
GPUGeForce GTX 1080Ti (11G)
RAM16G(DDR4 3200MHz)
Hard disk1T (SSD SN750)
Systemubuntu16.04
LanguagePython 3.5.2
Deep learning frameworkTensorFlow-gpu-1.13.2
Table 2. Comparison with other target detection methods.
Detection MethodAP (insulator)Recall
Faster RCNN + Res152 (Our method)0.91750.98
Faster RCNN + Res1010.91190.96
Faster RCNN + res500.90880.95
Faster RCNN + Vgg160.91130.95
YOLO v30.91190.97
Sliding window + LBP + SVM0.80120.85
Table 3. Comparison with other target detection methods.
VoltageArrangement of CapsOmissionFalseAccuracy
35 kV1·400100%
35 kV1·500100%
35 kV2·500100%
110 kV1·71098%
110 kV1·81098%
110 kV2·81294%
220 kV1·131098%
220 kV1·151196%
220 kV2·161392%
Table 4. Comparison with other target detection methods.
TypeNoiseAccuracy
Short insulator [35 kV, 110 kV]None0.98
Gaussian (v = 0.005)0.98
Gaussian (v = 0.01)0.98
Long insulator [220 kV, 550 kV]None0.94
Gaussian (v = 0.005)0.94
Gaussian (v = 0.01)0.90
Table 5. Comparison with other target detection methods.
MethodFalseOmissionAccuracy
Our method110.98
Method 1630.91
Method 2310.96
Method 31610.83
Publisher’s Note: MDPI stays neutral with regard to jurisdictional claims in published maps and institutional affiliations.

