
Numerical Study on Liquid-Return Characteristics in the Accumulator of the R290 Rotary Compressor


Abstract
:1. Introduction
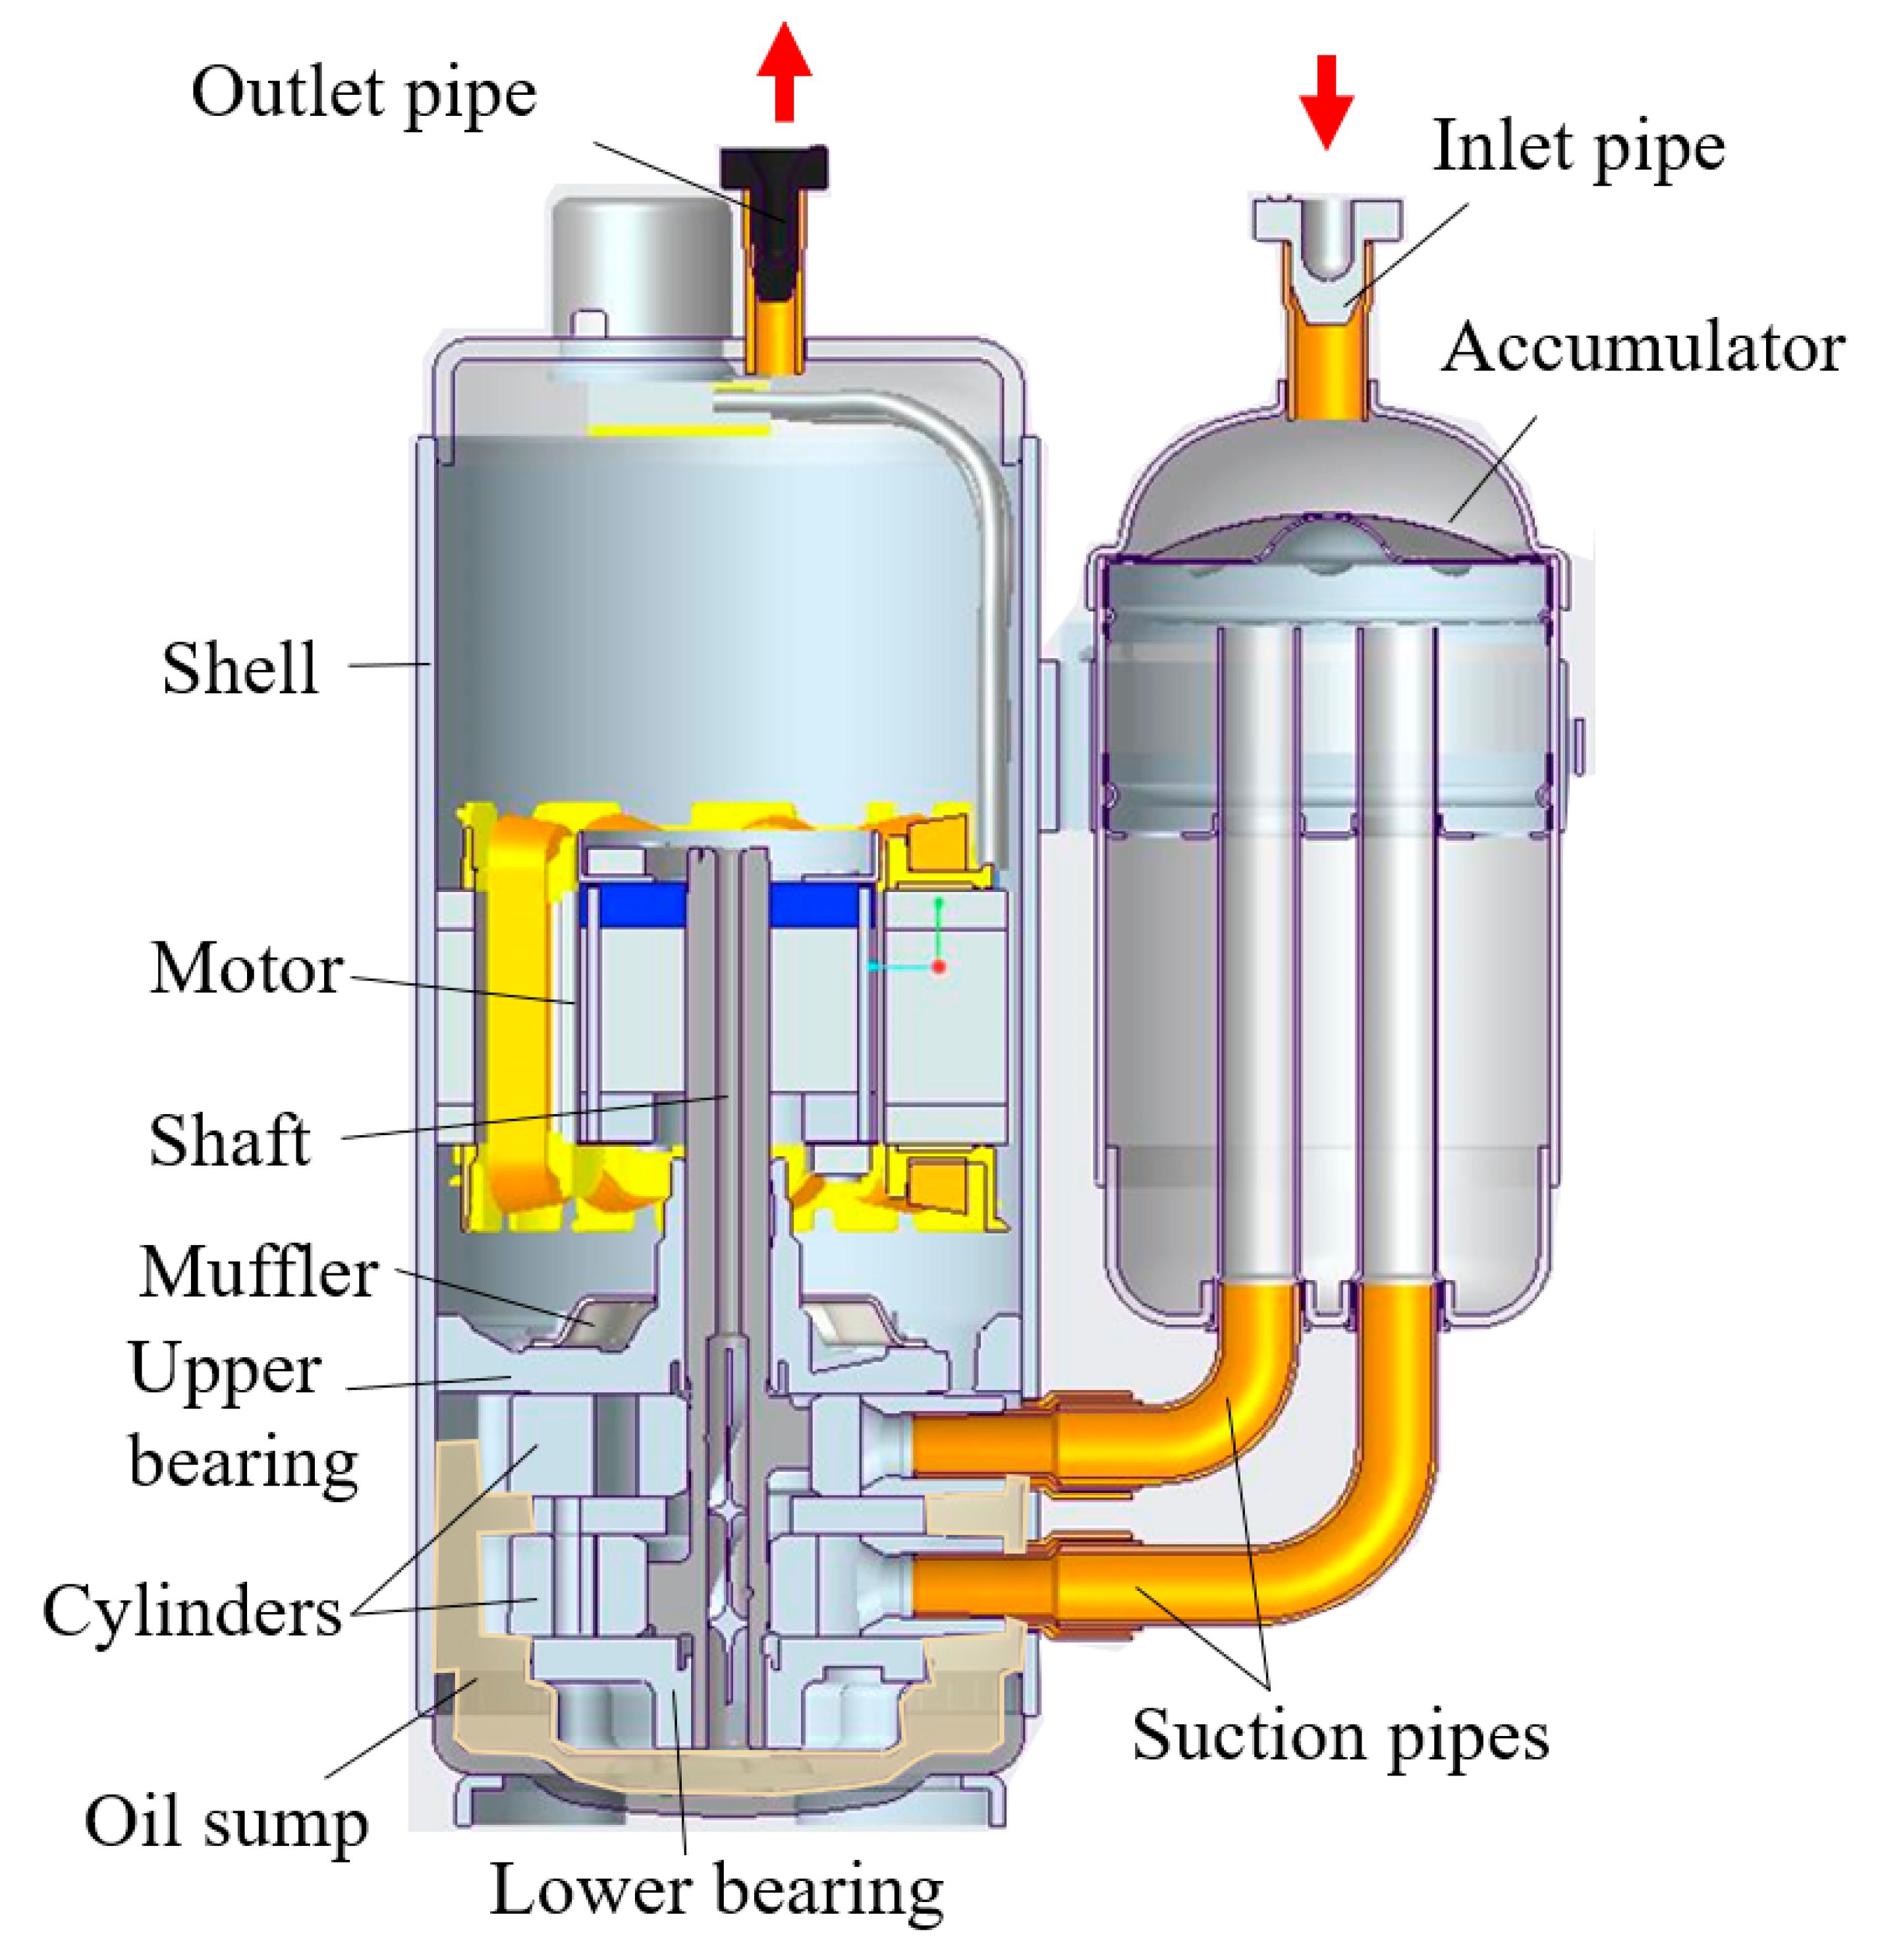
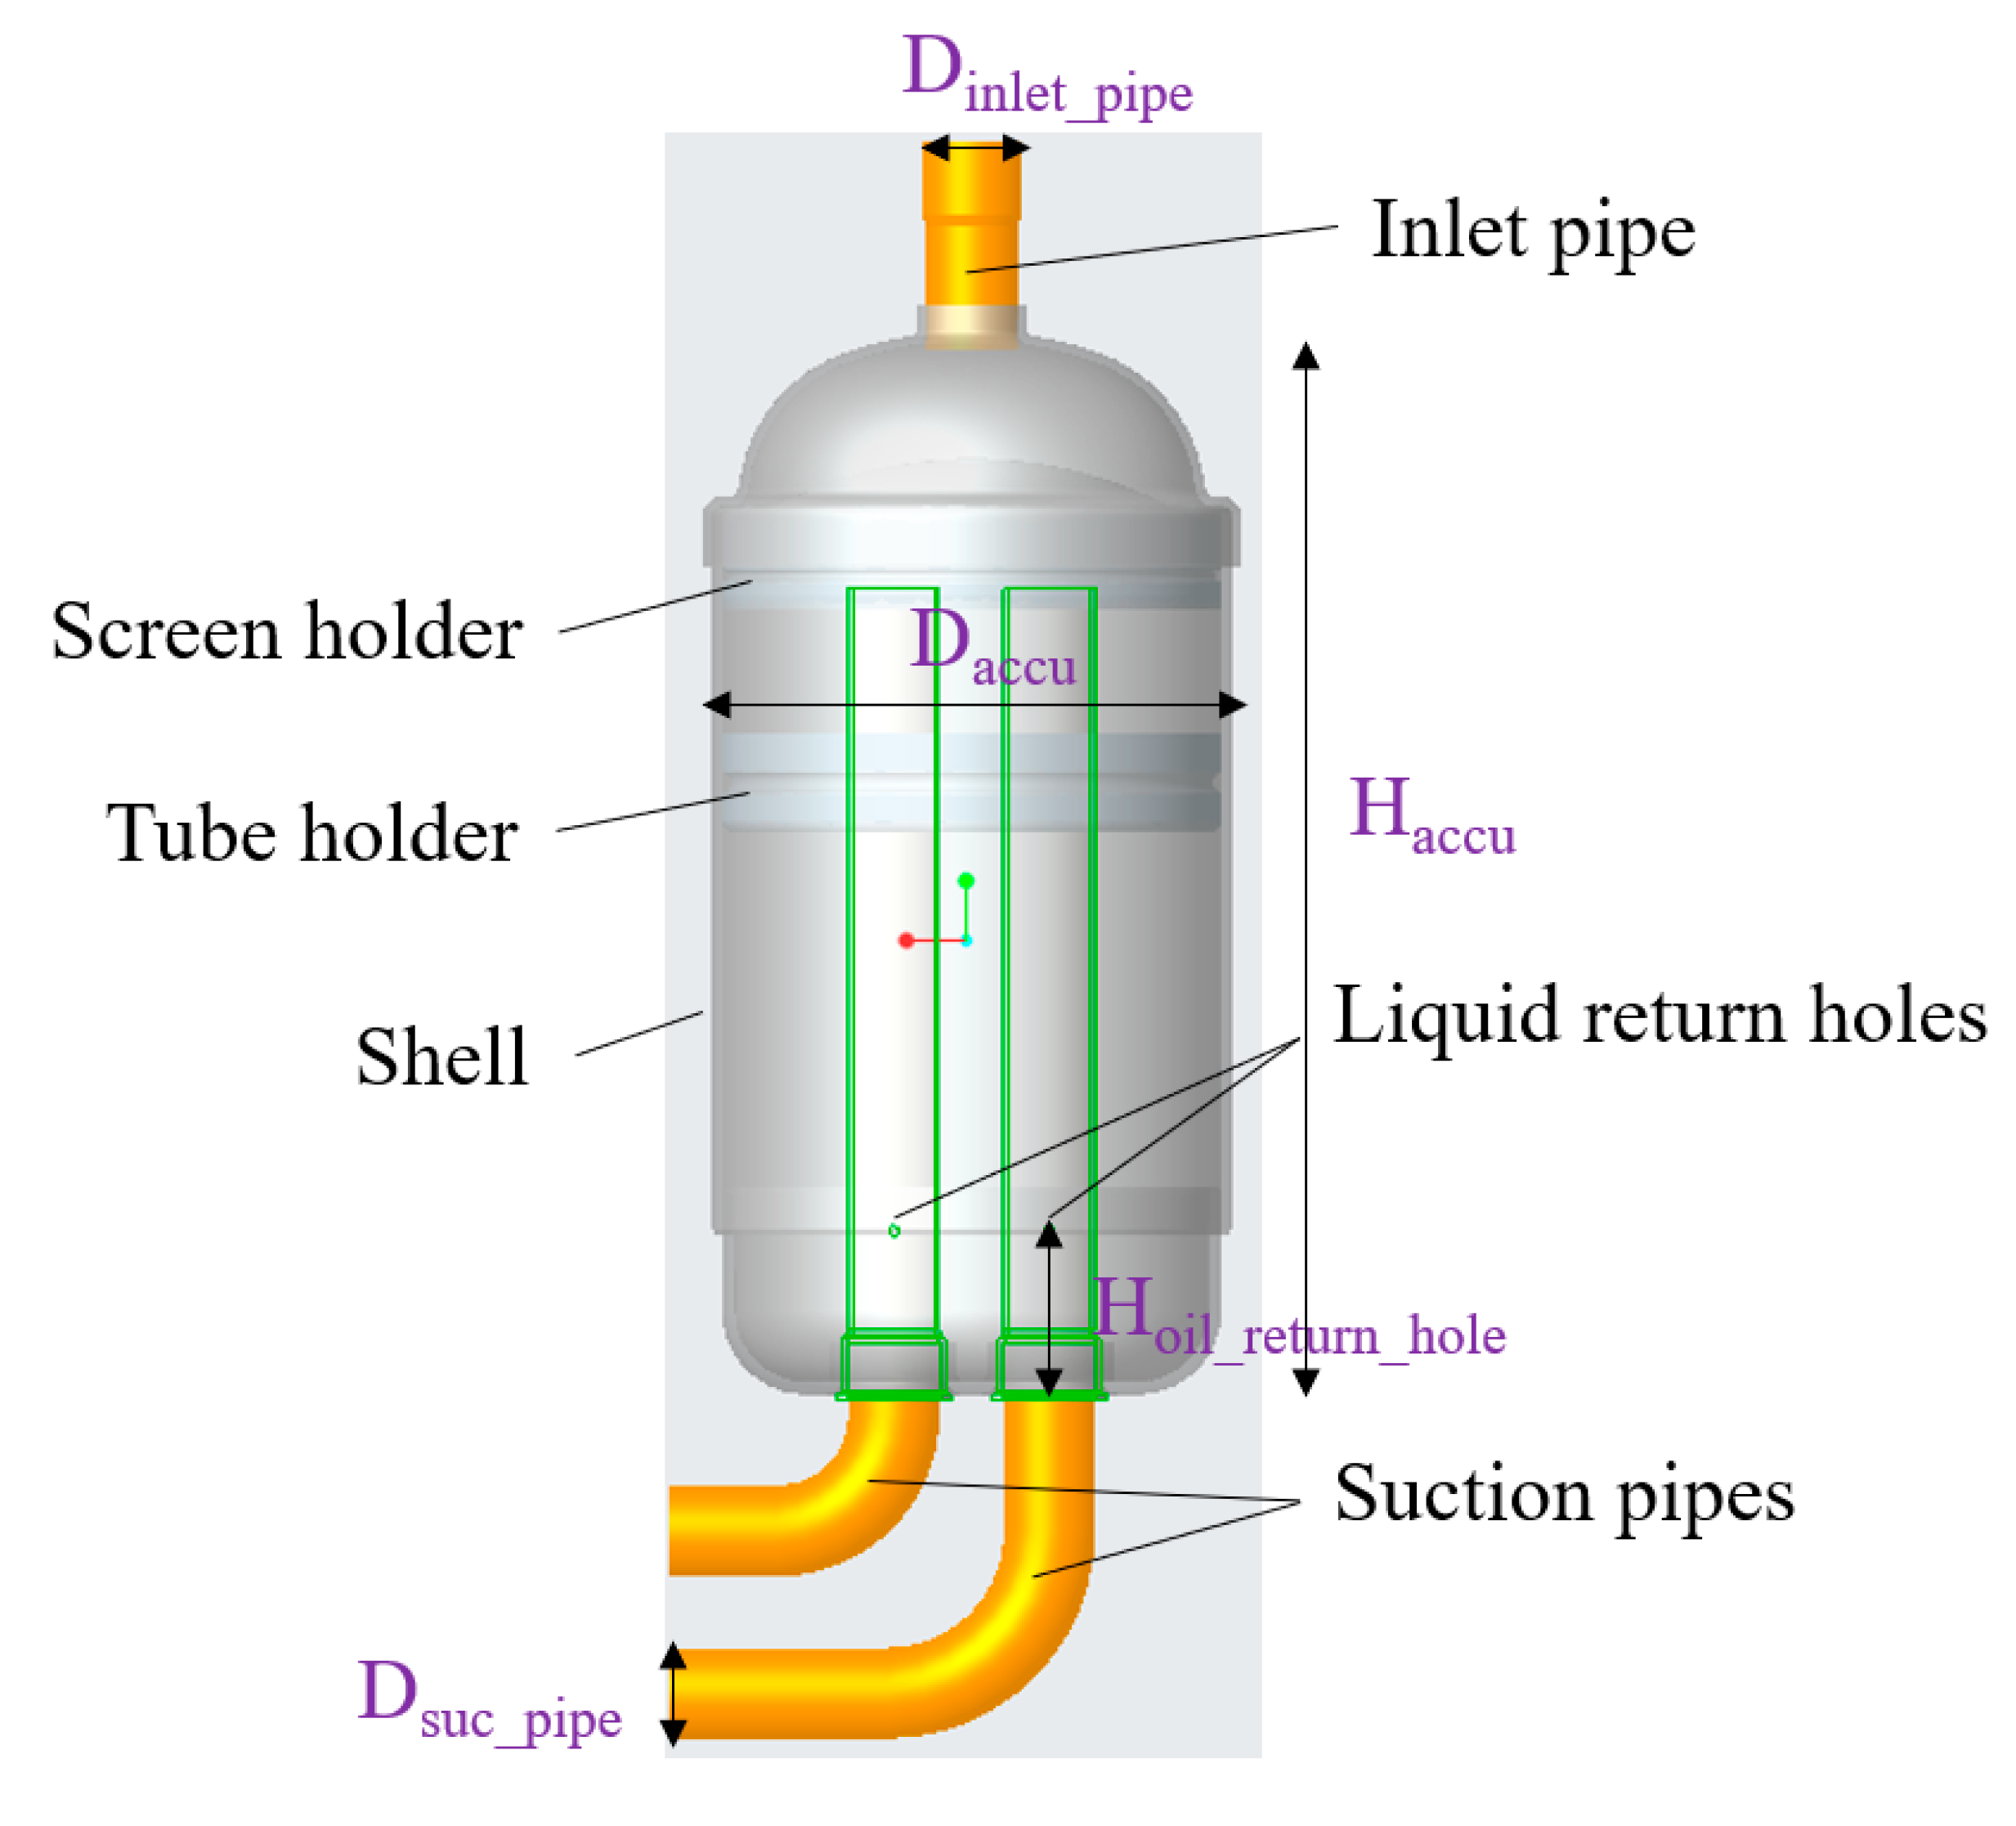
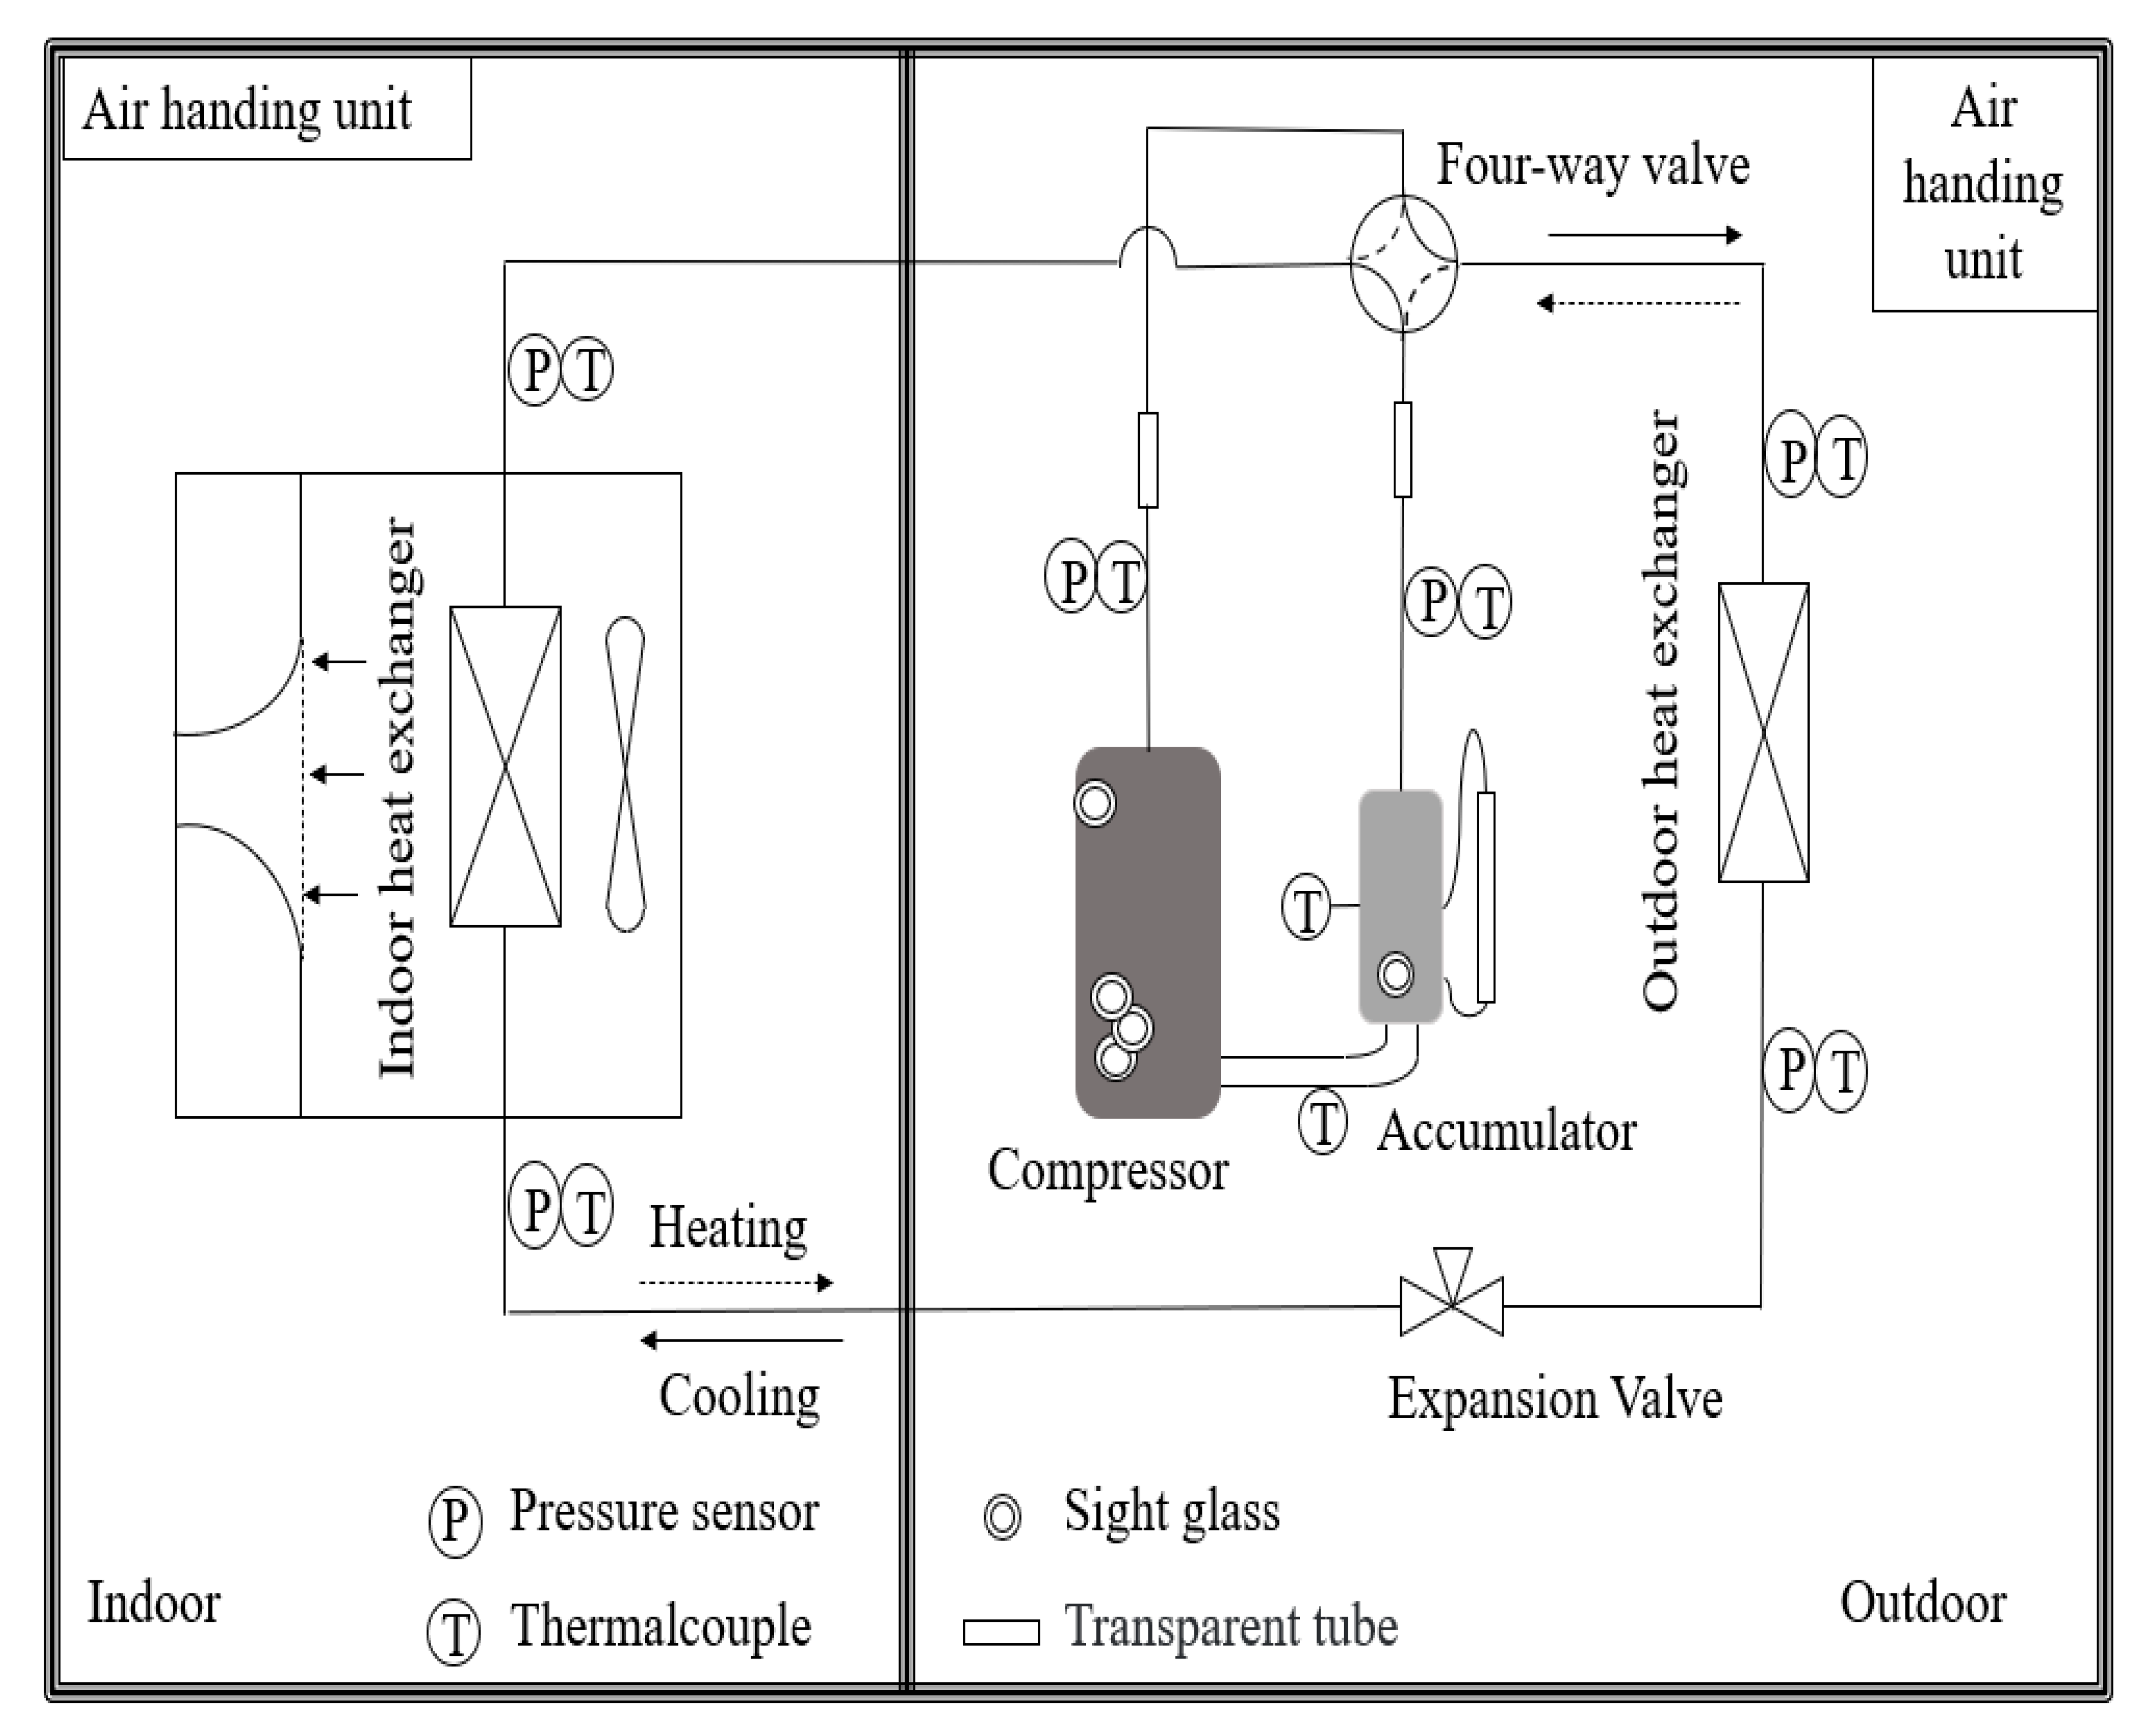
2. Modeling
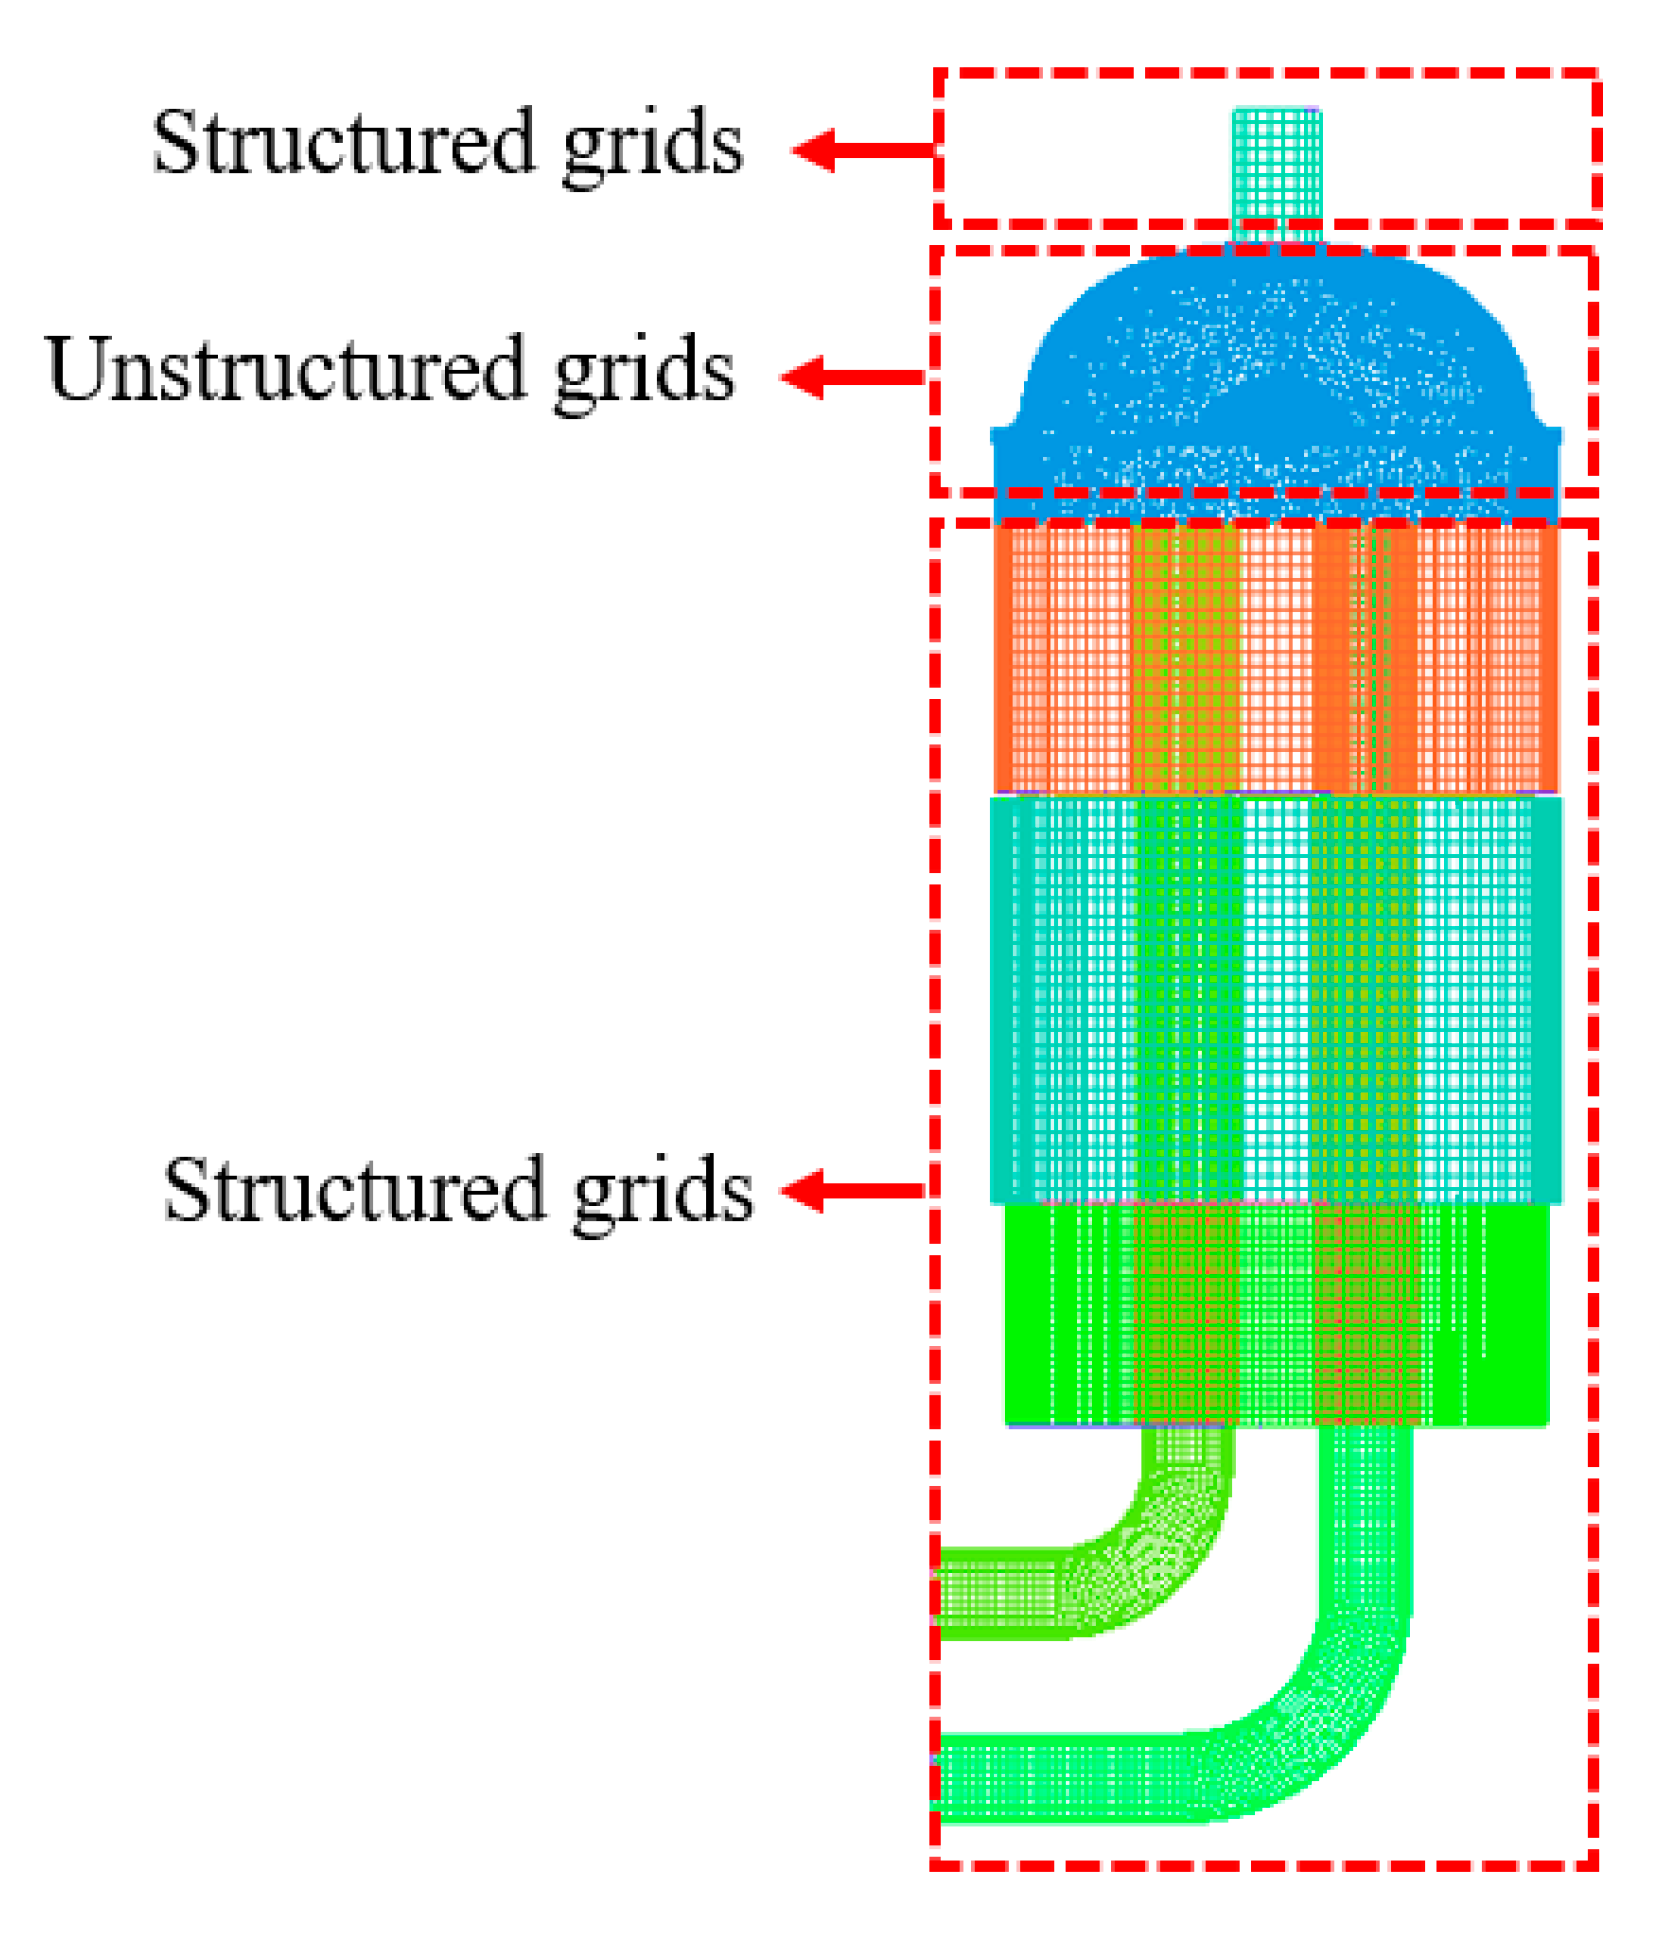
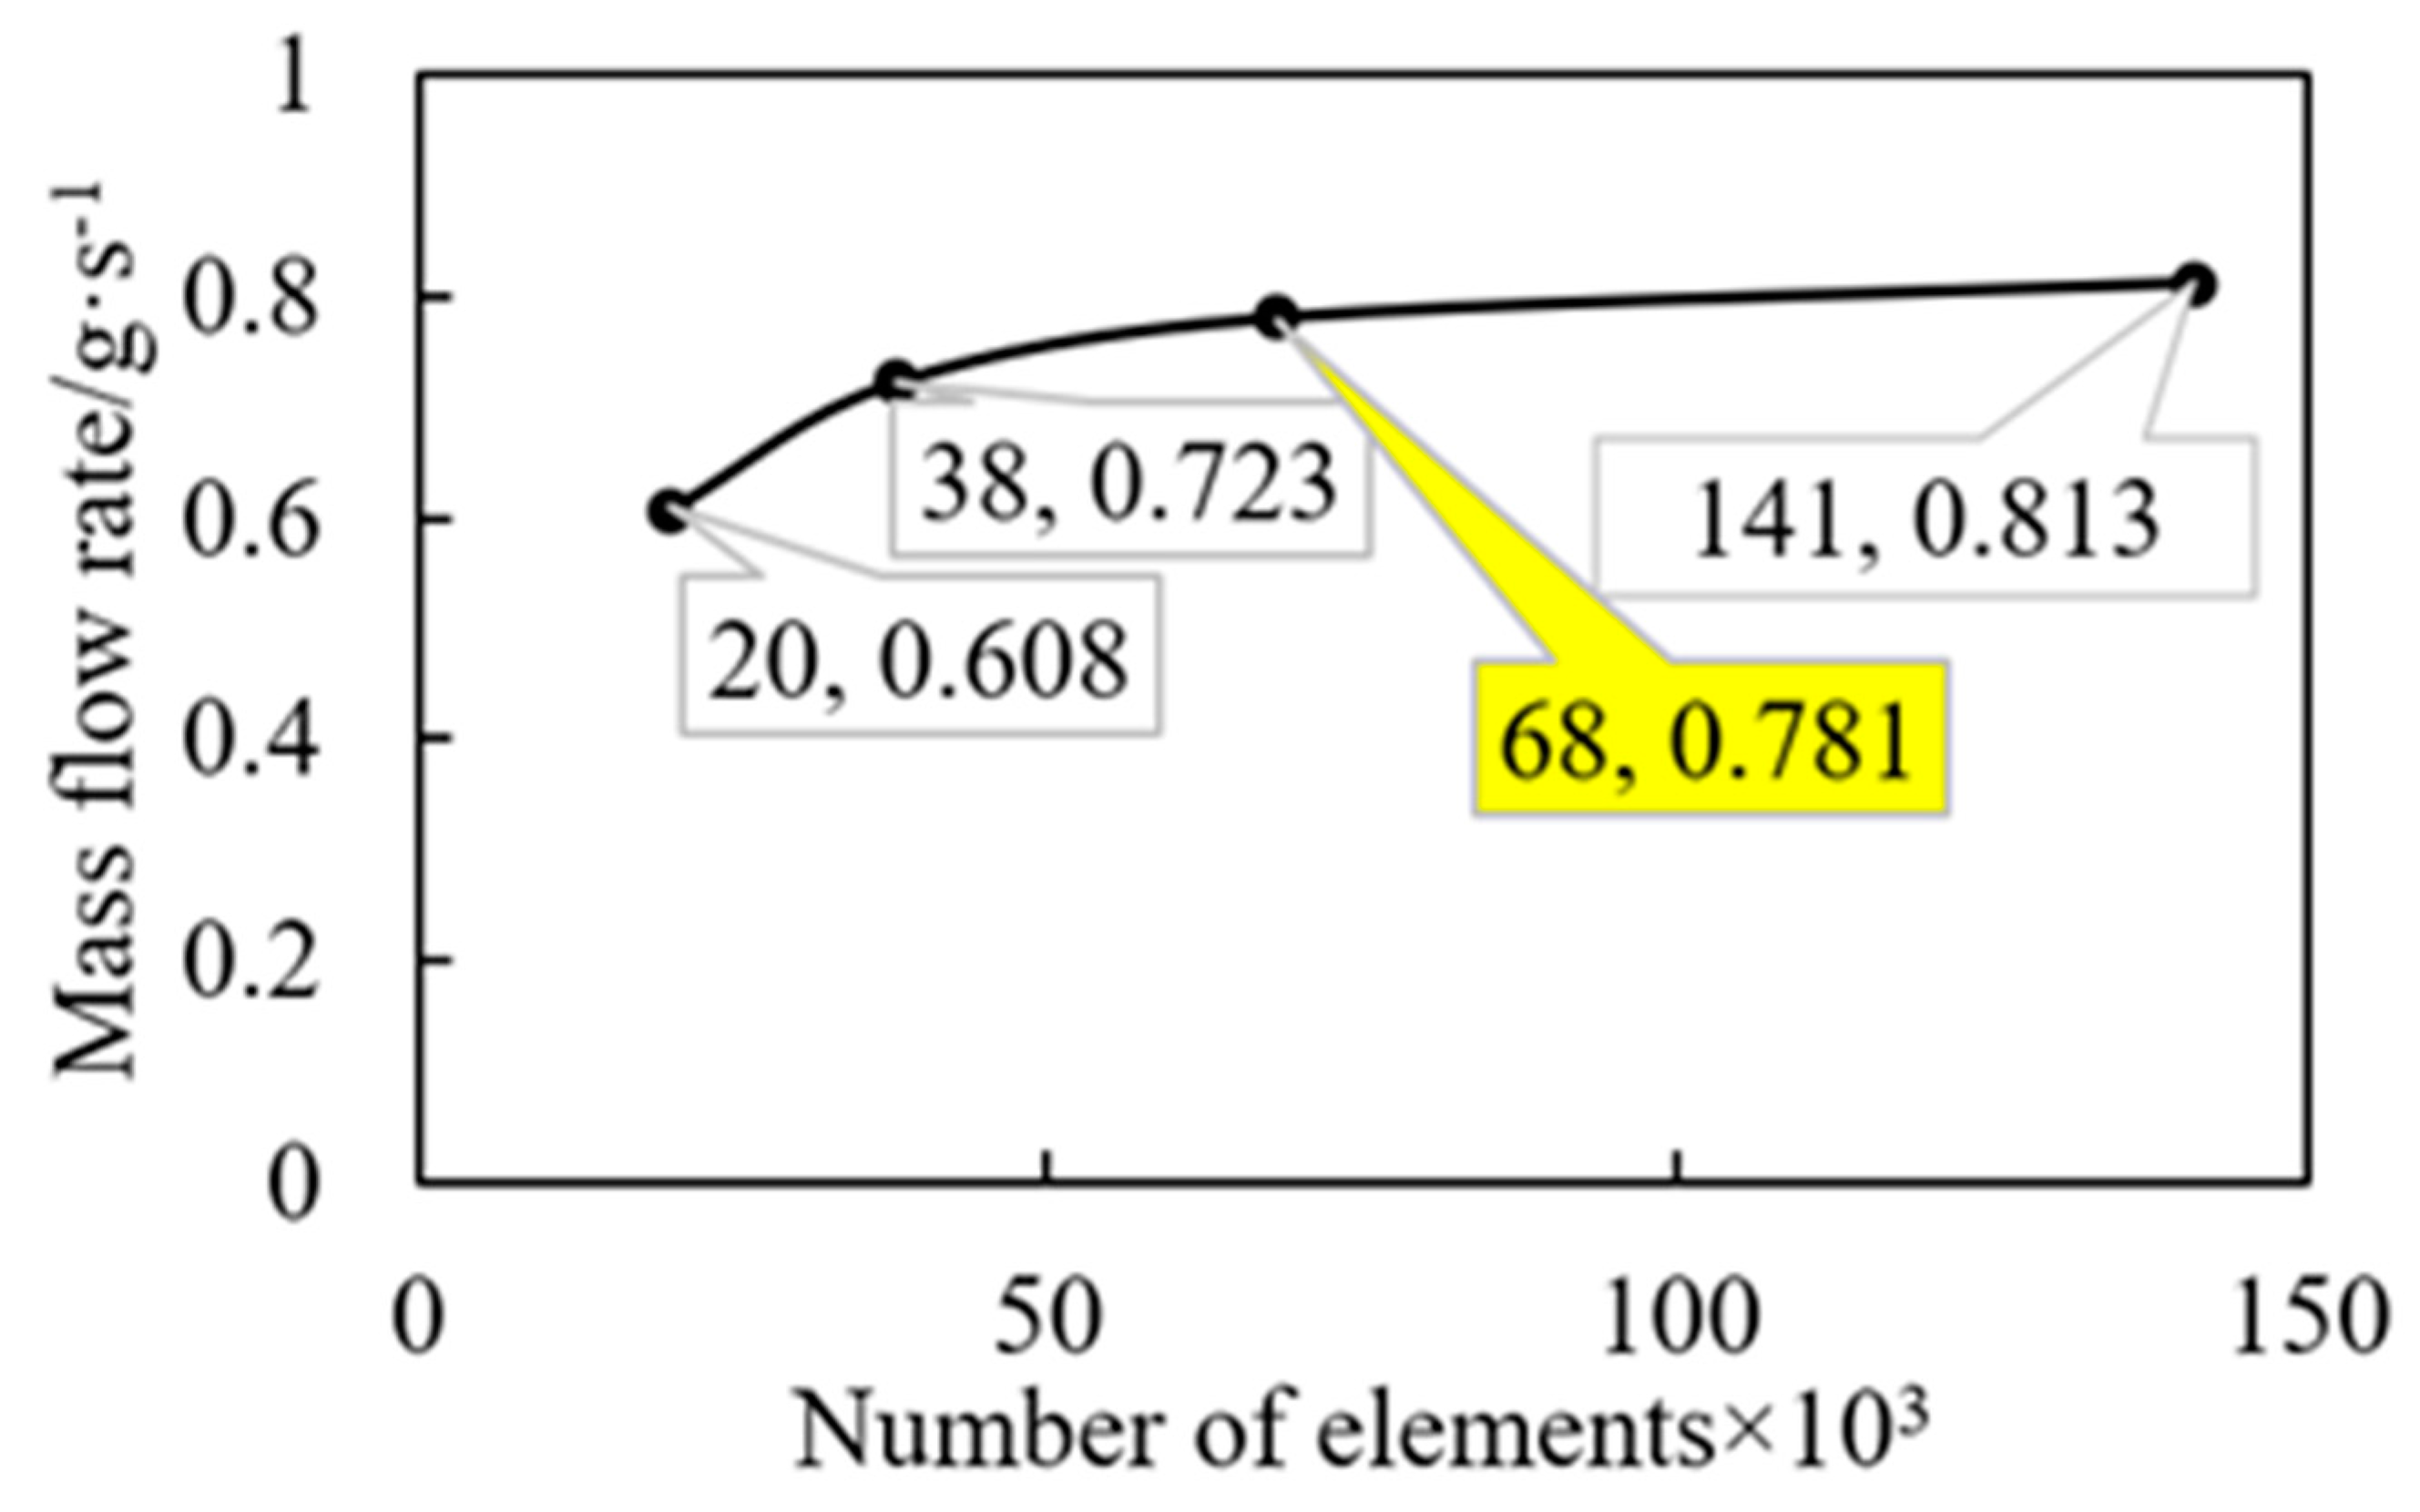
2.1. Physical Model and Meshing
2.2. Boundary Conditions and Initial Conditions
2.2.1. Inlet of the Accumulator
2.2.2. Outlet of the Accumulator
2.2.3. Initial Conditions
2.3. Thermal-Physical Properties of Refrigerant and Oil
2.3.1. Density and Viscosity
2.3.2. Surface Tension
2.4. Fundamentals of CFD Method
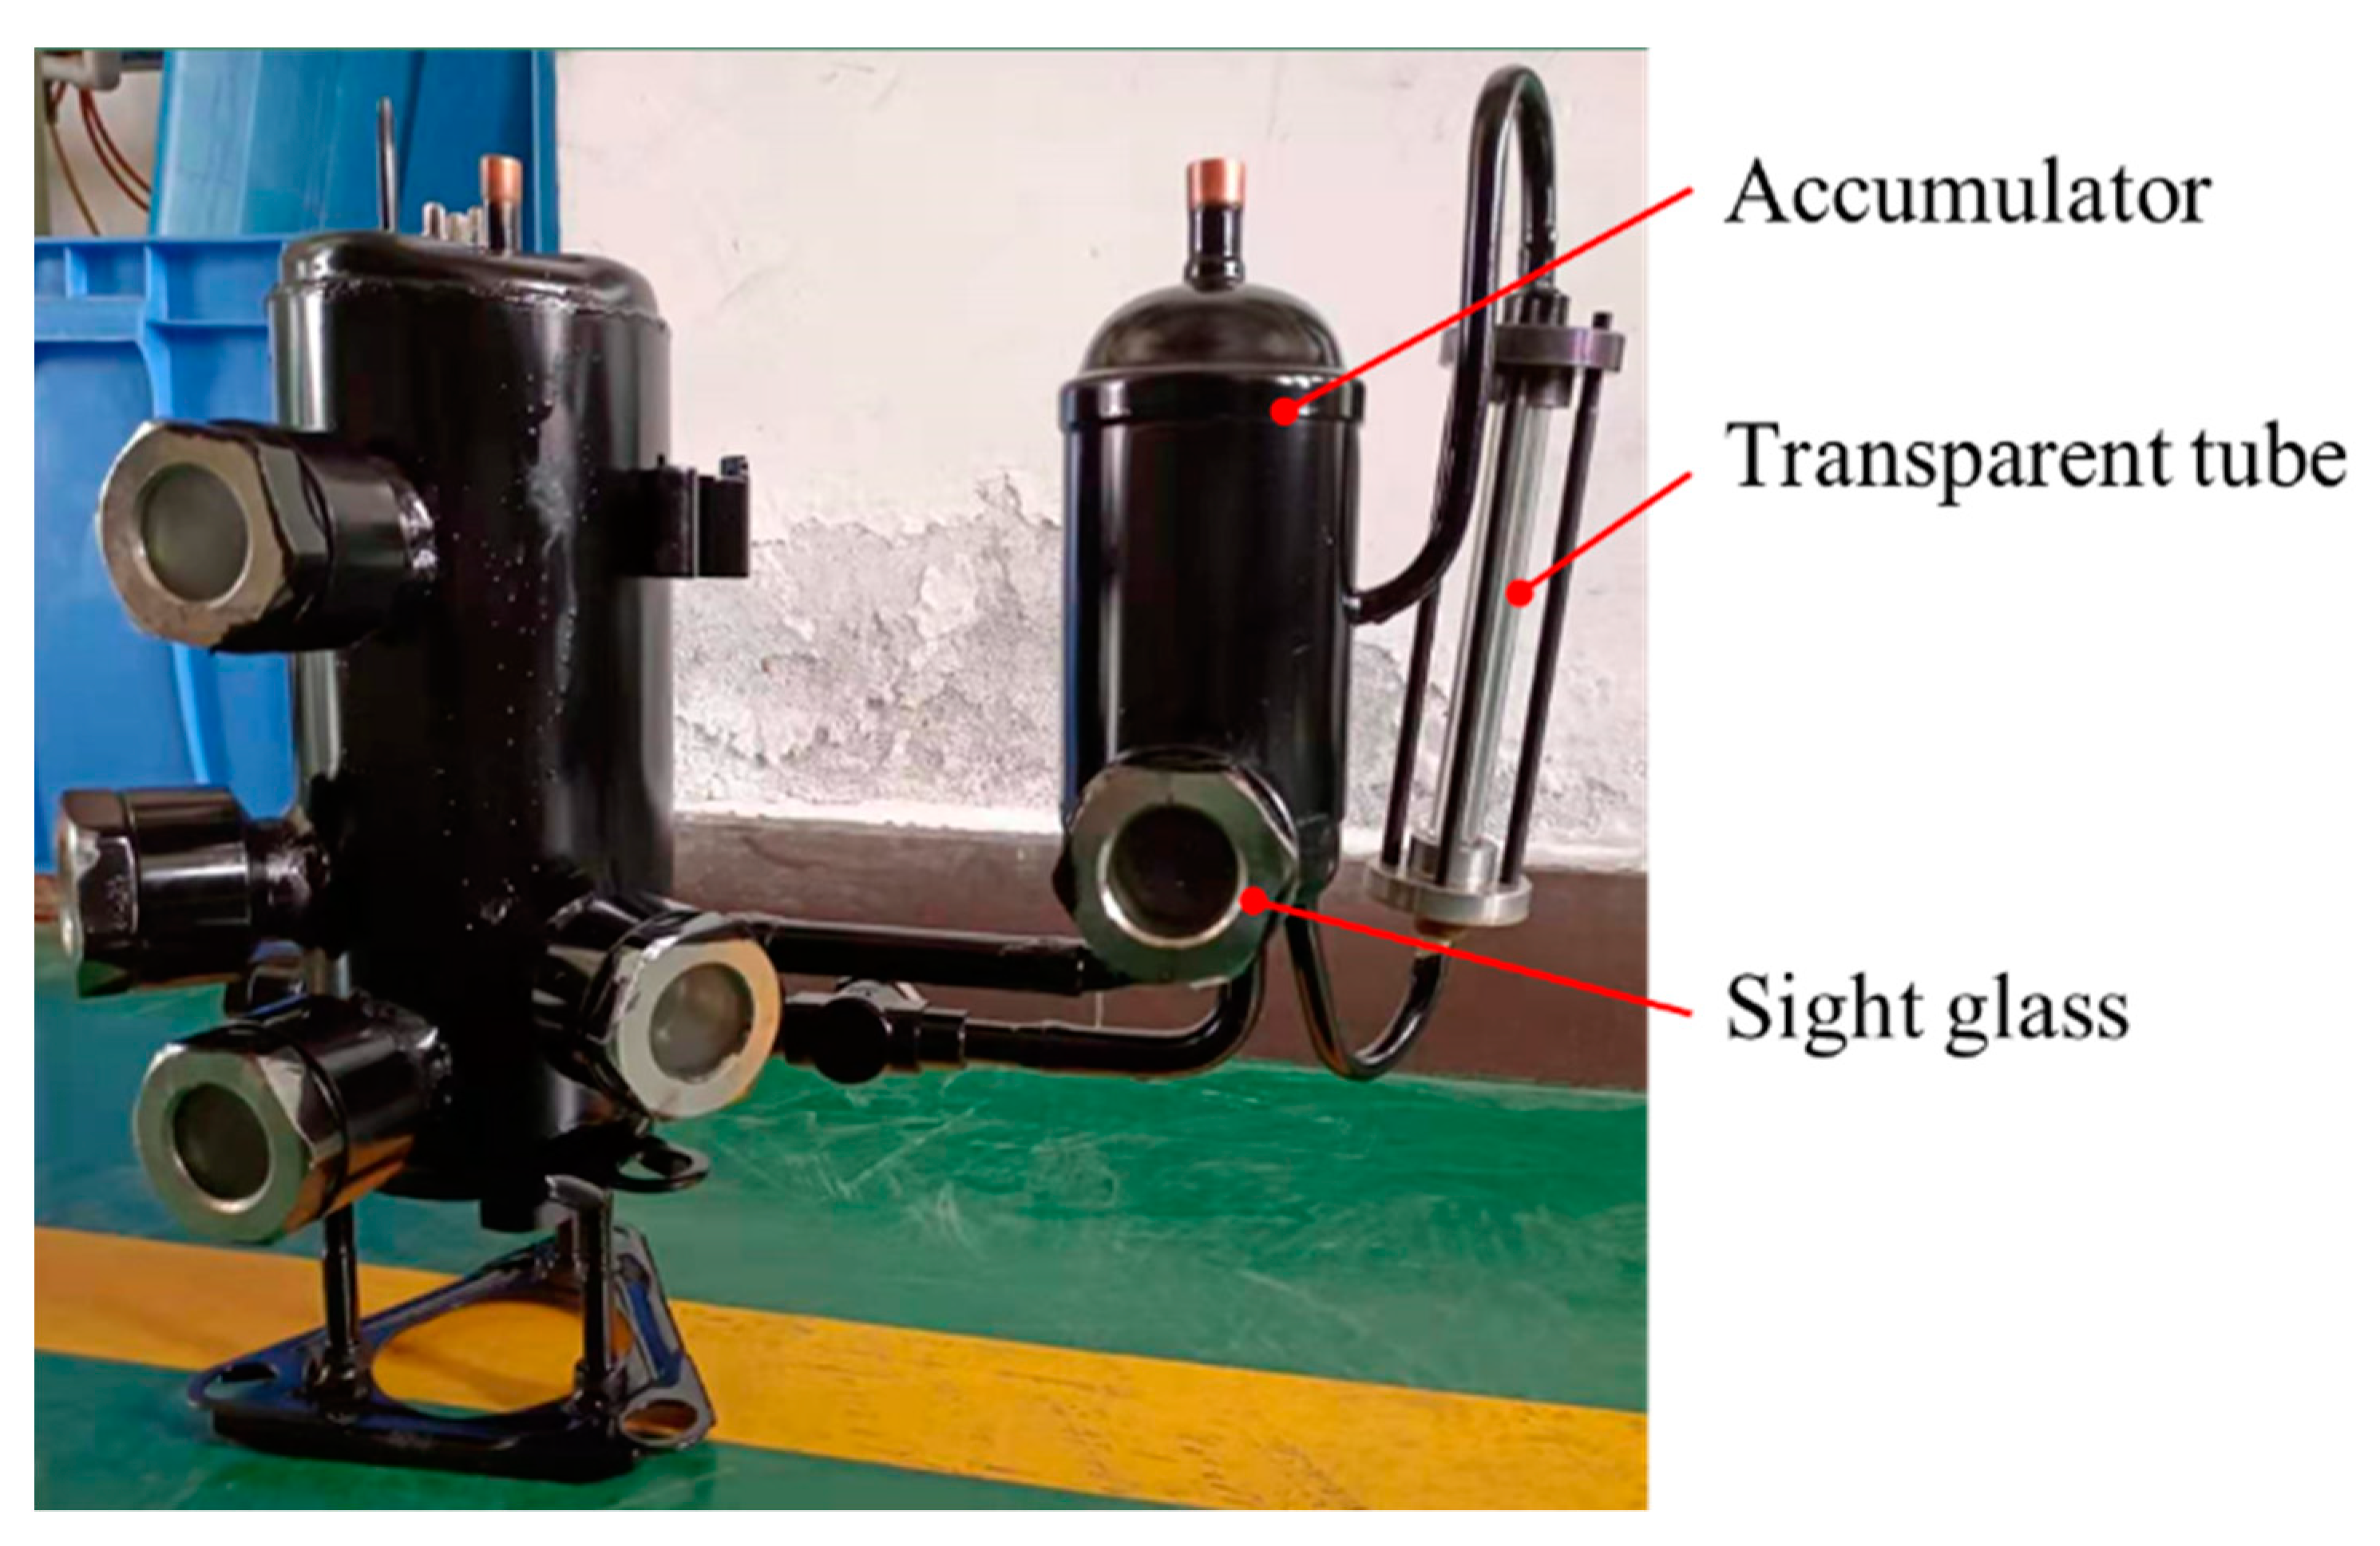
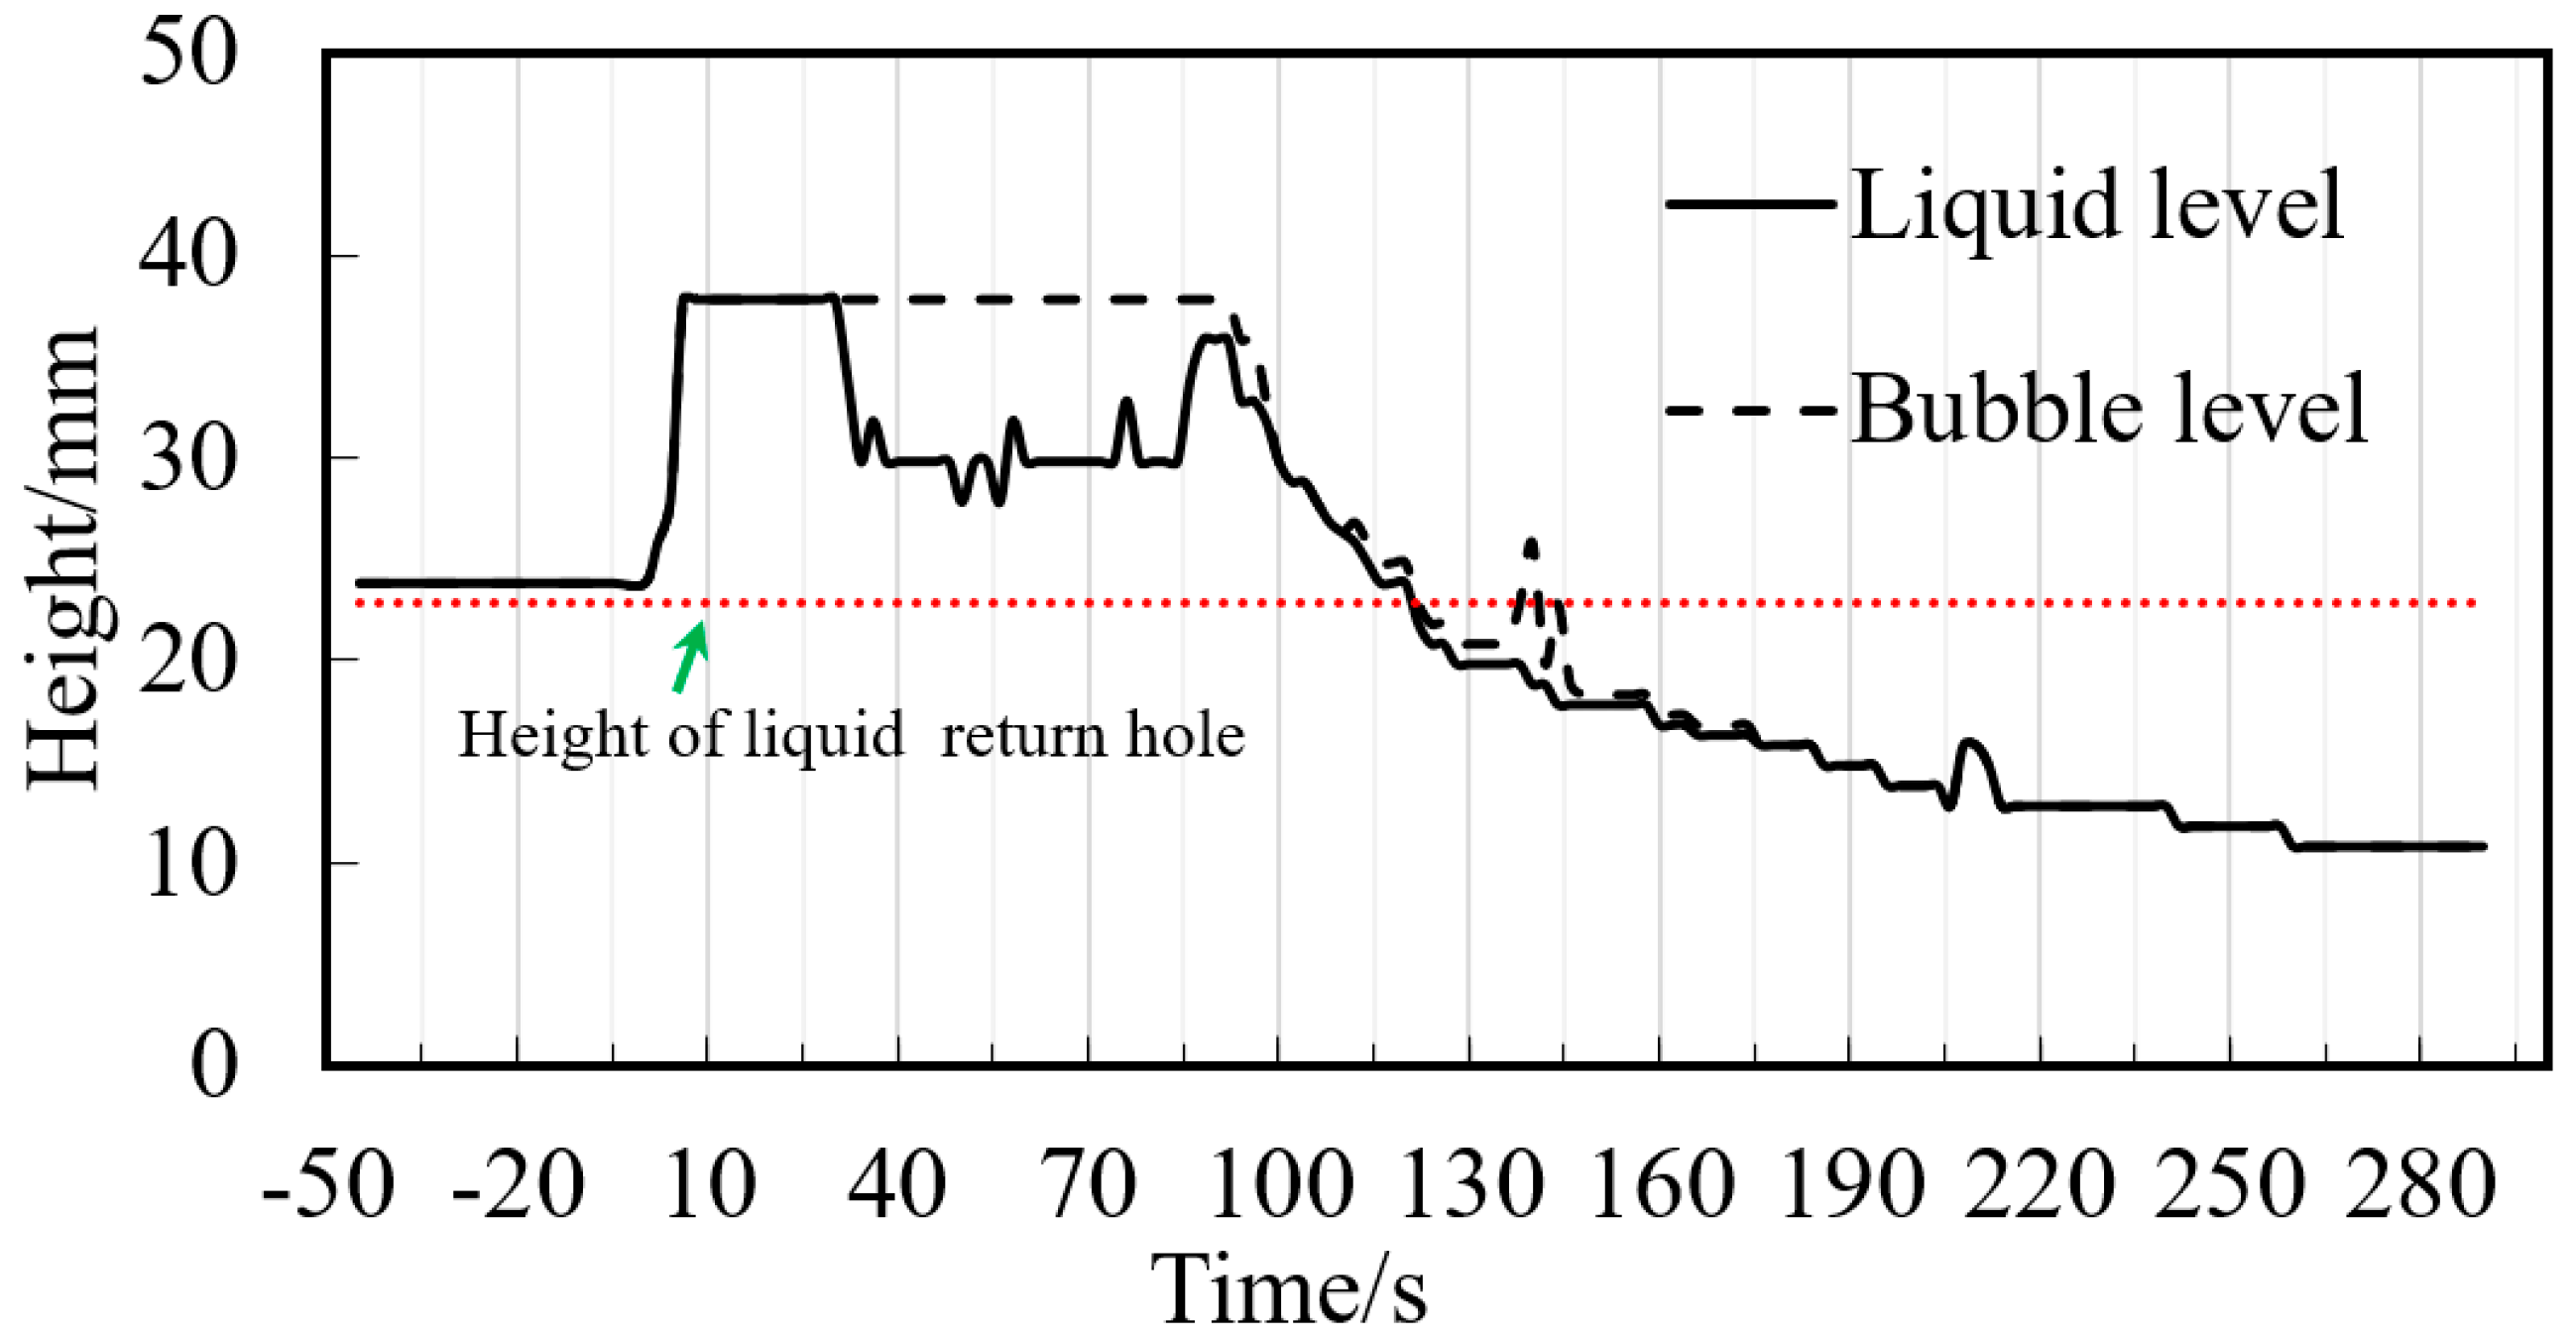
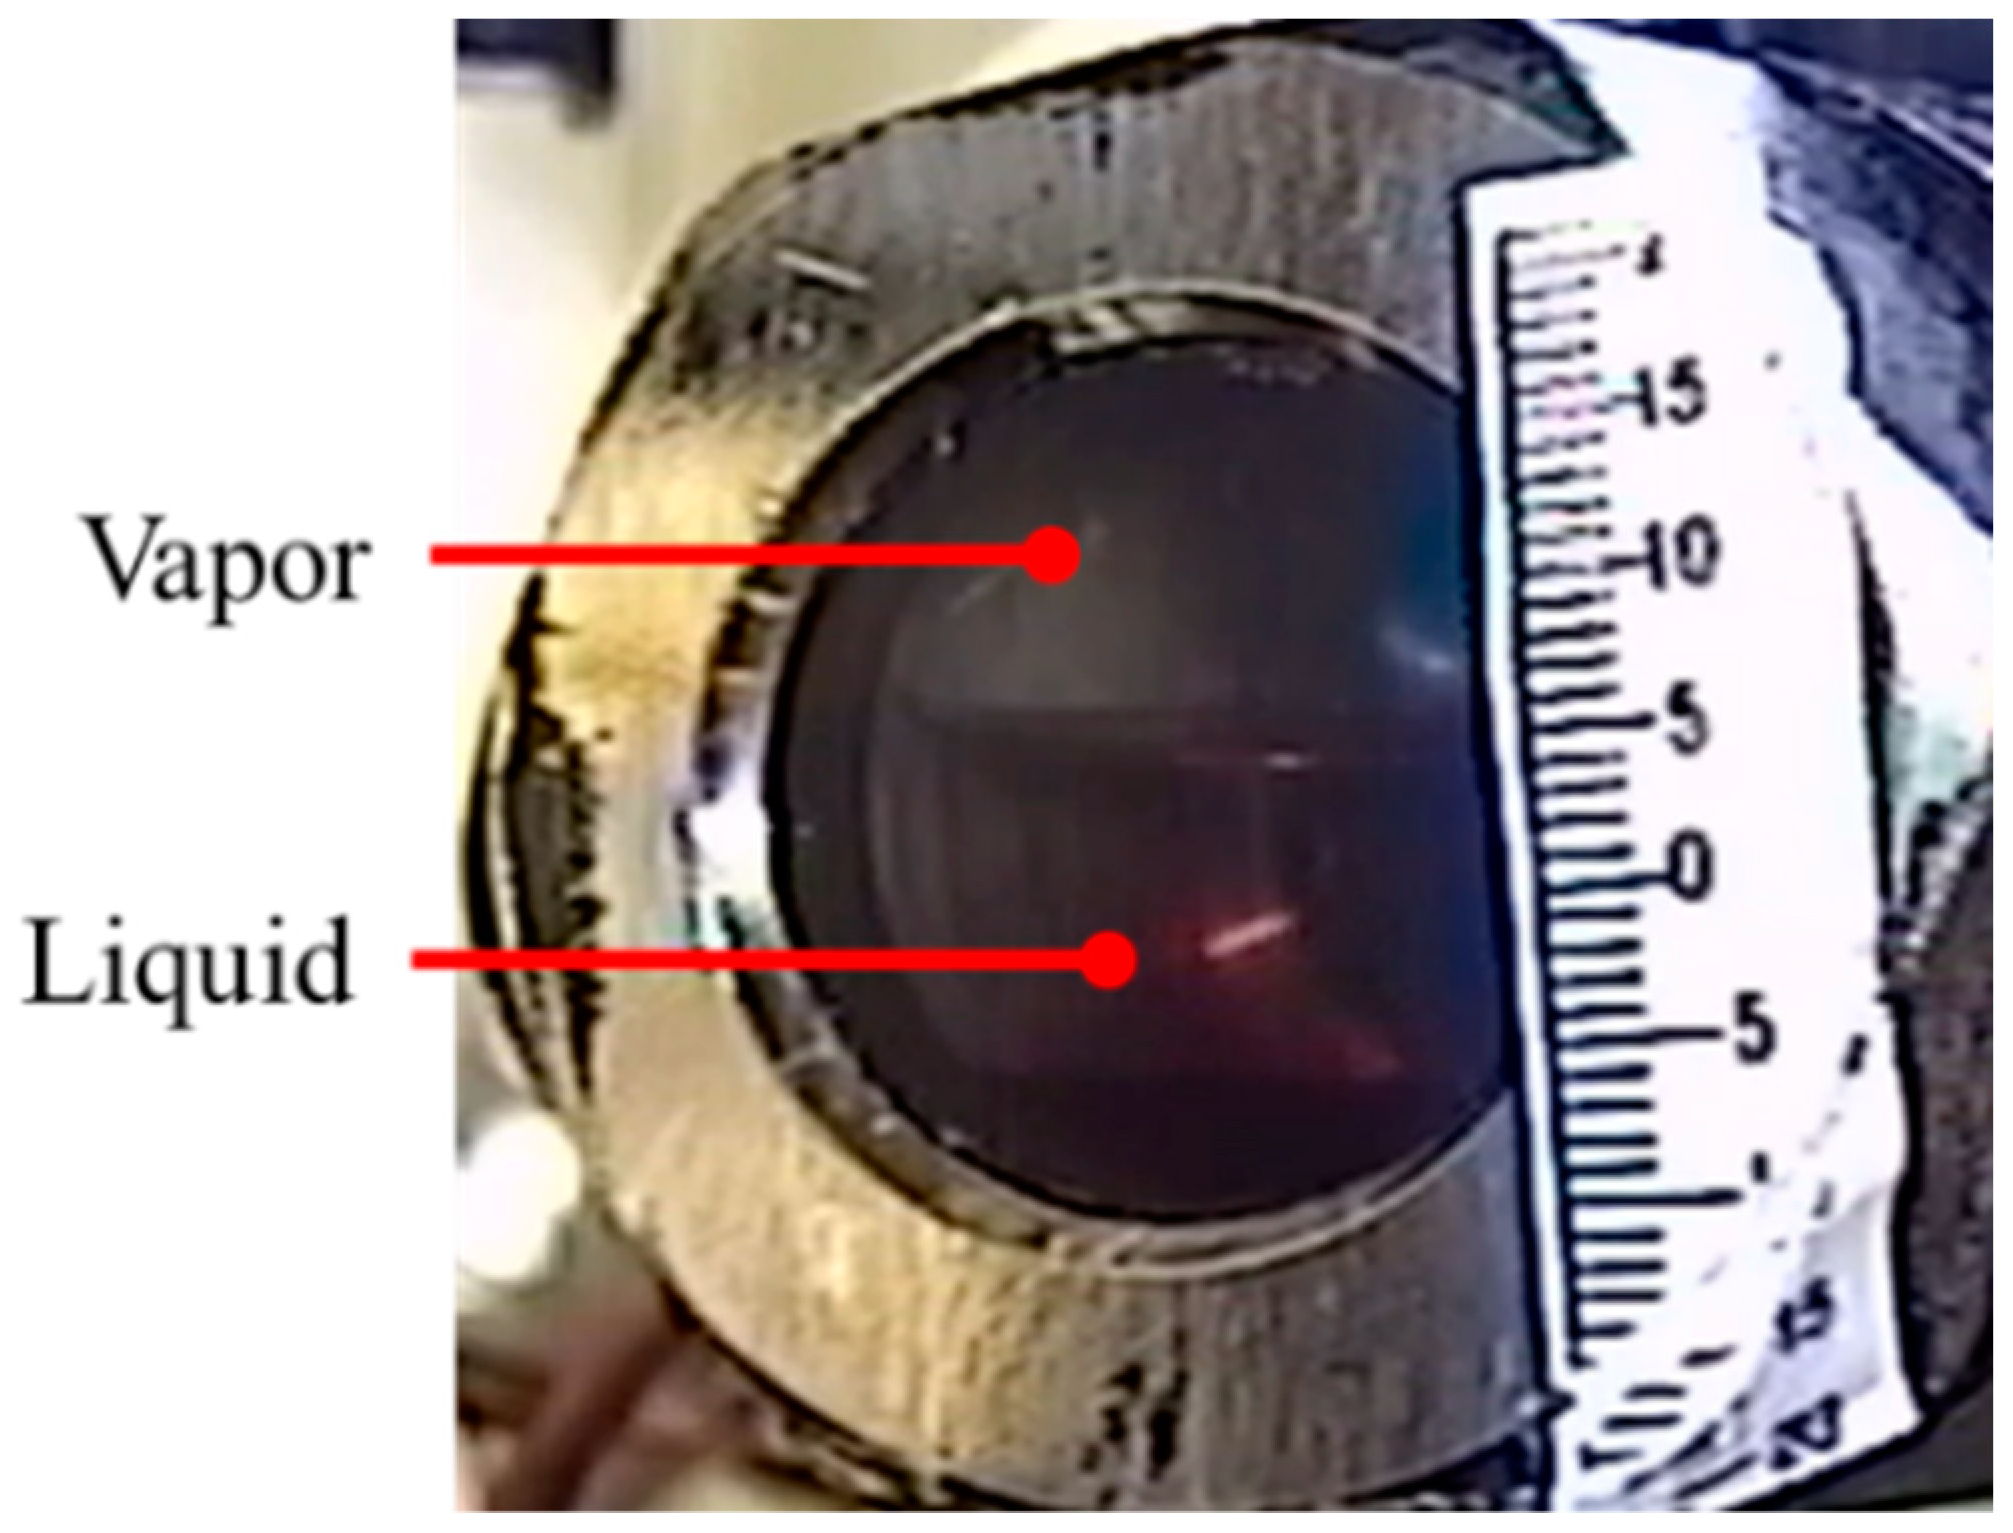
3. Experimental Verification
4. Results and Discussion
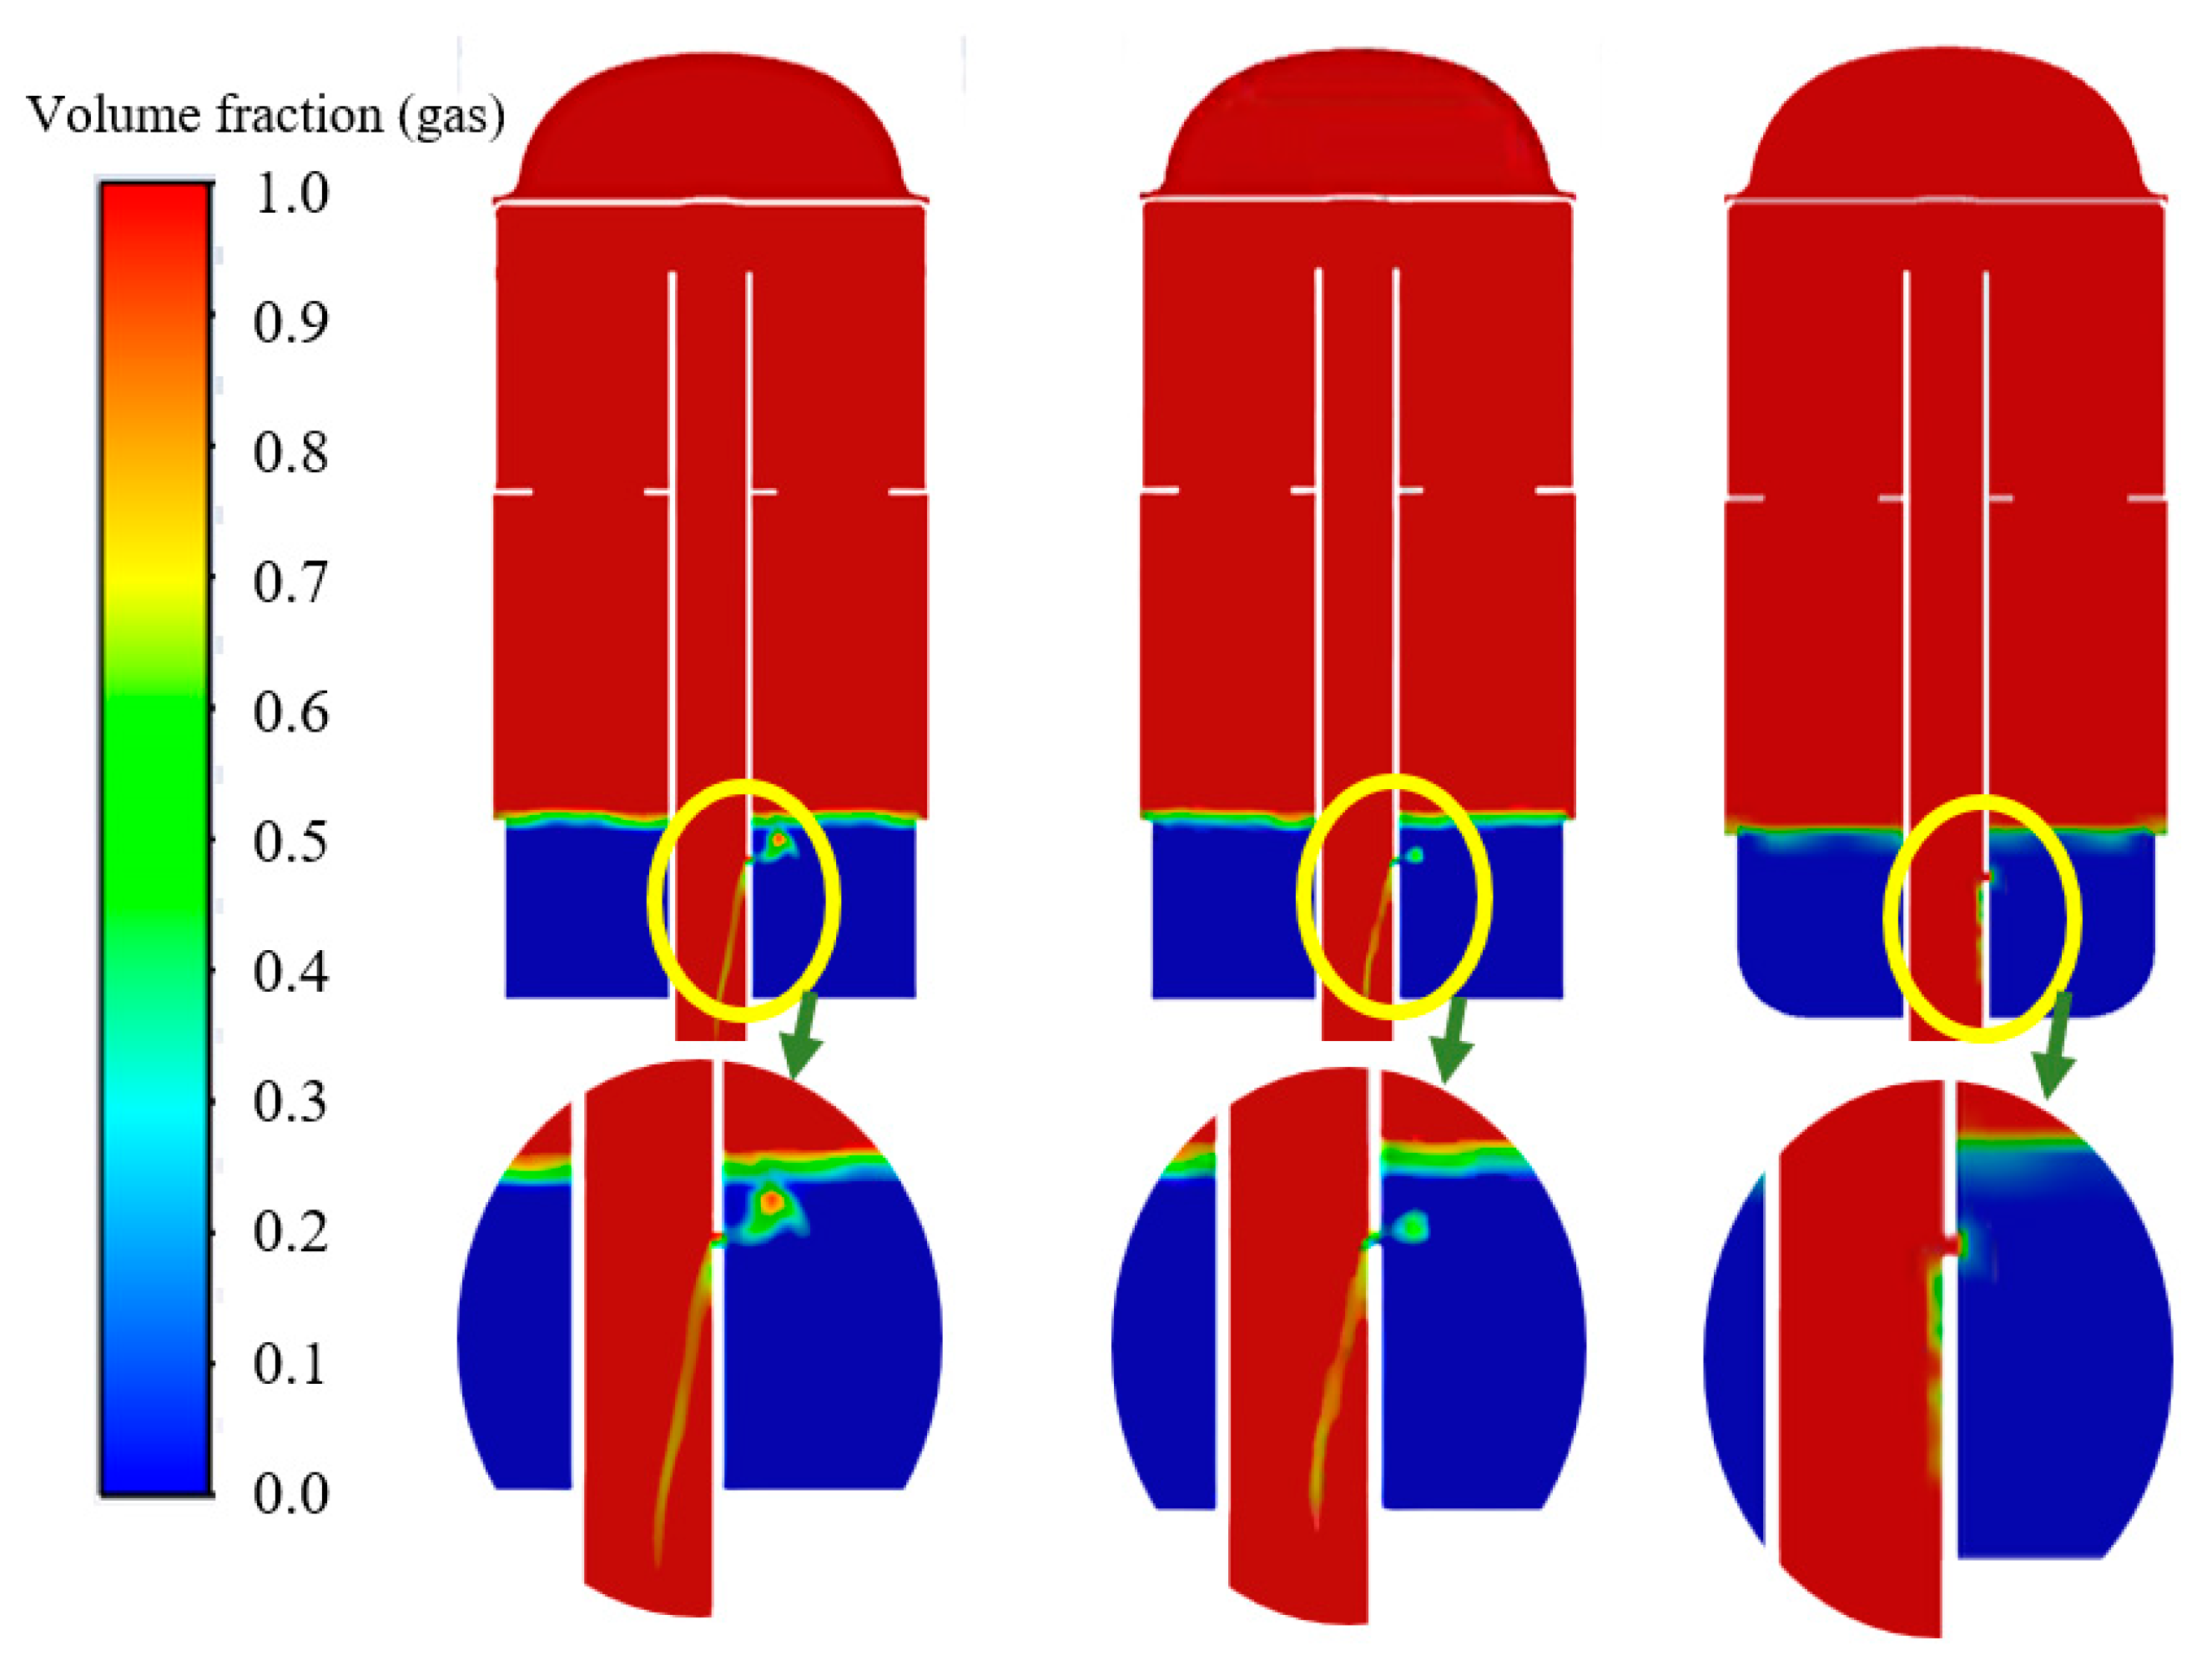
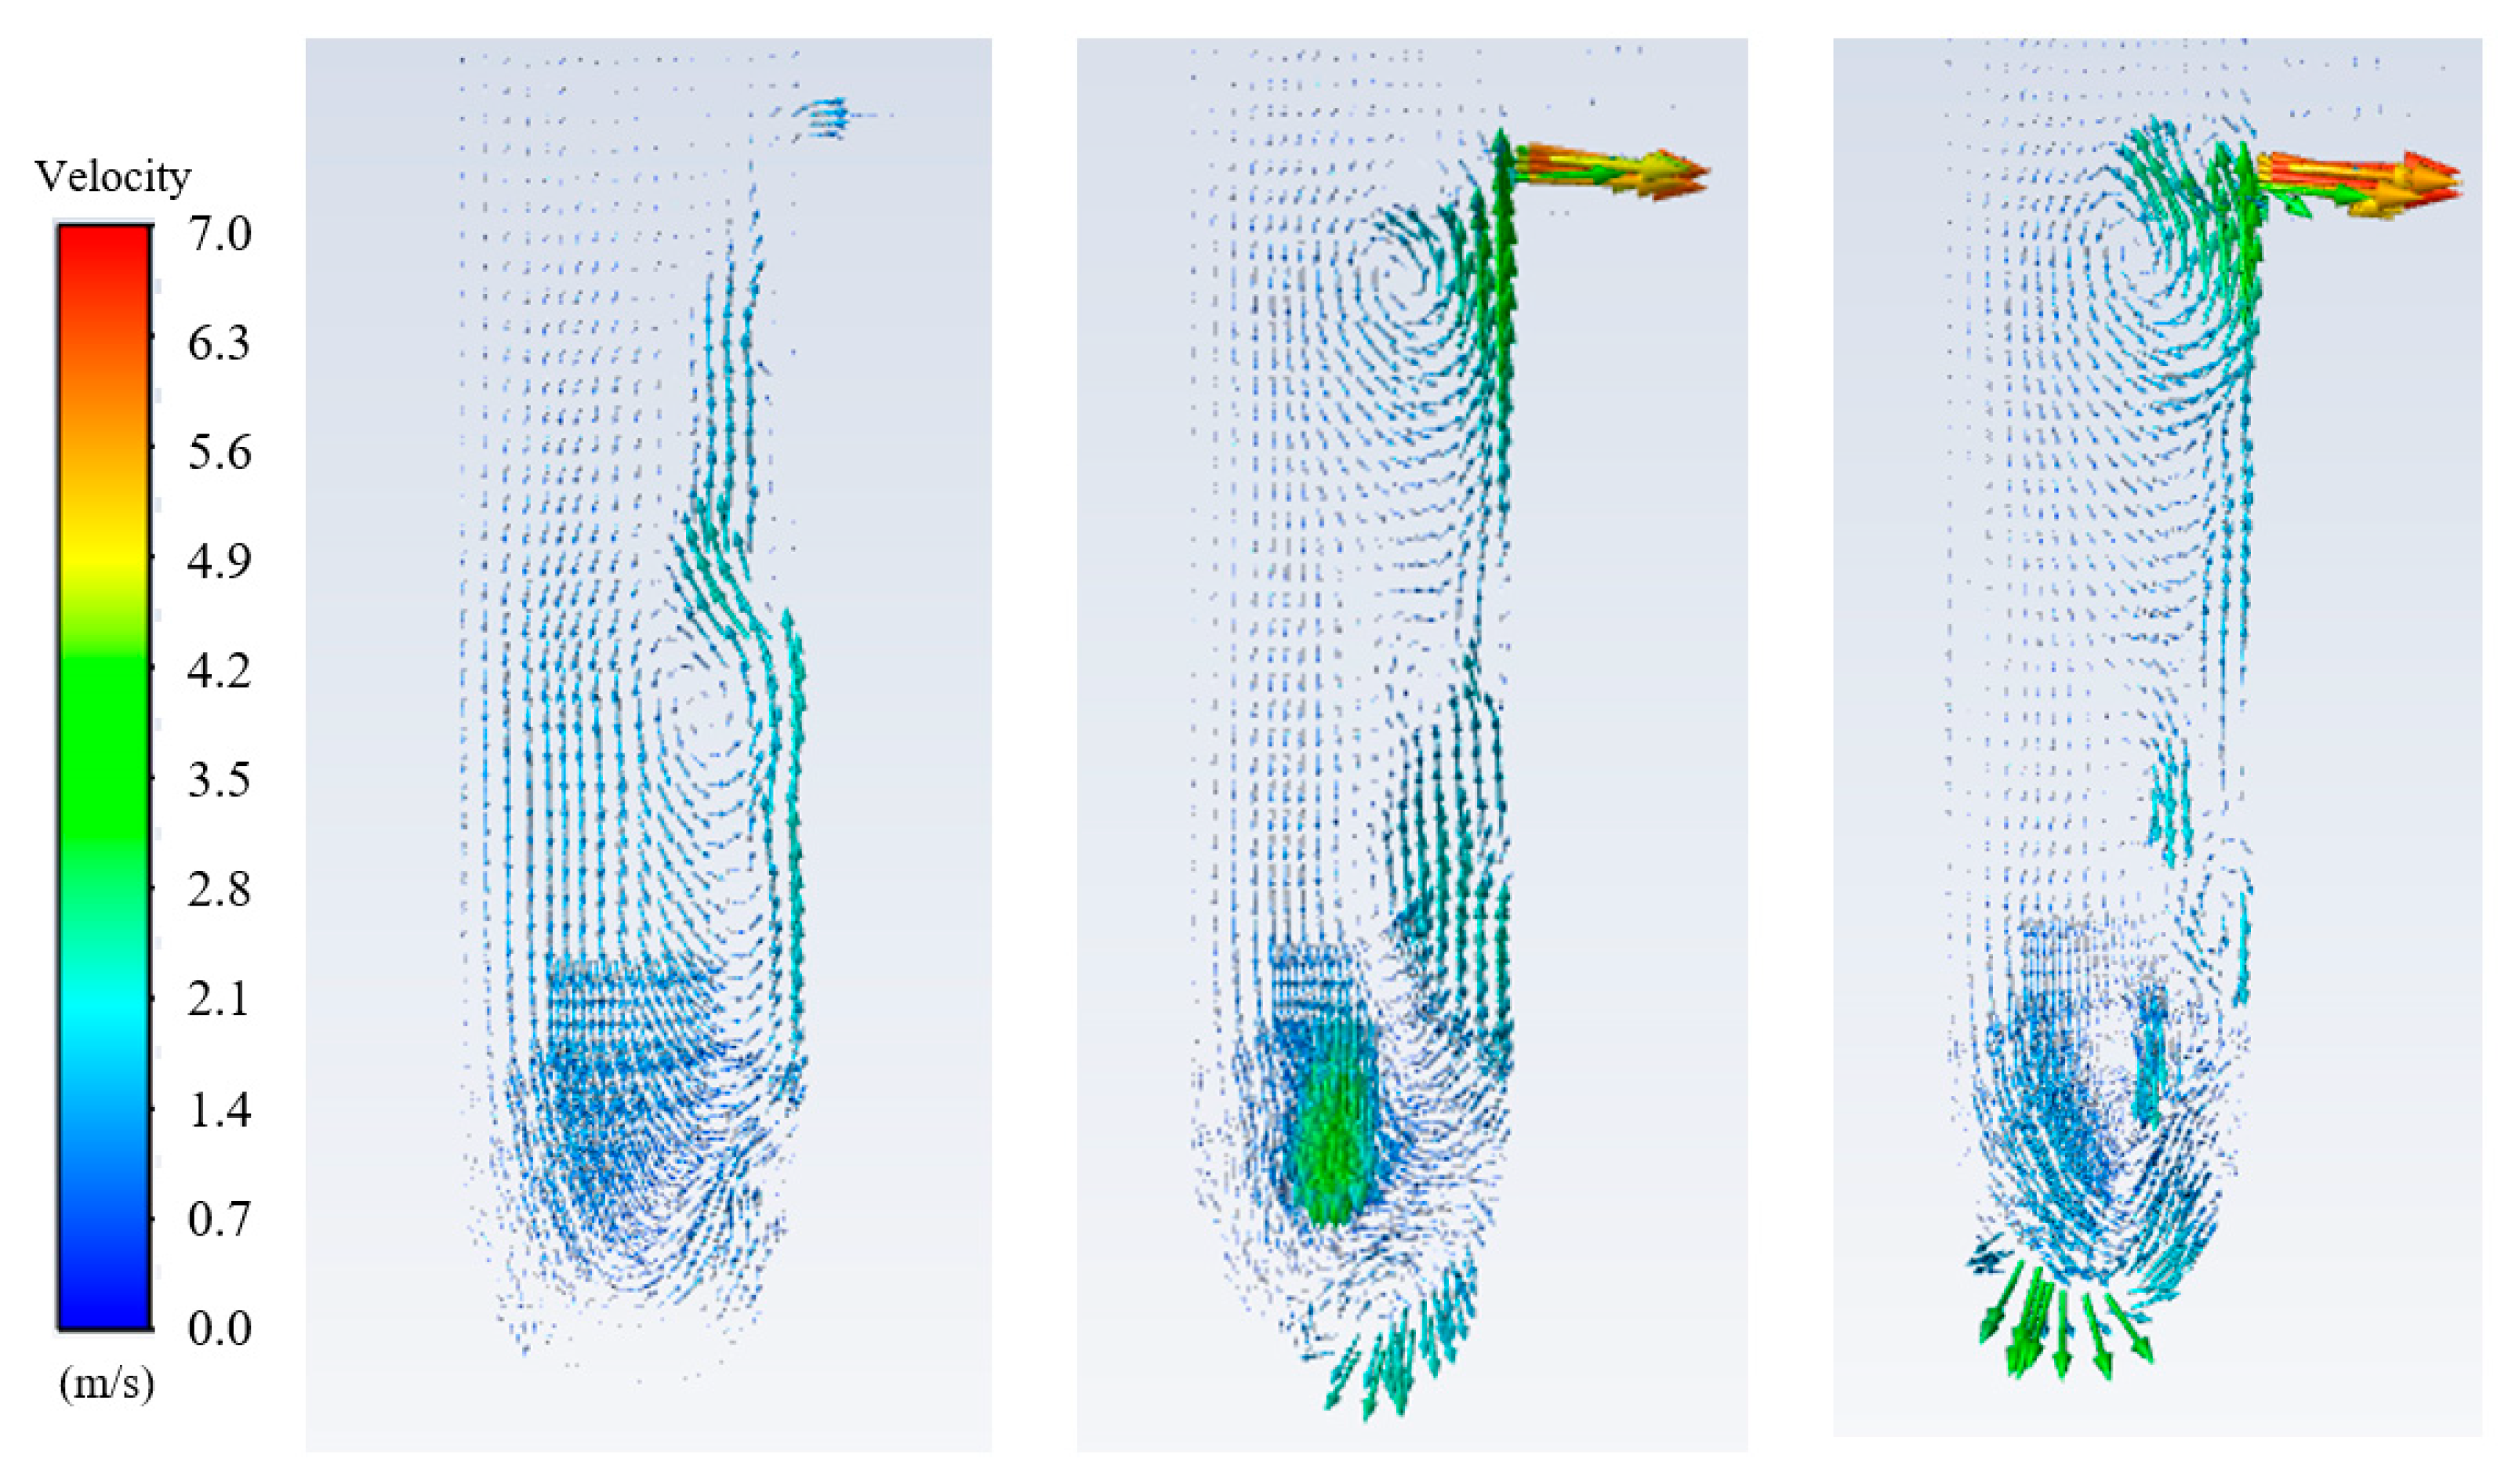
4.1. Effects of Refrigerant Solubility on Liquid-Return Characteristics
4.2. Effects of Refrigerant/Oil Type on Liquid-Return Characteristics
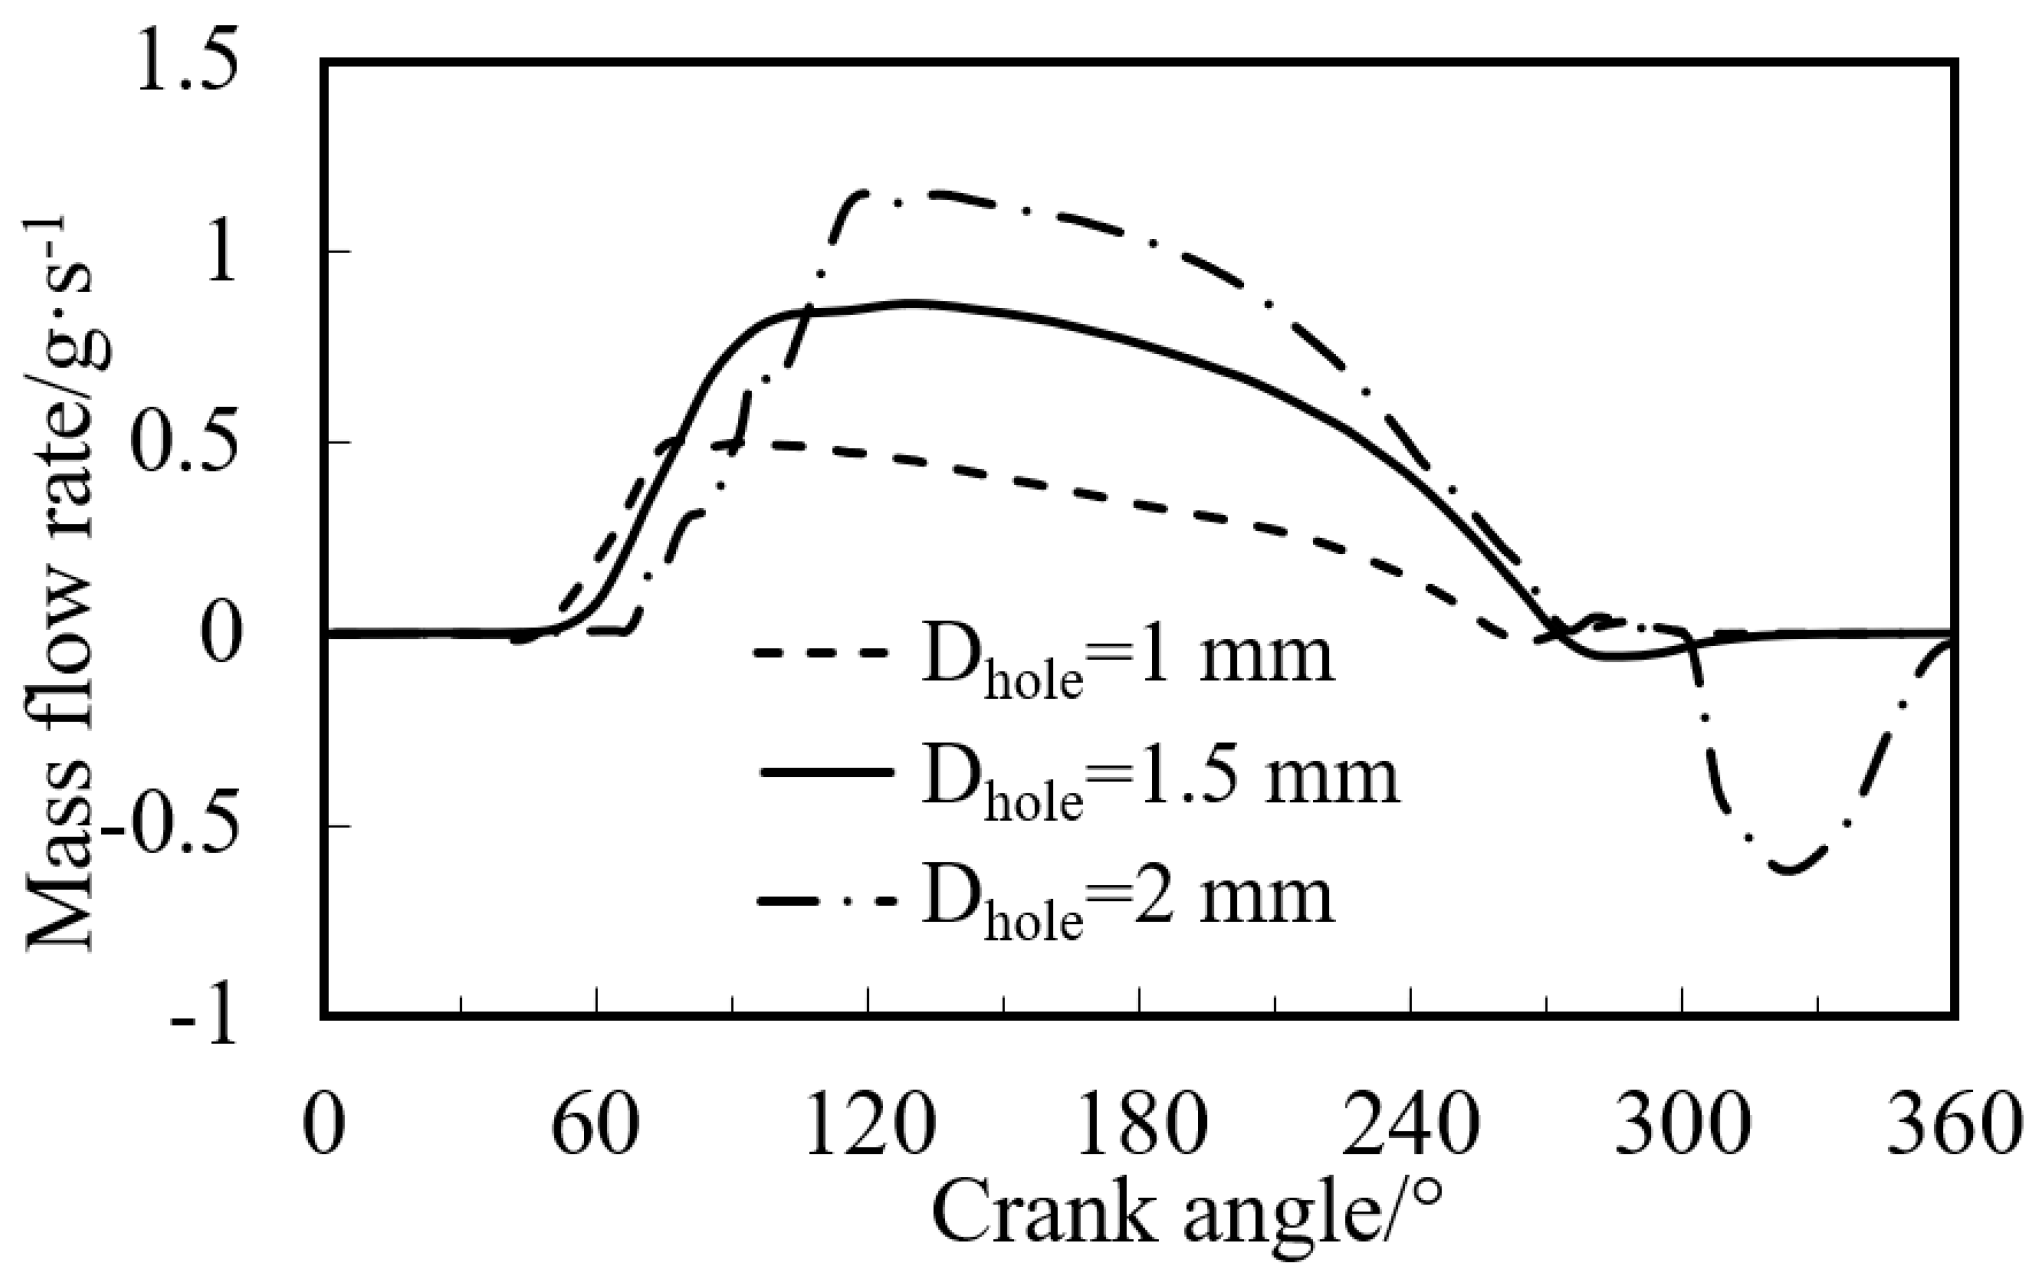
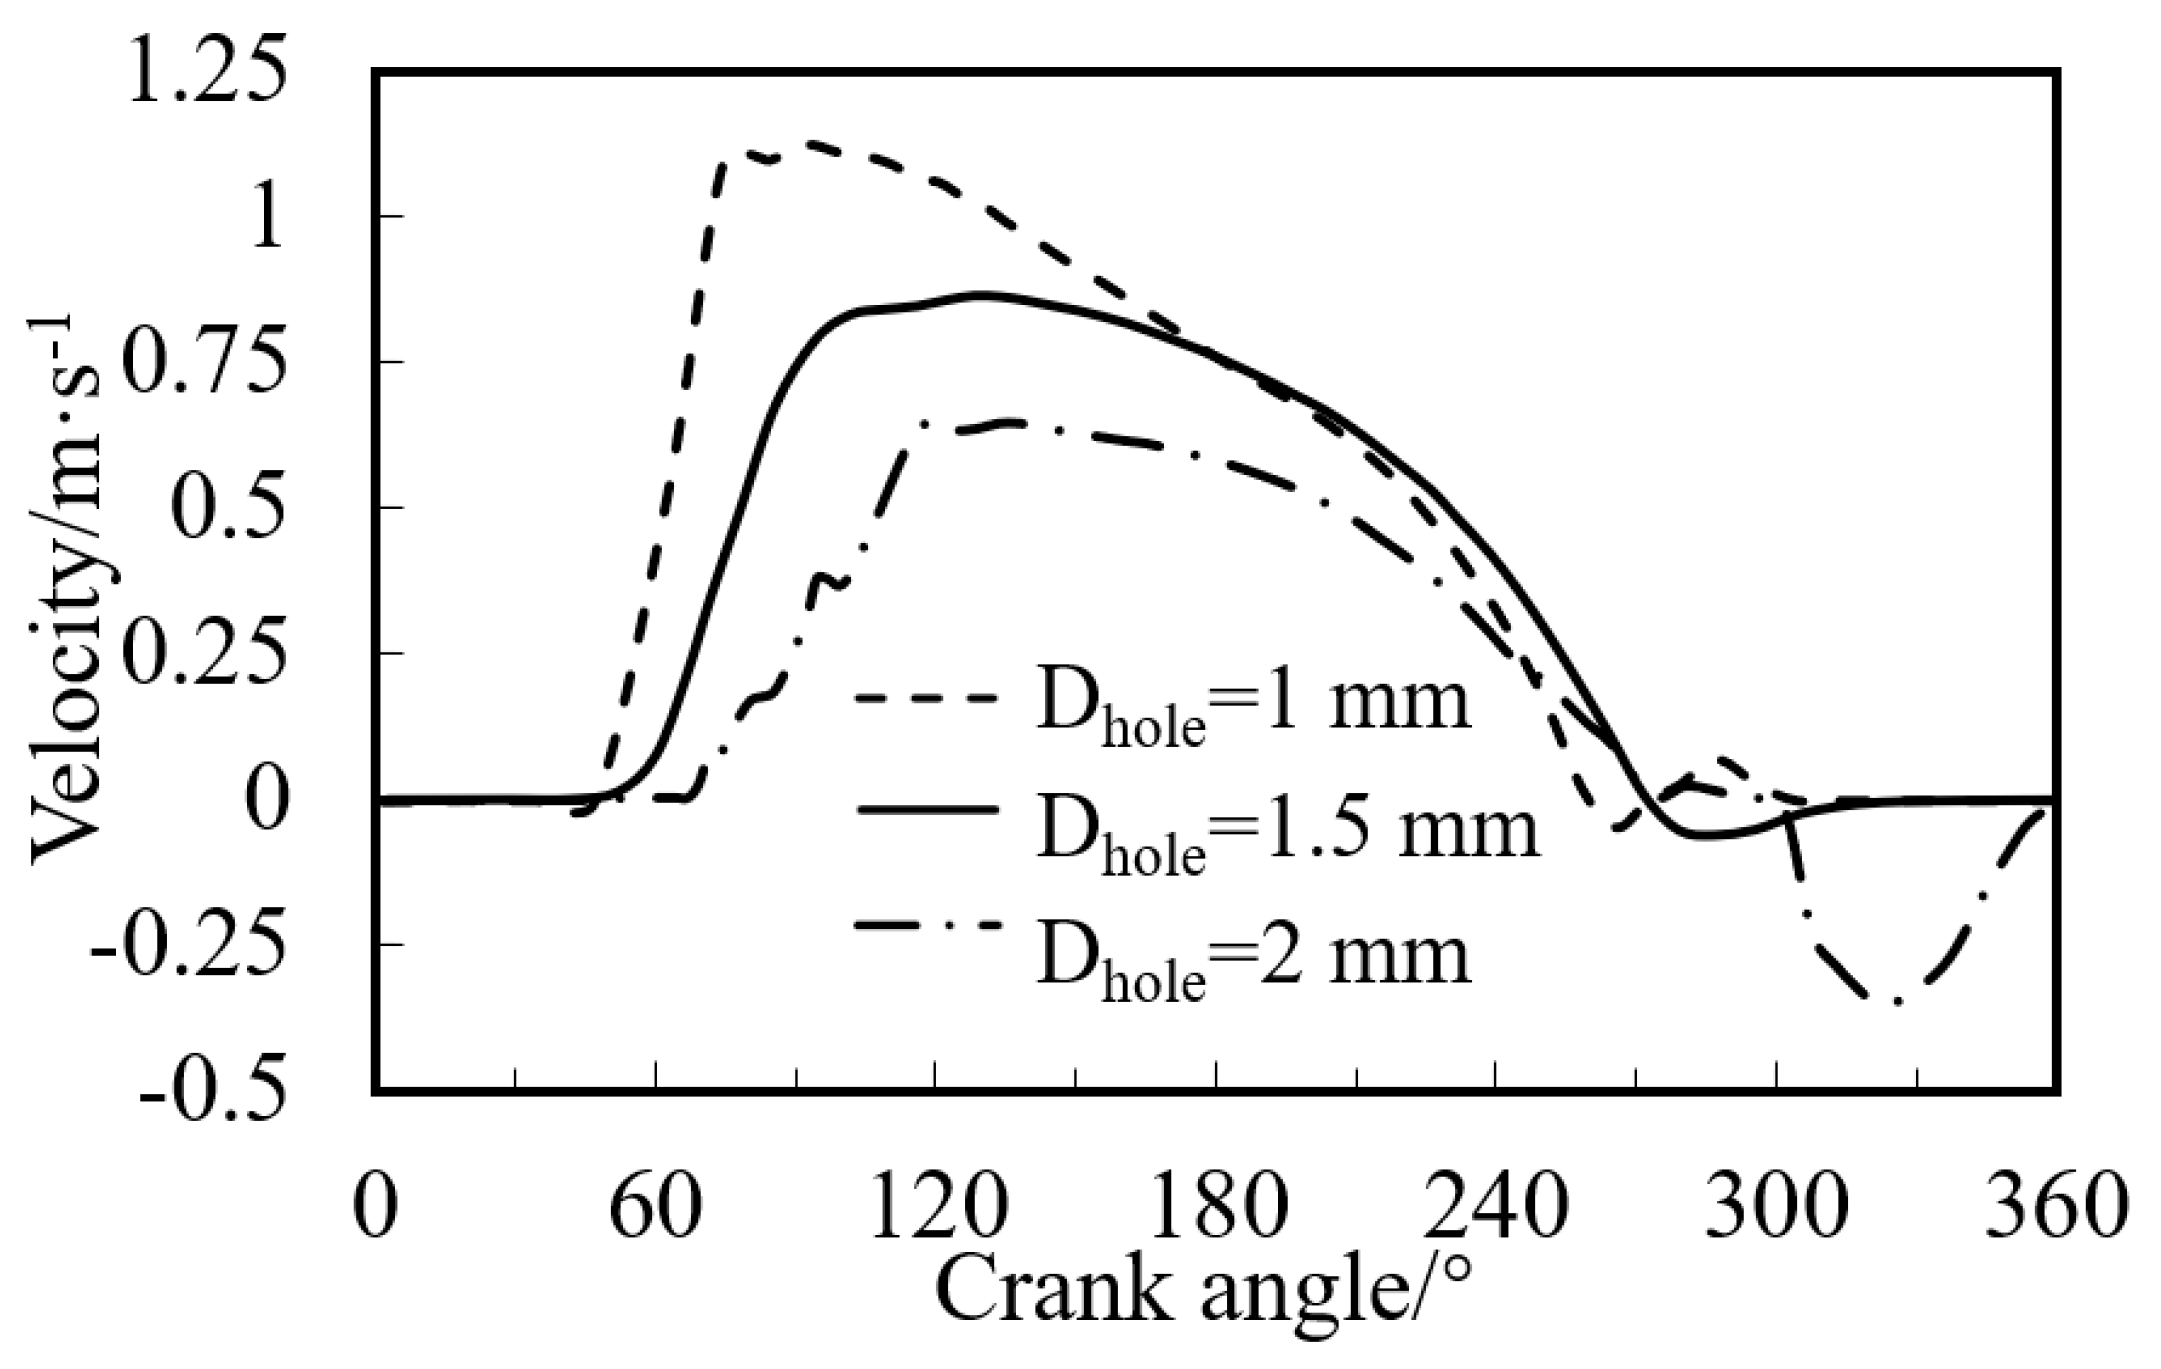
4.3. Effects of Liquid-Return-Hole Diameter on Liquid-Return Characteristics
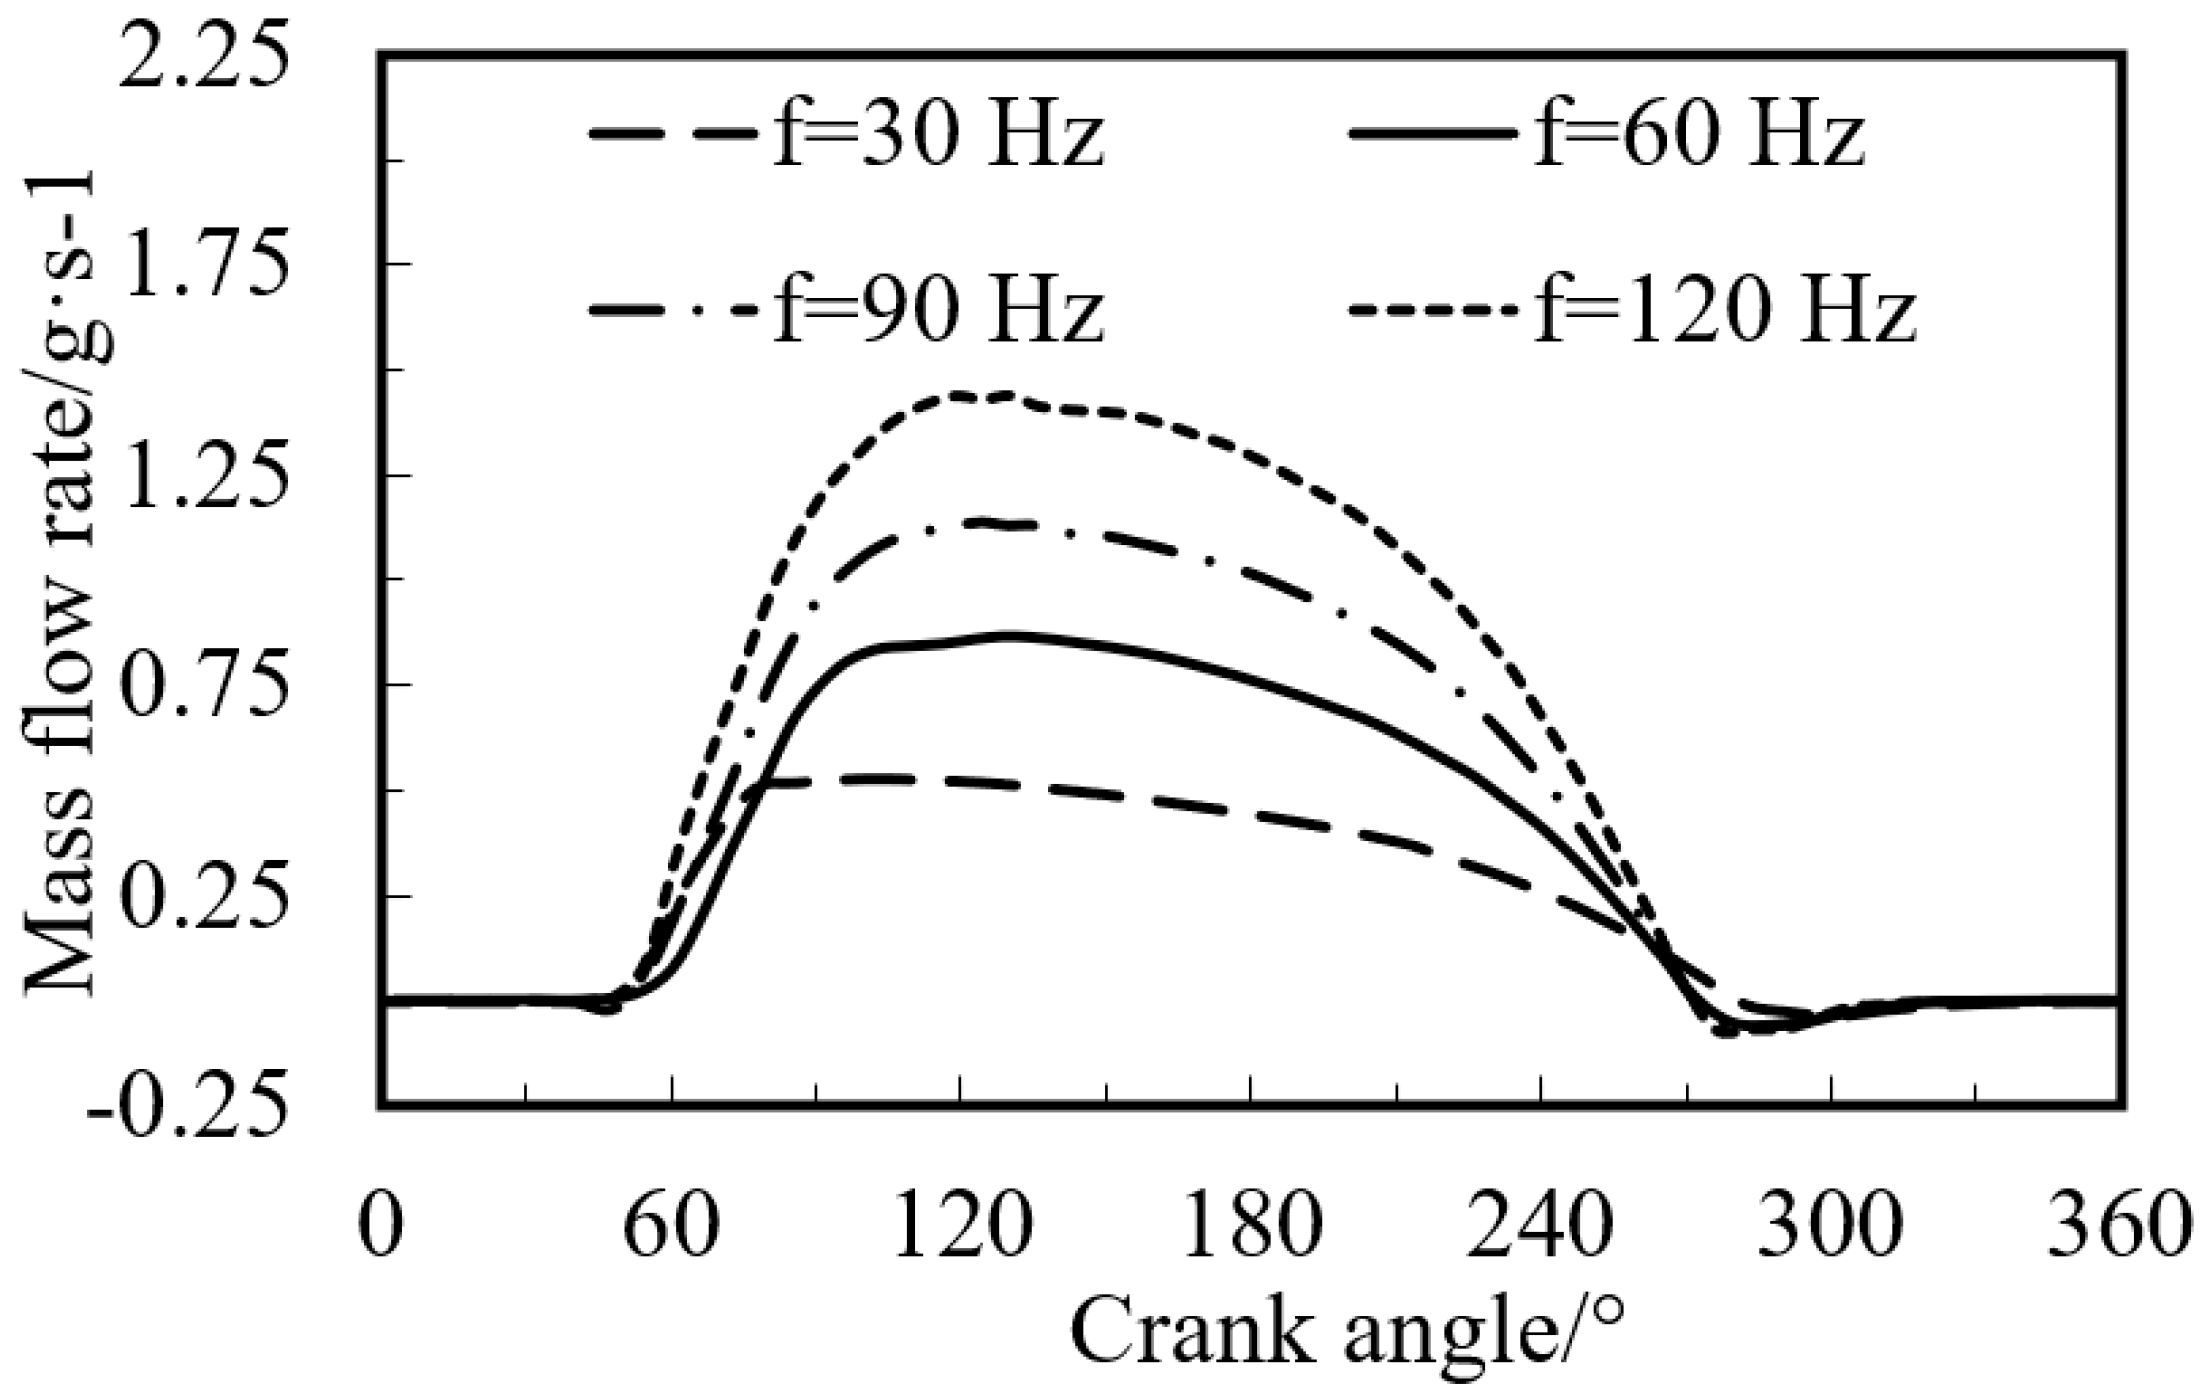
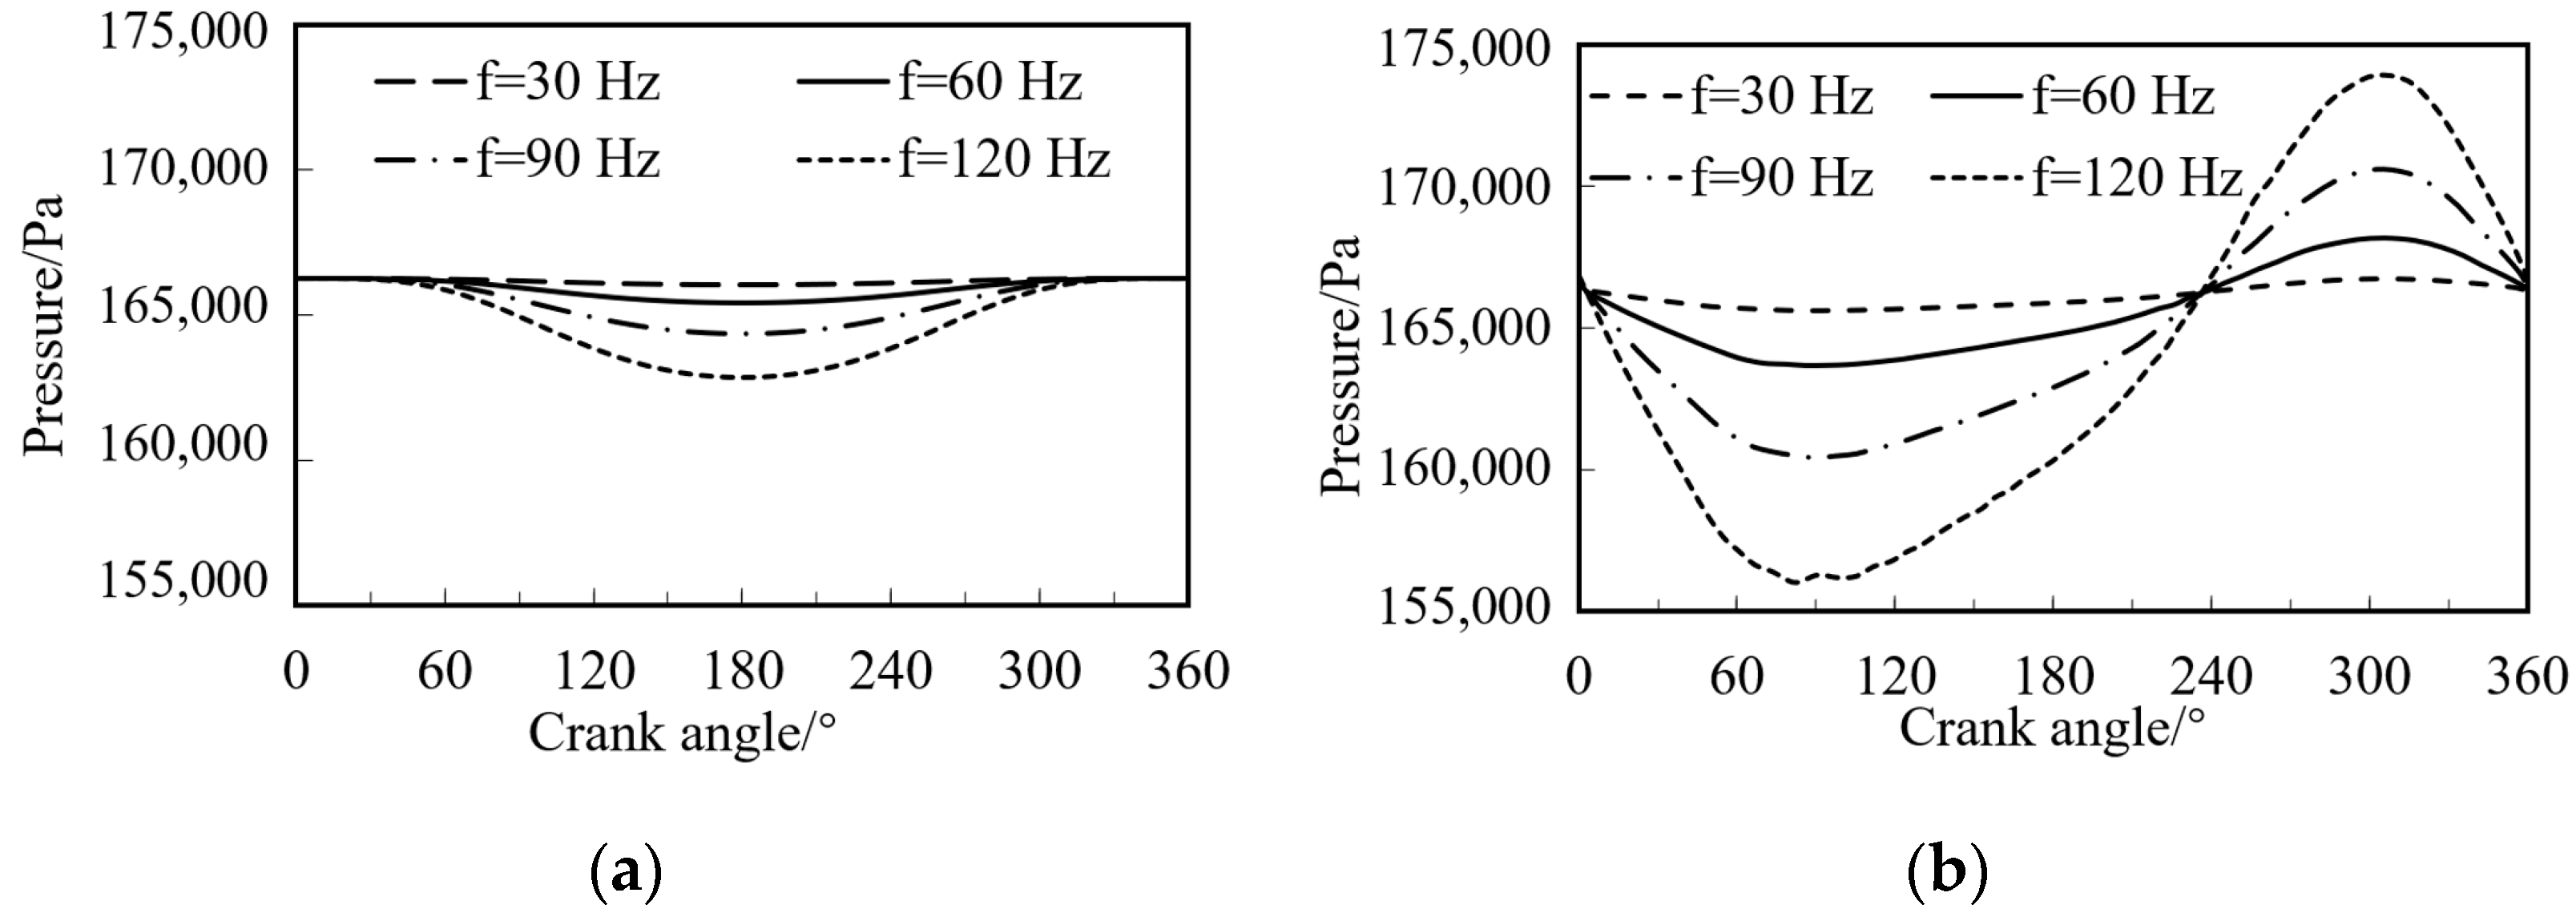
4.4. Effects of Compressor Frequency on Liquid-Return Characteristics
5. Conclusions
- During startup of the rotary compressor, the velocity and mass of the liquid flowing out of the accumulator through the liquid-return holes decrease with the decrease in refrigerant solubility in the oil. The liquid-return process is significantly slower with the increase in surface tension and viscosity of the refrigerant/oil mixture, especially when the refrigeration solubility is less than 50%. Backflow bubbles appear near the liquid-return hole with refrigerant solubilities of 100% and 50%, while backflow bubbles appear with a low refrigerant solubility of 20%.
- Under the same startup conditions, the liquid-return velocity and mass of the R290/NM100 mixture through the liquid-return holes in the accumulator are much smaller than those of the other two refrigerant/oil mixtures, R22/NM56 and R410A/POE68, because of the low density and high mixture viscosity for R290. Therefore, for the air-conditioning system using R290/NM100, the accumulator structure should be modified to allow more liquid to return to the compressor faster.
- The total mass of the liquid flowing through the liquid-return hole increases with the increase in the hole diameter, but the velocity decreases instead. The mass-flow rate and velocity increase to a peak at the crank angle of 120° and then decrease gradually. With the decrease in the hole diameter, the pressure difference between the two sides of the liquid-return hole increases, and reaches a maximum value of 675 Pa at 1 mm.
- Almost no liquid returns to the compressor at the angle of initial and final 60°, while it peaks at the angle of about 120°. With the increase in the compressor frequency, the liquid returning to the cylinder through the liquid-return holes linearly increases, but the amplitude and frequency of the pressure fluctuation at the inlet and outlet of the accumulator increase. The maximum pressure fluctuation at the outlet is 18,000 Pa with the frequency of 120 Hz.
Author Contributions
Funding
Institutional Review Board Statement
Informed Consent Statement
Data Availability Statement
Conflicts of Interest
Nomenclature
| A | Area (m2) |
| D | Diameter (mm) |
| f | Frequency (Hz) |
| P | Pressure (Pa) |
| Average mass-flow rate (g·s−1) | |
| Volume-flow rate (mL·s−1) | |
| s | Solubility(/) |
| u | Velocity (m2·s−1)- |
| Average liquid velocity (m·s−1) | |
| V | Volume (m3) |
| ν | Viscosity (mPa·s) |
| α | Volume fraction(-) |
| ρ | Density(kg·m−3) |
| θ | Crank angle(°) |
| ηv | Volume efficiency(−) |
| σ | Surface tension (N·m−1) |
| Subscript | |
| accu | Accumulato0072 |
| c | Cylinder |
| m | Refrigerant/oil mixture |
| ref | Refrigerant |
| s | Suction |
References
- Lee, J.; Lee, U.Y. Design optimization of an accumulator for reducing rotary compressor noise. Proc. Inst. Mech. Eng. Part E J. Process Mech. Eng. 2012, 226, 285–296. [Google Scholar] [CrossRef]
- Kim, M.; Park, S.; Shin, M.; Jeong, Y. Noise improvement of air conditioning accumulator using acoustic metamaterials. In Proceedings of the INTER-NOISE and NOISE-CON Congress and Conference Proceedings, Seoul, Korea, 12 October 2020. [Google Scholar]
- Yun, K. Designing a function-enhanced suction accumulator for rotary compressor. In Proceedings of the International Compressor Engineering Conference at Purdue University, West Lafayette, IN, USA, 14 July 1998. No.1315. [Google Scholar]
- Han, B.; Yan, G.; Yu, J. Refrigerant migration during startup of a split air conditioner in heating mode. Appl. Therm. Eng. 2019, 148, 1068–1073. [Google Scholar] [CrossRef]
- Wang, D.; Zhang, Z.; Yu, B.; Wang, X.; Shi, J.; Chen, J. Experimental research on charge determination and accumulator behavior in trans-critical CO2 mobile air-conditioning system. Energy 2019, 183, 106–115. [Google Scholar] [CrossRef]
- Wu, J.; Lin, J.; Zhang, Z.; Chen, Z.; Xie, J.; Lu, J. Experimental investigation on cold startup characteristics of a rotary compressor in the R290 air-conditioning system under cooling condition. Int. J. Refrig. 2016, 65, 209–217. [Google Scholar] [CrossRef]
- Bianchi, M.; Deschamps, C.J.; Rodrigues, T.T.; Paladino, E.E. Numerical-experimental investigation of liquid slugging in the suction muffler of a hermetic reciprocating compressor. In Proceedings of the 12th International Conference on Compressors and Their Systems, London, UK, 6–8 September 2021. [Google Scholar]
- Feng, Y.; Wu, J.; Liang, Y. Improving the start-up performance of the vapor compression cycle by recovering the lost cooling energy in the accumulator. Appl. Therm. Eng. 2021, 195, 116942. [Google Scholar] [CrossRef]
- Kang, H.; Choi, K.; Park, C.; Kim, Y. Effects of accumulator heat exchangers on the performance of a refrigeration system. Int. J. Refrig. 2007, 30, 282–289. [Google Scholar] [CrossRef]
- Raiser, H.; Heckenberger, T.; Tegethoff, W.; Kohler, J.; Fosterling, S. Transient behavior of R744 vehicle refrigeration cycles and the influence of the suction side accumulator design. SAE Technical Paper. 3 April 2006. Available online: https://saemobilus.sae.org/content/2006-01-0162/ (accessed on 1 March 2022).
- Zhang, W.; Hrnjak, P. Modeling of an integrated internal heat exchanger and accumulator in R744 mobile air-conditioning applications. SAE Technical Paper. 1 April 2020. Available online: https://www.sae.org/publications/technical-papers/content/2020-01-0153/ (accessed on 1 March 2022).
- Zhang, W.; Hrnjak, P. Numerical investigation of carbon dioxide and poe oil mixture behavior in an accumulator in trans-critical heat pump mode. In Proceedings of the 18th International Refrigeration and Air Conditioning Conference at Purdue University, West Lafayette, IN, USA, 24–28 May 2021. [Google Scholar]
- Zheng, B.; Liang, X.; Zhuang, R. Experimental investigation on the influence of the oil return hole on the performance of R-32 wet compression cycle. In Proceedings of the 16th International Refrigeration and Air-Conditioning Conference at Purdue University, West Lafayette, IN, USA, 11–14 July 2016. [Google Scholar]
- Lin, J.; Wu, J.; Zhang, Z.; Chen, Z.; Xie, J.; Lu, J. Experimental investigation of startup characteristics of R290 rotary compressor under low ambient temperature heating condition. Int. J. Refrig. 2017, 77, 128–135. [Google Scholar] [CrossRef]
- Wang, C.; Wu, J.; Du, Y.; Li, J.; Du, W. Experimental study on startup characteristics of a R290 room air conditioner under various ambient temperatures. Int. J. Refrig. 2020, 109, 37–44. [Google Scholar] [CrossRef]
- Wu, J.; Wang, G. Numerical study on oil supply system of a rotary compressor. Appl. Therm. Eng. 2013, 61, 425–432. [Google Scholar] [CrossRef]
- Lemmon, E.W.; Huber, M.L.; McLinden, M.O. Reference fluid thermodynamic transport properties. In NIST Standard Reference Database 23; National Institute of Standards and Technology: Boulder, CO, USA, 2010. [Google Scholar]
- Wu, J.; Chen, Z.; Lin, J.; Li, J. Experimental analysis on R290 solubility and R290/oil mixture viscosity in oil sump of the rotary compressor. Int. J. Refrig. 2018, 94, 24–32. [Google Scholar] [CrossRef]
- Seeton, C.J. Carbon Dioxide-Lubricant Two-Phase Flow Patterns in Small Horizontal Wetted Wall Channels: The Effects of Refrigerant/Lubricant Thermophysical Properties; University of Illinois at Urbana-Champaign: Champaign, IL, USA, 2009. [Google Scholar]
- Jensen, M.; Jackman, D. Prediction of nucleate pool boiling heat transfer coefficients of refrigerant-oil mixtures. Heat Transf. 1984, 106, 184–190. [Google Scholar] [CrossRef]


| Parameter | Daccu/mm | D suc_pipe/mm | DOil_return_hole/mm | Dinlet_pipe/mm | Hoil_return_hole/mm | Haccu/mm |
|---|---|---|---|---|---|---|
| Values | 73 | 12.4 | 1.5 | 11.6 | 22.8 | 160 |
| /mm | /kg·m−3 | /mPa·s | /N·m−1 | /Pa | /mL·s−1 | /mL·s−1 | Errors/% |
|---|---|---|---|---|---|---|---|
| 3.5 | 567 | 0.17 | 0.014 | 488 | 1.357 | 1.378 | 1.55 |
| Solubility/− | /kg·m−3 | /mPa·s | /N·m−1 | /g·s−1 | /m·s−1 |
|---|---|---|---|---|---|
| 100% | 567 | 0.17 | 0.014 | 0.781 | 0.390 |
| 50% | 734 | 2.9 | 0.034 | 0.932 | 0.359 |
| 20% | 823 | 68 | 0.039 | 0.445 | 0.153 |
| Refrigerant/Oil | /kg·m−3 | /kg·m−3 | /mPa·s | /Pa | /g·s−1 | /m·s−1 |
|---|---|---|---|---|---|---|
| R22/NM56 | 996 | 7.3086 | 39 | 1010 | 0.678 | 0.193 |
| R410A/POE68 | 976 | 10.449 | 75 | 1494 | 0.687 | 0.199 |
| R290/NM100 | 823 | 3.8324 | 68 | 706 | 0.445 | 0.153 |
Publisher’s Note: MDPI stays neutral with regard to jurisdictional claims in published maps and institutional affiliations. |
© 2022 by the authors. Licensee MDPI, Basel, Switzerland. This article is an open access article distributed under the terms and conditions of the Creative Commons Attribution (CC BY) license (https://creativecommons.org/licenses/by/4.0/).
Share and Cite
Lin, J.; Guo, N.; Wu, J.; Hong, L.; Jiang, J. Numerical Study on Liquid-Return Characteristics in the Accumulator of the R290 Rotary Compressor. Energies 2022, 15, 2469. https://doi.org/10.3390/en15072469
Lin J, Guo N, Wu J, Hong L, Jiang J. Numerical Study on Liquid-Return Characteristics in the Accumulator of the R290 Rotary Compressor. Energies. 2022; 15(7):2469. https://doi.org/10.3390/en15072469
Chicago/Turabian StyleLin, Jie, Nini Guo, Jianhua Wu, Liangkun Hong, and Jianjiang Jiang. 2022. "Numerical Study on Liquid-Return Characteristics in the Accumulator of the R290 Rotary Compressor" Energies 15, no. 7: 2469. https://doi.org/10.3390/en15072469
APA StyleLin, J., Guo, N., Wu, J., Hong, L., & Jiang, J. (2022). Numerical Study on Liquid-Return Characteristics in the Accumulator of the R290 Rotary Compressor. Energies, 15(7), 2469. https://doi.org/10.3390/en15072469