1. Introduction
Our society is facing very fast changing paradigms in many fields. In particular, the energy sector is involved in a challenging transition to evolve from a fossil-based to a decarbonized energy system. This transformation implies finding new ways for the generation, distribution, management and utilization of energy resources, as well as systemic changes and market regulations to foster those changes. The transformation would not be based on a general approach, but an adaptive one, to take into account regional an regional constraints [
1]. This fact would require the development and availability of several technological approaches to overcome the huge variety in local conditions, such as climate, resource availability, energy needs, land orography, socio-economical aspects and human behavior.
One of the main technical difficulties in the transition to a decarbonized energy system is the integration of intermittent electricity generation based on renewable sources, mainly wind and solar PV facilities [
2,
3]. With a high share of intermittent energy input, storage becomes a critical capability of the system to allow the matching between demand and generation [
4]. The mismatch between energy generation and demand introduces non-negligible costs due to the need to install a huge storage capacity to guarantee network stability and energy power shifting.
Currently, manageable combustion facilities have an intrinsic storage capacity in the form of chemical energy, including their energy production costs and their adaptation capability to the demand. Contemporary electric networks profit from such management capability through the practical hybridization of classical thermal and nuclear plants and renewable facilities at grid level. The availability of huge amounts of hydraulic resources mitigates such a dependency. Pumped-storage hydroelectricity may be considered the most reliable storage system in contemporary networks [
5,
6]. Pumped-storage hydroelectricity is also considered in energy planning as, for instance, in the case of Spain [
7], with up to new 3.5 MW pumped-storage hydroelectricity capacity for storage purposes.
In brief, the addition of storage capabilities in the energy system can attend to two main purposes: network stability and energy shifting. Network stability may be provided by fast-response storage systems, such as supercapacitors and batteries. Energy shifting requires high capacity and small energy losses to transfer massive amounts of energy from peak production to demand gaps. Evaluations of storage costs, either based on the power, or energy capacity, are available in the scientific literature and from international agencies, listed in
Table 1. There are some technologies, such as pumped-storage hydroelectricity, CAESs (compressed air storage systema) and LAESs (liquid air storage systems) that have lower costs in terms of capacity. Such technologies are based on the combination of commercial equipment (such as compressors and turbines) which is mature and very sensitive to scale. Those systems are currently the most viable for energy shifting. In a second step, batteries have a shorter response time (~s) and are very suitable for black start of power plants and network stability, but nowadays seems to be less viable for energy shifting. Supercapacitors are more expensive in terms of energy capacity, but their fast response time (~ms) makes them very suitable for network voltage stability, mainly at local level.
In particular, power-to-gas (PtG) requires a systemic change involving large scale facilities for energy transformation, storage, transport and utilization. Such changes would combine electric and chemical (natural gas or liquid fuels) networks that are now completely separate. The economic feasibility of the application of PtG schemes has been reported by some authors [
11,
12] based on H
2 generation by the surplus electricity produced by intermittent renewable power sources [
13], or using biogas [
14]. Uncertainties about the cost evolution of most of the key elements of the PtG scheme suggest the realization of parametric analyses to evaluate the cost range of the system. In that particular sense, CAPEX (capital expenditure) on the H
2 production and methanation facilities are usually estimated under evolution throughout the next decades. Capital costs are expected to decrease based on technological, scale improvements.
Regarding OPEX (operational expenditure), one of the most important issues is the cost of the electricity input to be stored as hydrogen or synthetic natural gas (SNG). This variable strongly depends on electricity market regulations [
15] and the policy to promote energy system decarbonization. In particular, the load management and acquisition cost of surplus electricity are still open questions. Additional considerations could be applied to carbon emission penalties [
16,
17,
18] proposed into energy market regulations.
The impact of carbon abatement policies and the strategy to transform surplus electricity into hydrogen or synthetic natural gas are key issues to evaluate the viability of any transition scenario to a decarbonization society. Financial support, if needed, should be envisaged in accordance with different possible future scenarios. In fact, uncertainties about implementation scenarios are remaining, as well as the policies to make large carbon emission abatement compatible with reliable electric demand coverage [
19]. Several options are considered for the deployment of power-to-gas during a hypothetical energy transition with co-habitation with the current energy system [
20]. In every scenario, a cap-and-trade market with CO
2 taxes seems to be a realistic option for such energy transition. The evaluation of economic impacts of those scenarios are of paramount importance for the implementation of an effective energy policy. This implementation should be adapted and optimized for each market regulation, either national or supranational. This is the case of a country such as Spain, with its own policies in the framework of a larger entity such as the European Union.
In the next section, we present the methodology to evaluate the requirements of a deep transition to a power-to-gas system in Spain. Next sections will provide the results and their analysis based on traditional indicators as the net present value (NPV) and the internal rate of return (IRR), for an easy comparison with other storage alternatives. Such indicators strongly depend on the market; and the evaluation of the levelized cost of storage (LCOS) which is directly related to the technical maturity of the technology, equipment manufacturing, and raw material costs.
2. Materials and Methods
The evaluation of the economic impact of any transition has as a critical issue the evaluation of the new infrastructure that is needed. In the case of the power-to-gas is especially important the coherence with the expected evolution of the power generation capacity. In the case of Spain, the evaluation of the future energy system has been previously reported [
21,
22] for scenarios related to power-to-gas implementation. Two scenarios of energy demand are assumed based on 1.36% and 1.73% growth rates for a total consumption of 429 and 490 TWh in 2050. Our description of the Spanish market has been based on that references. This analysis has significant differences with the new Energy and Climate [
7] package proposed by the Spanish government, where wind and solar PV are expected to contribute 50 and 37 GW in 2030, with solar thermal reaching only 7.3 GW. The total capacity of the system is proposed to reach 157 MW, instead of the 128 GW reported by [
21]. Nevertheless, we have taken the latter approach as reference because it provides an evaluation of the surplus energy produced in contrast with the official planning where PtG is not considered, and energy storage and management are based on the utilization of high-capacity batteries and pumped-storage hydroelectricity, with the support of solar thermal plants with thermal energy storage. In addition, the Spanish Energy and Climate plan foresees a very significant contribution of natural gas for meeting peak demand. In any case, the evolution of the total capacity of the system, either in power or energy processing needs, depends on many issues. For instance, the availability of the financial system is of paramount importance, because many of the projects are developed by project finance schemes, where the interest rates and the support of the government is critical. Such support may change depending on the economic conjuncture, as well as the political situation. Geopolitical considerations may influence the practical role of natural gas in the long term, especially in Europe generally and Spain more specifically. Certain stability is expected by the influence of the European Union policy, and the decisive support for decarbonization into the Green Deal [
23].
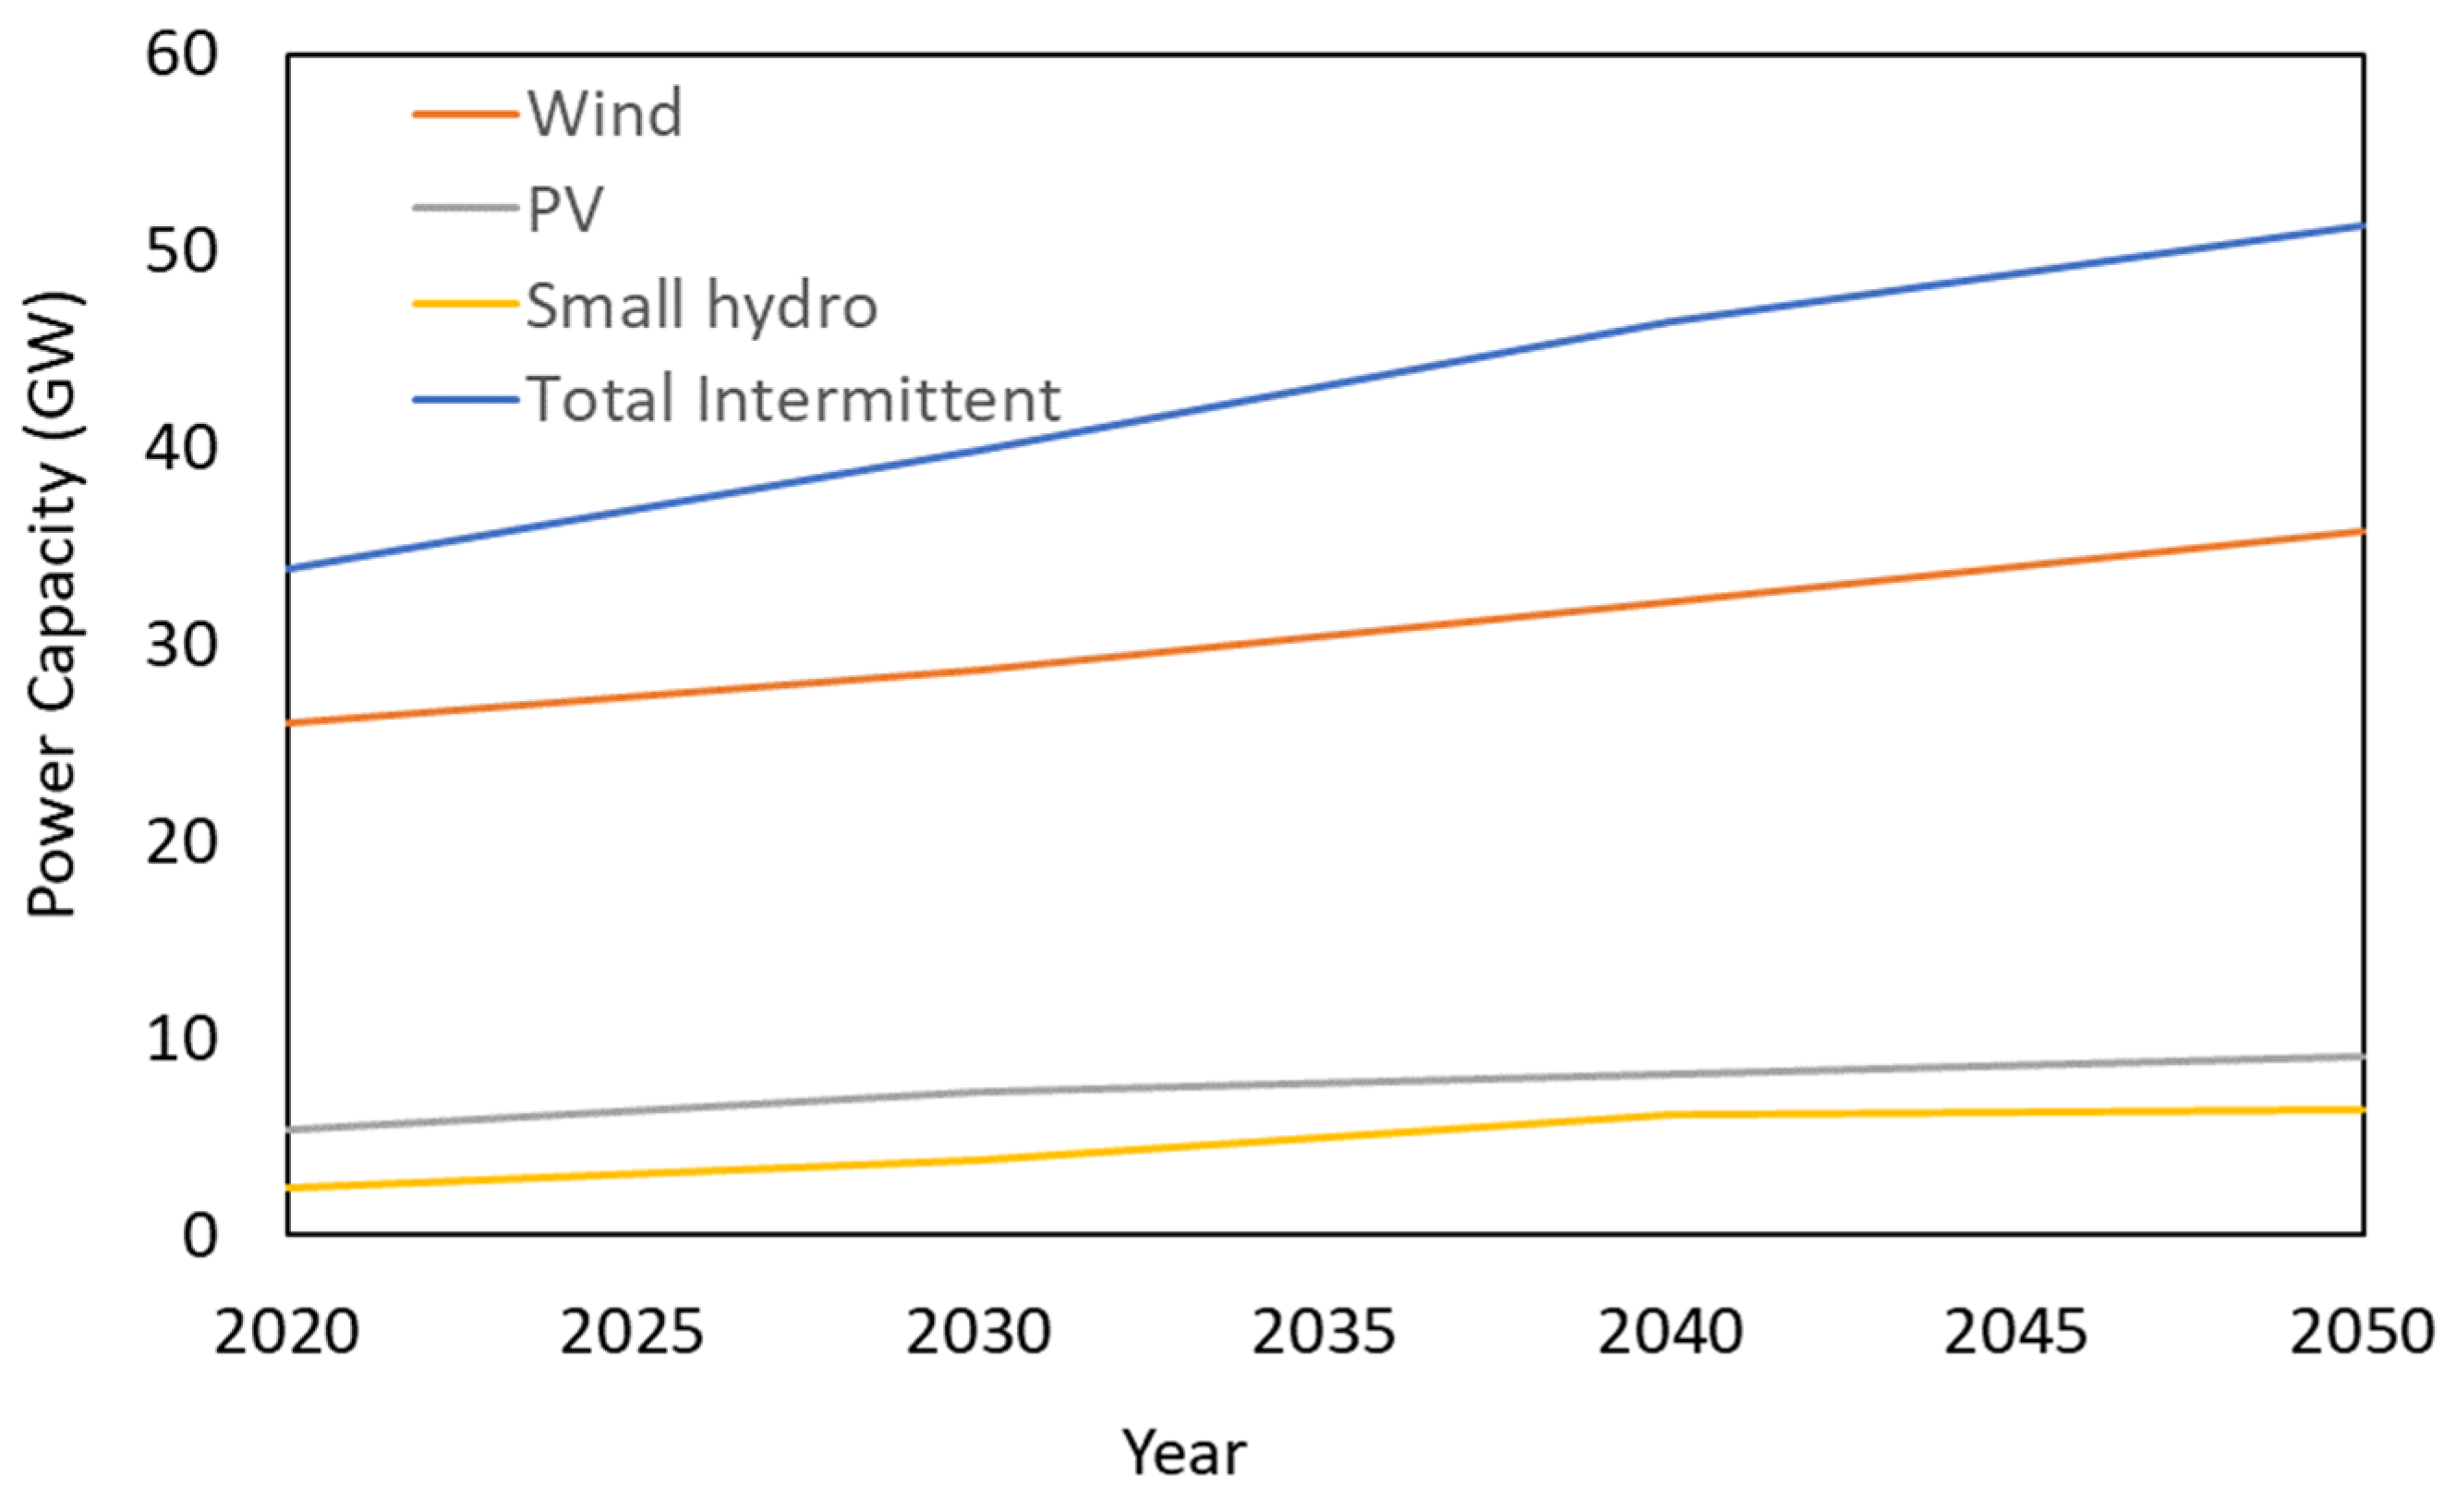
Based on the assumptions of [
22], the estimated power capacity for wind, photovoltaics and small hydroelectricity power stations in a low-growth demand scenario is depicted in
Figure 1. Such assumptions estimate the yearly operation of hydropower between 1600 (large hydro) and 2750 h/y (small hydro), wind in the range of 2450–2700 h/y; PV is estimated between 1650 and 2650 h/y, with solar thermal up to 3500 h/y. It is worth pointing out that the contribution of intermittent energy sources ranges between 28% and 38% in terms of the installed capacity of wind, small hydroelectricity power stations and photovoltaics, providing the estimated yearly surplus energy shown in
Figure 2 for the two demand scenarios. We have extended the original scenarios up to 2055, assuming that PtG in Spain will be feasible from 2030. The surplus energy to be managed by the PtG scheme will be between 0.5% and 2% of the total energy demand in the system. In our assumptions, a suitable infrastructure based on electrolysers and methanation facilities should be available and operational from 2030, to manage between 0.5% and 2% of the energy generation in the country at the end of the period.
Based on the energy surplus to manage and store, the capacity of the PtG system was estimated. The utilization factor of the system was set to 900 h/year at full capacity, which corresponds to approximately 10% of the available year time. This assumption is based on the fact that the energy surplus is expected to be available in off-peak demand hours and at low prices. Such availability is expected to be more frequent in the future, with a lower contribution of power plants with inherent management capacity, such as natural gas, coal, and nuclear to a lower extent, as well as an increase in fluctuating generation by renewables. At present, the market structure provides a narrow margin, mainly based on pumped-storage hydroelectricity.
Figure 3 shows the estimated PtG capacity required in the system to manage and store the energy surplus.
The economic impact of the implementation of the PtG infrastructure to manage such energy surplus is provided in the next sections. A similar analysis has been reported by [
24,
25] in Germany. PtG infrastructure is under development, and the costs may be estimated according to classical learning curves to account for the maturity and cost of different electrolysis technologies and methanation facilities versus installed capacity [
26].
The PtG scenario in this study is based on the scheme presented in
Figure 4. The excess production of the electricity generation system (
Figure 2) is transformed into synthetic natural gas (SNG) via electrolysis and methanation. SNG is then stored and/or transported to an electricity production utility based on a combined cycle plant. An alternative may be the consumption of SNG in cogeneration or for direct heat production, which was not considered in this evaluation. The overall efficiency of the system has uncertainties, and it will depend on evolutions in the development of the available technologies. In this study, the efficiency of the transformation to synthetic natural gas was in the range provided in
Figure 5. These data have been obtained from [
25] and extended from 2030 up to 2055.
Figure 6 shows the estimation of the capital costs in the low (1.36% growth rate) and high (1.73% growth rate) scenarios based on data extracted from (Martin Thema et al. 2016) and (Böhm et al. 2020). Such scenarios are very broad, with significant cost differences, as expected for less mature technologies, with uncertainties in the long term. The capital cost may also be influenced by market issues such as the number of competitors in the manufacturing of equipment and the impact of innovation and supporting policies.
The operational cost is depicted in
Figure 7 with the evolution of the OPEX following the two basic scenarios (high and low) in this analysis. Uncertainties in operational cost in the long term may change through the improvements in operational experience, lifetime of critical equipment (electrolysers) and other replacement costs. Other equipment, such as that involved in the generation of energy by combined cycle (CC) plants fueled by SNG, are already mature. Regarding the infrastructure to transport synthetic natural gas, there is already a gas network in Spain connecting CC plants, which should be adapted for the needs of carbon dioxide transportation to methanation facilities. Costs for CO
2 transport can be optimized if the methanation facility is close to the gas-fired plant. This hypothesis is likely as both facilities are not restricted by resource availability. Moreover, they can use the same industrial location, reducing O&M costs. The electrolysis and methanation processes may also operate in the same location, avoiding the need for hydrogen transport. In this sense, transport costs are negligible due to the availability of the electric and gas networks. Additional costs by CO
2 or H
2 transport may be added to the system in case of decentralized process steps.
Environmental costs are considered by the application of emission penalties (EUR/tonCO2) in a cap-and-trade market. A sensitivity analysis is presented for a value range of CO2 costs in the emission trade market, because it constitutes one of the most important tools into the energy policy.
Power purchase (EUR/MWh
e) is another key factor, because electricity prices are highly volatile. Power purchases for power-to-gas are carried out for the power excess production of intermittent renewable sources. Power purchases are expected to be low in that situation in a market based on pool pricing, such as in Spain. The price differences between excesses and deficits of production in the system are the most relevant aspect for its viability. As a reference scenario, a surplus electricity purchase price was assumed between 0 EUR/MWh
e and 35 EUR/MWh
e. This purchase scenario is compatible with a relatively low storage and PtG capacity with respect to the total amount of energy managed by the system, as described in
Figure 2, where surplus energy is less than 2% of the total energy generation. Scenarios where such prices were applied to a high share of the power generation seem to be unrealistic in view of the higher levelized cost of electricity (LCOE) of storage technologies [
27]. In the case of Spain, such prizes for wind are below the hypotheses of energy policy incentives [
28]. These studies show that additional incentives may be studied to increase the capacity of the PtG system, especially if energy shifting is intended.
The economic viability of the PtG system was determined by two well-known parameters of special interest for investors: the net present value (NPV) and the internal return rate (IRR). These are defined as a function of the cash flow (CF), the weighted average cost of capital (r) and the number of years (n) as:
IRR corresponds to the worth of r to set NPV = 0. CAPEX is the initial capital cost of the system. The cash flow is based on the addition of revenues by energy sales in the electricity market, the O&M costs (
), the amortization of the capital expenditures (
), and the CO
2 tax savings. The taxes on revenues (
) are discounted in the case of a positive balance. OPEX costs include the cost of the electricity input (as the energy input (
) times electricity input cost (
) in the year (n) and other costs such as manpower, equipment maintenance and substitution and other raw material inputs for electrolysers and the rest of the process (
).
The cash flow depends on the energy selling price,
, and other regulation issues, such as the application of CO
2 penalties or savings (
) and discounting taxes when positive, defining the net present value as:
A base reference is reported depending on the predicted costs for PtG technologies in two scenarios for low and high demand, in accordance with [
21], as shown in
Figure 2.
Another important feature of the system economics is the evaluation of the levelized cost of storage (LCOS), which is a good approach to compare the implementation of PtG with respect to other alternatives to manage renewable electricity production [
29,
30]. The evaluation of the LCOS was evaluated from the energy provided by the PtG system (
), the CAPEX, and the operation and maintenance costs (OPEX), which includes the energy input cost, as:
In our case, the definition of LCOS may include the cost of the electricity input as included in the OPEX of the system, which strongly depends on the market. In the case of a positive non-zero electricity input cost, the LCOS is equivalent to the LCOE (levelized cost of electricity), giving the minimum average purchase price that will ensure the viability of the system. In case of a null electricity input cost, the LCOS provides the individual levelized cost of the storage system, to be added to the LCOE of energy generation technologies that will be coupled with storage. In our analysis, the LCOS was evaluated with the learning curve of the technology from 2030 to 2055.
The technological dependence affects the unitary CAPEX and OPEX cost. The capacity of the system is as projected to process the energy surplus. The share of energy surplus energy may vary due to several factors, such as the availability of surplus energy at an acceptable price or the competition with other technological options. We have checked the sensibility of the LCOS versus a utilization factor, defined as the ratio between the energy that is processed and the expected energy surplus or nominal capacity of the system:
This value is non-dimensional. In our study, we designed the capacity of the PtG system to operate 900 h at full power (D
t). The UF can also be expressed as the operation time (OT) in hours of the system as:
A sensitivity analysis for the NPV and IRR is presented versus the following variables: the purchase price of electricity, the CO2 penalties, the surplus energy transformation share, the surplus energy cost and the capital cost rate.
3. Results
The reference case has been set at a dispatching price of electricity provided by the power-to-gas system of 100 EUR/MWh, and a CO
2 penalty of 100 EUR/ton.
Figure 8 shows the cash flow analysis for this reference case. The net balance or payback was achieved around the seventeenth year. The LCOS that we obtained in the low-cost scenario was 145 EUR/MWh for a surplus electricity cost of 0 EUR/MWh, which is the scenario where the energy surplus is provided to the PtG system as the mean energy sink. Such a low price is foreseen in the case of a production in excess that is not compensated by additional management capabilities of the grid. The market risk analysis associated with a high penetration of intermittent energy sources, considering negative prices in day-ahead, intra-day and real time in existing markets [
31,
32]. Null electricity costs will normalize the LCOS of the system to the LCOE as described in a previous section, which gives a more accurate figure to evaluate the cost of the storage capacity for such purpose. This enables a direct comparison with other storage technologies or strategies. Our reference interest rate was set to 4% as a moderate value for a 25-year period. The impact of energy transition and the systemic change would imply many uncertainties about interest rates in the long term.
The results of our analysis of the reference case are given in
Table 2. The levelized cost of storage (LCOS) considers the evolution of the CAPEX and OPEX at the commissioning and operation year according to the installation capacity growth rate in
Figure 3. In both scenarios, the high-cost projections depicted in
Figure 6 and
Figure 7 are unable to determine any viability. Such a high-cost scenario assumes a shallow slope for the learning curve of the development of PtG technologies. The internal return rate (IRR) is deeply negative, as is the net present value (NPV) of the investment for 25 years. Small differences are found between both growing scenarios for the same CAPEX and OPEX unit cost assumptions.
For the low-cost projection, as a result of a successful evolution of the technology learning curve of PtG with solid reductions in the CAPEX and OPEX costs [
25]. LCOS is estimated to be below 150 EUR/MWh, with potential economic viability. In any case, note that in our reference case, the difference between purchase and input electricity prices is 100 EUR/MWh.
For further analysis, in the case of the low-cost scenario, we have estimated the effect on the LCOS versus the utilization factor at the nominal available capacity and its input cost. As discussed, this may be the case of market conditions, such as the availability of surplus electricity at the referred cost. The nominal design of the system capacity has been assessed for 900 h of operation at full capacity (14 GW in 2055, 79.5 TWh total energy processed from 2030 to 2055). In our sensitivity analysis, the energy surplus processing has been studied for UF = 1, 0.9, 0.8, 0.7 and 0.6, which corresponds to yearly full-power operation time (OT) = 900, 810, 720, 630 and 540 h, corresponding to the total energy processing of 79.5,71.5, 63.6, 55.6 and 47.7 TWh. Such sensitivity analysis is important because one of the uncertainties in the viability of storage systems is the number of cycles that they will operate. The number of cycles and energy shifted will strongly depend on the structure of the market and how storage energy will be paid. The LCOS depends on the CAPEX and OPEX of the PtG system and the utilization of the facility during the estimation period, this analysis being unaffected from other market conditions such as the CO
2 cup-and-trade or the electricity purchase price. The impact of the electricity surplus cost in the LCOS is clearly reflected in
Figure 9, varying from 0 to 35 EUR/MWh (for a discharge purchase price of 100 EUR/MWh). The cost is increasing because the underutilization of the available infrastructure reduces the amortization of the CAPEX. The cost of the surplus electricity has a strong impact on the LCOS.
The dependence of the NPV versus the electricity purchase price and CO
2 taxes has been analyzed, at a reference surplus electricity cost of 0 EUR/MWh and a 4% interest rate. We have taken the low-cost scenario, with an LCOS of 145 EUR/MWh, and an intermediate scenario, with average CAPEX and OPEX evolutions, which resulted in an LCOS of 350 EUR/MWh. We have rejected the high-cost scenario, because the economic viability is clearly negative, with a negative NPV under reasonable market parameters such as a CO
2 penalty between 0 and 250 EUR/ton and electricity purchase between 40 and 200 EUR/MWh. The results are summarized in
Figure 10. The colored upper-right corner of the graph shows the set of values with NPV positive during the 25-year period of our analysis for the intermediate scenario. This region shows the market conditions for a payback time of under 25 years. In the case of the low-cost scenario, electricity purchase prices around 80 EUR/MWh may lead to a positive NPV in 25 years with no additional support of a CO
2 penalty in the system.
4. Discussion
An economic analysis estimation of the implementation of power-to-gas (PtG) systems in Spain has been provided. In this scheme, synthetic natural gas (SNG), produced from green hydrogen and captured CO
2, is processed by combined cycle thermal plants. Previous work in the field [
22] estimates that energy surplus in Spain would be between 0.5% and 2% of the total energy demand. Such surplus electricity might be available at low cost (between 0 and 35 EUR/MWh in our analysis) and at peak production/low demand market conditions. In accordance with this hypothesis, we have evaluated the PtG transformation capacity to process the estimated surplus electricity operating 900 h/year at full power. This is a reasonable utilization factor because the amortization of industrial facilities requires intensive operation, and 10% of the available time seems to be sufficient to provide realistic values, assuming that the operation of storage facilities may be as frequent as current peak generators. Obviously, a low utilization factor is a parameter that strongly affects storage technologies for energy shifting. We have evaluated the levelized cost of storage (LCOS) and traditional economic parameters such as NPV and IRR for the growing scenarios of 1.36 and 1.75%/y extended between 2030 and 2055.
Our main results show how LCOS may vary between 136 and 686 EUR/MWh with a payback time of 16 years in the best scenario for a reference electricity purchase of 100 EUR/MWh and a CO2 penalty of 100 EUR/ton, with large uncertainties in the CAPEX and OPEX of such systems. The utilization of the system, denoted by the yearly time operation, is an important issue. Currently, the tariffs for storage energy intake into the network are fixed by a market with inherent storage capacities. Peaking plants as natural gas and other fossil plants provide daily fluctuations in the energy price, with a narrow margin for the viability of additional storage into the system. Therefore, energy storage for energy shifting will be underused during the coming years and decades unless dedicated regulations are applied.
LCOSs for power-to-gas (PtG) are in the range of other storage alternatives. In particular, they are higher than pumped-storage hydroelectricity, but seem competitive with other energy shifting storage system (CAES and LAES) into the 140–270 EUR/MWh, and batteries (>400 EUR/MWh) in the current stage of the technology [
33]. Batteries and PtG, especially, will depend on learning curve evolutions in future decades. In the case of PtG systems, the learning curve for electrolysis is a parameter that affects the economic performance in the long term. Such technologies are under similar evolution for the case of some competitors, such as batteries, as well as for the direct utilization of hydrogen in fuel cells instead of combined cycles, as in this study.
Further work will extent the application of power-to-gas schemes, or power-to-X to other final applications, such as the utilization of synthetic natural gas in house heating, or other industries, such as ammonia production or clean fuels. Such direct end uses may have a very important role for emission reductions in hard-to-abate sectors, and increase the efficiency of the whole process, because PtG for electricity generation has a round trip efficiency lower than 40% [
10].


