Article

Wave Velocity in Sandstone and Mudstone under High Temperature and Overpressure in Yinggehai Basin

Exploration and Development Research Department, CNOOC Research Institute Ltd., Beijing 100028, China
*
Author to whom correspondence should be addressed.
Energies 2022, 15(7), 2615; https://doi.org/10.3390/en15072615
Submission received: 9 February 2022 / Revised: 8 March 2022 / Accepted: 10 March 2022 / Published: 3 April 2022
(This article belongs to the Special Issue Advanced Coal, Petroleum and Nature Gas Exploration Technology)

Abstract

:
Wave velocity under different pressure and temperature (PT) conditions plays an important role in the exploration of oil and gas reservoirs. We obtained the mineral composition and porosity of 20 underground sandstone and mudstone samples in Yinggehai Basin via X-ray diffraction and porosity measurements. Using high-frequency ultrasound, the P- and S-wave velocities of four samples under high temperature and overpressure conditions were found to vary significantly, owing to the material composition and porosity. According to the comparison between the experimental conclusion and the well-logging data, the genesis of false bright spot and dark spot gas reservoirs in the study area was analyzed. The variation in P-wave velocity under different temperature and pressure conditions was explained with the PT coefficient. The traditional pressure–velocity and temperature–velocity prediction methods were improved and applied to well-logging data. Herein, the velocity of P- or S-waves of sand and mudstone under high temperature and overpressure via rock physics experiments and the genesis of false bright spot and dark spot gas reservoirs in the Yinggehai Basin was observed. Overall, the results serve as a theoretical basis for seismic exploration in the study area.

1. Introduction

The Yinggehai Basin is a typical high-temperature and overpressure basin located in the northern sea area of the South China Sea. Since the 1990s, many normal pressure and temperature (PT) gas fields have been found in the shallow layer of the central diapir belt using conventional bright spot technology [1]. However, as the exploration involved high temperature and overpressure, the bright spot technology adopted for the middle and deep layers of Dongfang and Ledong areas failed in the late 1990s [2]. Relevant research data indicate that the physical properties and seismic response of middle and deep reservoirs in this area are highly complex owing to the influence of high temperature and overpressure. Further, abnormal changes in P-wave velocity and impedance have been found, resulting in false bright or dark spots in seismic data (Figure 1) [3,4]. Owing to this phenomenon, traditional reservoir prediction techniques, such as conventional bright spots and pre-stack wave impedance inversion, were challenging to employ in the study area. At present, there is no consensus on the rock wave velocity anomaly and the influencing factors under high temperature and overpressure in this area. Accordingly, a comprehensive rock physics investigation is needed.
The PT of the rock had a significant impact on the wave velocity. The relationship between PT and velocity is caused by continuous pore closure and phase transformation of minerals in rocks [5,6]. Based on laboratory results, P- and S-wave velocity are usually logarithmically positively correlated with confining pressure and linearly negatively correlated with temperature and pore pressure [7,8,9]. Laboratory measurement results also enabled some scholars to establish a comprehensive fitting formula between P-wave velocity and PT [10,11]. However, P- and S-wave velocity has different rates of change for similar rocks under different PT conditions [8,9]. As the factors influencing the PT coefficient in the fitting formula established in previous studies have not been discussed, the difference in P- and S-wave velocity variation of the rock cannot be explained. Combined with laboratory measurement results, this study sought to connect the influencing factors with the correlation coefficient, establish velocity–temperature and velocity–pressure relations for sandstone and mudstone, and applied these relations to the logging data.
The controlling and influencing factors of wave velocity at high temperatures and overpressure formation in the Yinggehai Basin remain ambiguous. In this study, the differences in P- and S-wave velocity under high temperature and overpressure of sandstone and mudstone core samples in the Yingqiong Basin were analyzed by systematic experiments from the perspectives of minerals and pores. The following specific experimental workflow was employed: (1) the mineral composition of the samples was obtained by X-ray diffraction measurement; (2) the porosity of samples under different confining pressure was obtained by the helium method, (3) the relevant sample sections were observed; (4) the ultrasonic velocities of four samples were measured under different PT and analyzed, and (5) the fitting relationship between P-wave velocity and PT was established to predict the actual formation data.

2. Experimental Conditions and Basic Petrophysical Characteristics

Samples were collected from 20 downhole cores (2000–4000 m) in Dongfang and Ledong districts of the Yingqiong Basin, South China Sea. The mineral composition and porosity were obtained using X-ray diffraction analysis and helium experiments. The cores were processed by instrument to a diameter of 25.4 mm and a height of 40–60 mm plugs. The two end faces of the plug were finely polished to a degree less than 0.1 mm. Due to the softening effect of clay dehydration on the rock skeleton, we referred to the previous drying methods, stored the cores in an 80 °C oven for 72 h, and placed the samples indoors for 48 h to obtain samples containing 2–3% water to eliminate the softening effect of water on the rock skeleton [12,13]. The samples were analyzed by changing alone the confining pressure, temperature, or pore pressure to avoid any interference from different influencing factors on the analysis results. Autolab2000c equipment in CNOOC Research Institute produced by NER Company (Yantai, China) was used to measure the high-frequency P- and S-wave velocity. Figure 2 shows the AutoLab system and scheme of preparation for wave velocity measurements in samples. P-wave and S-wave velocity according to the direction of vibration and propagation were evaluated, namely V P 0 ° and V S 0 ° (sample cut normal to bedding), where V S H - 0 ° V S V - 0 ° . The VP and VS data from cited for comparison in the paper all in this direction.
According to some studies, porosity has important influence on the wave velocity of rocks [15,16,17,18]. The data depicted in Figure 3 aligns with the notion that the increase of porosity can significantly reduce P- and S-wave velocity, indicating that porosity directly determines wave velocity. Wave velocity is also related to mineral composition [19,20,21]. The research shows (Table 1) that quartz and feldspar have higher density and elastic parameters, with more “stiffer” elastic properties, while clay minerals have more “soft” elastic properties. The differences in mineral elasticity also lead to different velocities.
In order to understand the comprehensive influence of pores and minerals on elastic properties, we regarded the rock as composed of quartz, feldspar, clay, and pores. Then, the dry rock was constructed by four elastic boundary theory, with Voight for upper limit (black line), Reuss for lower limit (red line), Hashin–Shtrikman for upper and lower limit (blue and pink line), and V-R-H for average of equivalent elastic modulus of the medium. The equations and details of each model are shown in the Appendix A. The processes were as follows: (1) clay and pores as soft materials mixed with the V-R-H model, (2) quartz and feldspar as stiffer minerals mixed with the V-R-H model, (3) soft and stiffer substances were mixed through Voight, Reuss, and Hashin–Shtrikman boundary theory to obtain the elastic modulus boundary of dry rocks.
As shown in Figure 4, except for single-phase minerals, isotropic mixtures of HS model could never reach the stiffness of Voight limit [12]. When the stiffer minerals increased, the elastic parameters showed a little positive trend along the model line. The elastic parameters also showed a little downward trend with an increase in soft materials. For high-temperature and overpressure reservoir, due to the difference in elastic properties between stiffer minerals and soft materials, the rock skeletons of different components that resisted PT also differed. Further, differences in the deformation of the skeleton were found, which led to different P- and S-wave velocities and impedance relationships. Thus, the study area had false bright spots in the seismic data or formed a dark spot gas reservoir. We proceeded to analyze the rock P- and S-wave velocity difference and its causes under the high temperature and high pressure to provide a theoretical basis for reservoir oil and gas prediction in the study area.
In order to prevent too many influencing factors (mineral, porosity, pressure, and temperature) from affecting the velocity, single-physical-parameter differences of four samples were selected (samples with similar porosity and large difference in mineral content or similar mineral and large difference in porosity), and single changes in the confining pressure, temperature, and pore pressure were analyzed to avoid any interference from different influencing factors on the analysis results. Table 2 shows the porosity and mineral composition of the four selected samples.

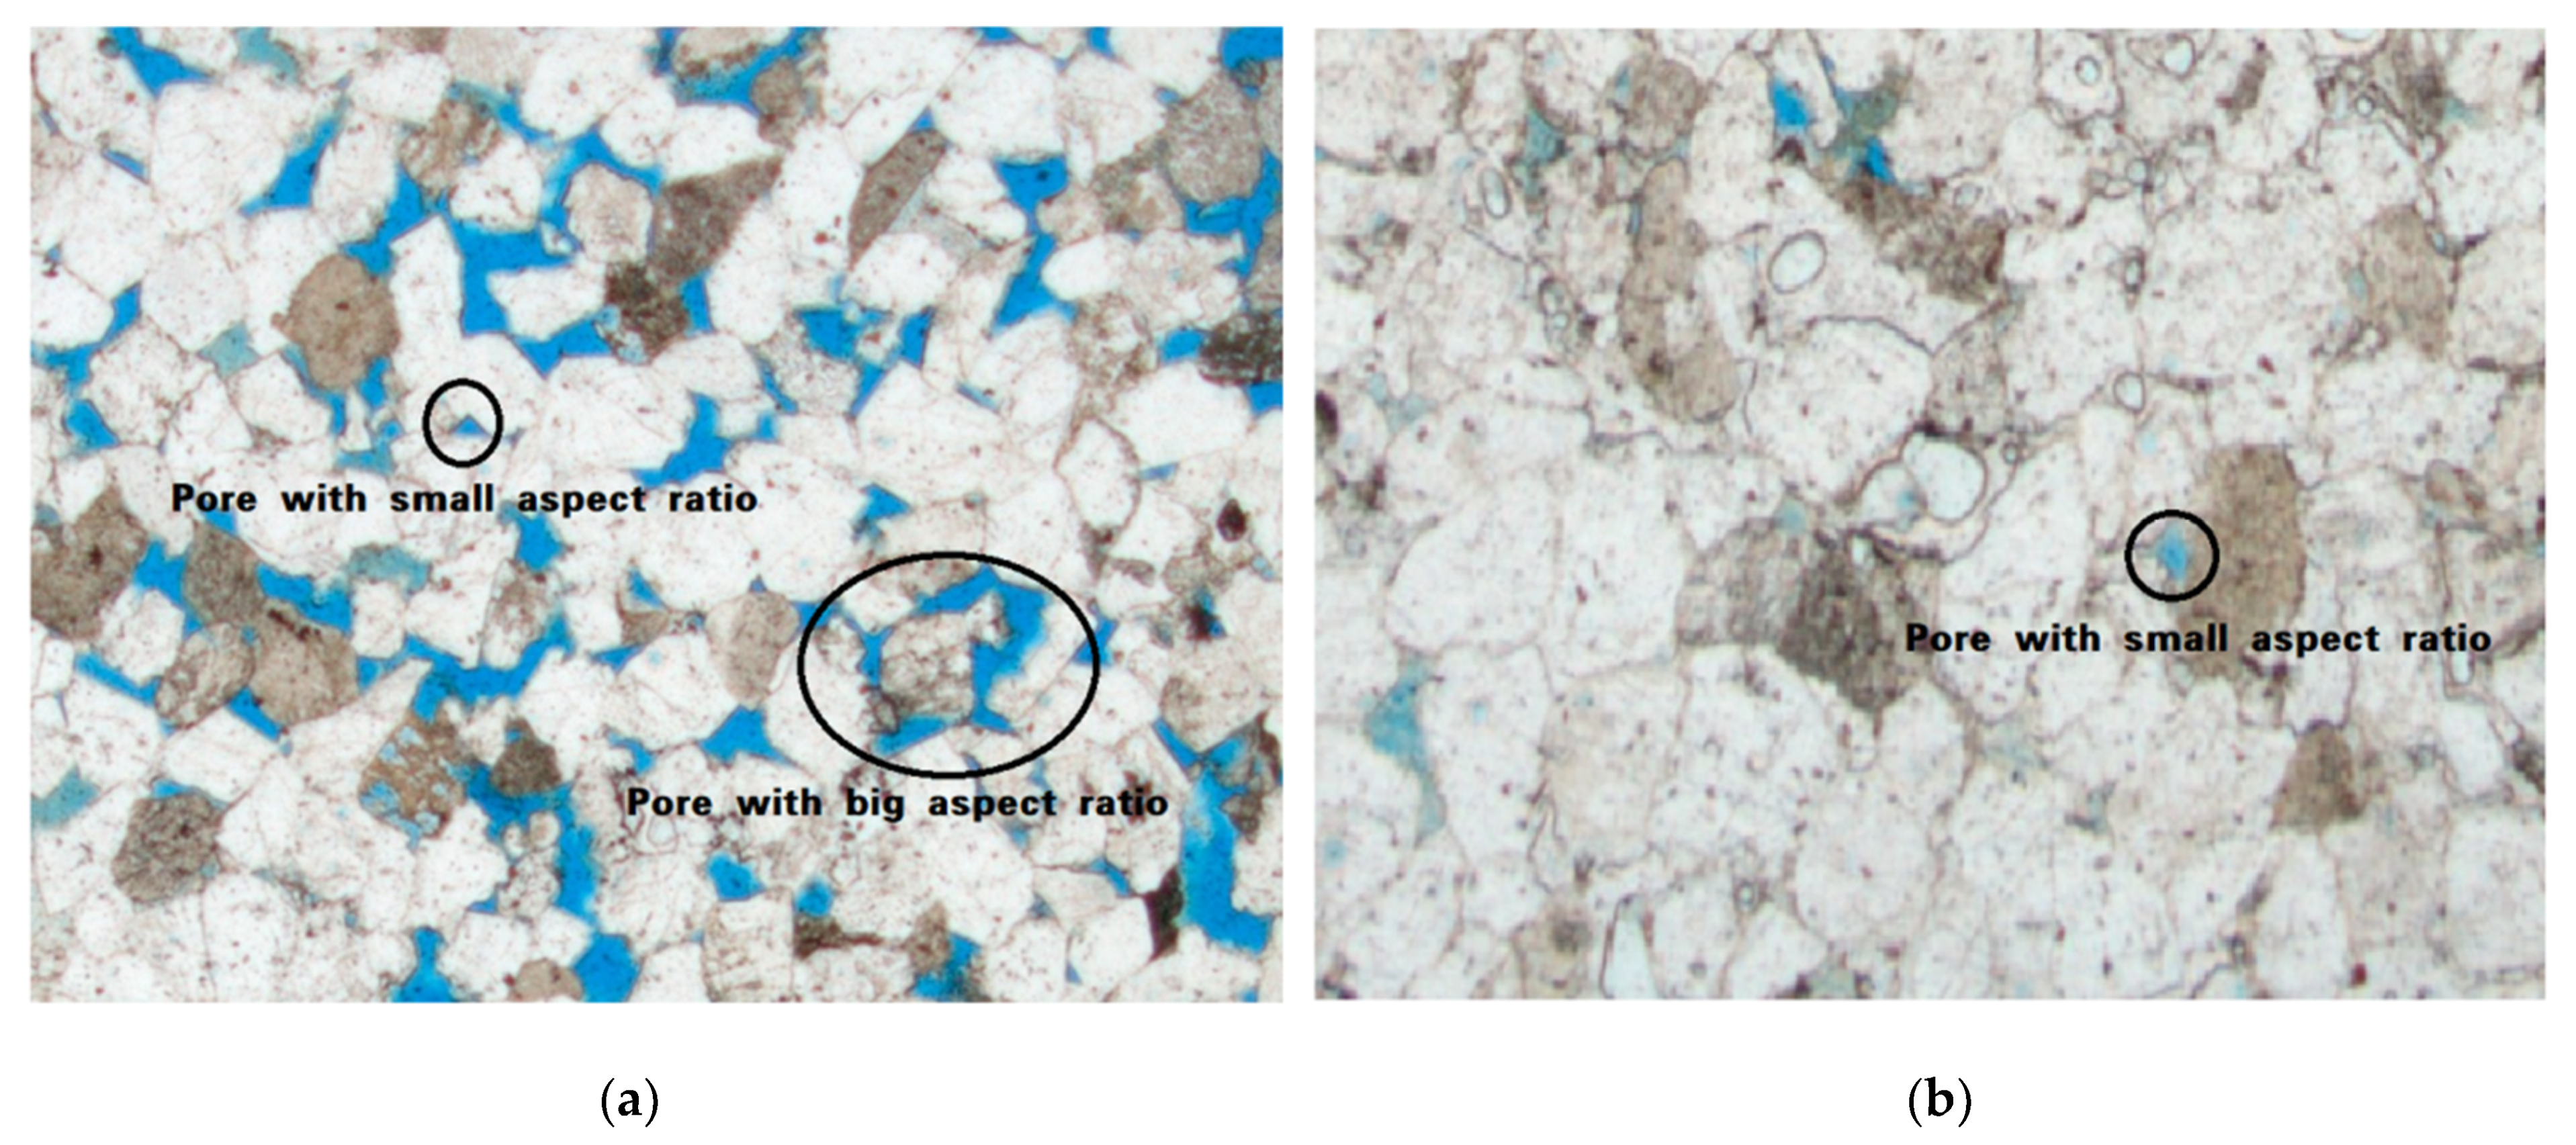
3. Influence of Pore

Porosity directly affects P- and S-wave velocity, and the resistance of different rock pores to pressure differs under high pressure. The porosity of some samples was measured by the helium method at 60 MPa (step 10 MPa). For ease of distinction, the samples were simply classified according to the porosity. As shown in Figure 5, the porosity of samples decreased with increasing pressure. However, the pore resistance of samples and the downward trend were different. Such results also led to a difference in the samples’ P- and S-wave velocity under high pressure (Figure 6).
Two samples with small differences in mineral content and big differences in porosity were selected for a single pressure transformation experiment to avoid the influence of temperature and minerals on the rock. The specific parameters of these two samples are listed in Table 2. Figure 6 shows the cross-plot of P- and S-wave velocity and confining pressure under dry and completely saturated conditions (test step of 5 MPa under room temperature). The P-wave and S-wave velocities of the samples increased with the confining pressure, showing a logarithmic trend. Although the P-wave was more sensitive to pressure, all increasing trends showed two obvious differences: the P- and S-wave velocities of the high-porosity sample increased greatly with the confining pressure under low pressure (0–60 MPa) and increased slowly under high confining pressure (60–120 MPa). The P-wave velocity increased by more than 70%. Further, the wave velocity of the low-porosity sample under low confining pressure was similar to that of the high-porosity sample but hardly increased under high pressure. The P-wave velocity generally increased by <50%.
Generally, the change in elasticity of rock under confining pressure is related to the closure of pores and plastic deformation of the mineral with different degrees of alteration [22,23,24,25]. Figure 7 shows a 200 µm cast slice. Notably, the pore structure of Sample 1 was identified to be complex. In fact, the pores with large aspect ratio and small aspect ratio were found to coexist in the rock. Several pores with small aspect ratio were also close to the increase in pressure under low confining pressure, resulting in a significant increase in P- and S-wave velocity. When the confining pressure increased, only pores with large aspect ratio constantly resisted the pressure. As a result, the relationship between P- and S-wave velocity and pressure was related to the resistance of pores with large aspect ratio to pressure, which indicated that the wave velocity increased slowly with the pressure. In contrast, Sample 2 had a lower porosity and only contained pores with a low aspect ratio. After the pressure increased to 60 MPa, the pores were completely closed, and only the rock skeleton resisted the pressure. As the P- and S-wave velocity no longer increased with pressure, this highlighted the compactness of the rock. The two trends of porosity and pressure revealed that the difference in pore structure and porosity caused a change in the relationship between P- and S-wave velocity and pressure. The P- and S-wave velocity of the higher porosity sample increased slowly with confining pressure under high conditions. However, no increase was observed for the lower porosity sample. This phenomenon may be related to the genesis of the dark point gas reservoir, that is, the P- and S-wave velocity of high-porosity gas sand stratum increased abnormally under higher pressure and caused an increase in impedance, which was similar to that of the overlying background mudstone, ultimately forming a dark point gas reservoir.
The relationship between temperature and P- and S-wave velocity of the two samples was evaluated, and a cross-plot of the wave velocity and temperature of dry samples is shown in Figure 8. The wave velocities of two samples showed a downward trend with the increase of temperature, but the trend was subtly different. The P-wave velocity of the high-porosity sample decreased by more than 7%, while that of the low-porosity sample decreased by 4%. The difference in the temperature–velocity trend reflected the degree of pore expansion during the heating process of samples. Owing to the difference in porosity, the thermal expansion of the pores of high-porosity sample was greater than that of the low-porosity sample [26,27], resulting in a greater trend of P- and S-wave velocity reduction. This phenomenon showed that the high-porosity formation had the characteristics of velocity reduction under high-temperature conditions. If there are big differences in porosity and temperature between the upper and lower mudstone formations, this may lead to the difference of wave impedance and form a dark spot gas reservoir.

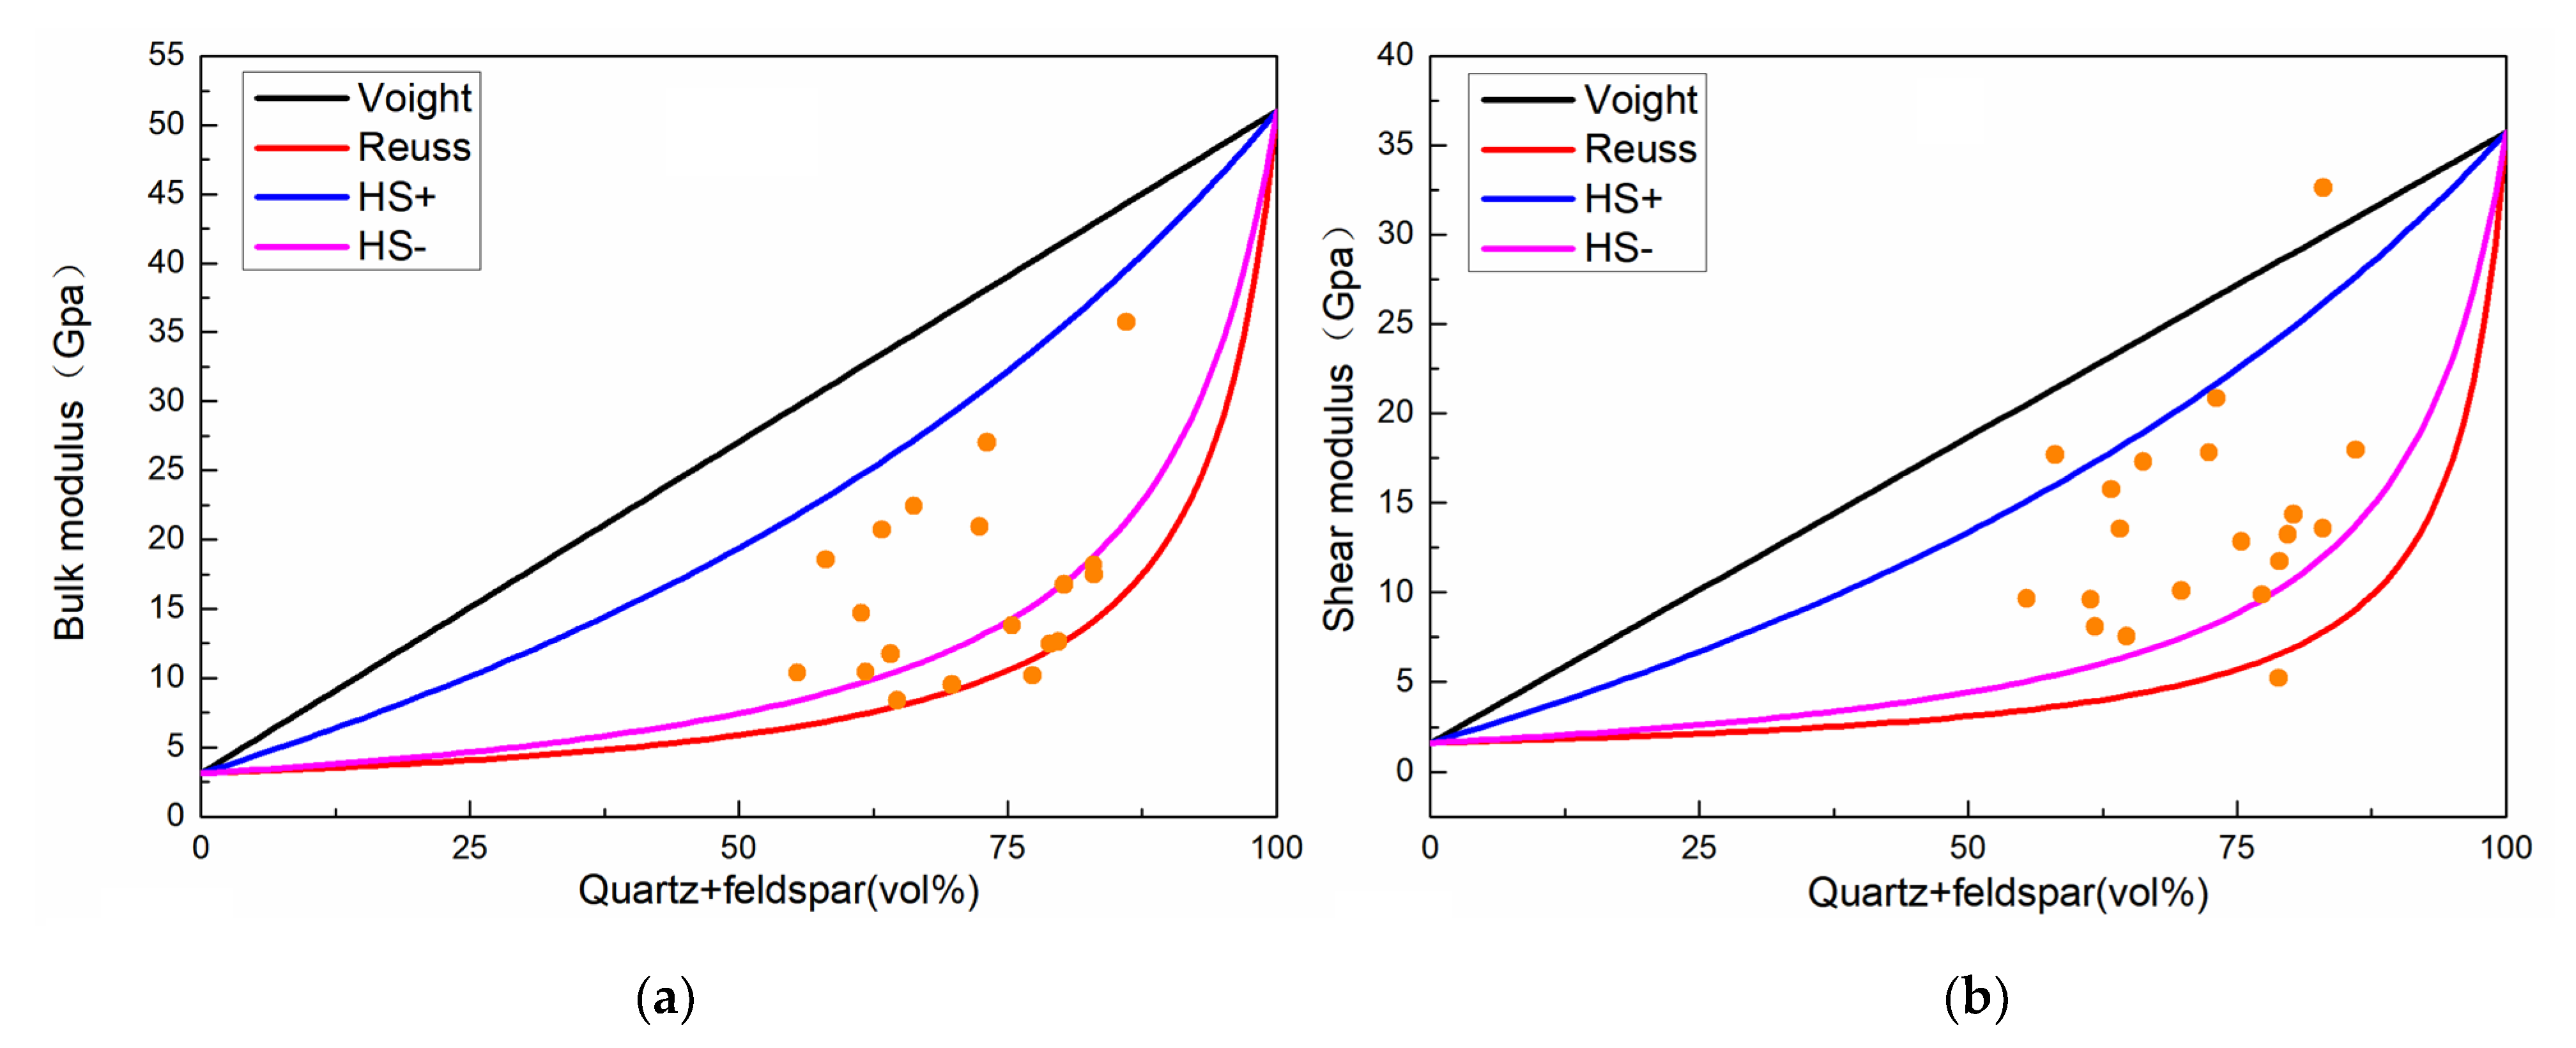
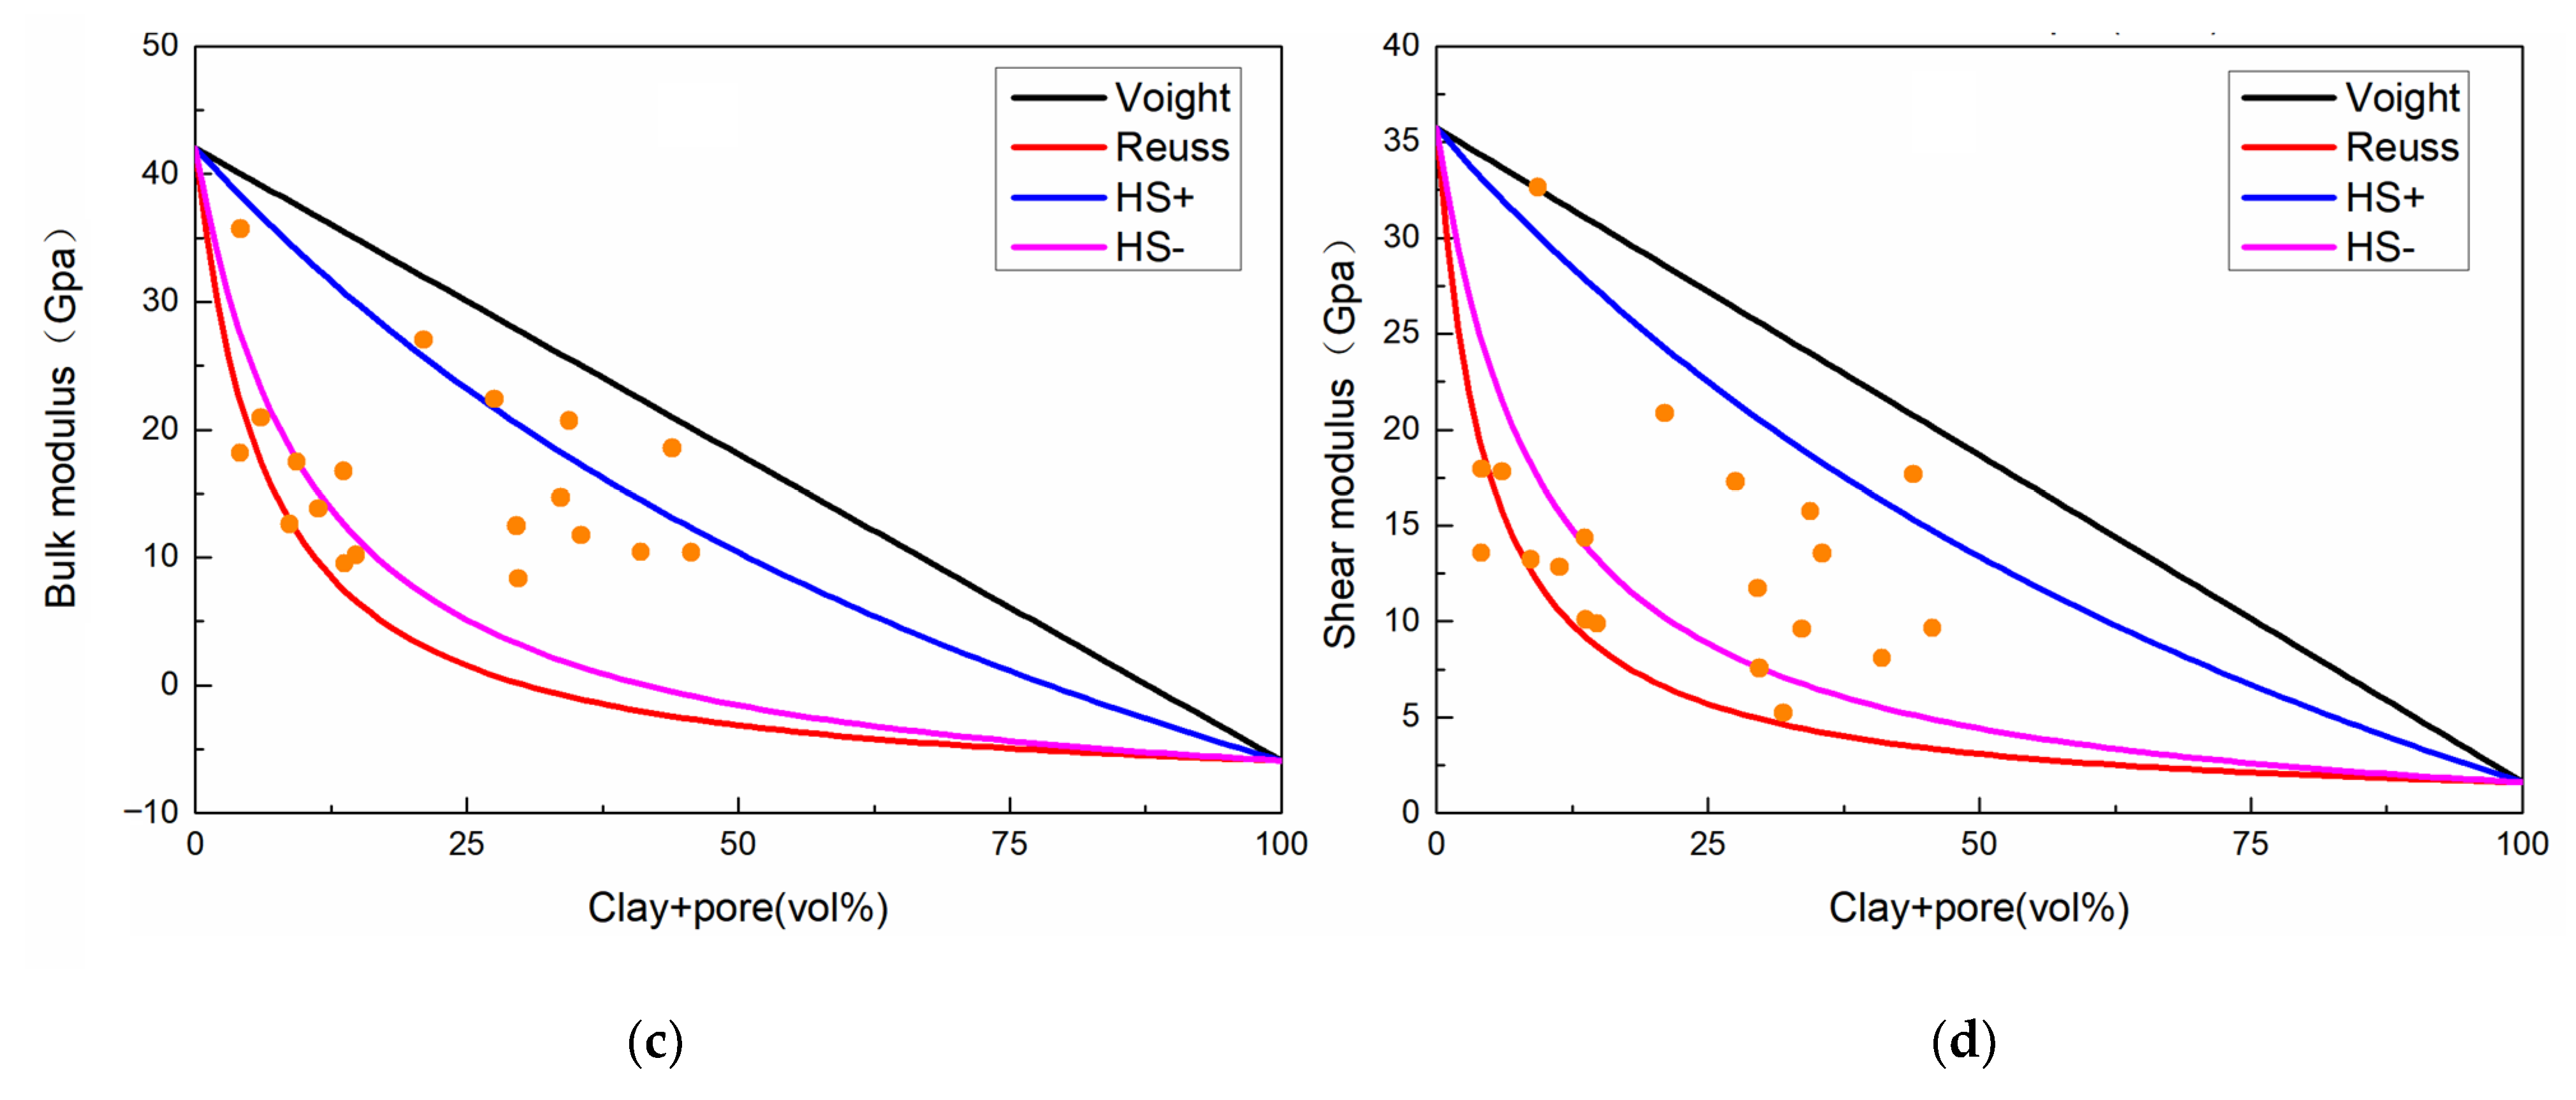
4. Influence of Mineral Composition

The composition of the rock skeleton also influences the relationship between velocity and pressure. Sample 3 and Sample 4 with small difference in porosity and pore structure but big differences in clay mineral content were selected for the analysis. The specific parameters of these two samples are provided in Table 2. Figure 9 shows the cross-plot of the P- and S-wave velocity and confining pressure under dry and completely saturated conditions (test step of 5 MPa under room temperature). The trends of the two samples were identified to be similar under a low confining pressure, showing that the P- and S-wave velocity increased greatly with pressure. However, an obvious difference was found when pressure rose to 40–60 MPa. The P- and S-wave velocity of Sample 4 with low clay content gradually slowed down with the increase in pressure after the pressure exceeded 40–60 MPa, following which P-wave velocity increased by 16%. Sample 3 with a high clay content maintained a large range of increase, in which the P-wave velocity increased by more than 20%.
We speculate that this was related to the elastic properties of the clay and its related pores. Under a low confining pressure, the velocities of both samples had a positive correlation with confining pressure due to the closure of plastic pores. When the pressure was greater than 40–60 MPa and the plastic pores were completely closed, the resistance of the rigid pores and skeleton to the pressure was found to affect the wave velocity. The resistance of rigid pores in mineral particles to pressure was also related to the hardness of minerals. The sample with low clay content had higher contents of stiffer quartz and feldspar minerals, and the resistance of rigid pores and skeleton to pressure was significantly higher than that of the high-clay sample. Therefore, the P- and S-wave velocity of the low-clay-content sample was significantly lower than that of samples with higher clay content under high pressure. It should be noted that the P- and S-wave velocity with the high-clay-content sample was higher than those with the low-content sample under 0 MPa confining pressure. This may be related to the mineral morphology. That is, the morphology of mineral and pore in rock have a great influence on the wave velocity [28]. In conclusion, the content of clay, quartz, and feldspar minerals in the rock has a secondary influence on the relationship between wave velocity and confining pressure. If the content of quartz and feldspar minerals are higher, the P- and S-wave velocity increases slowly with confining pressure under high conditions. On the contrary, if the clay content is higher, the P- and S-wave velocity increases greatly with confining pressure under certain high conditions. The phenomenon of false bright spot may be related to the change of clay content in a high-pressure formation.
The variable temperature experiment was carried out on two samples. The cross-plot of temperature and P- and S-wave velocity of two dry samples from 0 to 150 °C under 10 MPa confining pressure is shown in Figure 10. The P- and S-wave velocity of the two samples exhibited similar trends with temperature. However, the velocity reduction of the high-clay sample was greater than that of the low-clay sample (21% vs. 19%). Due to the expansion of clay itself and internal pores during the heating process, the expansion rate of clay increases with temperature [26,27]. As the range of softening of rock elastic properties increased, the decrease in the P- and S-wave velocity sample with high clay content became greater. Thus, for a high-temperature formation, the change of clay content may lead to impedance difference and a false bright spot.

5. Pore Pressure

We used the samples with large differences in porosity and minerals for analysis, and the experimental conditions were completely saturated by pressurized vacuum pumping. Figure 11 shows the relationship between P- and S-wave velocity and pore pressure of the two samples with large porosity differences under room temperature (confining pressure remained unchanged at 60 Mpa). Both samples had a negative correlation between wave velocity and pore pressure, but the P-wave velocity decrease of the high-porosity sample was greater than that of the low-porosity sample (8.5% vs. 6%).
Similarly, two samples with large differences in clay minerals and small differences in pores were analyzed. As shown in Figure 12, the P- and S-wave velocities of the samples decreased with the increase of pore pressure, but the decrease value was different and the Vs for the high clay content showed an even larger drop compared to that of Vp. The P-wave velocity of the high clay-content sample decreased by more than 7%, and that of the low-clay-content sample decreased by less than 4.5%. In the process of increasing pore pressure, due to the tight skeleton of the low-clay-content sample, the resistance of pores in the skeleton to pore pressure was higher than high-clay sample, which made the degree of pore expansion smaller and finally led to the reduction of their velocities in varying degrees. Combined with all the experimental results, we could draw a conclusion: Under the comprehensive influence of porosity and mineral composition, PT and P- and S-wave velocity differences appeared in the samples. The formation with high porosity, high clay content, high temperature, and overpressure was prone to an abnormal reduction of wave velocity, velocity and impedance difference with the compacted high-velocity mudstone layer or background mudstone layer, resulting in false bright spots. Similarly, the abnormal reduction of velocity of this formation may have also led to the reduction of impedance difference with gas-bearing formation, resulting in a dark point gas reservoir.

6. Case Analysis and Theoretical Simulation

Figure 13 shows the DF1-X6 well-logging data of Meishan first segment team in Dongfang district. The drilling results showed that there was no effective reservoir in the target layer. The cable measure formation pressure and logging interpretation results showed that the mudstone layer at 3470 m had the characteristics of overpressure and high temperature, its pore pressure (4143.1 psi), temperature (141.33 °C), porosity (10.8%), and clay content (29.2%) were higher than those of the overlying silty mudstone (pore pressure 2077.34 psi, temperature 138.25, clay content 10.6%, porosity 6.7%), resulting in a low P-wave velocity characteristic. The impedance difference between the upper and lower layers appeared due to the same density and different velocity which led the false bright spot in the seismic profile. This phenomenon also confirmed our conclusion that high porosity, clay content, temperature, and overpressure formation could easily cause abnormal velocity reduction.
Figure 14 shows the LD23-X1 well-logging data of Yinggehai first segment team in Ledong district. The actual drilling results also revealed no effective reservoir. The cable and logging interpretation results showed that an abnormal overpressure point (pore pressure 6120.64 psi) in the high-porosity (20.7%) sandy mudstone (clay content 15.3%) appeared at 2316 m and presented a low P-wave velocity characteristic. The mudstone at the 2327 m overlying strata presented (porosity 11%) high clay content characteristics (33.1%). Due to the drainage and compaction of low-velocity mudstone, high-velocity mudstone was formed. The impedance difference between them caused the abnormal reflection of seismic response. This phenomenon also confirmed our view that high porosity and pore pressure samples easily reduced the P-wave velocity, and high-clay-content samples easily increased the wave velocity greatly under high pressure.
Figure 15 shows the DF1-X12 well-logging data of Huangliu first segment team in Dongfang district. The cable formation pressure test results showed that 20 data points within the depth of 2633–2719 m had high temperature characteristics (greater than 113 °C). The mudstone interval at 2660–2673 m had higher clay content (19.6%) than other depth sections, resulting in a significant decrease in velocity under high-temperature conditions. The underlying sand layer (porosity 14.8%) showed higher porosity than the overlying sand layer (porosity 9.5%), and the velocity decreased slightly under high-temperature conditions. Low-velocity mudstone showed the characteristics of high density and low velocity, and sandstone showed the characteristics of high velocity and low density, resulting in the reduction of their impedance difference and the formation of a dark point gas reservoir. Generally, the mudstone near the reservoir cannot show low-velocity characteristics due to the reservoir compaction [4]. However, the results showed that dark point gas reservoirs may also occur between the reservoir and mudstone due to the influence of temperature, clay content, and porosity. This phenomenon was also confirmed by the experimental data.
We used the experimental results to predict the formation’s P-wave velocity data through the fitting formula. For P-wave prediction of the logging data, the fitting relationship between velocity and PT was established according to the experimentally measured values. Moreover, in order to avoid the dispersion problem of saturated samples under high-frequency conditions [29,30,31], the relationship between effective stress and velocity was constructed, and the effective stress was equal to the difference between the confining pressure and pore pressure when the rock was completely saturated. The formula was as follows:
V = V 0 + A * ln ( p / p 0 ) + B * ( T T 0 )
In the formula, V represents the fitting velocity, V 0 represents the initial velocity of the sample, p 0 and T 0 are the initial effective stress and initial temperature, respectively, and P and T are the actual stress and actual temperature, respectively.
The fitting results R2 of the four samples were greater than 0.8, and the fitting coefficients are shown in Table 3.
The coefficient reflects the differences in the sensitivity of pores and mineral components to PT. Compared with that of the low-porosity sample, the high-porosity sample had higher PT coefficients. The high coefficient reflected that the P- and S-wave velocity increased more with the confining pressure and decreased more with the increase of temperature and pore pressure. Compared with that of the low-clay-content sample, the high effective PT coefficient of the high-clay-content sample also reflected this feature. The fitting coefficient results also confirmed our experimental view that the velocity could vary significantly in high temperature and overpressure formation due to the influence of rock pores and minerals. Therefore, the traditional fitting formula could not accurately predict the P-wave data of the high confining pressure and temperature formation. We used a multiple linear regression method to establish the relationship between the PT coefficient and PC (porosity and clay content):
A = 20.74 × φ + 0.05 × V clay 73.36
B = 0.35 0.048 × φ 0.003 × V c l a y
where A and B represent pressure and temperature coefficient, respectively, and ϕ and V clay represent porosity and clay content, respectively.
Many studies have simulated carbonate or shale through the DEM model [32,33,34,35]. We also used this model to predict the P-wave velocity combined with cable formation pressure and debris XRD or logging interpretation data points. See Appendix A for the model formula. The main modeling processes were as follows: (1) Mixing clay and pores with water by the V-R-H model, (2) the remaining minerals were mixed by the V-R-H model, (3) the clay pores mixture as an inclusion was added into the mineral mixture by the DEM model, (4) the P-wave velocity was calculated according to the improved fitting formula. The clay and pore morphology were controlled by pore aspect ratio for velocity of initial pressure, which was obtained by exhaustive inversion. Figure 16 shows the P-wave velocity of the three wells, and the bluepoints are the prediction data. As shown in the figure, we have achieved reliable prediction results.

7. Conclusions

In this paper, the factors influencing P- and S-wave velocity differences under high PT conditions were analyzed from the perspectives of porosity, pore structure, and mineral composition. Combined with the experimental results, the causes of false “bright spot” and dark spot gas reservoirs in the seismic data in the study area were summarized. The main conclusions are as follows:
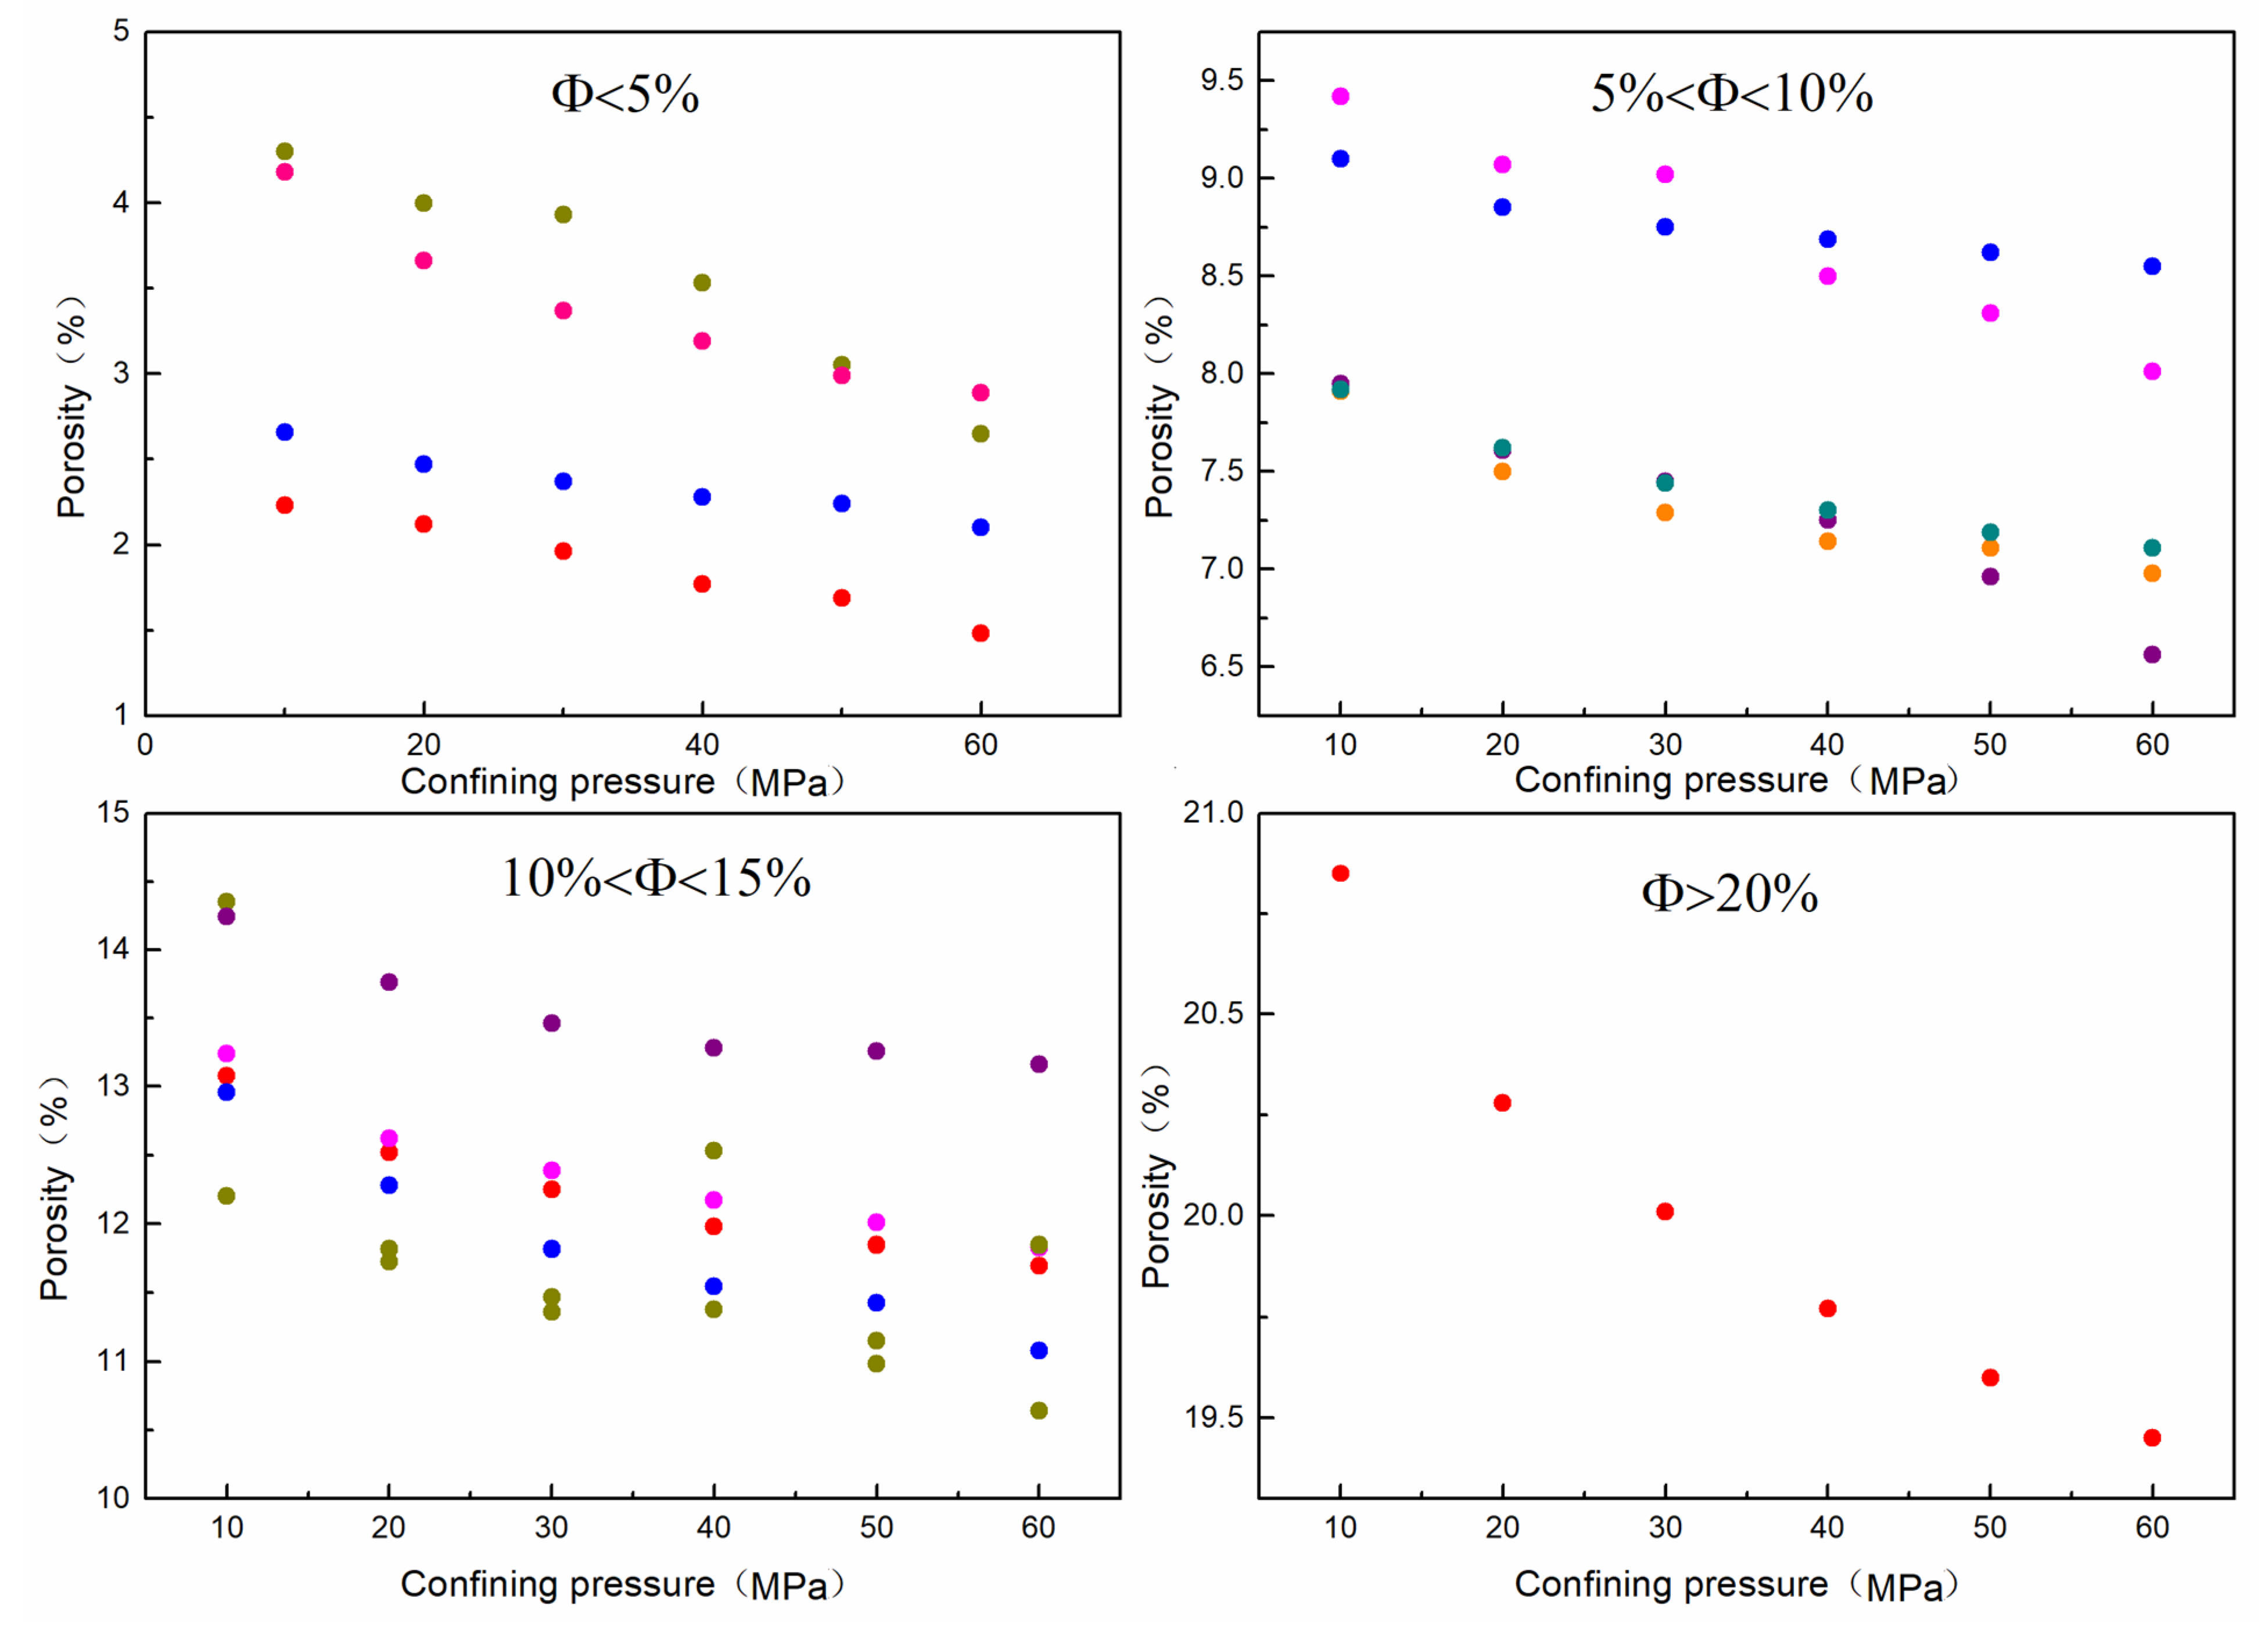
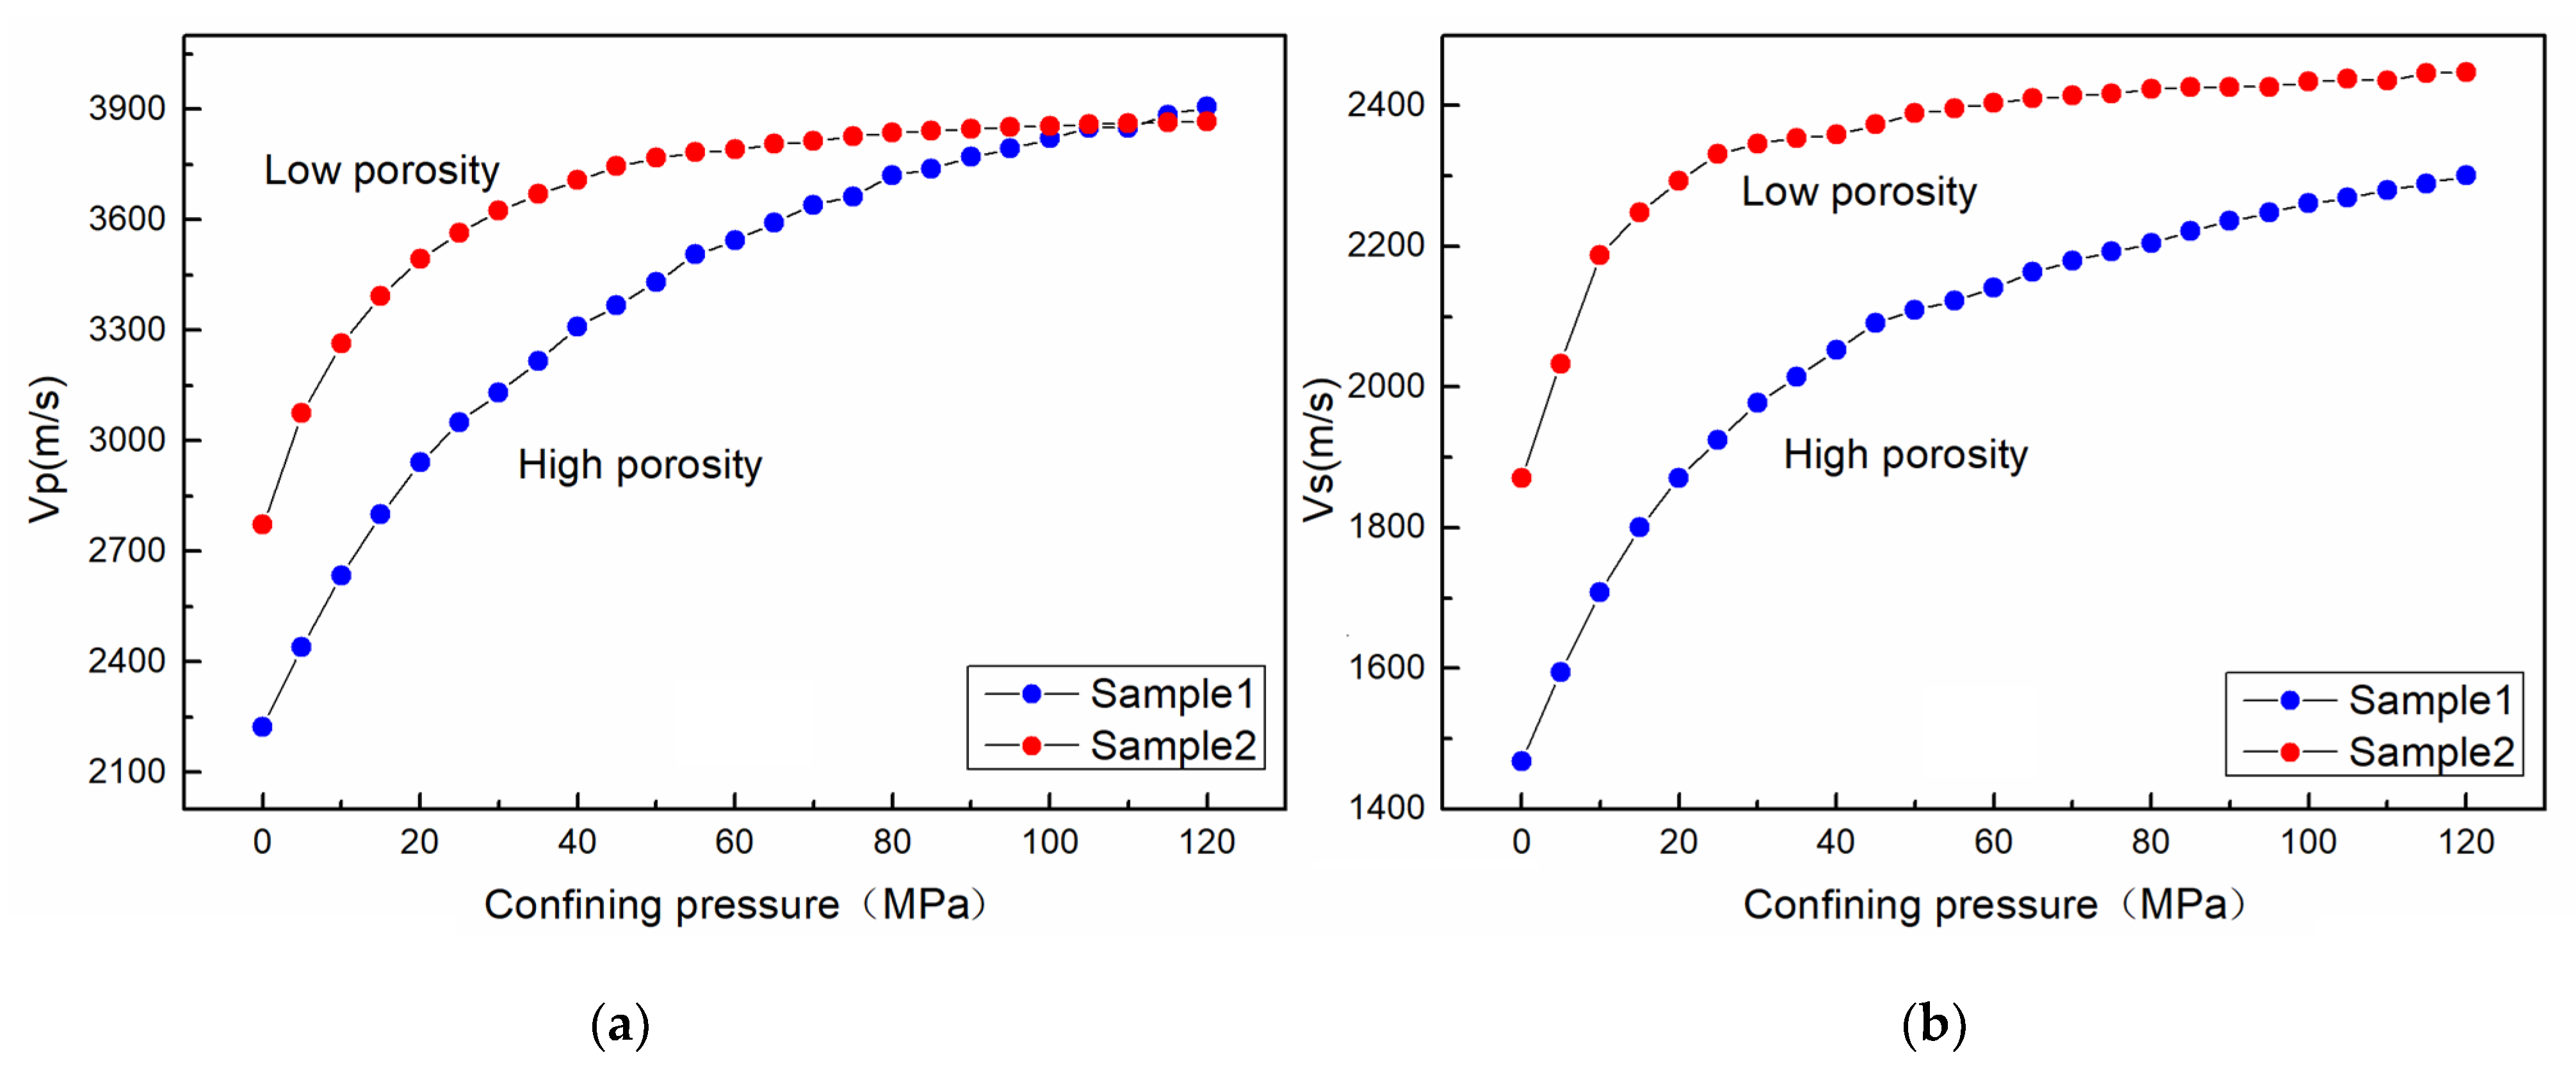
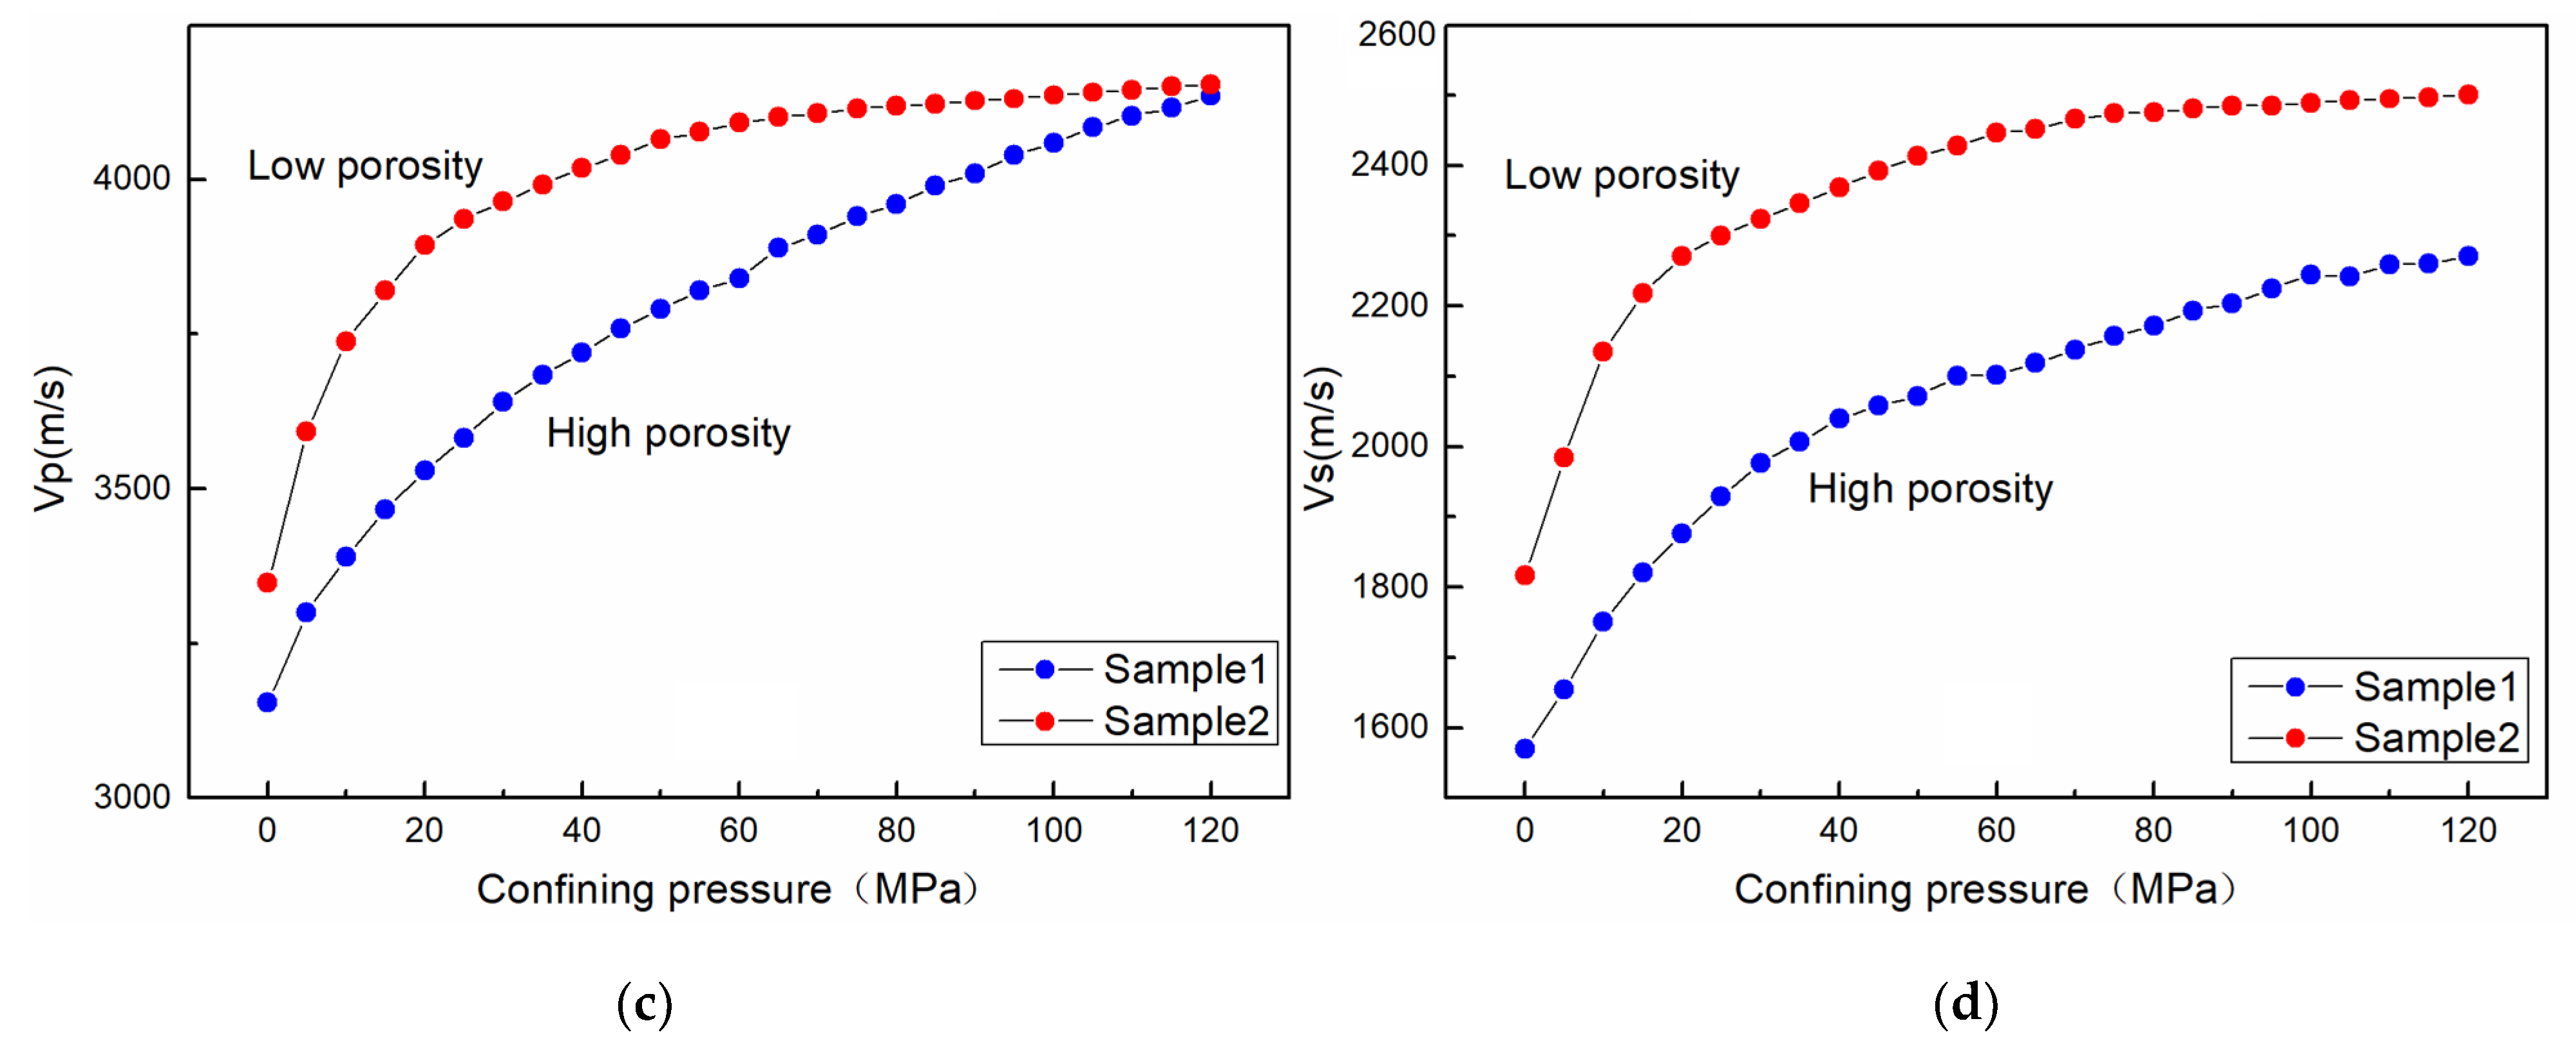
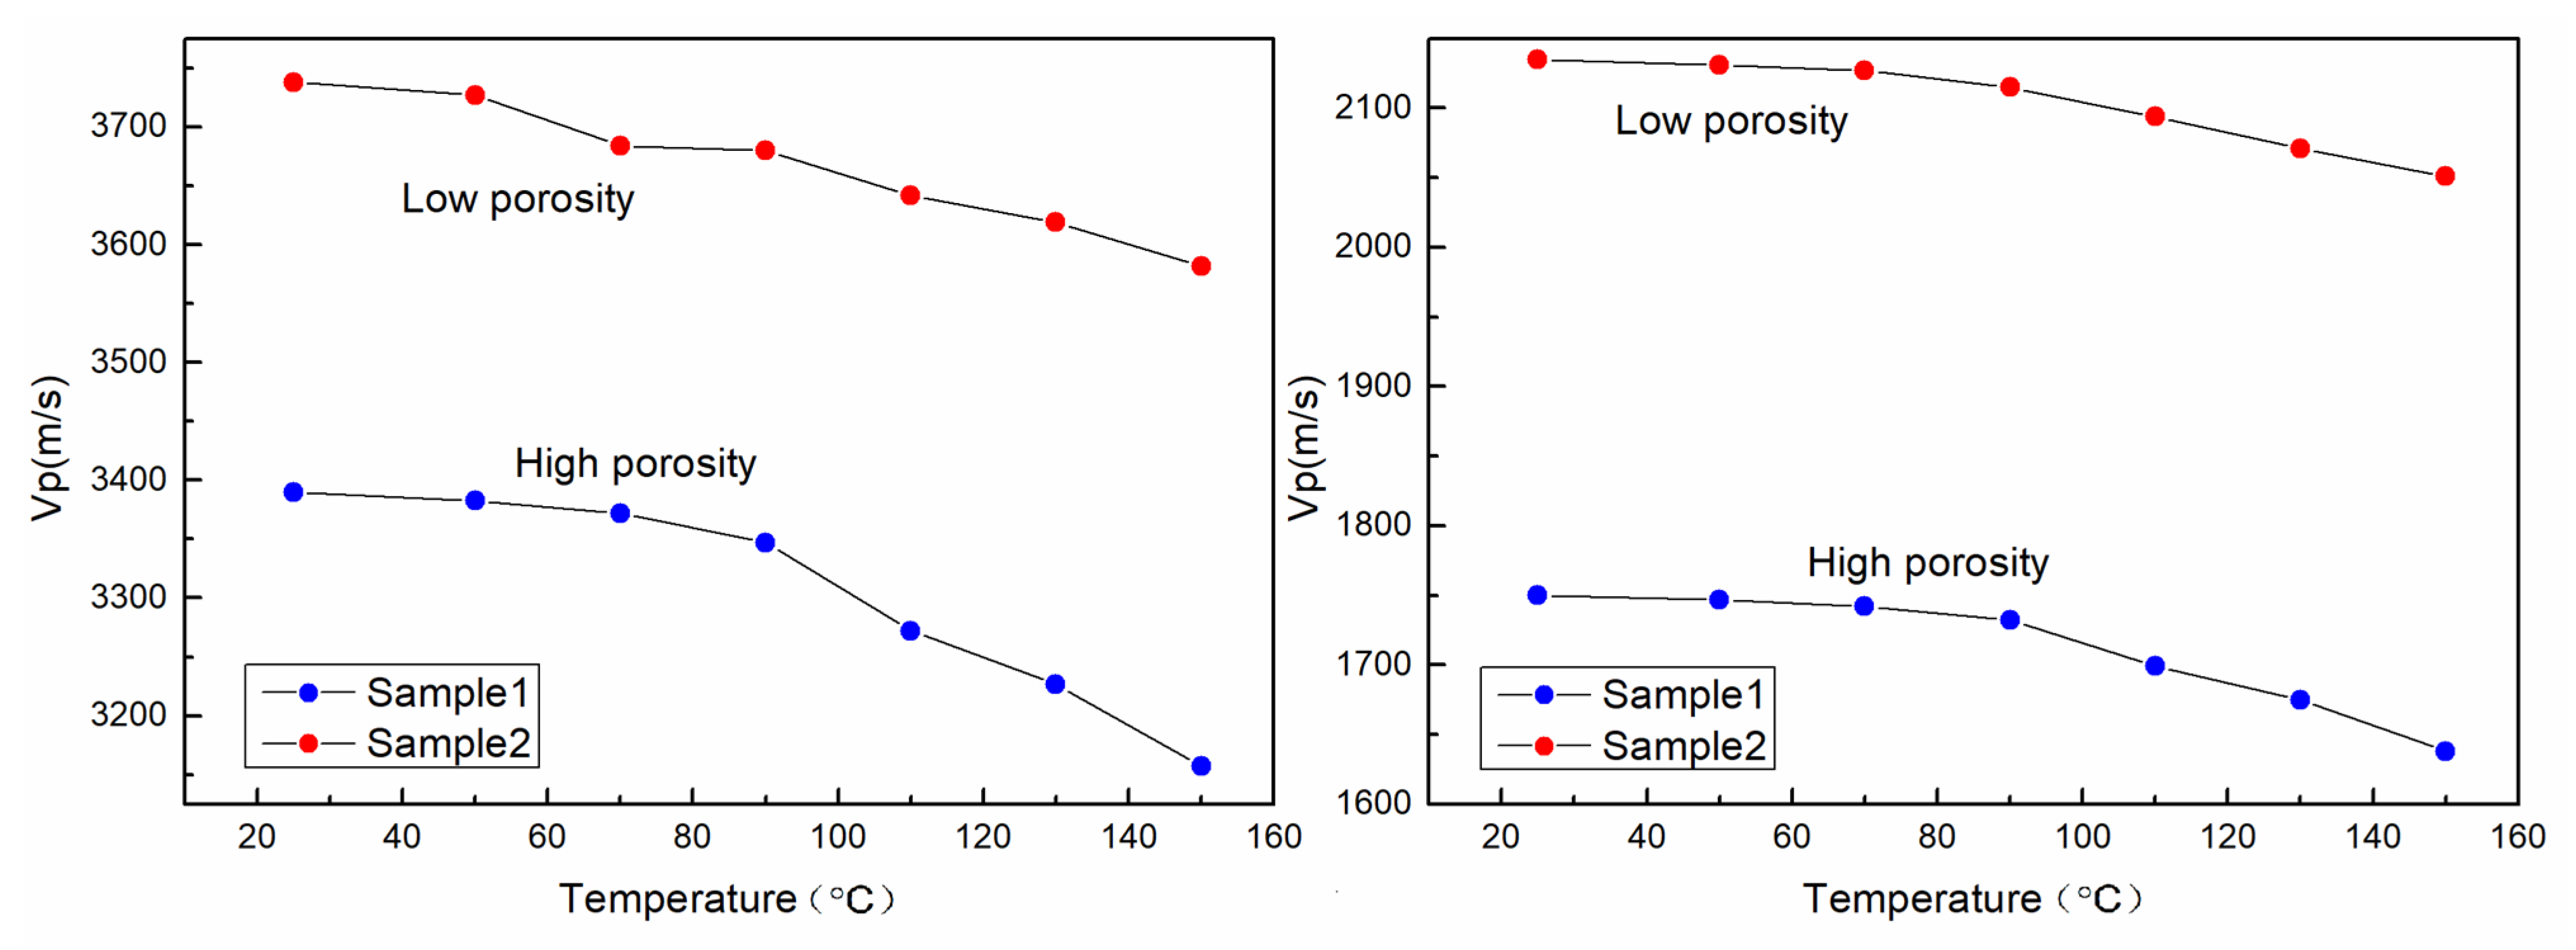
  • Porosity had important influence on the relationship between P- and S-wave velocity and PT. The P- and S-wave velocity of the high-porosity sample increased greatly with confining pressure under the condition of 0–60 MPa and increased slowly under 60–120 MPa. The P-wave velocity increased more than 70%. The velocity trend of the low-porosity sample under low pressure was similar to that of the high-porosity sample, but the velocity hardly increased under high pressure, and the P-wave velocity generally increased less than 50%. When the pore pressure increased to 60 MPa, the P- and S-wave velocity decrease of the high-porosity sample was significantly greater than that of the low-porosity sample. The P-wave velocity decreased by more than 8.5%, and by less than 6% for the low-porosity sample. Under high temperature (150 °C), the P-wave velocity of the high-porosity sample decreased by more than 7%, and that of the low-porosity sample decreased by 4%.
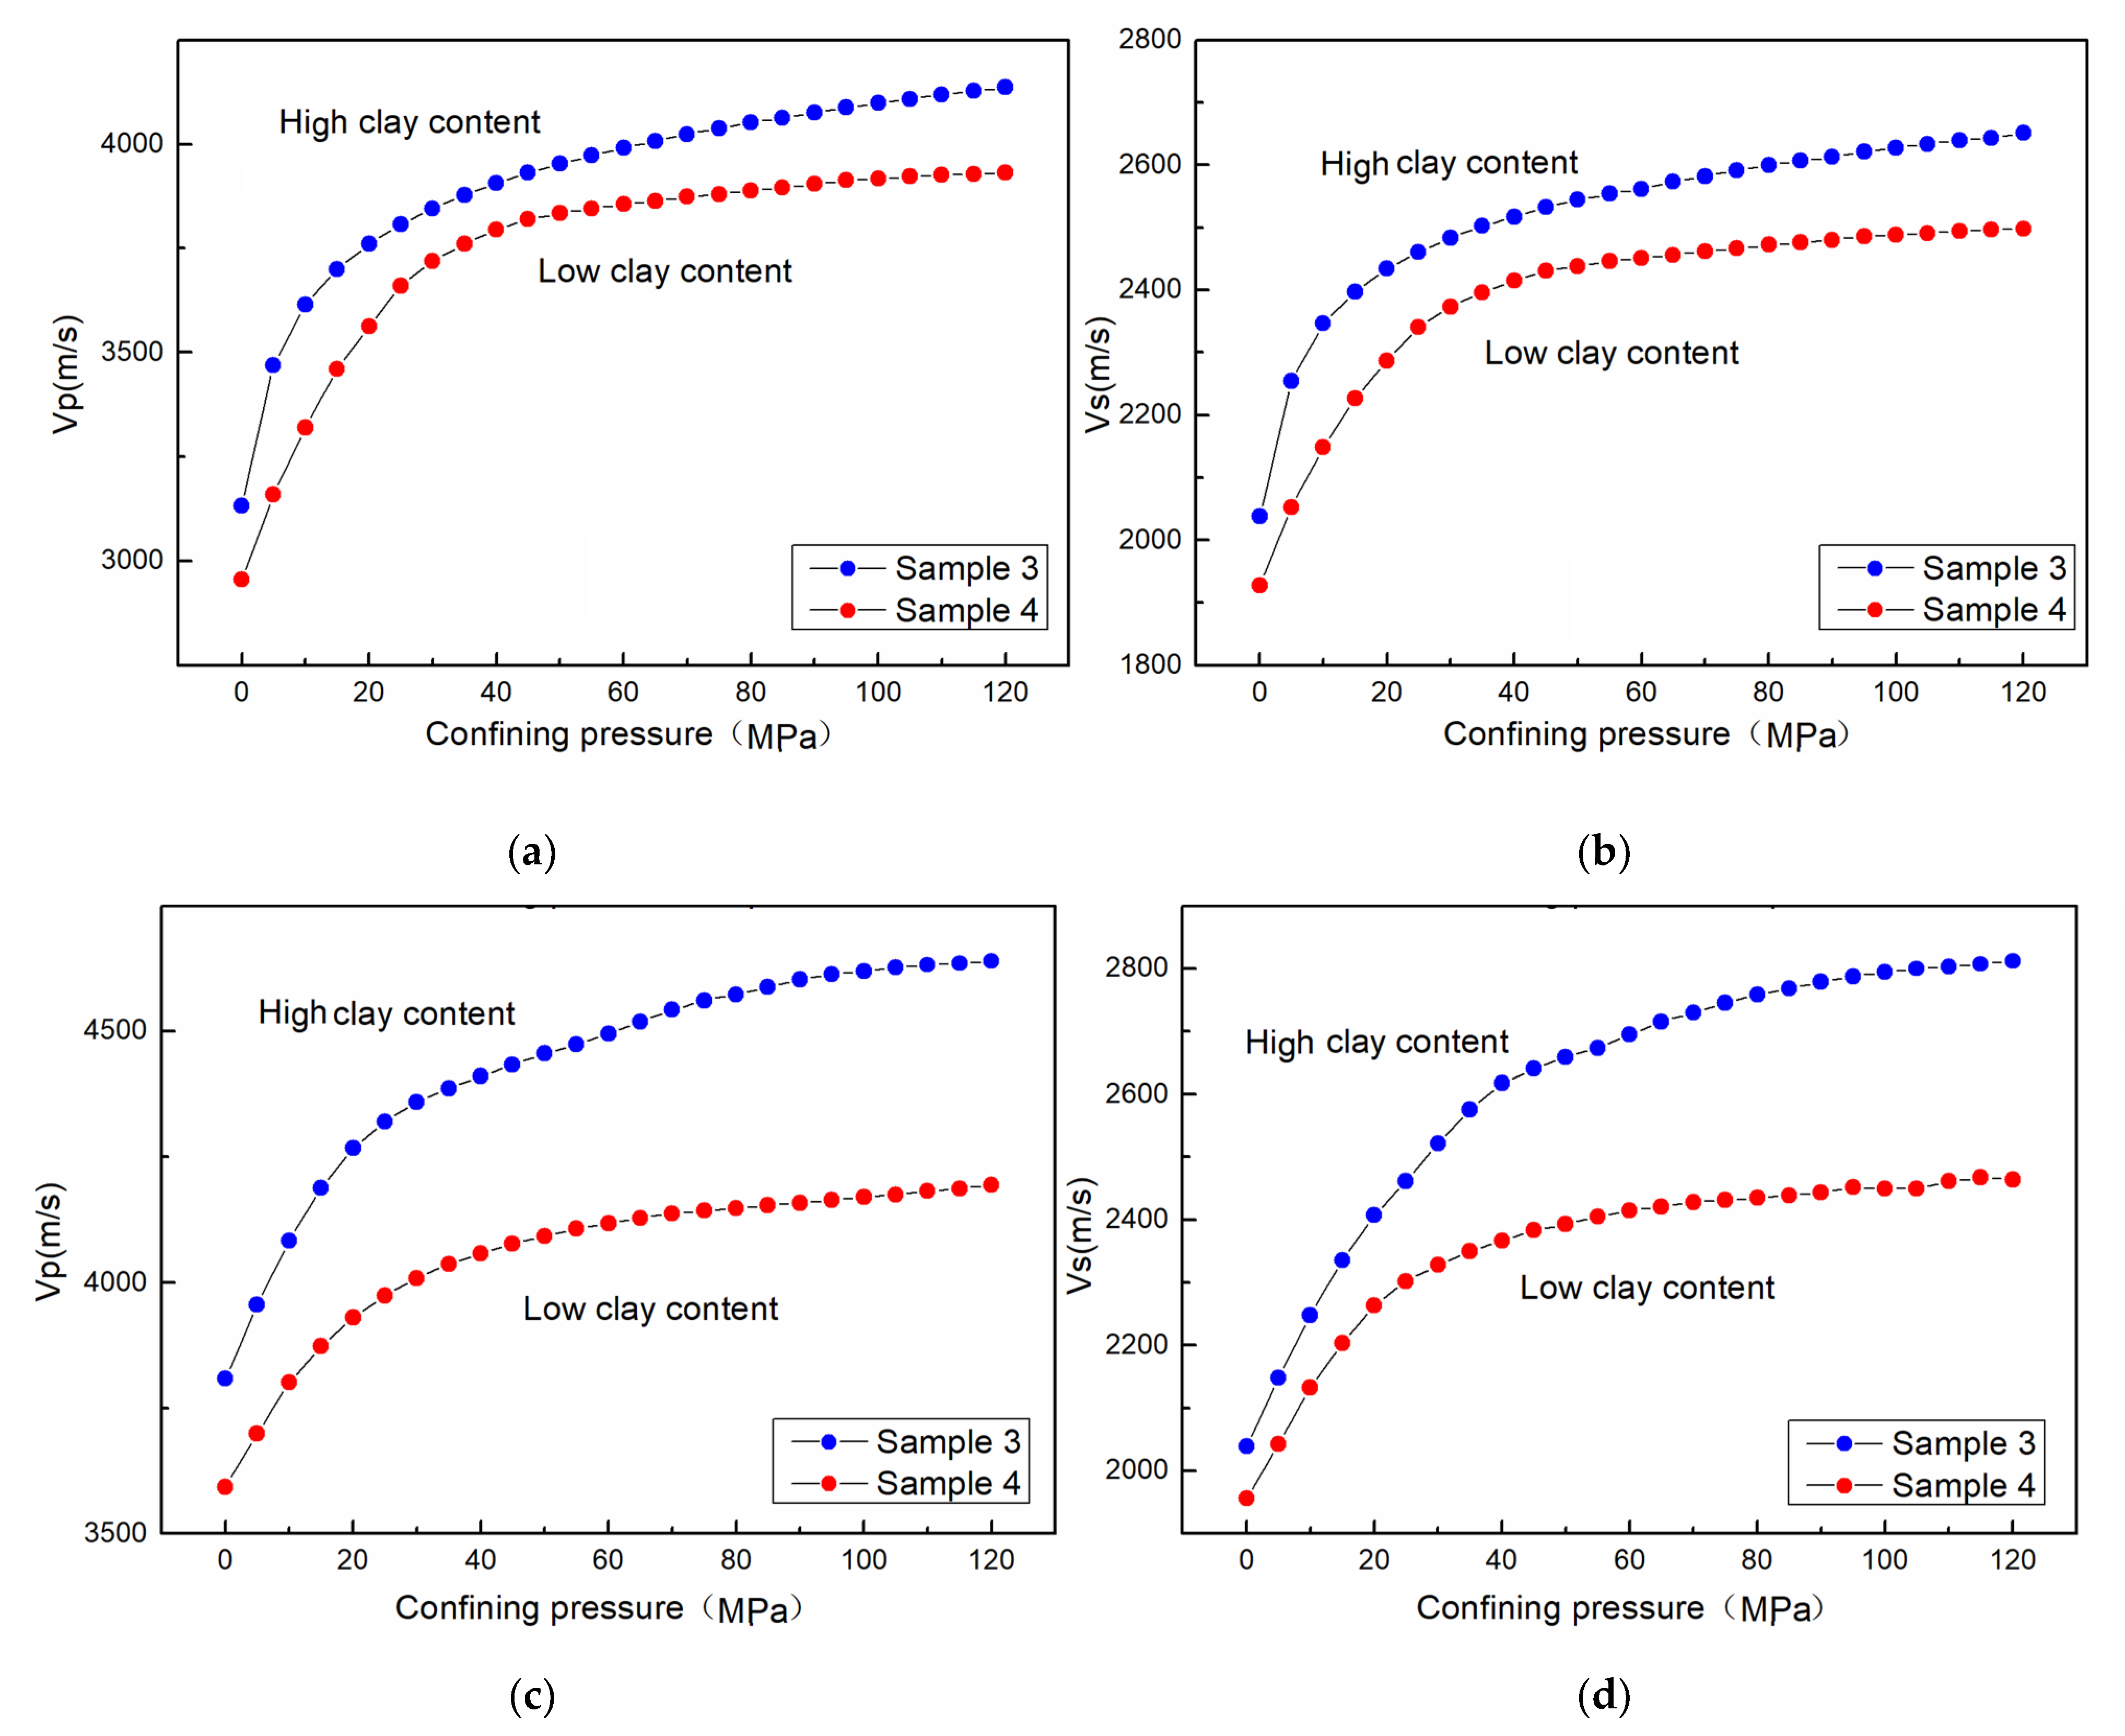
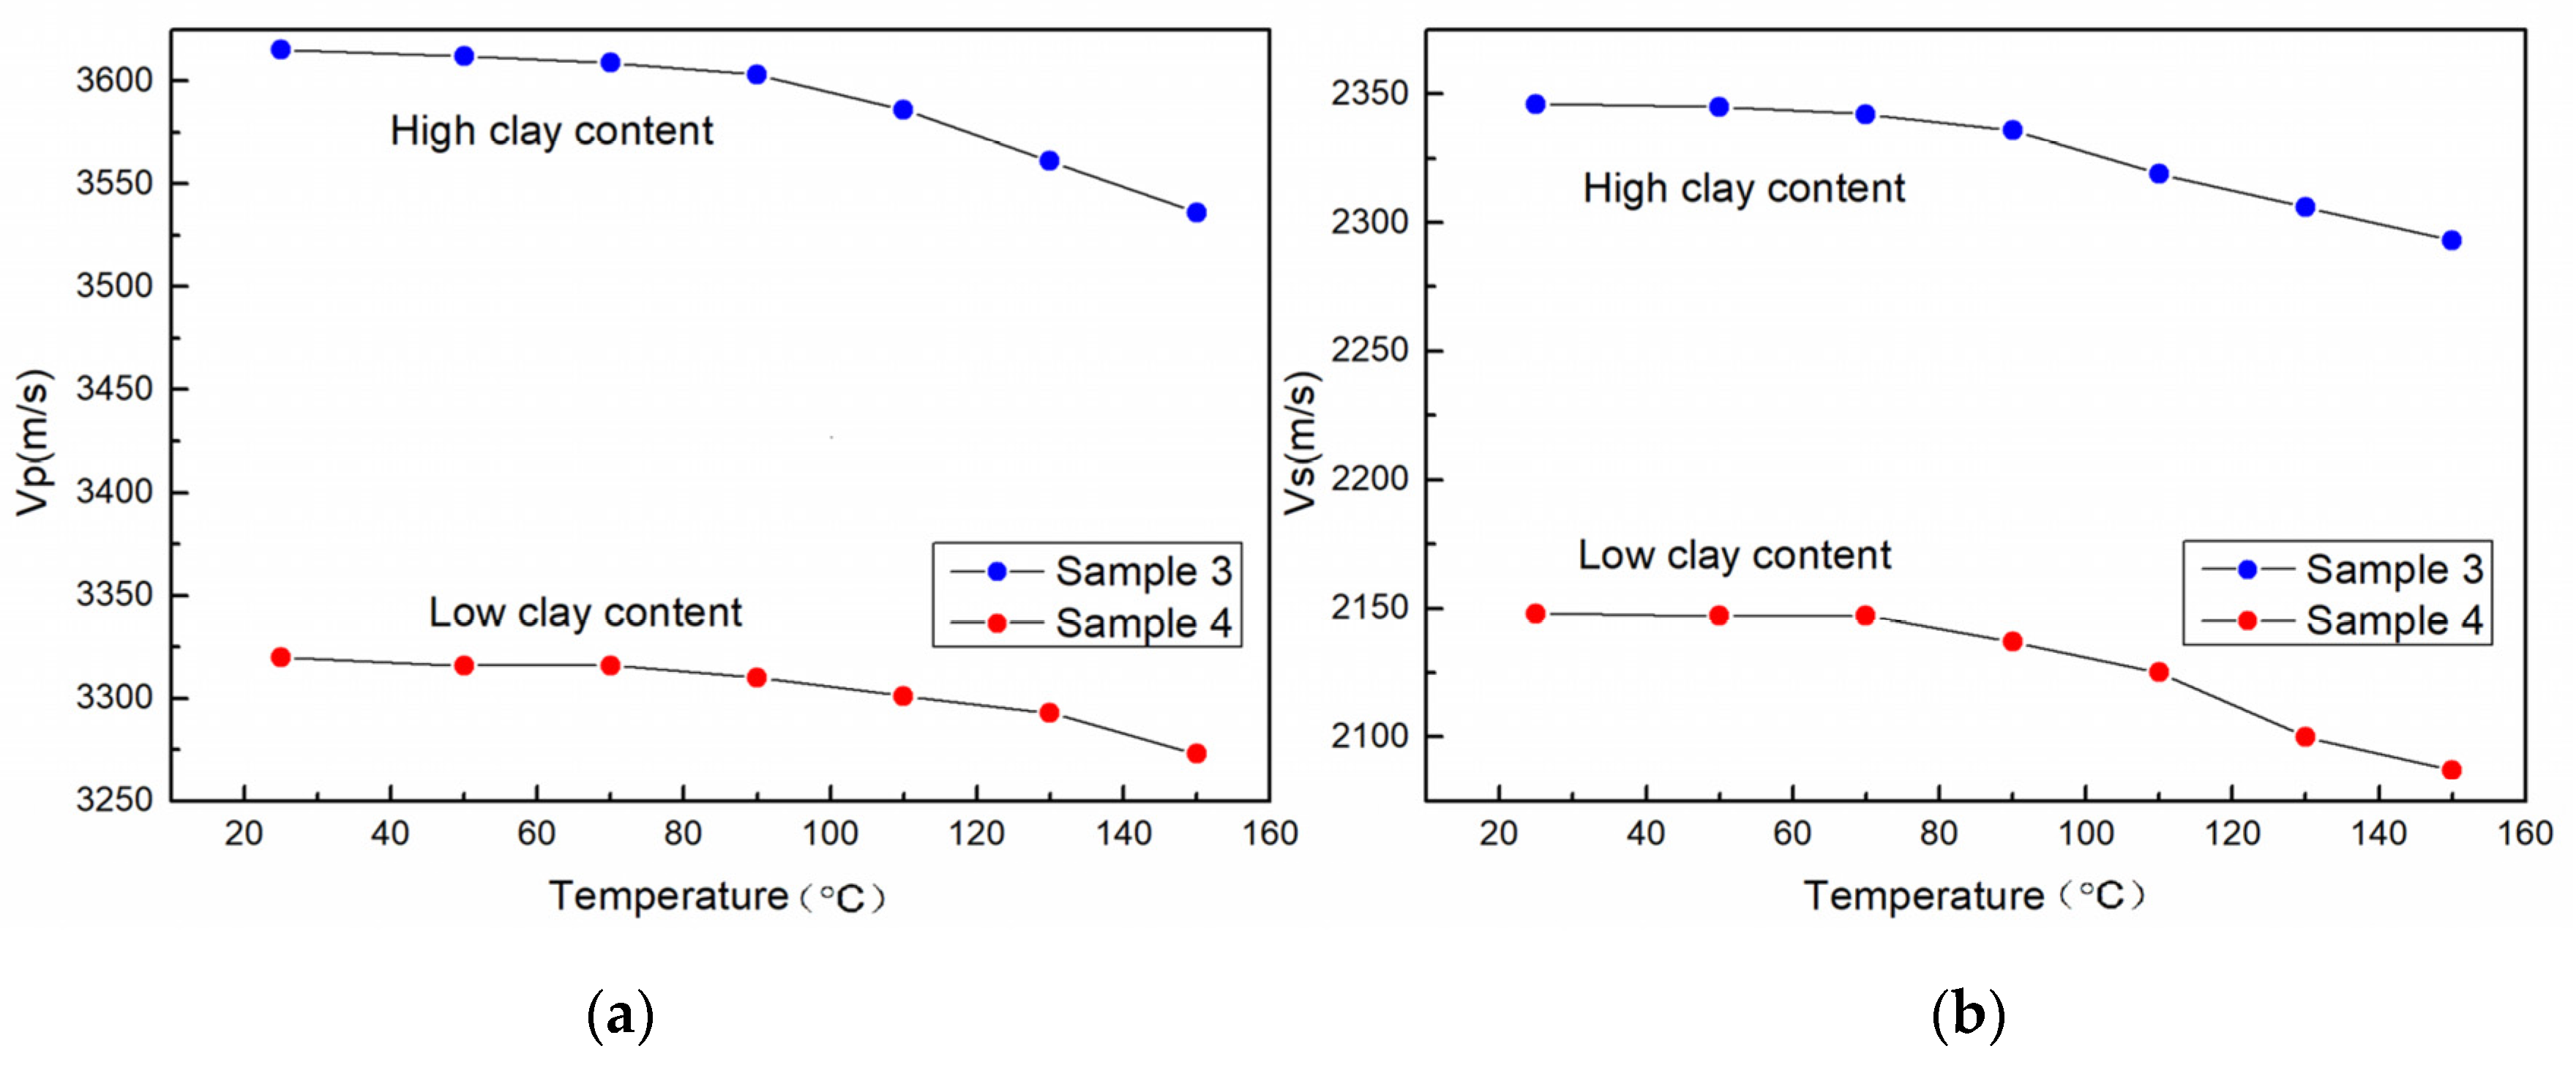
  • Mineral composition also had certain influence. Under the high confining pressure of 60–120 MPa, the P- and S-wave velocity of the low-clay-content sample gradually slowed down with the increase of pressure, and P-wave velocity increased by 16%, while the velocity of the high-clay-content sample still maintained a large increase range, and P-wave velocity increased by more than 20%. When pore pressure increased to 60 MPa, the P- and S-wave velocity of the high-clay-content sample decreased more than that of the low-clay-content sample, the P-wave velocity decreased more than 7%, and the P-wave velocity of the low-clay-content sample decreased less than 4.5%. Under high temperature (150 °C), the P- and S-wave velocity decrease of the high-clay-content sample was significantly higher than that of the low-clay-content sample. The P-wave velocity of the high-clay-content sample decreased by more than 21%, and that of the low-clay-content sample decreased by 14%.
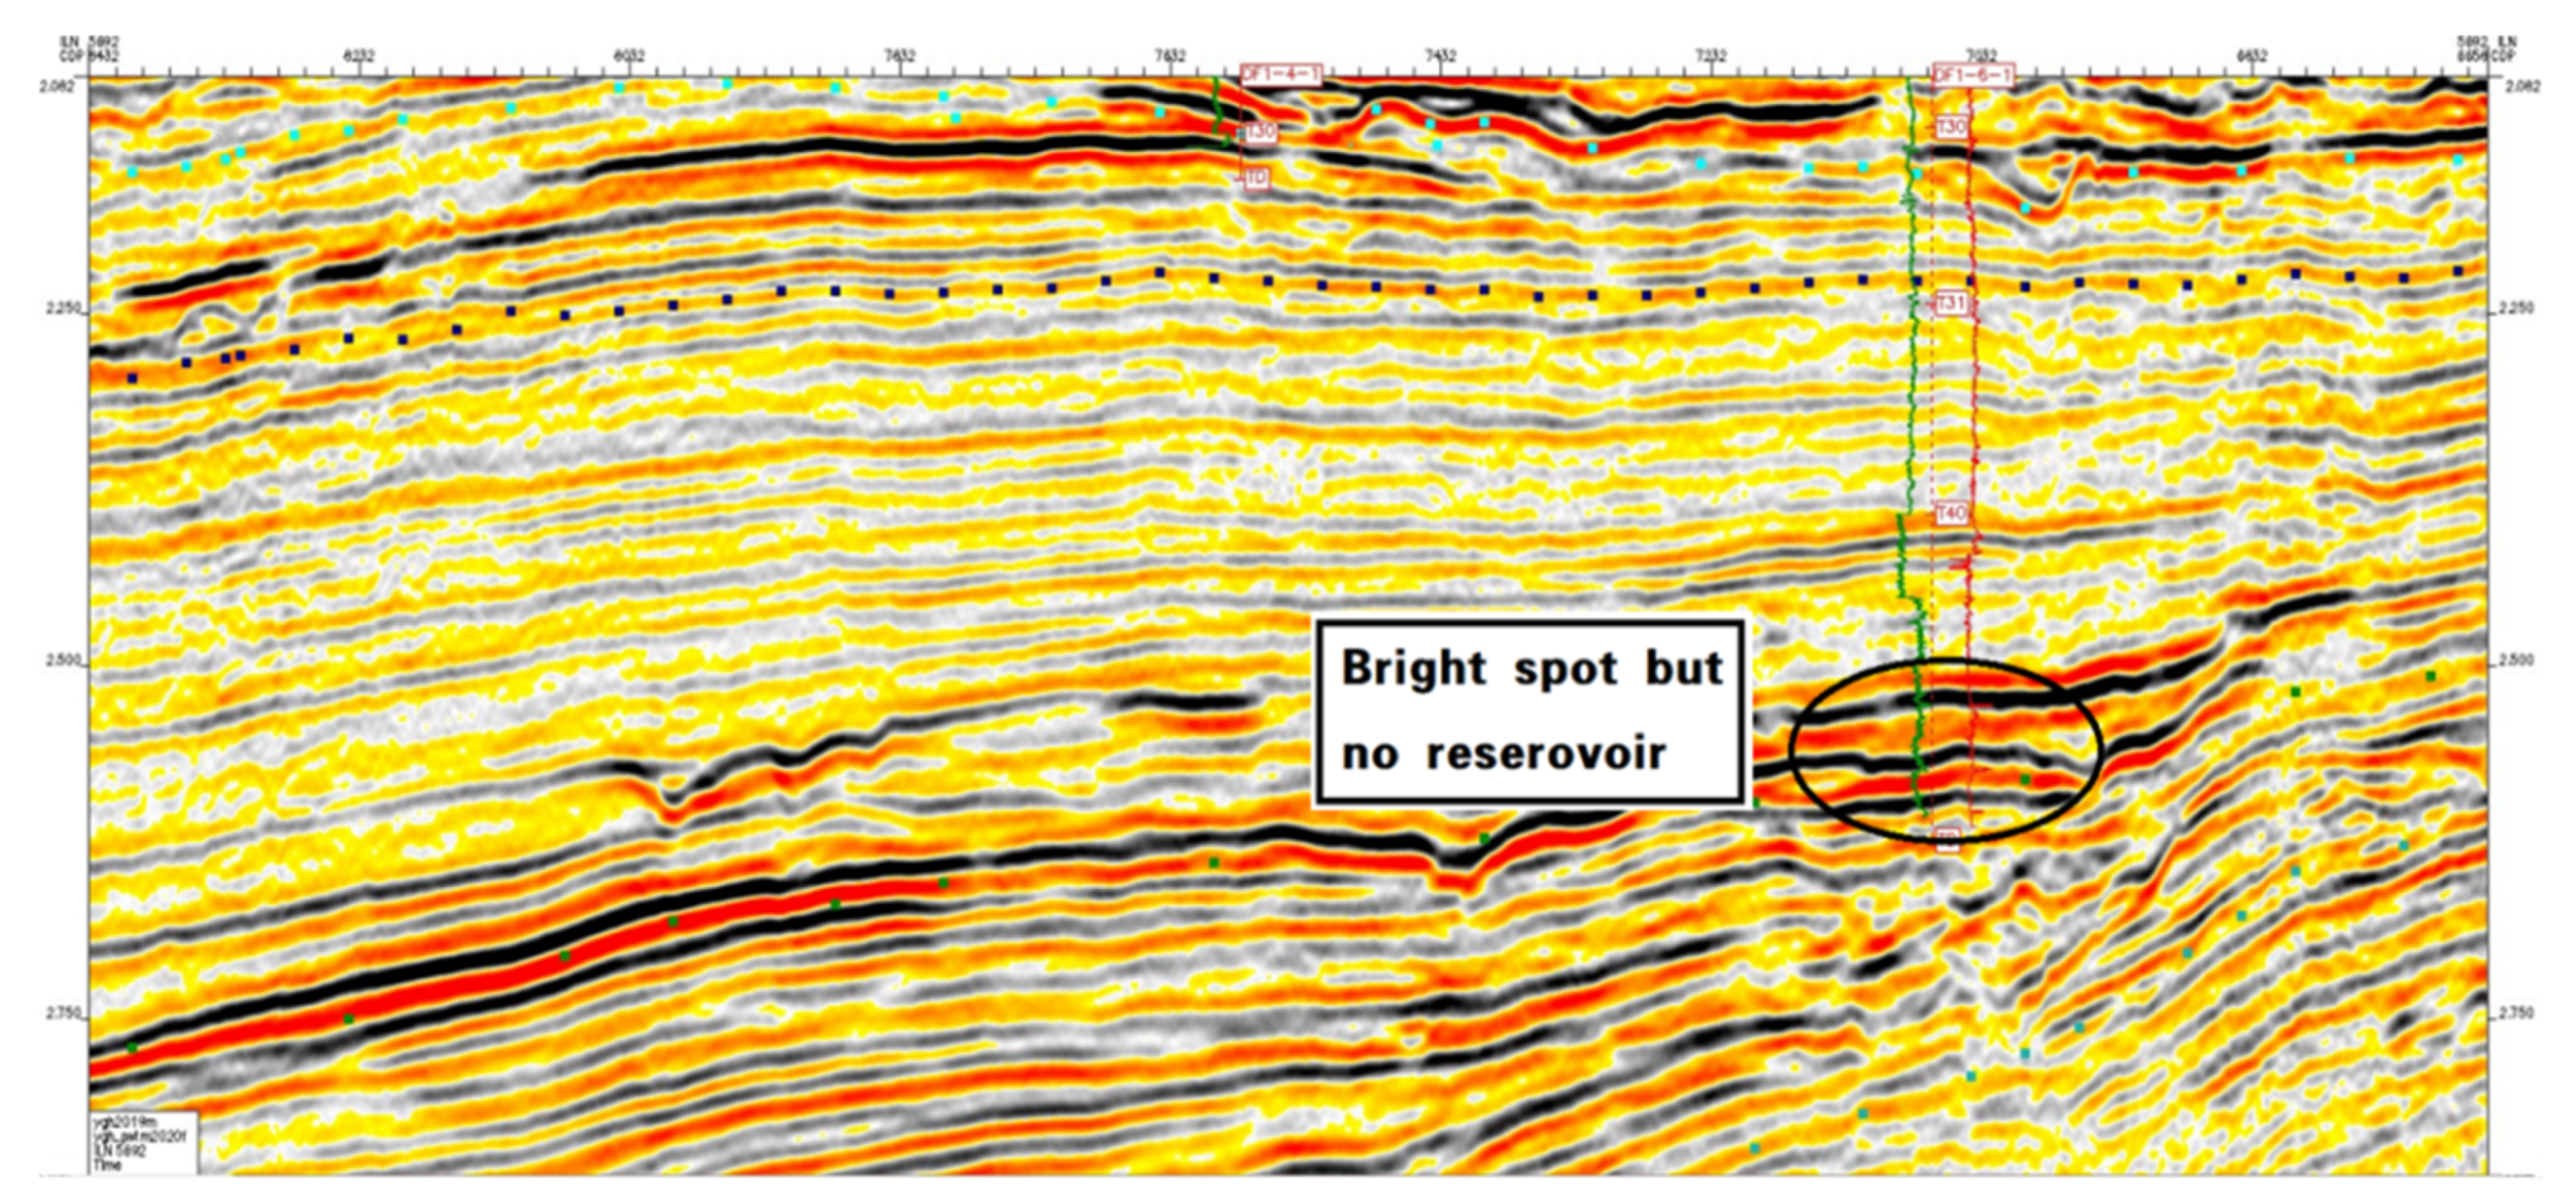
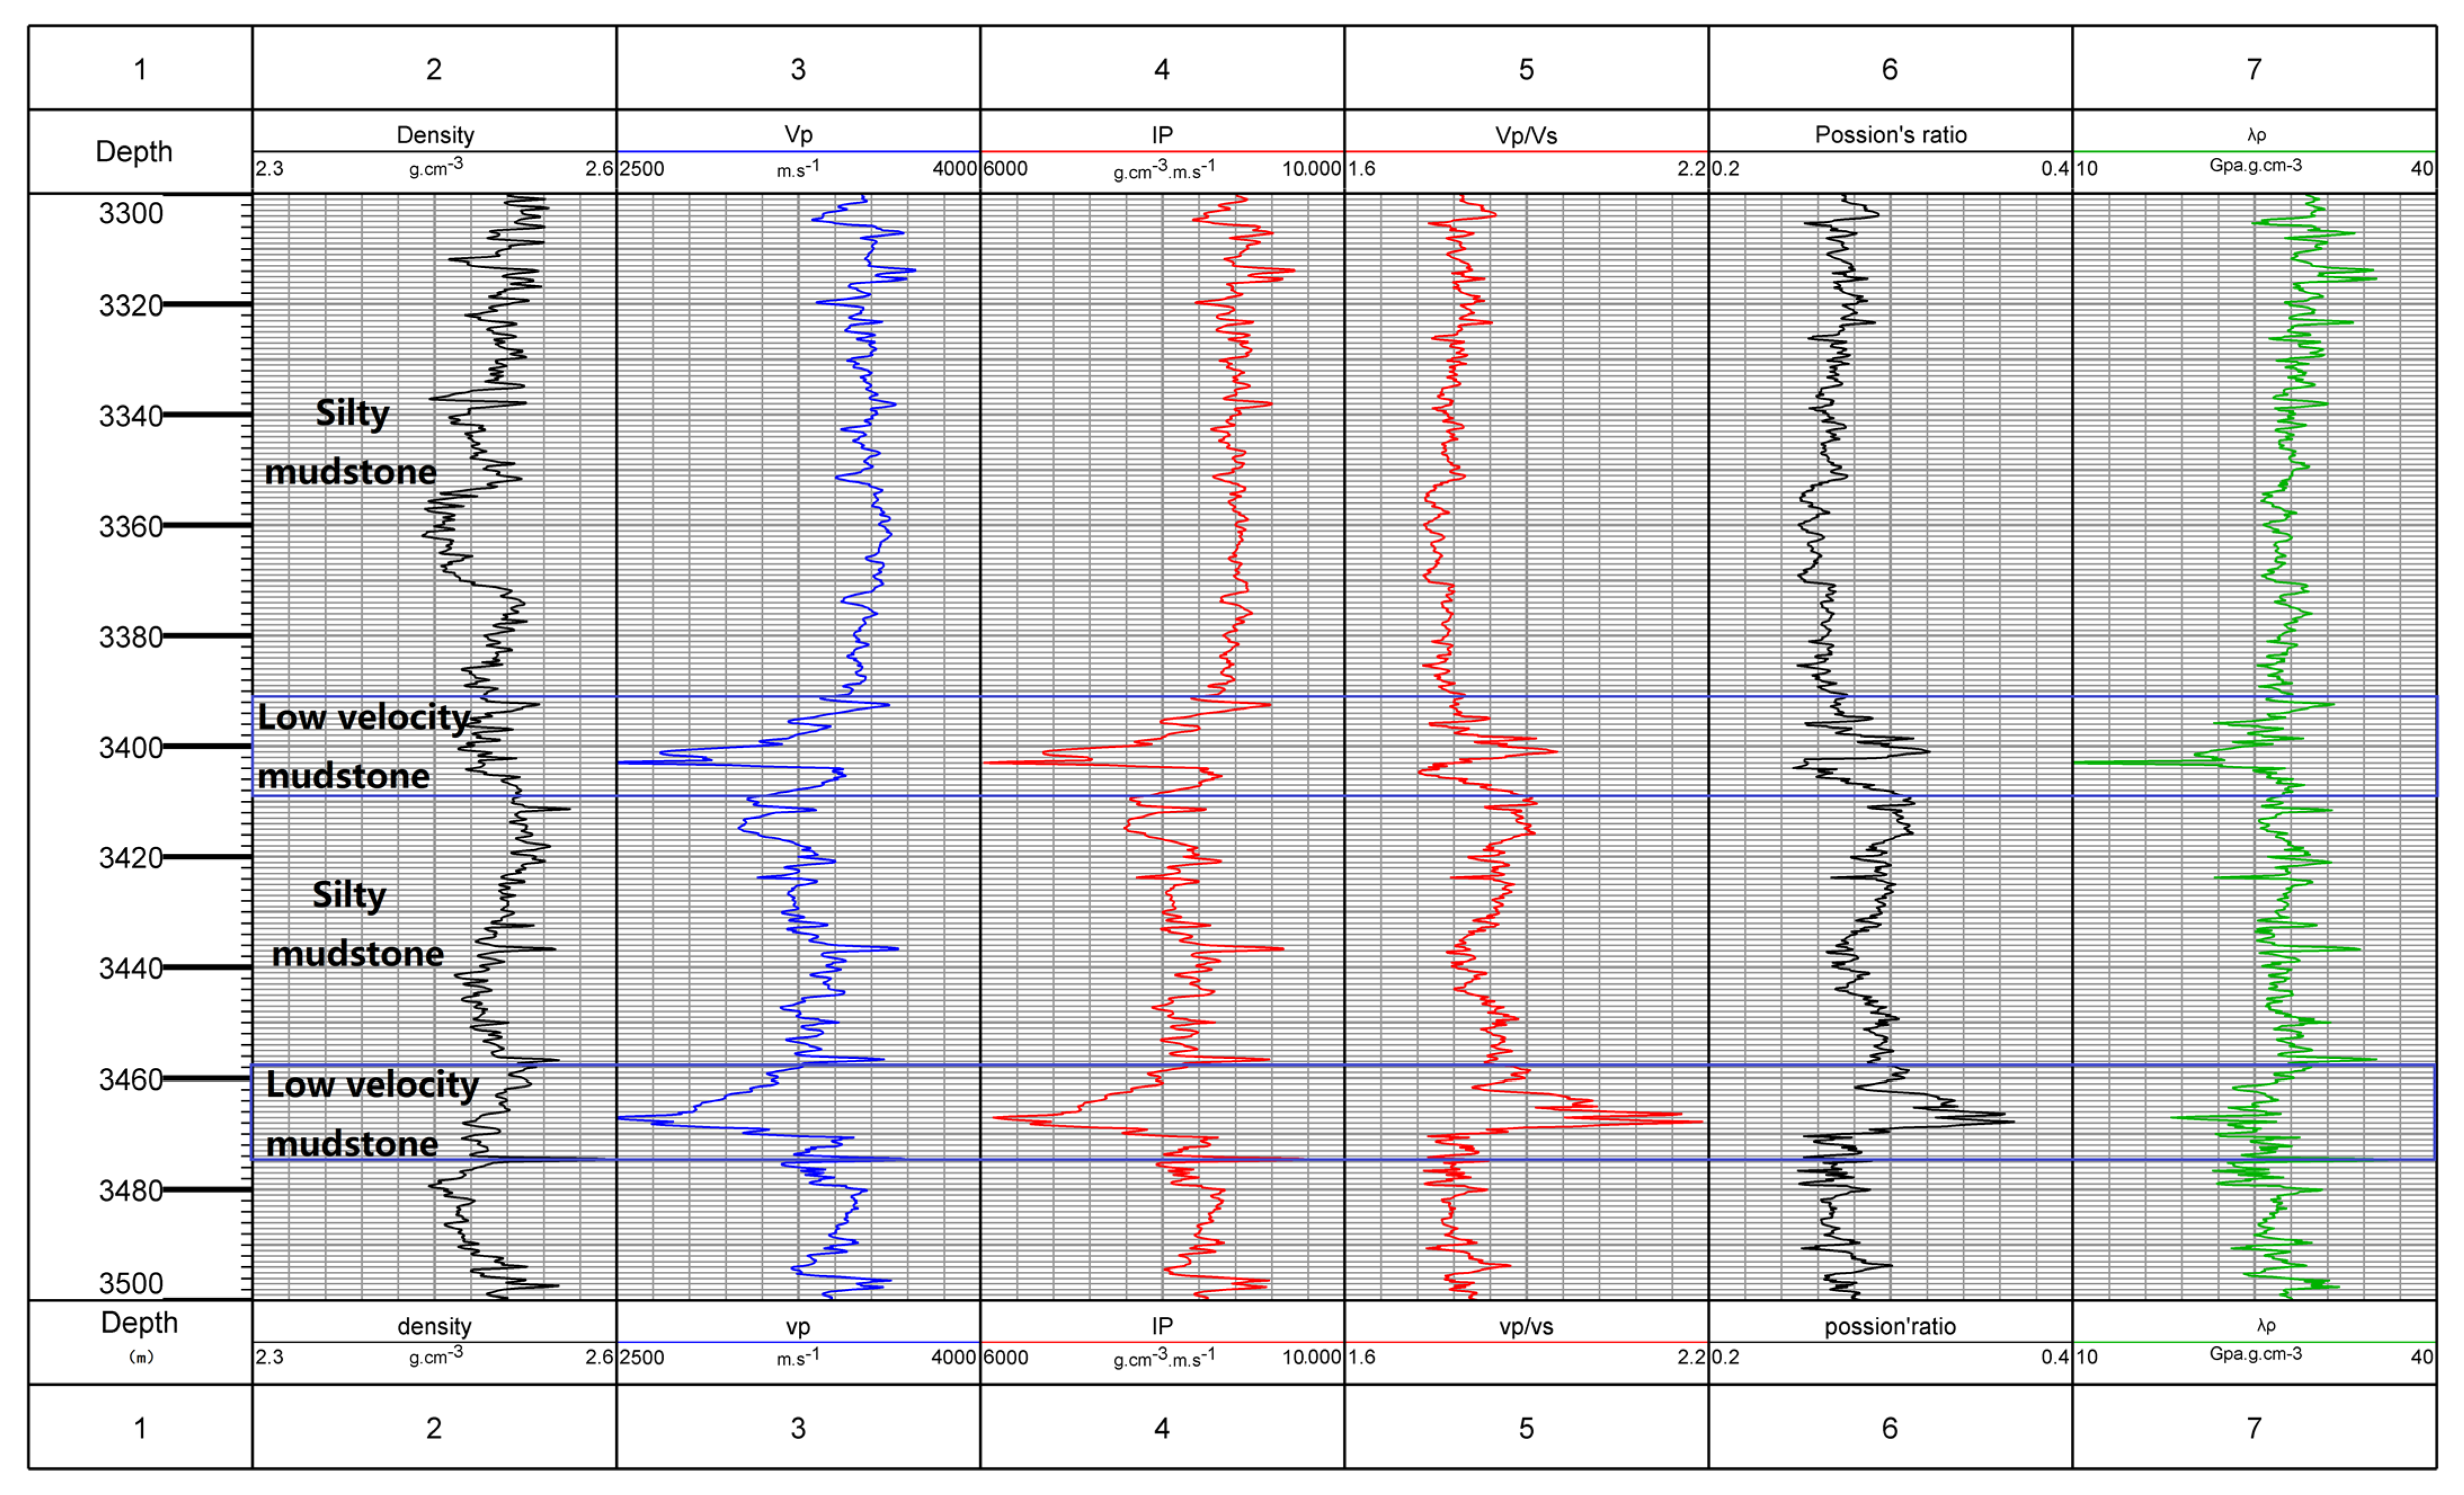
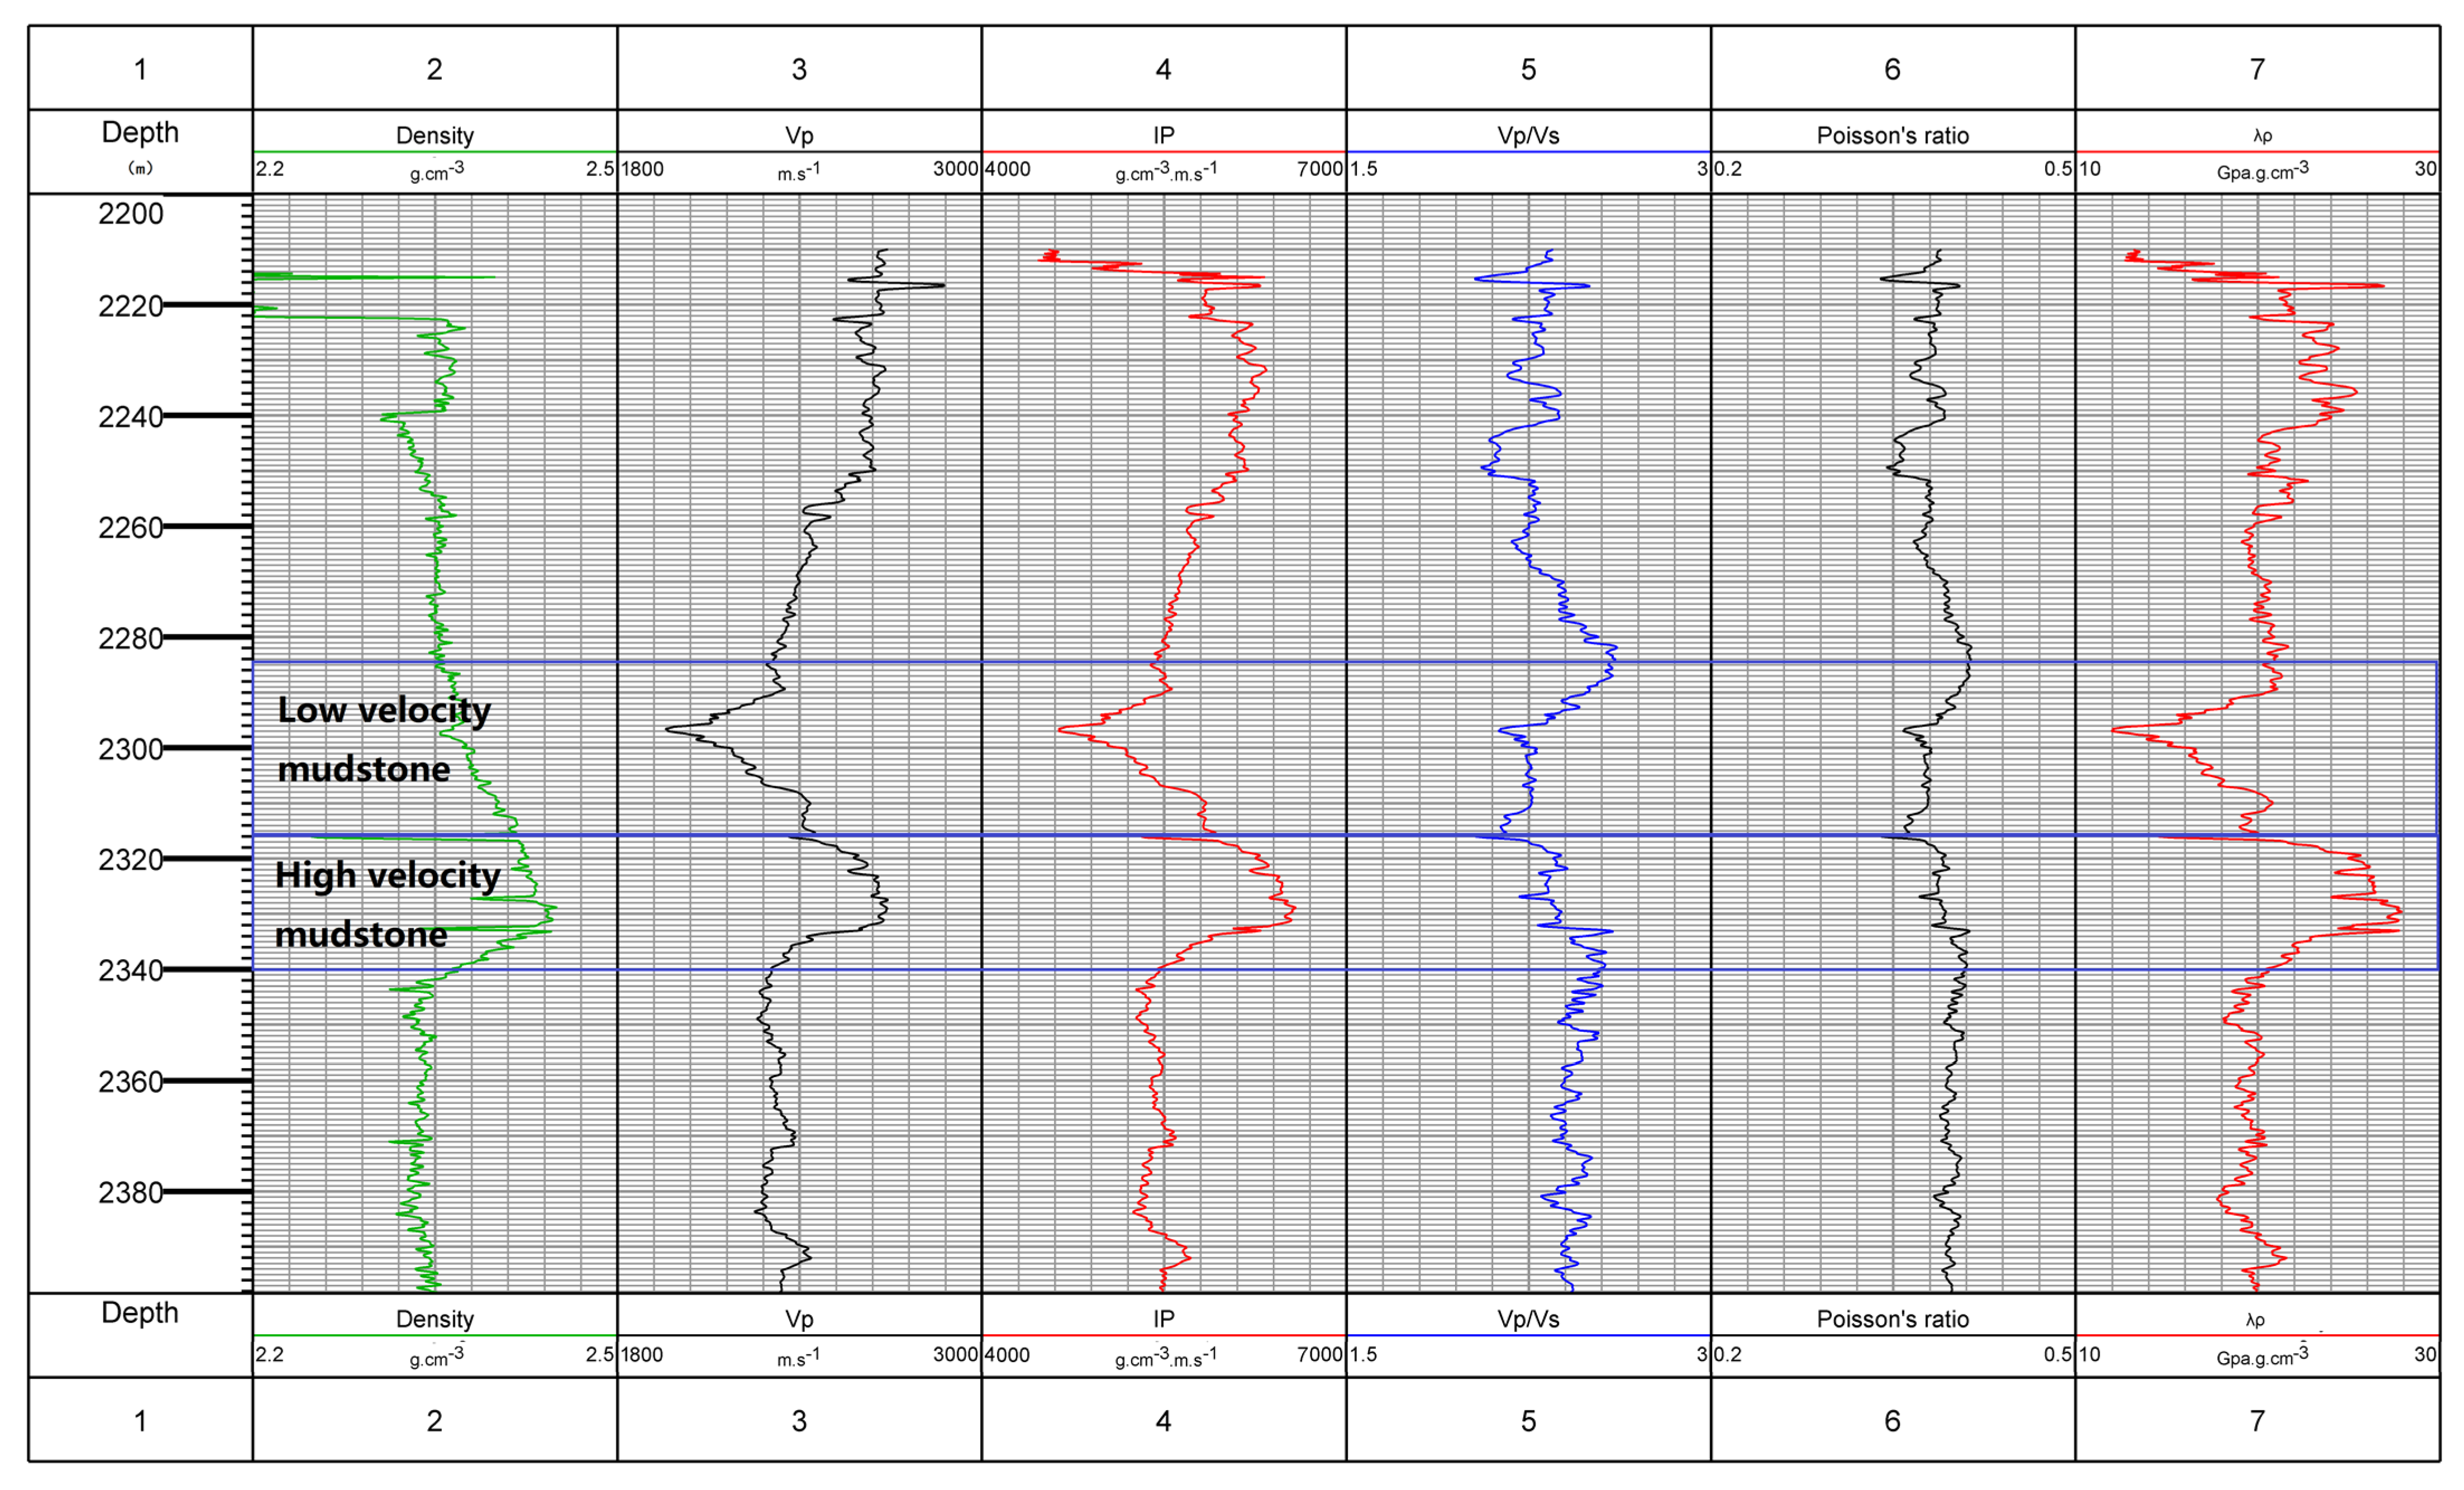
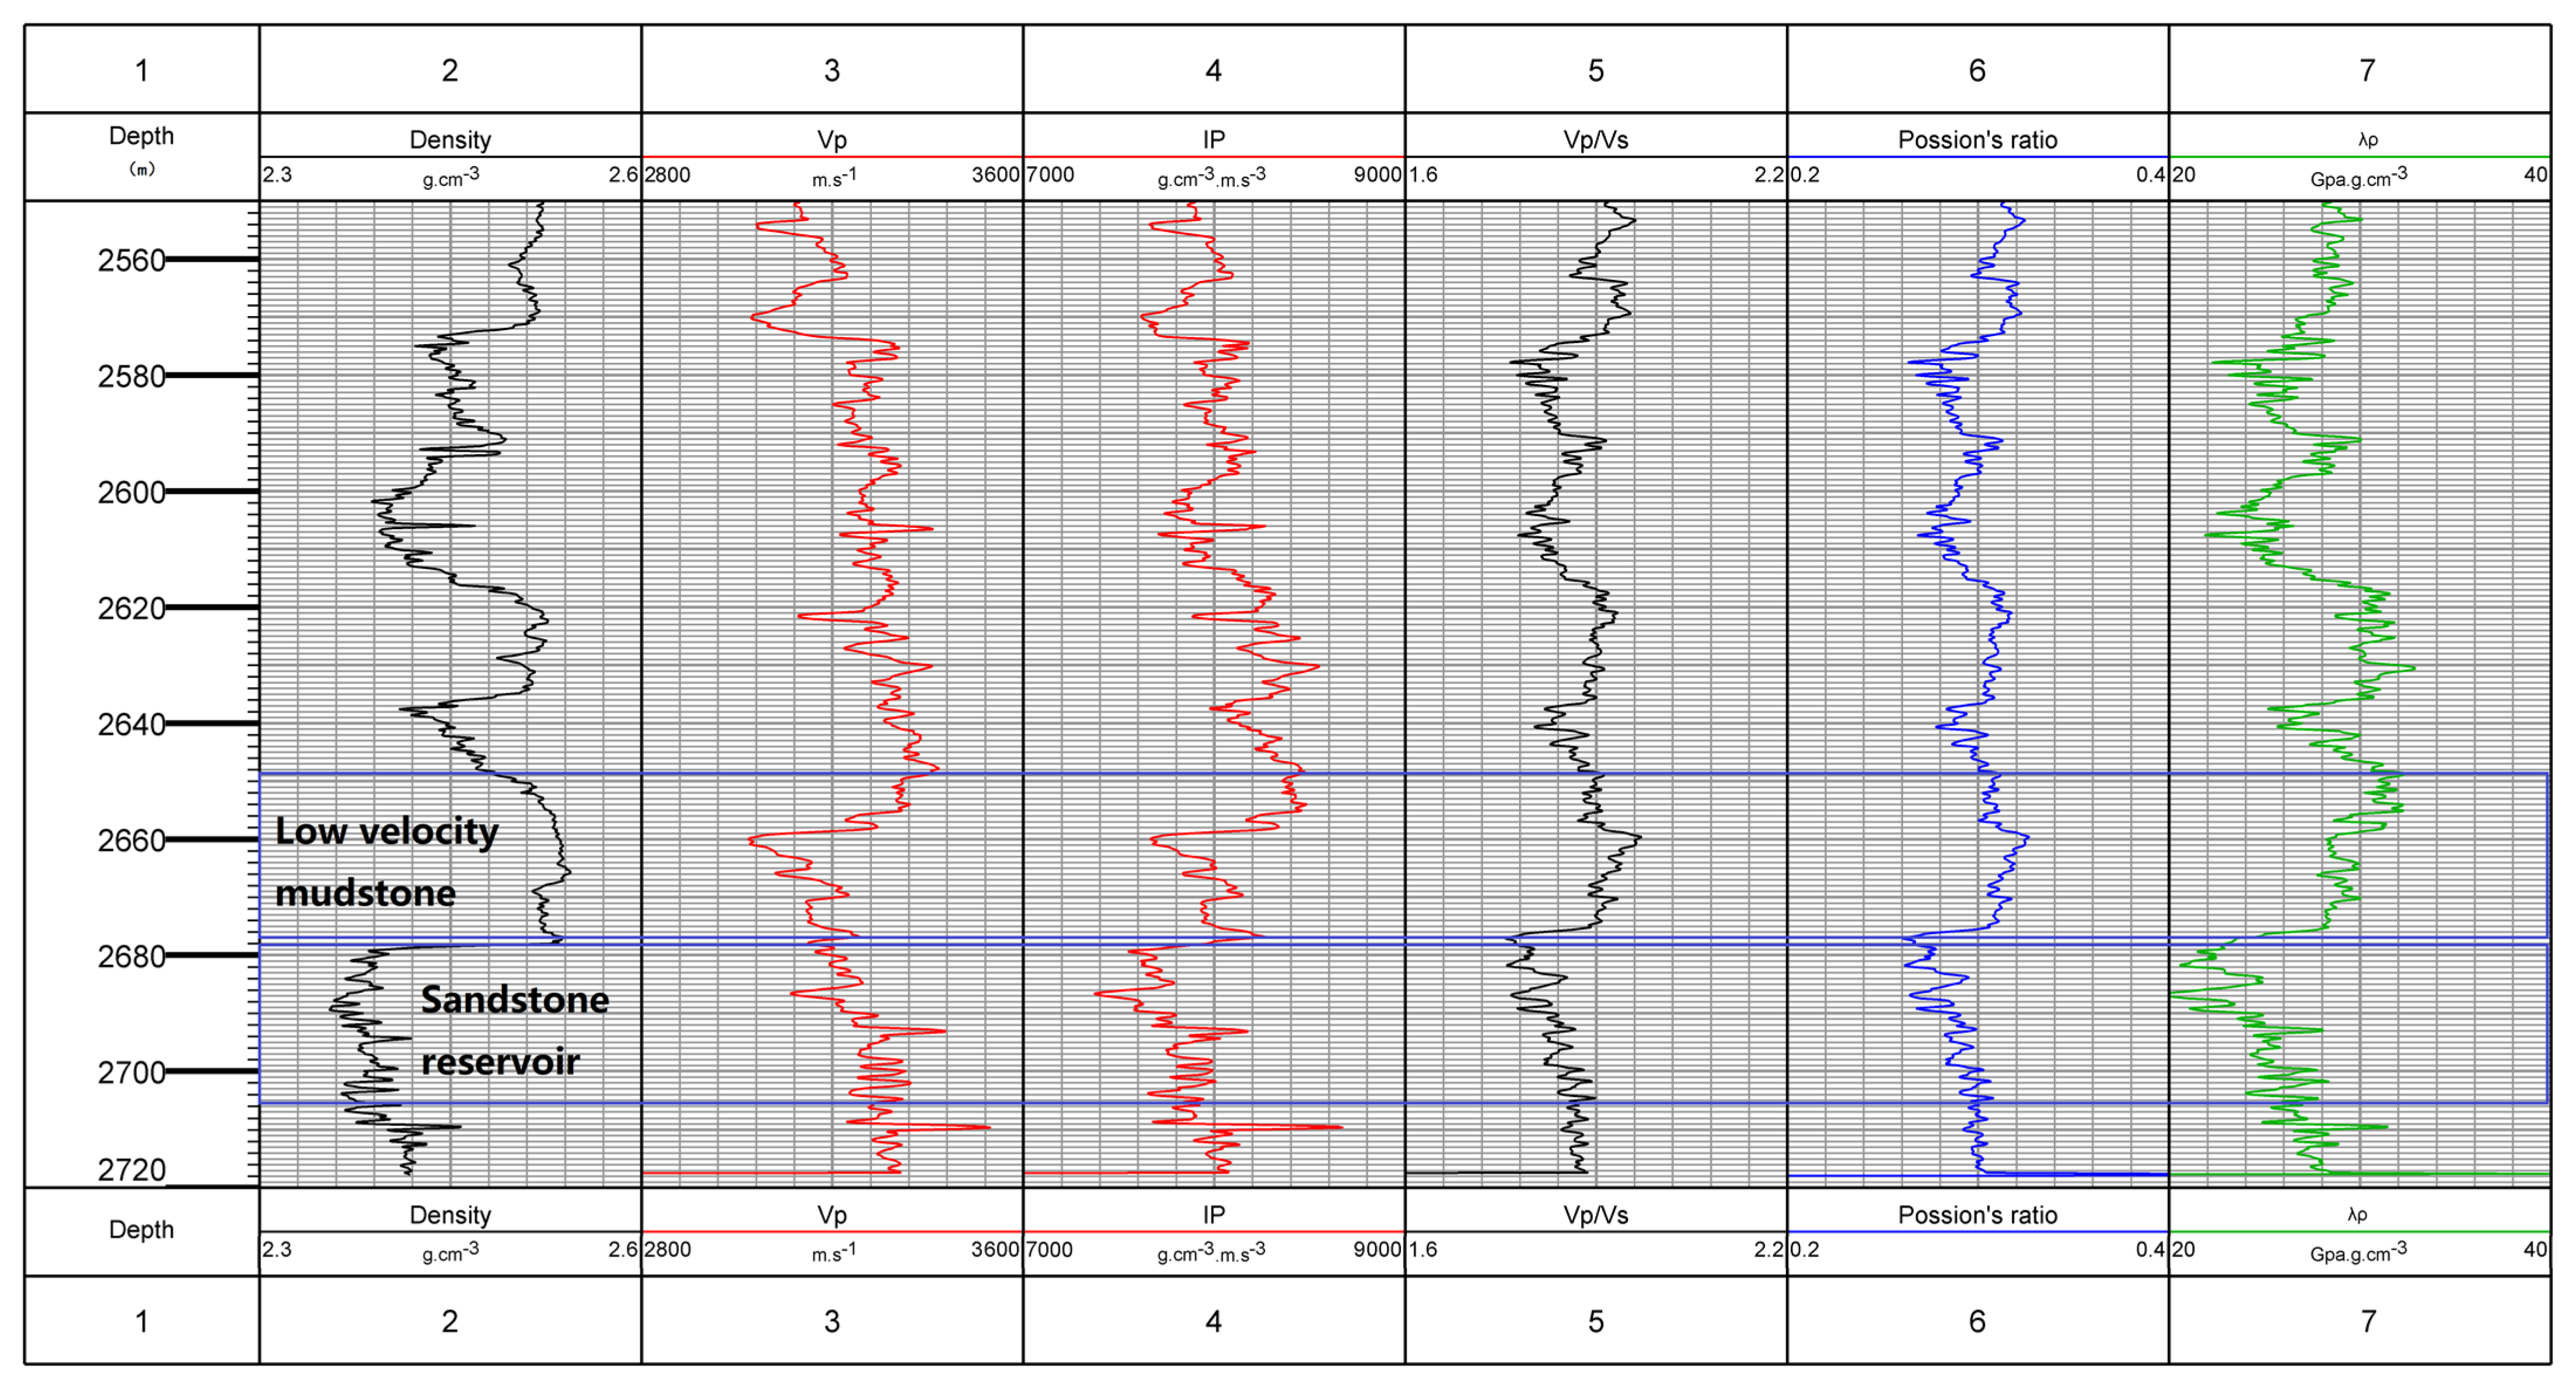
  • The false bright spot and dark spot gas reservoirs of seismic data in Yinggehai basin were related to the differences of pores, clay content, pressure, and temperature of the upper and lower formations. High porosity and clay content formation easily caused abnormal P- and S-wave velocity reduction under high-temperature and overpressure conditions and easily caused a velocity rise under high confining pressure conditions. The velocity difference caused the change of impedance to form the phenomenon of a false bright spot or dark spot gas reservoir.
  • The coefficient of PT reflected the sensitivity of pores and skeleton to pressure and temperature. According to the change of PT coefficient, a modified P-wave velocity prediction method was proposed in this paper.

Author Contributions

Conceptualization, Z.L. and Z.Z.; methodology X.D.; software, X.L.; writing-original draft preparation, Z.L., writing-review and editing, X.D. All authors have read and agreed to the published version of the manuscript.

Funding

This research was funded by sponsorship of National Nature Science Foundation Project grant number [U19B2008].

Institutional Review Board Statement

Not applicable.

Informed Consent Statement

Not applicable.

Data Availability Statement

Not applicable.

Conflicts of Interest

The authors declare no conflict of interest.

Appendix A

Appendix A.1. Voight/Reuss and the V-R-H Model

The Voigt and Reuss model [36] provides the upper and lower limit of the elastic modulus of the equivalent medium. The formulae are as follows:
K v = i = 1 N K i * V i u v = i = 1 N u i * V i K R 1 = i = 1 N K i 1 * V i V R 1 = i = 1 N u i 1 * V i
Hill [37] regarded the arithmetic average of the above two models as the equivalent elastic modulus of the medium:
K = K V + K R 2 μ = μ V + μ R 2
where K i and u i represent the bulk modulus and shear modulus of each component, V i represents the volume content of each component, K v and u v represent the upper limit of bulk modulus and shear modulus of medium, K R and V R represent the lower limit of bulk modulus and shear modulus of medium, and K and u represent the bulk modulus and shear modulus of medium.

Appendix A.2. Hashin–Shtrikman Averaging

The upper and lower limits of equivalent modulus by defining stiffer pore shape and soft pore shape are given as [38]:
K H S + = K 1 + f 2 ( K 2 K 1 ) 1 + f 1 ( K 1 + 4 3 μ 1 ) 1 μ H S + = μ 1 + f 2 ( μ 2 μ 1 ) 1 + 2 f 1 ( K 1 + 2 μ 1 ) 5 μ 1 ( K 1 + 4 3 μ 1 )
where f 1 and f 2 represent the volume content of each component, K 1 and K 2 represent bulk modulus of each component, and μ 1 and μ 2 represent shear modulus of each component. The formula determines the upper and lower limits by determining the stiffer and soft of the two components.

Appendix A.3. Different Effective Medium

The different effective medium (DEM) model assumes that the background matrix is a solid phase, continuing to add the containing phase into the background matrix until the component content reaches the theoretical value. The formula is given by Berryman [39]:
( 1 y ) d d y [ K * ( y ) ] = ( K 2 K * ) P ( * 2 ) ( y ) ( 1 y ) d d y [ μ * ( y ) ] = ( μ 2 μ * ) Q ( * 2 ) ( y )
where y represents volume content of inclusion, K * represents bulk modulus of mixture, μ * represents shear modulus of inclusion, K 2 represents bulk modulus of inclusion, μ 2 represents shear modulus of inclusion, and P ( * 2 ) and Q ( * 2 ) represent the influence factor of changing the shape of inclusion.

References

  1. Pan, G.C.; Pei, J.; Zhou, J.; Wang, L.F.; Yu, J.F. An Analysis of Flat Spot Features on a Gas-Water Interface in the Middle-Deep Overpressure zone, Yinggehai Basin. China Offshore Oil Gas 2014, 26, 5. (In Chinese) [Google Scholar]
  2. Pei, J.; Yu, J.; Wang, L.; Hao, D.F.; Liu, F. Key Challenges and Strategies for the Success of Natural Gas Exploration in Mid-Deep Strata of the Yinggehai Basin. Acta Pet. Sin. 2011, 46, 145–146. (In Chinese) [Google Scholar]
  3. Zhou, J.X.; Liu, W.W.; Ma, G.K.; Wang, L.F.; Liu, B. Fine Description and Prediction of Seismic Attributes of HPHT Gas Reservoir in the Yinggehai Basin. Nat. Gas Ind. 2013, 33, 7–11. (In Chinese) [Google Scholar]
  4. Pei, J.X.; Pan, G.C.; Zhu, P.Y.; Liu, F. Identification of Low Velocity Mudstone in the Middeep Overpressure zone, Yinggehai Basin. Oil Geophys. Prospect. 2016, 51, 10. (In Chinese) [Google Scholar]
  5. Kern, H. The Effect of High Temperature and High Confining Pressure on Compressional Wave Velocities in Quartz-Bearing and Quartz-Free Igneous and Metamorphic Rocks. Tectonophysics 1978, 44, 185–203. [Google Scholar] [CrossRef]
  6. Scheu, B.; Kern, H.; Spieler, O.; Dingwell, D. Temperature Dependence of Elastic P- and S-Wave Velocities in Porous Mt. Unzen Dacite. J. Volcanol. Geotherm. Res. 2006, 153, 136–147. [Google Scholar] [CrossRef]
  7. Sone, L.T.; Liu, Z.H.; Liu, Z.H.; Wang, Q. Elastic Anisotropy Characteristics of Tight Sands under Different Confining Pressure and Fluid Saturation States. Chin. J. Geophys. 2015, 58, 3401–3411. [Google Scholar]
  8. Motra, H.B.; Zertani, S. Influence of Loading and Heating Processes on Elastic and Geomechanical Properties of Eclogites and Granulites. J. Rock Mech. Geotechnol. Eng. 2018, 10, 127–137. [Google Scholar] [CrossRef]
  9. Kern, H. P- and S-Wave Anisotropy and Shear-Wave Splitting at Pressure and Temperature in Possible Mantle Rocks and Their Relation to the Rock Fabric. Phys. Earth Planet. Inter. 1993, 78, 245–256. [Google Scholar] [CrossRef]
  10. Eberhart-Phillips, D.; Han, D.-H.; Zoback, M.D. Empirical Relationships among Seismic Velocity, Effective Pressure, Porosity, and Clay Content in Sandstone. Geophysics 1989, 54, 82–89. [Google Scholar] [CrossRef]
  11. Khaksar; Griffiths; McCann. Compressional- and Shear-Wave Velocities as a Function of Confining Stress in Dry Sandstones. Geophys. Prospect. 1999, 47, 487–508. [Google Scholar] [CrossRef]
  12. Mavko, G.; Mukerji, T.; Dvorkin, J. The Rock Physics Handbook: Tools for Seismic Analysis of Porous Media; Cambridge University Press: Cambridge, UK, 2009. [Google Scholar]
  13. Liu, Z.; Zhang, F.; Li, X. Elastic Anisotropy and Its Influencing Factors in Organic-Rich Marine Shale of Southern China. Sci. China Earth Sci. 2019, 62, 1805–1818. [Google Scholar] [CrossRef]
  14. Deng, J.X.; Wang, H.; Zhou, H.; Liu, Z.H.; Song, L.T.; Wang, X.B. Microtexture, Seismic Rock Physical Properties and Modeling of Longmaxi Formation Shale. Chin. J. Geophys. 2015, 58, 2123–2136. [Google Scholar]
  15. Han, D.; Nur, A.; Morgan, D. Effects of Porosity and Clay Content on Wave Velocities in Sandstones. Geophysics 1986, 51, 2093–2107. [Google Scholar] [CrossRef]
  16. Salih, M.; Reijmer, J.; El Husseiny, A.; Bashri, M.; Eltom, H.; Mukainah, H.; Kaminski, M. Controlling Factors on Petrophysical and Acoustic Properties of Bioturbated Carbonates: (Upper Jurassic, Central Saudi Arabia). Appl. Sci. 2021, 11, 5019. [Google Scholar] [CrossRef]
  17. Jaballah, J.; Reijmer, J.; El-Husseiny, A.; Le, J.; Hairabian, A.; Slootman, A. Physical Properties of Cretaceous to Eocene Platform-to-Basin Carbonates from Albania. Mar. Pet. Geol. 2021, 128, 105022. [Google Scholar]
  18. Dvorkin, J.; Alabbad, A. Velocity–porosity–mineralogy Trends in Chalk and Consolidated Carbonate Rocks. Geophys. J. Int. 2019, 219, 662–671. [Google Scholar]
  19. Dvorkin, J.; Walls, J.; Davalos, G. Velocity-Porosity-Mineralogy Model for Unconventional Shale and Its Applications to Digital Rock Physics. Front. Earth Sci. 2021, 8, 613716. [Google Scholar] [CrossRef]
  20. Reijmer, J.J.G.; Blok, C.N.; El-Husseiny, A.; Kleipool, L.M.; Hogendorp, Y.C.K.; Alonso-Zarza, A.M. Petrophysics and Sediment Variability in a Mixed Alluvial to Lacustrine Carbonate System (Miocene, Madrid Basin, Central Spain). Depos. Rec. 2021, 8, 317–339. [Google Scholar] [CrossRef]
  21. Assefa, S.; McCann, C.; Sothcott, J.; Astin, T.; Johnstad, S. The Effects of Porosity—Pore-Fluid and Mineralogy on VpNs in Carbonate Rocks. In Proceedings of the 61st EAGE Conference and Exhibition, Helsinki, Finland, 7–11 June 1999. [Google Scholar] [CrossRef]
  22. El-Husseiny, A.; Vega, S.; Nizamuddin, S. The Effect of Pore Structure Complexity and Saturation History on the Variations of Acoustic Velocity as Function of Brine and Oil Saturation in Carbonates. J. Pet. Sci. Eng. 2019, 179, 180–191. [Google Scholar] [CrossRef]
  23. Grana, D. Pressure–velocity Relations in Reservoir Rocks: Modified Macbeth’s Equation. J. Appl. Geophys. 2016, 132, 234–241. [Google Scholar]
  24. Neto, I.A.L.; Misságia, R.M.; Ceia, M.; Archilha, N.L.; Oliveira, L.C. Carbonate Pore System Evaluation Using the velocity–porosity–pressure Relationship, Digital Image Analysis, and Differential Effective Medium Theory. J. Appl. Geophys. 2014, 110, 23–33. [Google Scholar] [CrossRef]
  25. Wu, Z.; Wang, W. First-Principles Calculations of Elasticity of Minerals at High Temperature and Pressure. Sci. China Earth Sci. 2016, 59, 1107–1137. [Google Scholar] [CrossRef]
  26. Zhang, Y.L.; Sun, Q.; Li, J.X.; Zhang, W.Q. Pore and Mechanical Characteristics of High-Temperature Bakeed Clay. Chin. J. Rock Mech. Eng. 2015, 34, 1480–1488. (In Chinese) [Google Scholar]
  27. Mao, H.; Qiu, Z.S.; Huang, W.A.; Shen, Z.H.; Yang, L.Y.; Zhong, H.Y. The Effects of Temperature and Pressure on the Hydration Swelling Characteristics of Clay Mineral. Pet. Drill. Technol. 2013, 41, 56–61. (In Chinese) [Google Scholar]
  28. Bandyopadhyay, K. Seismic Anisotropy-Geological Causes and Its Implications to Reservoir Geophysics. Ph.D. Thesis, Stanford University, Stanford, CA, USA, 2009. [Google Scholar]
  29. Cheng, W.; Ba, J.; Fu, L.-Y.; Lebedev, M. Wave-Velocity Dispersion and Rock Microstructure. J. Pet. Sci. Eng. 2019, 183, 106466. [Google Scholar] [CrossRef]
  30. Ba, J.; Xu, W.; Fu, L.-Y.; Carcione, J.M.; Zhang, L. Rock Anelasticity Due to Patchy Saturation and Fabric Heterogeneity: A Double Double-Porosity Model of Wave Propagation. J. Geophys. Res. Solid Earth 2017, 122, 1949–1976. [Google Scholar] [CrossRef]
  31. Zhang, L.; Ba, J.; Carcione, J.M. Wave Propagation in Infinituple-Porosity Media. J. Geophys. Res. Solid Earth 2021, 126, 2020021266. [Google Scholar] [CrossRef]
  32. Salih, M.; Reijmer, J.J.; El-Husseiny, A. Diagenetic Controls on the Elastic Velocity of the Early Triassic Upper Khartam Member (Khuff Formation, Central Saudi Arabia). Mar. Pet. Geol. 2020, 124, 104823. [Google Scholar] [CrossRef]
  33. Francois, F.; Matthieu, P.; Quentin, V.; Thomas, T.; Fei, H.; Emmanuelle, P.; Jean, B.; Philippe, L.; Hairabian, A. The Equivalent Pore Aspect Ratio as a Tool for Pore Type Prediction in Carbonate Reservoirs. AAPG Bull. 2018, 102, 1343–1377. [Google Scholar]
  34. Jafarian, E.; Kleipool, L.; Scheibner, C.; Blomeier, D.; Reijmer, J. Variations in Petrophysical Properties of Upper Palaeozoic Mixed Carbonate and Non-Carbonate Deposits, Spitsbergen, Svalbard Archipelago. J. Pet. Geol. 2016, 40, 59–83. [Google Scholar] [CrossRef] [Green Version]
  35. Qian, K.; Zhang, F.; Chen, S.; Li, X.; Zhang, H. A Rock Physics Model for Analysis of Anisotropic Parameters in a Shale Reservoir in Southwest China. J. Geophys. Eng. 2016, 13, 19–34. [Google Scholar] [CrossRef]
  36. Reuss, A. Berechung der Fliessgrenzen von Mischkristallen auf Grund der Plastizitatsbedingung fur Einkristalle. Z. Angew. Math. Phys. 1929, 9, 49–58. [Google Scholar]
  37. Hill, R. The Elastic Behavior of Crystalline Aggregate. Proc. Phys. Soc. 1952, 65, 349–354. [Google Scholar]
  38. Hashin, Z.; Strikman, S. A Variation Approach to the Theory of Effective Magnetic Permeability of Multiphase Materials. J. Appl. Phys. 1962, 33, 3125–3131. [Google Scholar]
  39. Berryman, J.G. Single-scattering Approximations for Coefficients in Biot’s Equations of Poroelasticity. J. Acoust. Soc. Am. 1992, 91, 551–571. [Google Scholar] [CrossRef]
Figure 1. Seismic profile through the DF1-X6 well.
Energies 15 02615 g001
Figure 2. (a) AutoLab system and (b) scheme of preparation and P- and S-wave velocity measurements in samples [14].
Energies 15 02615 g002
Figure 3. Porosity versus (a) P- and (b) S-wave velocity.
Energies 15 02615 g003
Figure 4. Effects of stiffer and soft materials on the elastic properties of samples, cross-plot of (a) bulk modulus and stiffer minerals, (b) shear modulus and stiffer minerals, (c) bulk modulus and soft materials, and (d) shear modulus and soft materials. The solid lines in the figure are the boundary of simulation (the black line is the Voight boundary, the red line is the Reuss boundary, the blue line is the upper limit of Hashin–Shtrikman model, and the pink line is the lower limit of Hashin–Shtrikman).
Energies 15 02615 g004aEnergies 15 02615 g004b
Figure 5. Cross-plot of porosity and confining pressure (different color dots represent different samples).
Energies 15 02615 g005
Figure 6. Relationship between P- and S-wave velocity and confining pressure, (a,b) are the relationship between wave velocity and pressure under dry conditions, and (c,d) are the relationship between wave velocity and pressure under saturated conditions.
Energies 15 02615 g006aEnergies 15 02615 g006b
Figure 7. The thin section images of (a) Sample 1 and (b) Sample 2.
Energies 15 02615 g007
Figure 8. Cross-plot of temperature and P- and S-wave velocity.
Energies 15 02615 g008
Figure 9. Relationship between P- and S-wave velocity and confining pressure, (a,b) are the relationship between wave velocity and pressure under dry conditions, and (c,d) are the relationship between wave velocity and pressure under completely saturated conditions.
Energies 15 02615 g009
Figure 10. Cross-plot of temperature and (a) P- and (b) S-wave velocity.
Energies 15 02615 g010
Figure 11. Cross-plot of pore pressure and (a) P- and (b) S-wave velocity.
Energies 15 02615 g011
Figure 12. Cross-plot of pore pressure and (a) P- and (b) S-wave velocity.
Energies 15 02615 g012
Figure 13. Logging curve of well DF1-X6.
Energies 15 02615 g013
Figure 14. Logging curve of well LD23-X1.
Energies 15 02615 g014
Figure 15. Logging curve of well DF1-X12.
Energies 15 02615 g015
Figure 16. P-wave velocity prediction of the three wells (blue dots are the prediction data).
Energies 15 02615 g016
Table 1. Elastic parameters and density of common minerals [12].
Mineral TypeBulk Modulus
(GPa)
Shear Modulus (GPa)Vp
(km/s)
Vs
(km/s)
Density
(g/cc)
Clay (kaolinite)1.51.41.440.931.58
Feldspar37.5154.682.392.62
Quartz37446.054.092.65
Table 2. Mineral content and porosity of the four samples.
NumberQuartz (%)Potash Feldspar
(%)
Plagioclase (%)Calcite
(%)
Dolomite
(%)
Clay
(%)
Porosity
(%)
164.788.689.7910.970.665.1224.1
260.3910.6214.349.916.8411.912.21
340.077.5115.837.223.5225.8516.15
437.3113.6228.865.923.6810.6116.43
Table 3. Fitting coefficients of four samples.
Sample Number1234
A (Effective pressure coefficient)445.79215.30266.85210.19
B (Temperature coefficient)−0.89−0.36−0.46−0.27
Publisher’s Note: MDPI stays neutral with regard to jurisdictional claims in published maps and institutional affiliations.

