
A Study on Available Power Estimation Algorithm and Its Validation


Abstract
:1. Introduction
2. Wind Turbine Model for Validation
2.1. Available Power Estimation Using Nacelle Anemometer (Method 1)
2.2. Available Power Estimation Using Drive-Train Model (Method 2)
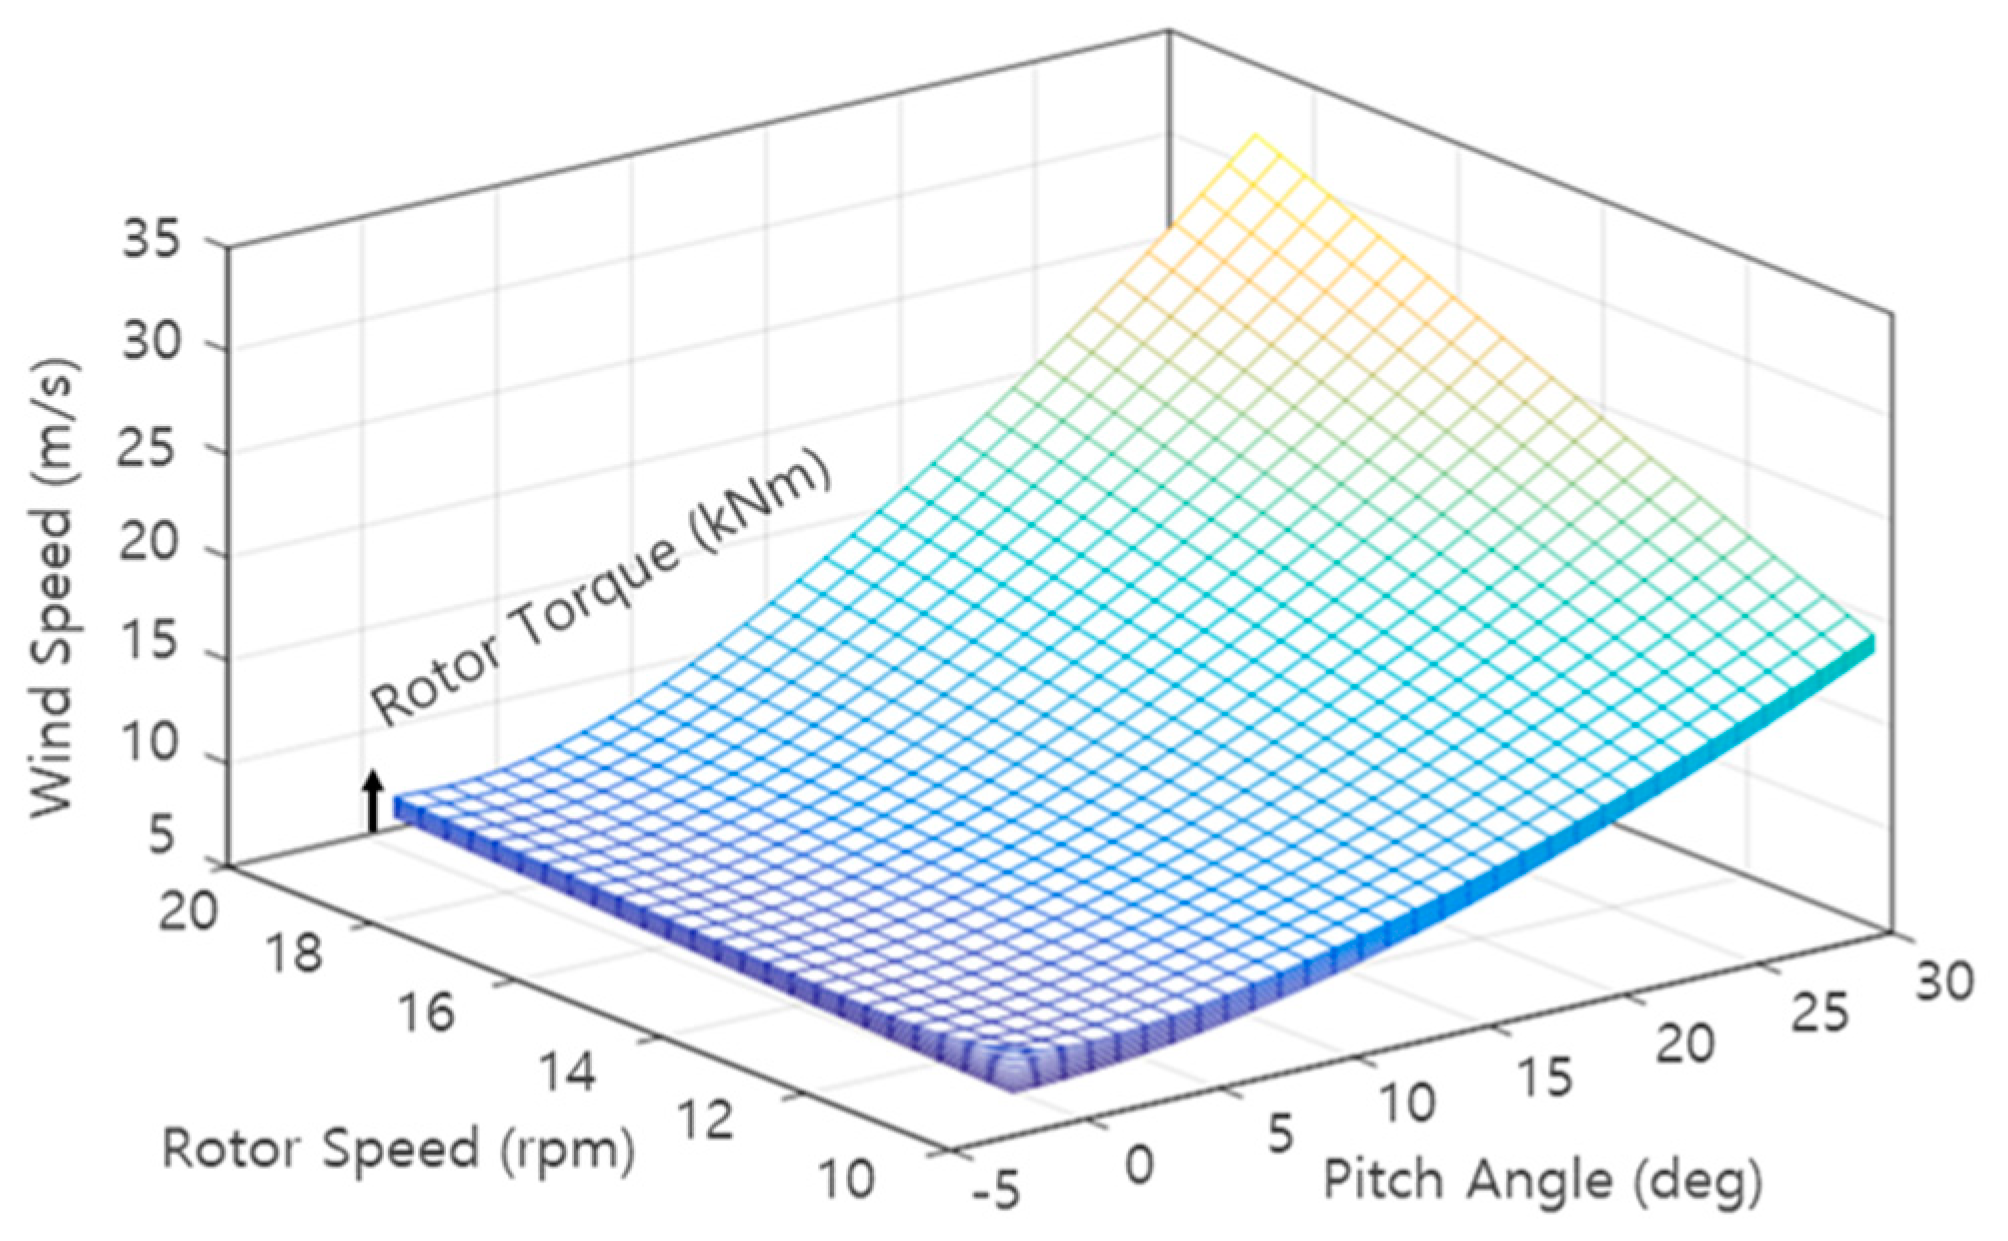
2.3. Available Power Estimation without Using Drive-Train Model (Method 3)
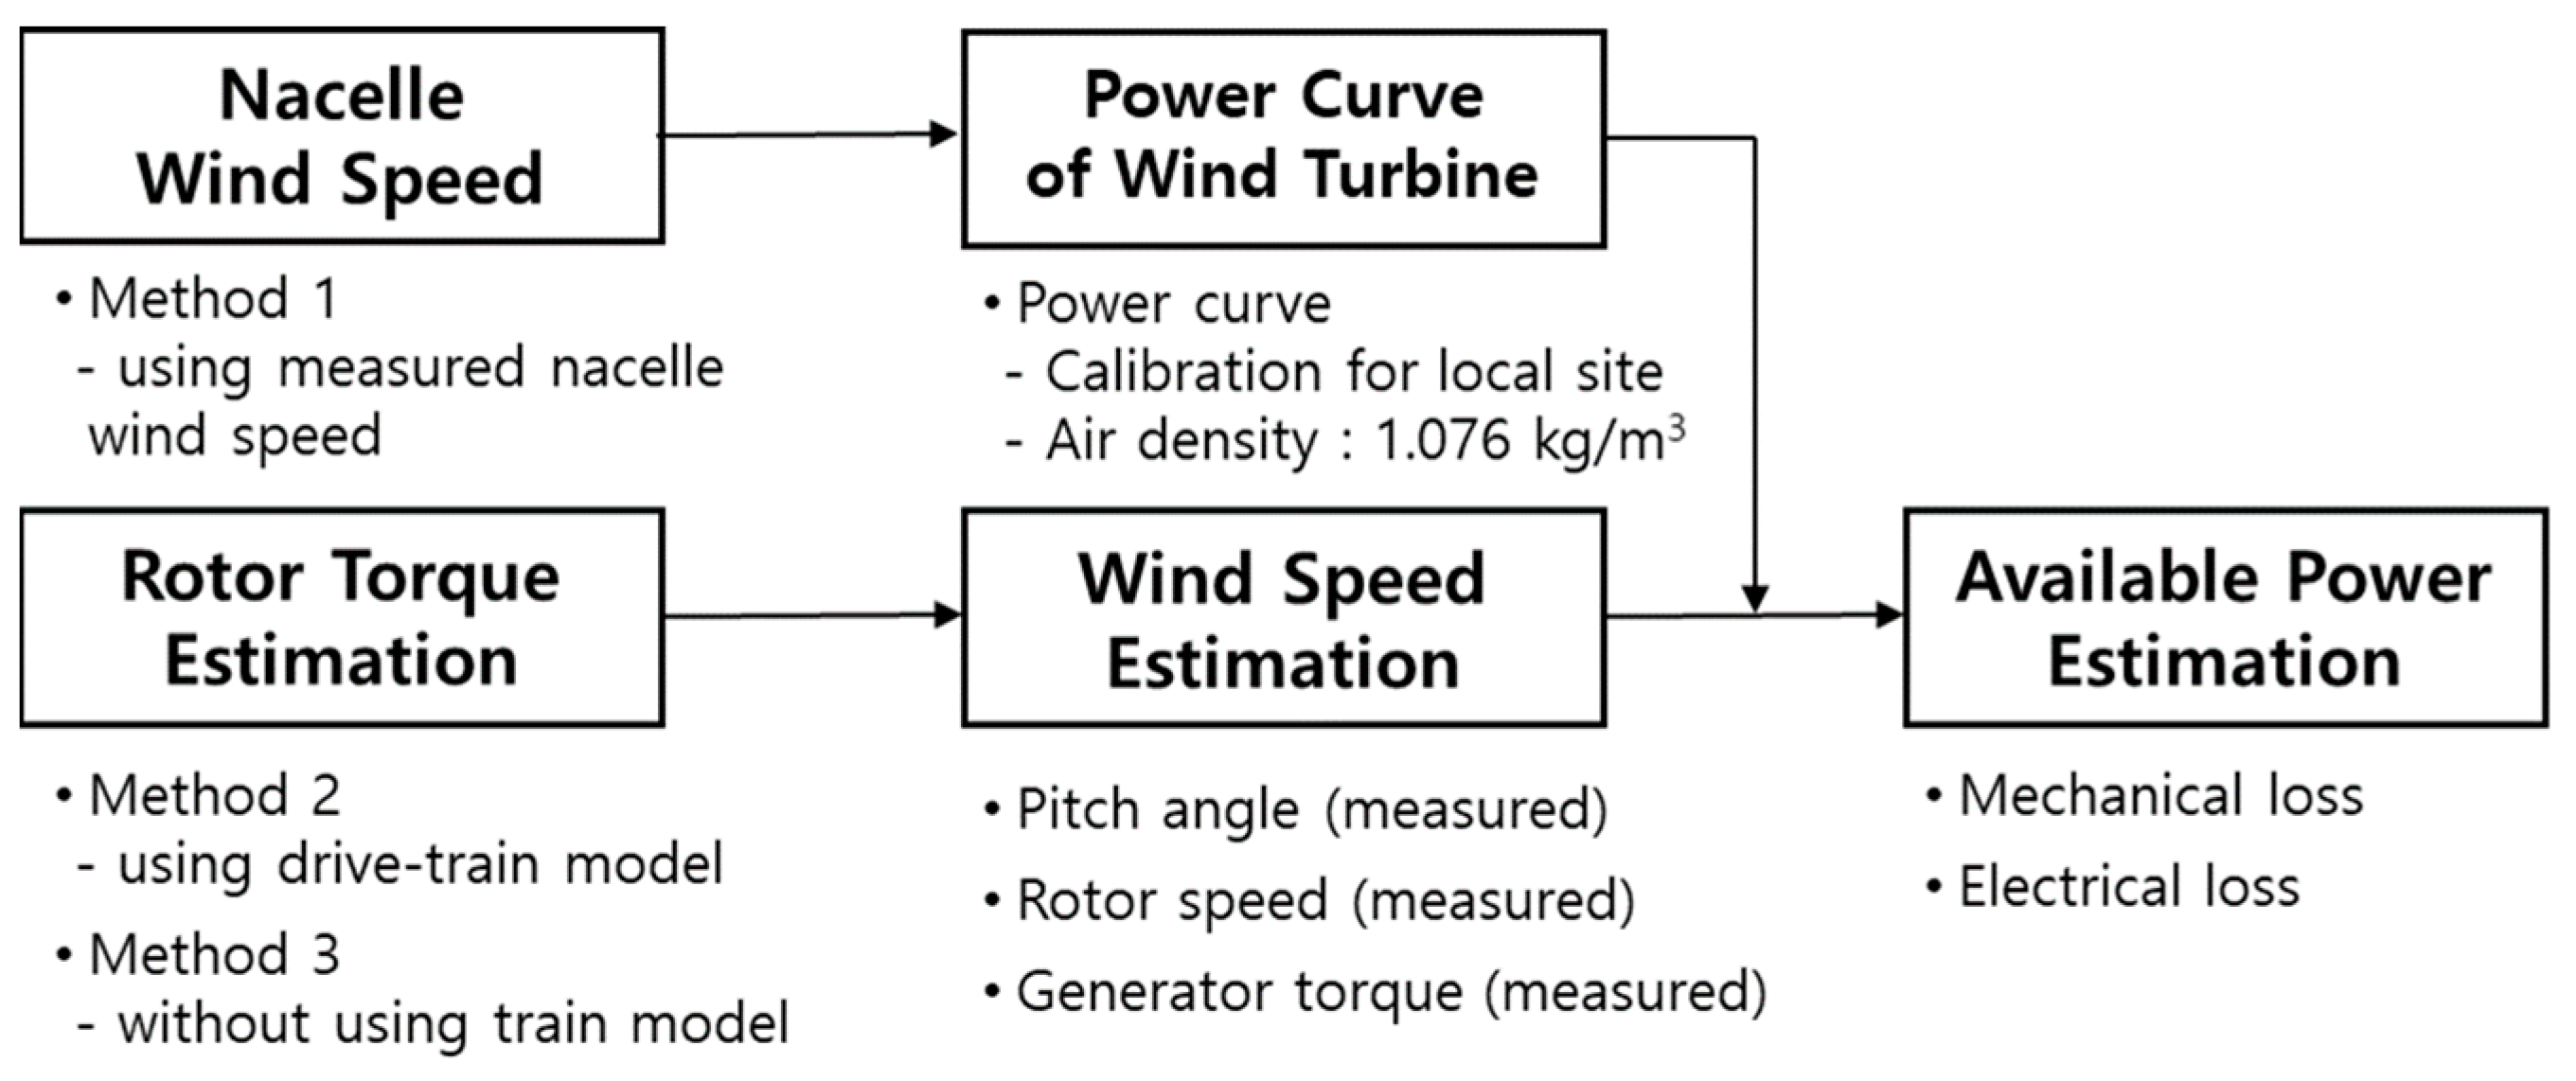
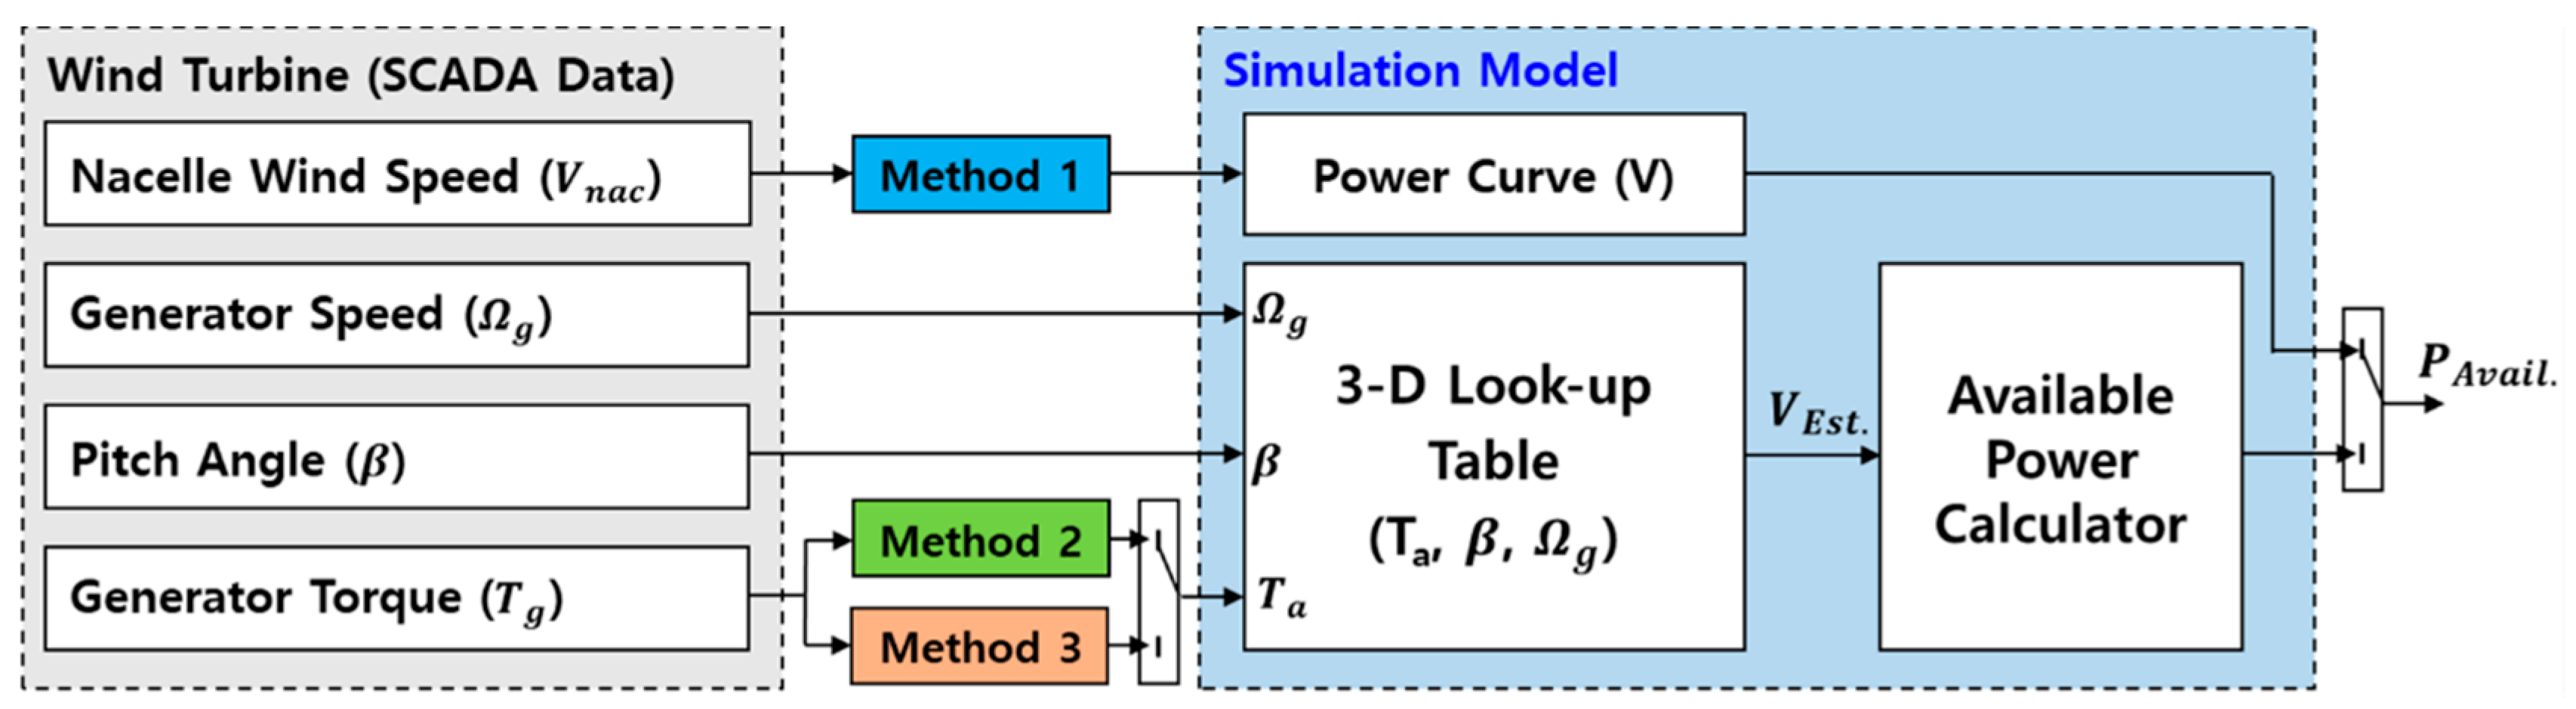
2.4. Summary of Algorithms and the Target Wind Turbine
3. Comparison of SCADA Data with Simulation Results
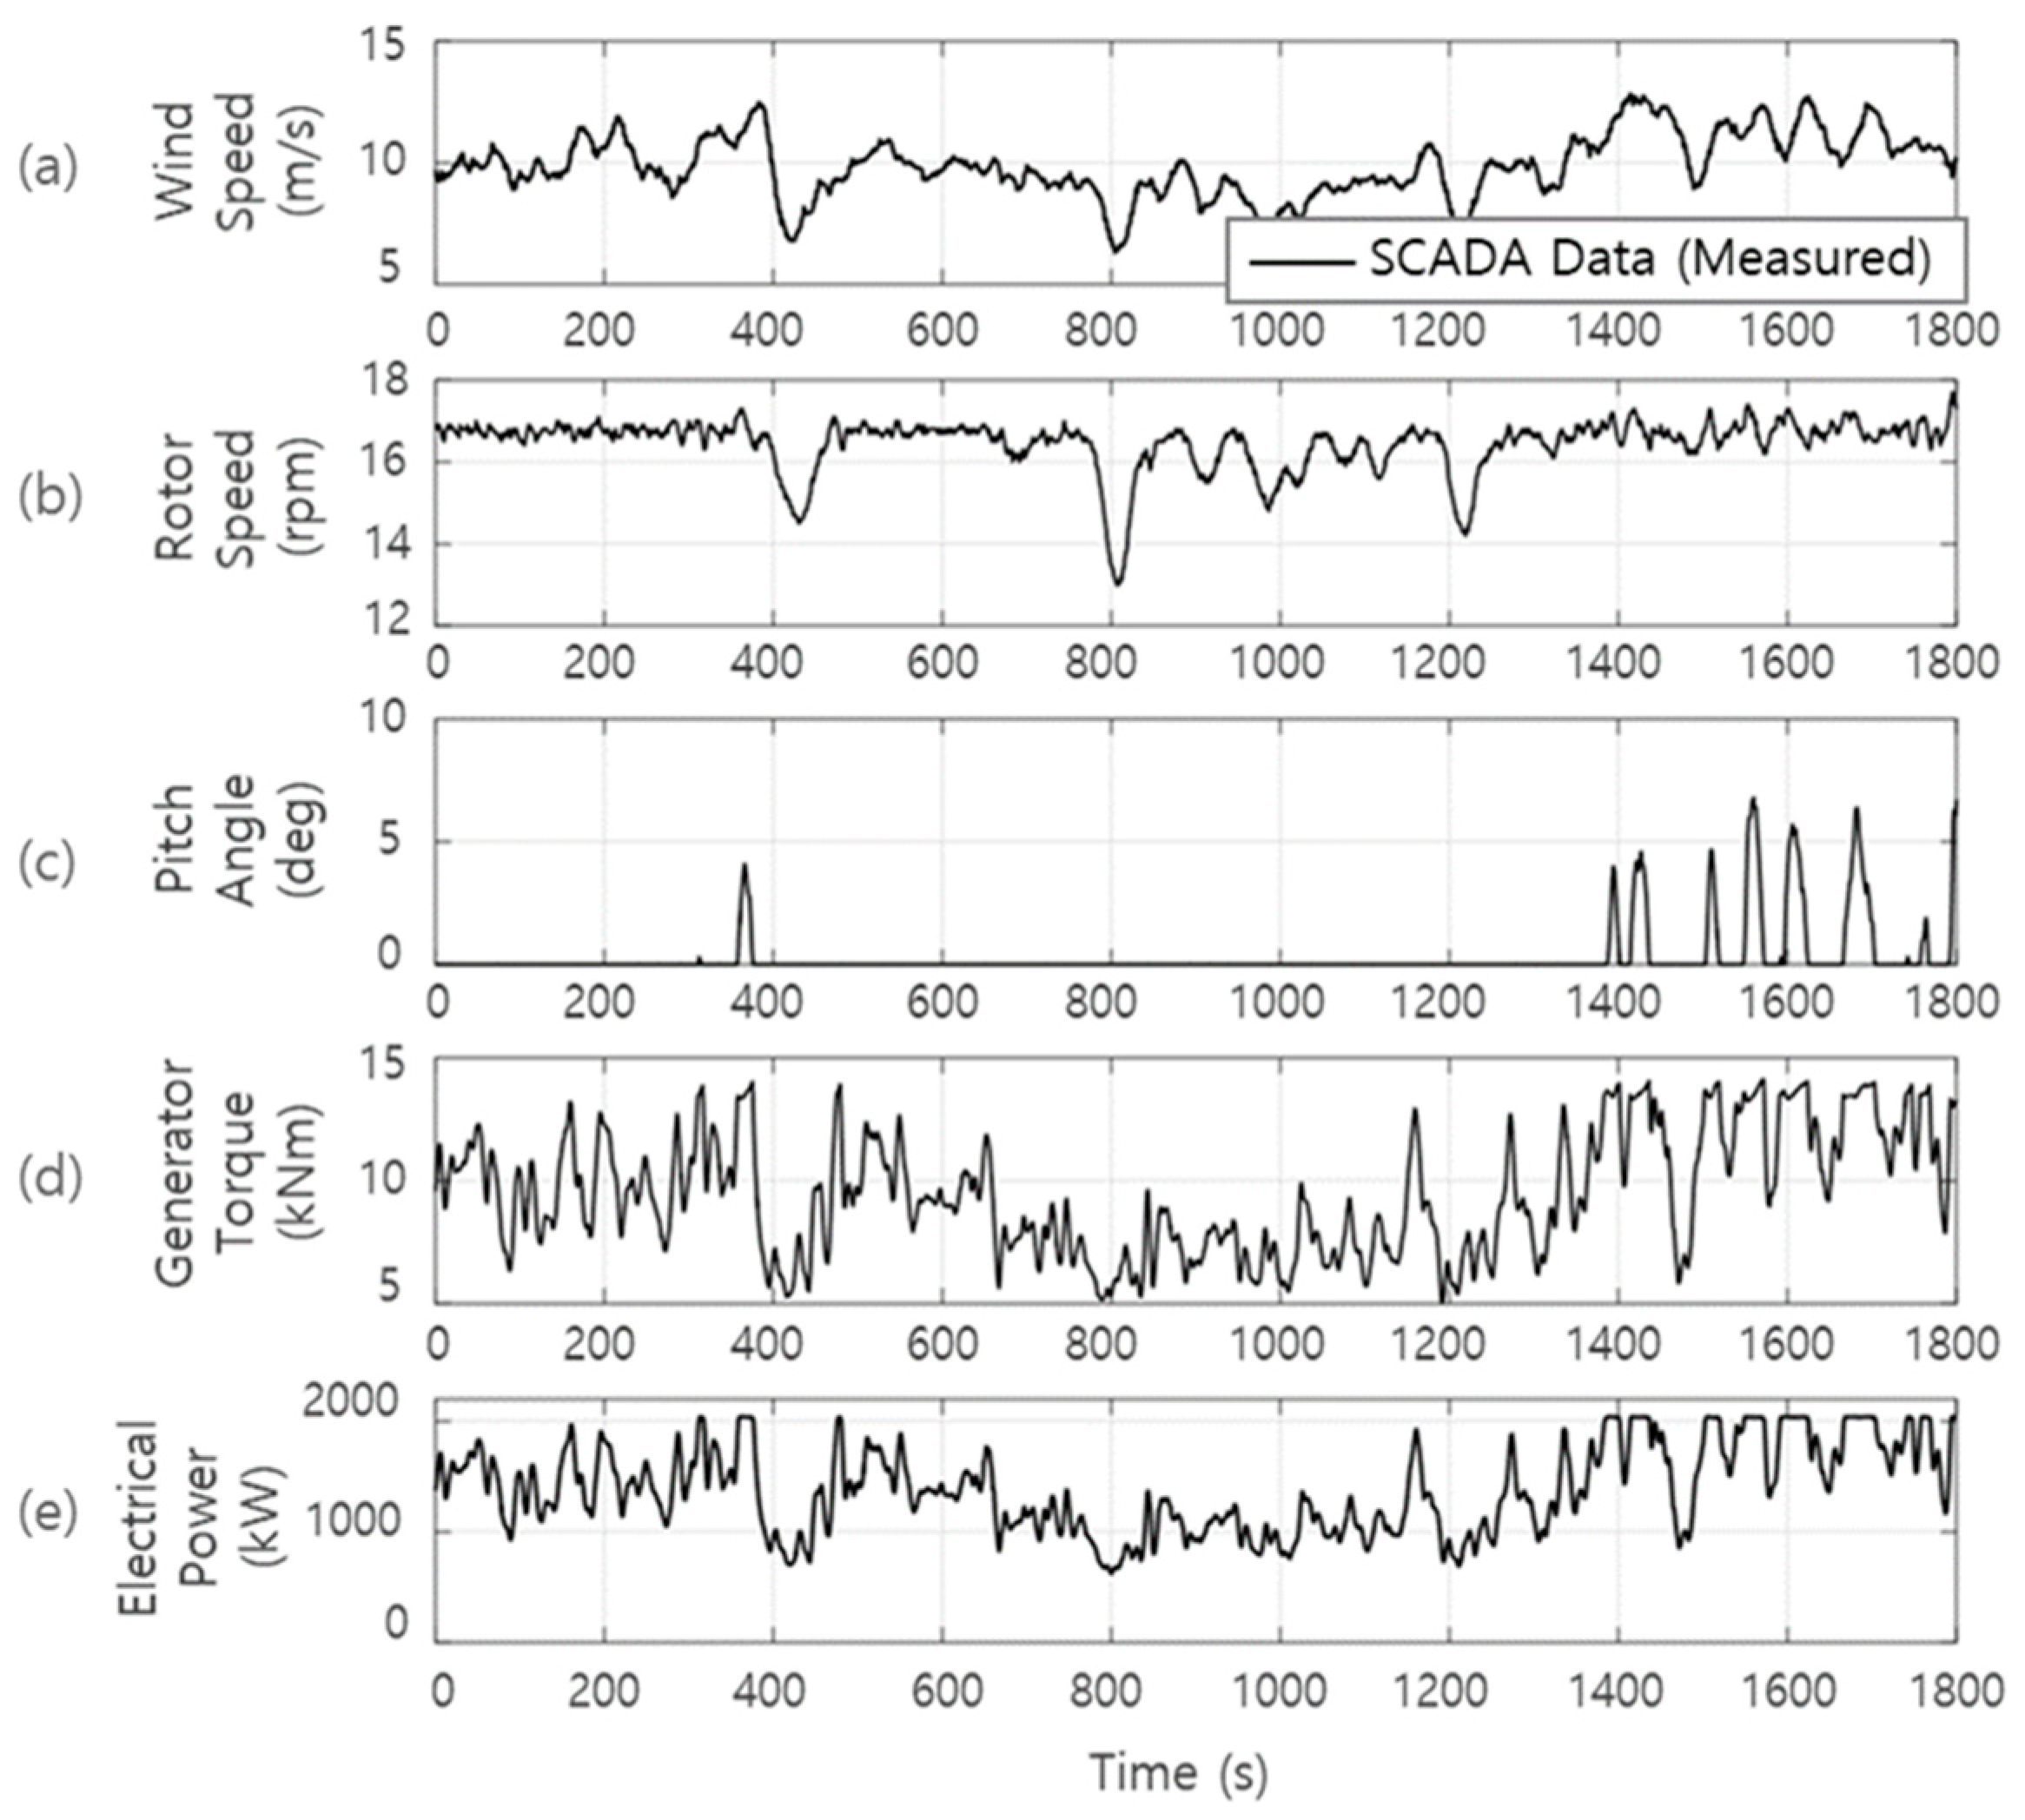
3.1. SCADA Data of Wind Turbine
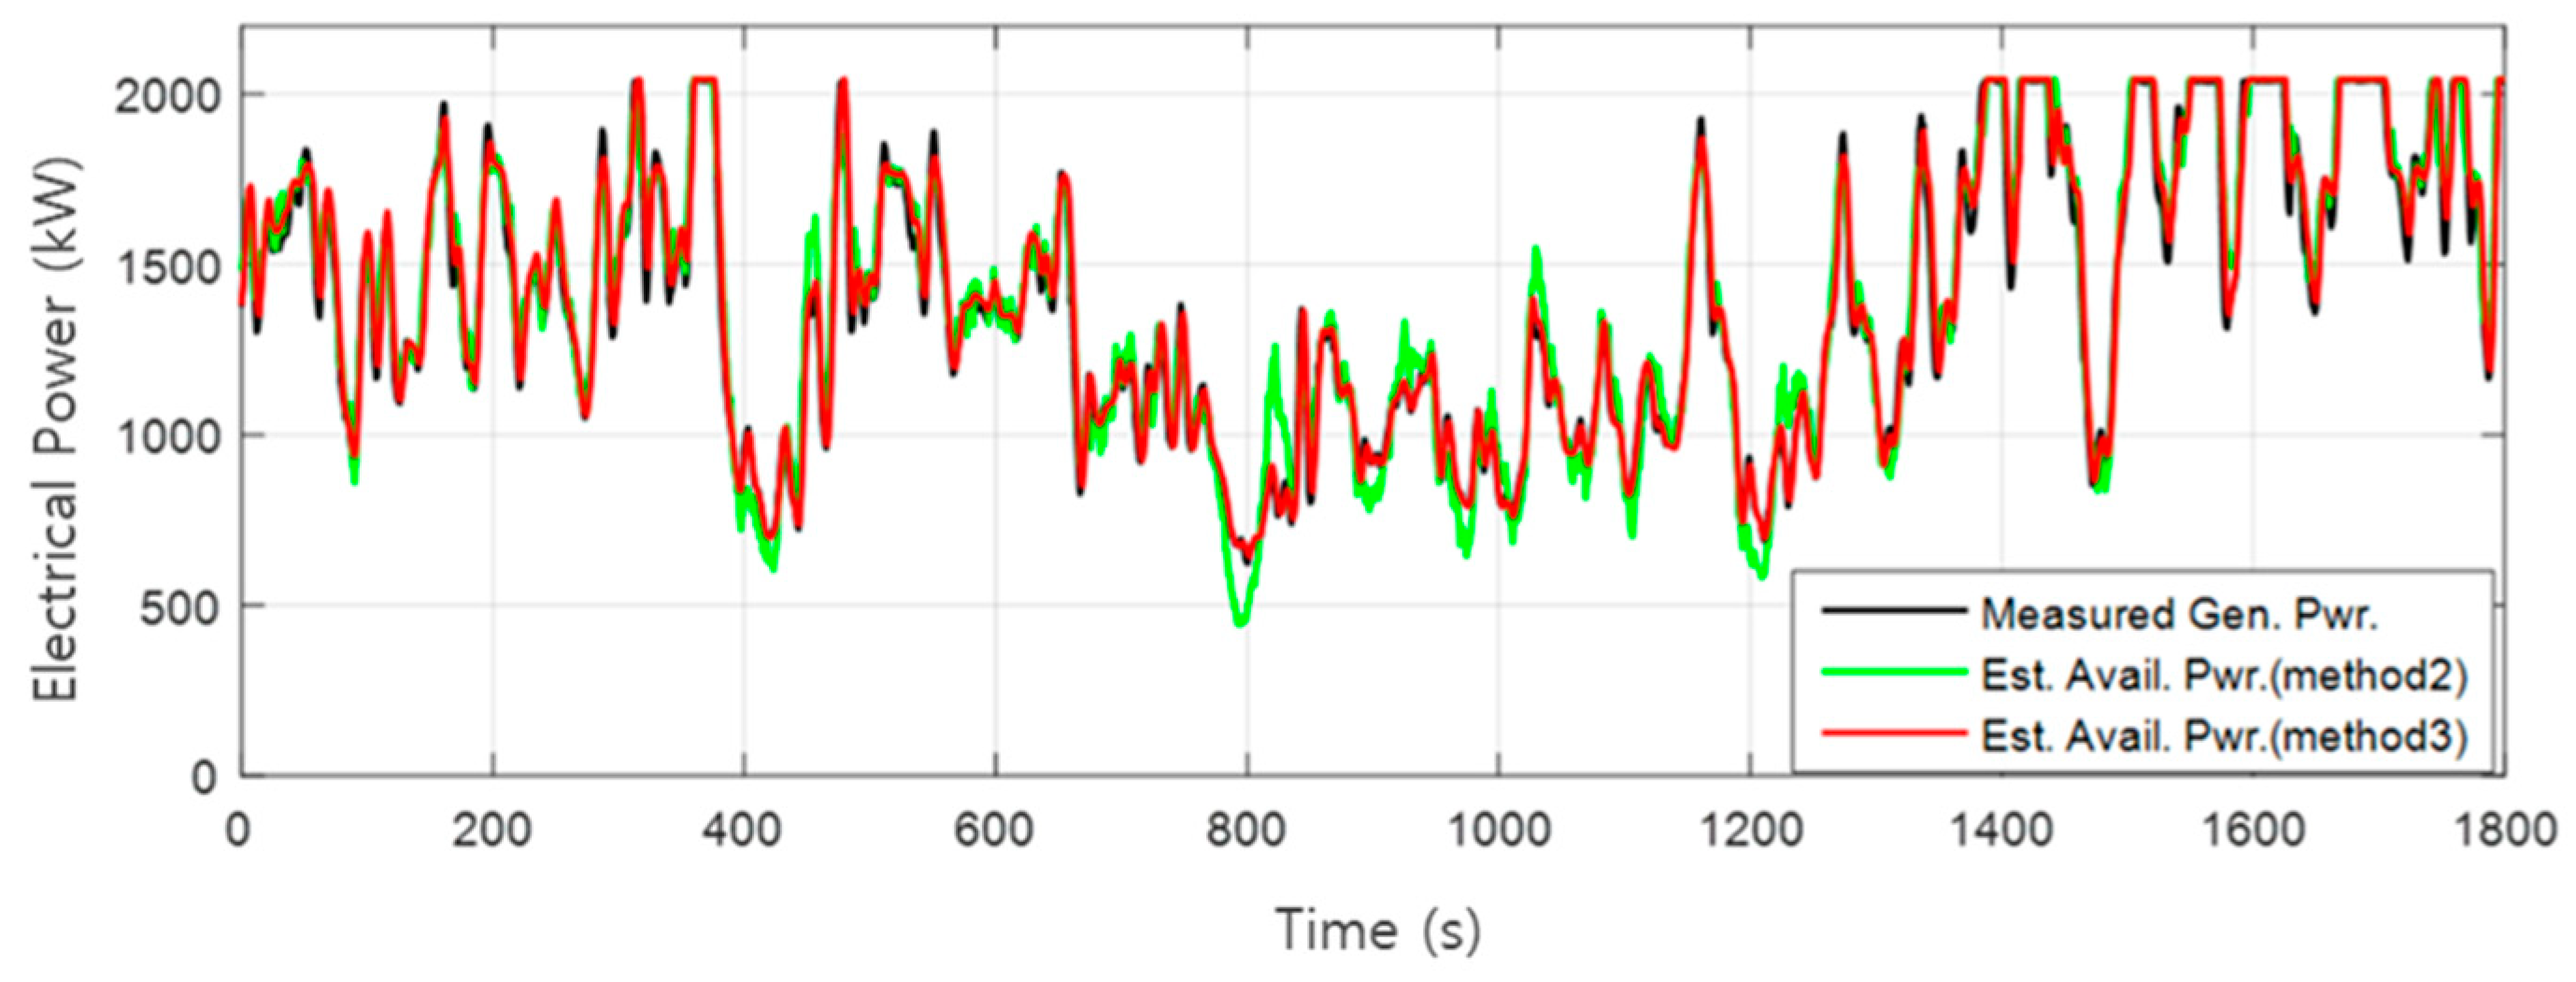
3.2. Simulation Results and Their Comparison with SCADA Data
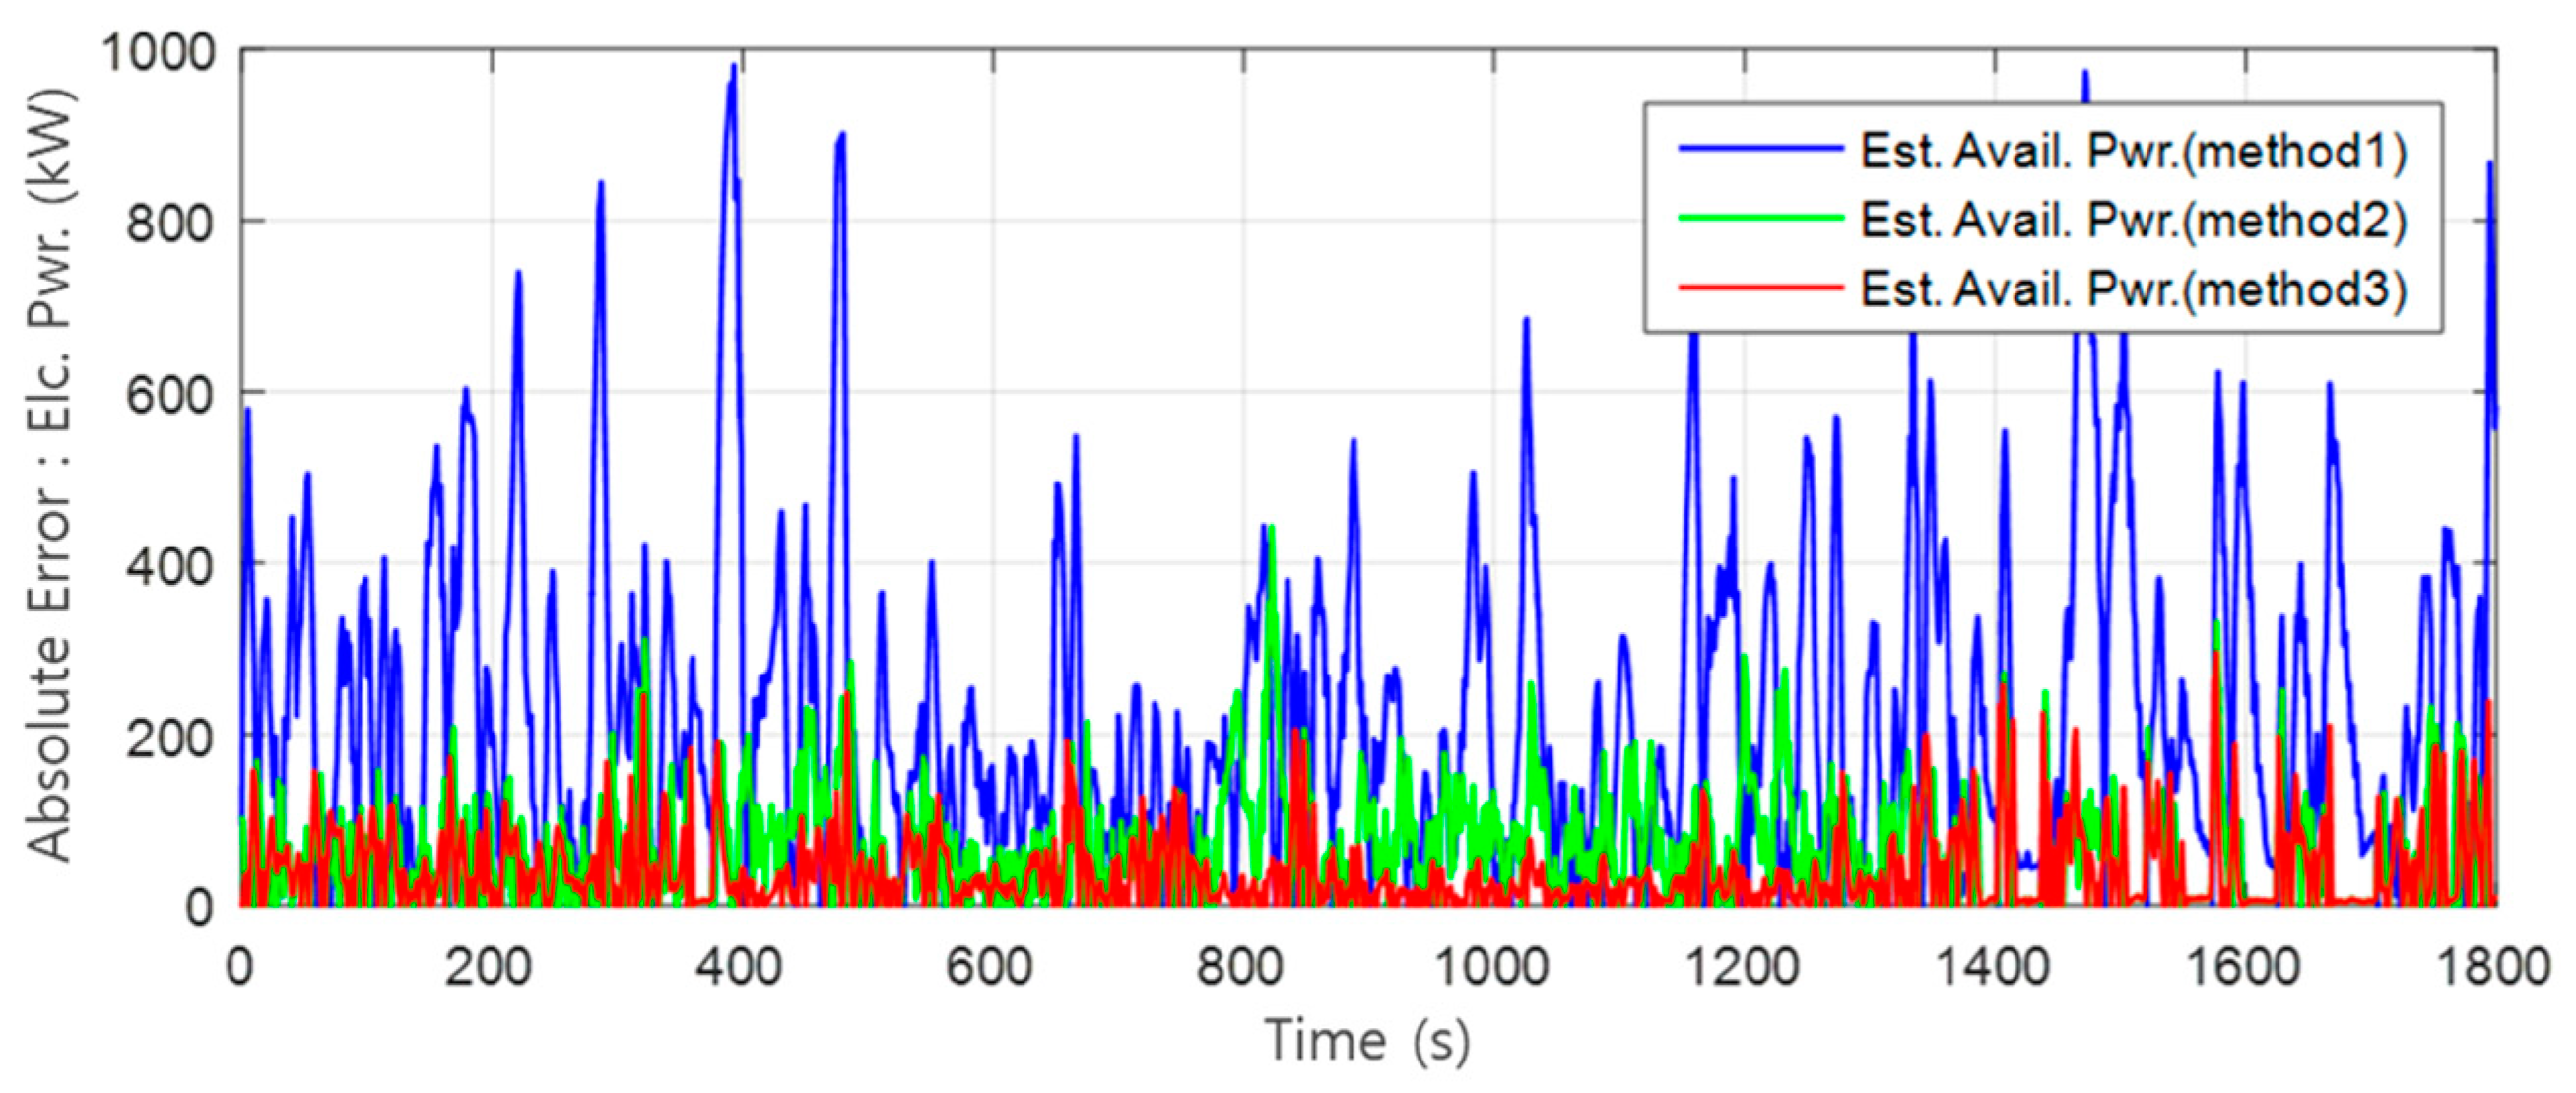
3.3. Quantitative Comparison of Simulation Results by Methods 1, 2, and 3
4. Discussion
5. Conclusions
Author Contributions
Funding
Institutional Review Board Statement
Informed Consent Statement
Data Availability Statement
Conflicts of Interest
References
- “Hitting the Targets” The Case for Ethical and Empowering Population Policies to Accelerate Progress towards the Sustainable Development Golas. Available online: https://populationmatters.org/sites/default/files/Hitting%20the%20Targets%20-%20Population%20and%20the%20SDGs.pdf (accessed on 25 March 2022).
- Buonocore, J.J.; Choma, E.; Villavicencio, A.H.; Spengler, J.D.; Koehler, D.A.; Evans, J.S.; Lelieveld, J.; Klop, P.; Sanchez-Pina, R. Metrics for the sustainable development goals: Renewable energy and transportation. Palgrave Commun. 2019, 5, 12019. [Google Scholar] [CrossRef]
- Jianzhong, X.U.; Assenova, A.; Erokhin, V. Renewable energy and sustainable development in a resource-abundant country: Challenges of wind power generation in Kazakhstan. Sustainability 2018, 10, 3315. [Google Scholar] [CrossRef] [Green Version]
- Manwell, J.F.; Mcgowan, J.G.; Rogers, A.L. Wind Energy Explained, 2nd ed.; John Wiley and Sons Ltd.: Hoboken, NJ, USA, 2009. [Google Scholar]
- Hassan, A.; Rehman, A.U.; Shabbir, N.; Hassan, S.R.; Sadiq, M.T.; Arshad, J. Impact of Inertial Response for the Variable Speed Wind Turbine. In Proceedings of the 2019 International Conference on Engineering and Emerging Technologies, Lahore, Pakistan, 21–22 February 2019. [Google Scholar]
- Asif, R.M.; Ur Rehman, A.; Ur Rehman, S.; Arshad, J.; Hamid, J.; Tariq Sadiq, M.; Tahir, S. Design and analysis of robust fuzzy logic maximum power point tracking based isolated photovoltaic energy system. Eng. Rep. 2020, 2, e12234. [Google Scholar] [CrossRef]
- Siddique, M.A.B.; Khan, M.A.; Asad, A.; Rehman, A.U.; Asif, R.M.; Rehman, S.U. Maximum Power Point Tracking with Modified Incremental Conductance Technique in Grid-Connected PV Array. In Proceedings of the 5th International Conference on Innovative Technologies in Intelligent Systems and Industrial Applications, Sydney, Australia, 25–27 November 2020. [Google Scholar]
- Lackner, M.A.; Elkinton, C.N. An analytical framework for offshore wind farm layout optimization. Wind Eng. 2007, 31, 12007. [Google Scholar] [CrossRef]
- González, J.S.; Rodriguez, A.G.G.; Mora, J.C.; Santos, J.R.; Payan, M.B. Optimization of wind farm turbines layout using an evolutive algorithm. Renew. Energy 2010, 35, 82010. [Google Scholar] [CrossRef]
- Herbert-Acero, J.F.; Probst, O.; Réthoré, P.E.; Larsen, G.C.; Castillo-Villar, K.K. A review of methodological approaches for the design and optimization of wind farms. Energies 2014, 7, 6930–7016. [Google Scholar] [CrossRef]
- Kristoffersen, J.R. The Horns Rev wind farm and the operational experience with the wind farm main controller. Rev. E-Soc. R. Belg. Électriciens 2006, 122, 22006. [Google Scholar]
- Soleimanzadeh, M.; Wisniewski, R. Controller design for a wind farm, considering both power and load aspects. Mechatronics 2011, 21, 42011. [Google Scholar] [CrossRef]
- Kanev, S.; Bot, E.; Giles, J. Wind Farm Loads under Wake Redirection Control. Energies 2020, 13, 4088. [Google Scholar] [CrossRef]
- Steinbuch, M.; De Boer, W.W.; Bosgra, O.H.; Peeters, S.A.W.M.; Ploeg, J. Optimal control of wind power plants. J. Wind Eng. Ind. Aerodyn. 1988, 27, 237–246. [Google Scholar] [CrossRef]
- Kim, H.; Kim, K.; Paek, I. Model based open-loop wind farm control using active power for power increase and load reduction. Appl. Sci. 2017, 7, 1068. [Google Scholar] [CrossRef] [Green Version]
- Kim, H.; Kim, K.; Paek, I. Power regulation of upstream wind turbines for power increase in a wind farm. Int. J. Precis. Eng. Manuf. 2016, 17, 52016. [Google Scholar] [CrossRef]
- Kim, H.; Kim, K.; Paek, I.; Bottasso, C.L.; Campagnolo, F. A Study on the Active Induction Control of Upstream Wind Turbines for total power increases. J. Phys. Conf. Ser. 2016, 753, 32016. [Google Scholar] [CrossRef] [Green Version]
- Johnson, K.E.; Thomas, N. Wind Farm Control: Addressing the Aerodynamic Interaction among Wind Turbines. In Proceedings of the 2009 American Control Conference, St. Louis, MO, USA, 10–12 June 2009; pp. 2104–2109. [Google Scholar]
- Baskut, O.; Ozgener, O.; Ozgener, L. Second law analysis of wind turbine power plants: Cesme, Izmir example. Energy 2011, 36, 2535–2542. [Google Scholar] [CrossRef]
- Oh, Y.O.; Paek, I.S.; Nam, Y.S.; La, Y.H. Study on the Available Power of a Wind Turbine for Wind Farm Control. J. Korean Sol. Energy Soc. 2014, 34, 12014. [Google Scholar]
- Spudić, V.; Jelavić, M.; Baotić, M. Wind turbine power references in coordinated control of wind farms. Automatika 2011, 52, 22011. [Google Scholar] [CrossRef]
- Cutler, N.J.; Outhred, H.R.; MacGill, I.F. Using nacelle-based wind speed observations to improve power curve modeling for wind power forecasting. Wind Energy 2012, 15, 22012. [Google Scholar] [CrossRef]
- Hansen, A.D.; Sørensen, P.; Iov, F.; Blaabjerg, F. Centralised power control of wind farm with doubly fed induction generators. Renew. Energy 2006, 31, 72006. [Google Scholar] [CrossRef]
- Ebrahimi, F.M.; Khayatiyan, A.; Farjah, E. A novel optimizing power control strategy for centralized wind farm control system. Renew. Energy 2016, 86, 399–408. [Google Scholar] [CrossRef]
- Vali, M.; Petrović, V.; Steinfeld, G.; Y Pao, L.; Kühn, M. An active power control approach for wake-induced load alleviation in a fully developed wind farm boundary layer. Wind Energy Sci. 2019, 4, 12019. [Google Scholar] [CrossRef] [Green Version]
- Aksoy, B.; Selbaş, R. Estimation of Wind Turbine Energy Production Value by Using Machine Learning Algorithms and Development of Implementation Program. Energy Sources Part A Recovery Util. Environ. Eff. 2021, 43, 692–704. [Google Scholar] [CrossRef]
- Astolfi, D.; Pandit, R. Multivariate Wind Turbine Power Curve Model Based on Data Clustering and Polynomial LASSO Regression. Appl. Sci. 2021, 12, 72. [Google Scholar] [CrossRef]
- Wu, W.; Peng, M. A data mining approach combining $ k $-means clustering with bagging neural network for short-term wind power forecasting. IEEE Internet Things J. 2017, 4, 979–986. [Google Scholar] [CrossRef] [Green Version]
- Wu, Z.; Li, Y.; Xiao, Y. Nacelle anemometer measurement-based extremum-seeking wind turbine region-2 control for improved convergence in fluctuating wind. Wind Energy 2020, 23, 1118–1134. [Google Scholar] [CrossRef]
- Lydia, M.; Kumar, S.S.; Selvakumar, A.I.; Kumar, G.E.P. A comprehensive review on wind turbine power curve modeling techniques. Renew. Sustain. Energy Rev. 2014, 30, 452–460. [Google Scholar] [CrossRef]
- Smaïli, A.; Masson, C. On the rotor effects upon nacelle anemometry for wind turbines. Wind Eng. 2004, 2, 695–713. [Google Scholar] [CrossRef]
- Wang, X.; Liu, Y.; Wang, L.; Ding, L.; Hu, H. Numerical study of nacelle wind speed characteristics of a horizontal axis wind turbine under time-varying flow. Energies 2019, 12, 3993. [Google Scholar] [CrossRef] [Green Version]
- Song, Y.; Paek, I. Prediction and Validation of the Annual Energy Production of a Wind Turbine Using WindSim and a Dynamic Wind Turbine Model. Energies 2020, 13, 6604. [Google Scholar] [CrossRef]
- Kim, H.G.; Kim, J.Y. Analysis of wind turbine aging through operation data calibrated by LiDAR measurement. Energies 2021, 14, 2319. [Google Scholar] [CrossRef]
- Sipeng, H.; Yangfei, Z.; Xianyun, L.; Yue, Y. Equivalent Wind Speed Model in Wind Farm Dynamic Analysis. In Proceedings of the International Conference on Electric Utility Deregulation and Restructuring and Power Technologies, Weihai, China, 6–9 July 2011; pp. 1751–1755. [Google Scholar]
- Shi, W.; Kim, C.W.; Chung, C.W.; Park, H.C. Dynamic modeling and analysis of a wind turbine drive-train using the torsional dynamic model. Int. J. Precis. Eng. Manuf. 2013, 14, 12013. [Google Scholar] [CrossRef]
- Nam, Y.S.; Kim, J.G.; Paek, I.S.; Moon, Y.H.; Kim, S.J.; Kim, D.J. Feedforward pitch control using wind speed estimation. J. Power Electron. 2011, 11, 211–217. [Google Scholar] [CrossRef]
- Nam, Y. Wind Turbine System Control, 1st ed.; GS Intervision: Seoul, Korea, 2013. [Google Scholar]
- Kim, K.; Kim, H.G.; Kim, C.J.; Paek, I.; Bottasso, C.L.; Campagnolo, F. Design and validation of demanded power point tracking control algorithm of wind turbine. Int. J. Precis. Eng. Manuf. Green Technol. 2018, 5, 387–400. [Google Scholar] [CrossRef]
- Kim, K.; Kim, H.; Paek, I.; Kim, H.G.; Son, J. Field validation of demanded power point tracking control algorithm for medium-capacity wind turbine. Int. J. Precis. Eng. Manuf. Green Technol. 2019, 6, 875–881. [Google Scholar] [CrossRef]
- International Electrotechnical Commission (IEC). Wind Turbine Generator Systems Part 12-1: Power Performance Measurements of Electricity Producing Wind Turbines, 2nd ed.; International Electrotechnical Commission (IEC): Geneva, Switzerland, 2017. [Google Scholar]


| Methods | Electrical Power (kW, %) | |||||
|---|---|---|---|---|---|---|
| Min. | Error | Max. | Error | Mean. | Error | |
| Measured. Gen. Pwr. | 622.4 | - | 2045.3 | - | 1384.7 | - |
| Method 1 | 334.1 | −46.3 | 1998.5 | −2.3 | 1344.6 | −2.9 |
| Method 2 | 443.8 | −28.7 | 2044.1 | −0.1 | 1403.4 | 1.4 |
| Method 3 | 642.5 | 3.2 | 2044.1 | −0.1 | 1398.6 | 1.0 |
| Methods | RMSE (kW) | MSE (kW) | MAE (kW) |
|---|---|---|---|
| Method 1 | 291.3 | 84843.7 | 226.2 |
| Method 2 | 89.2 | 7956.7 | 66.5 |
| Method 3 | 59.5 | 3535.6 | 40.9 |
| Properties | Wind Speed (m/s) | Generated Power (kW) | Available Power (kW) | |||
|---|---|---|---|---|---|---|
| Mean | Error | Mean | Error | Mean | Error | |
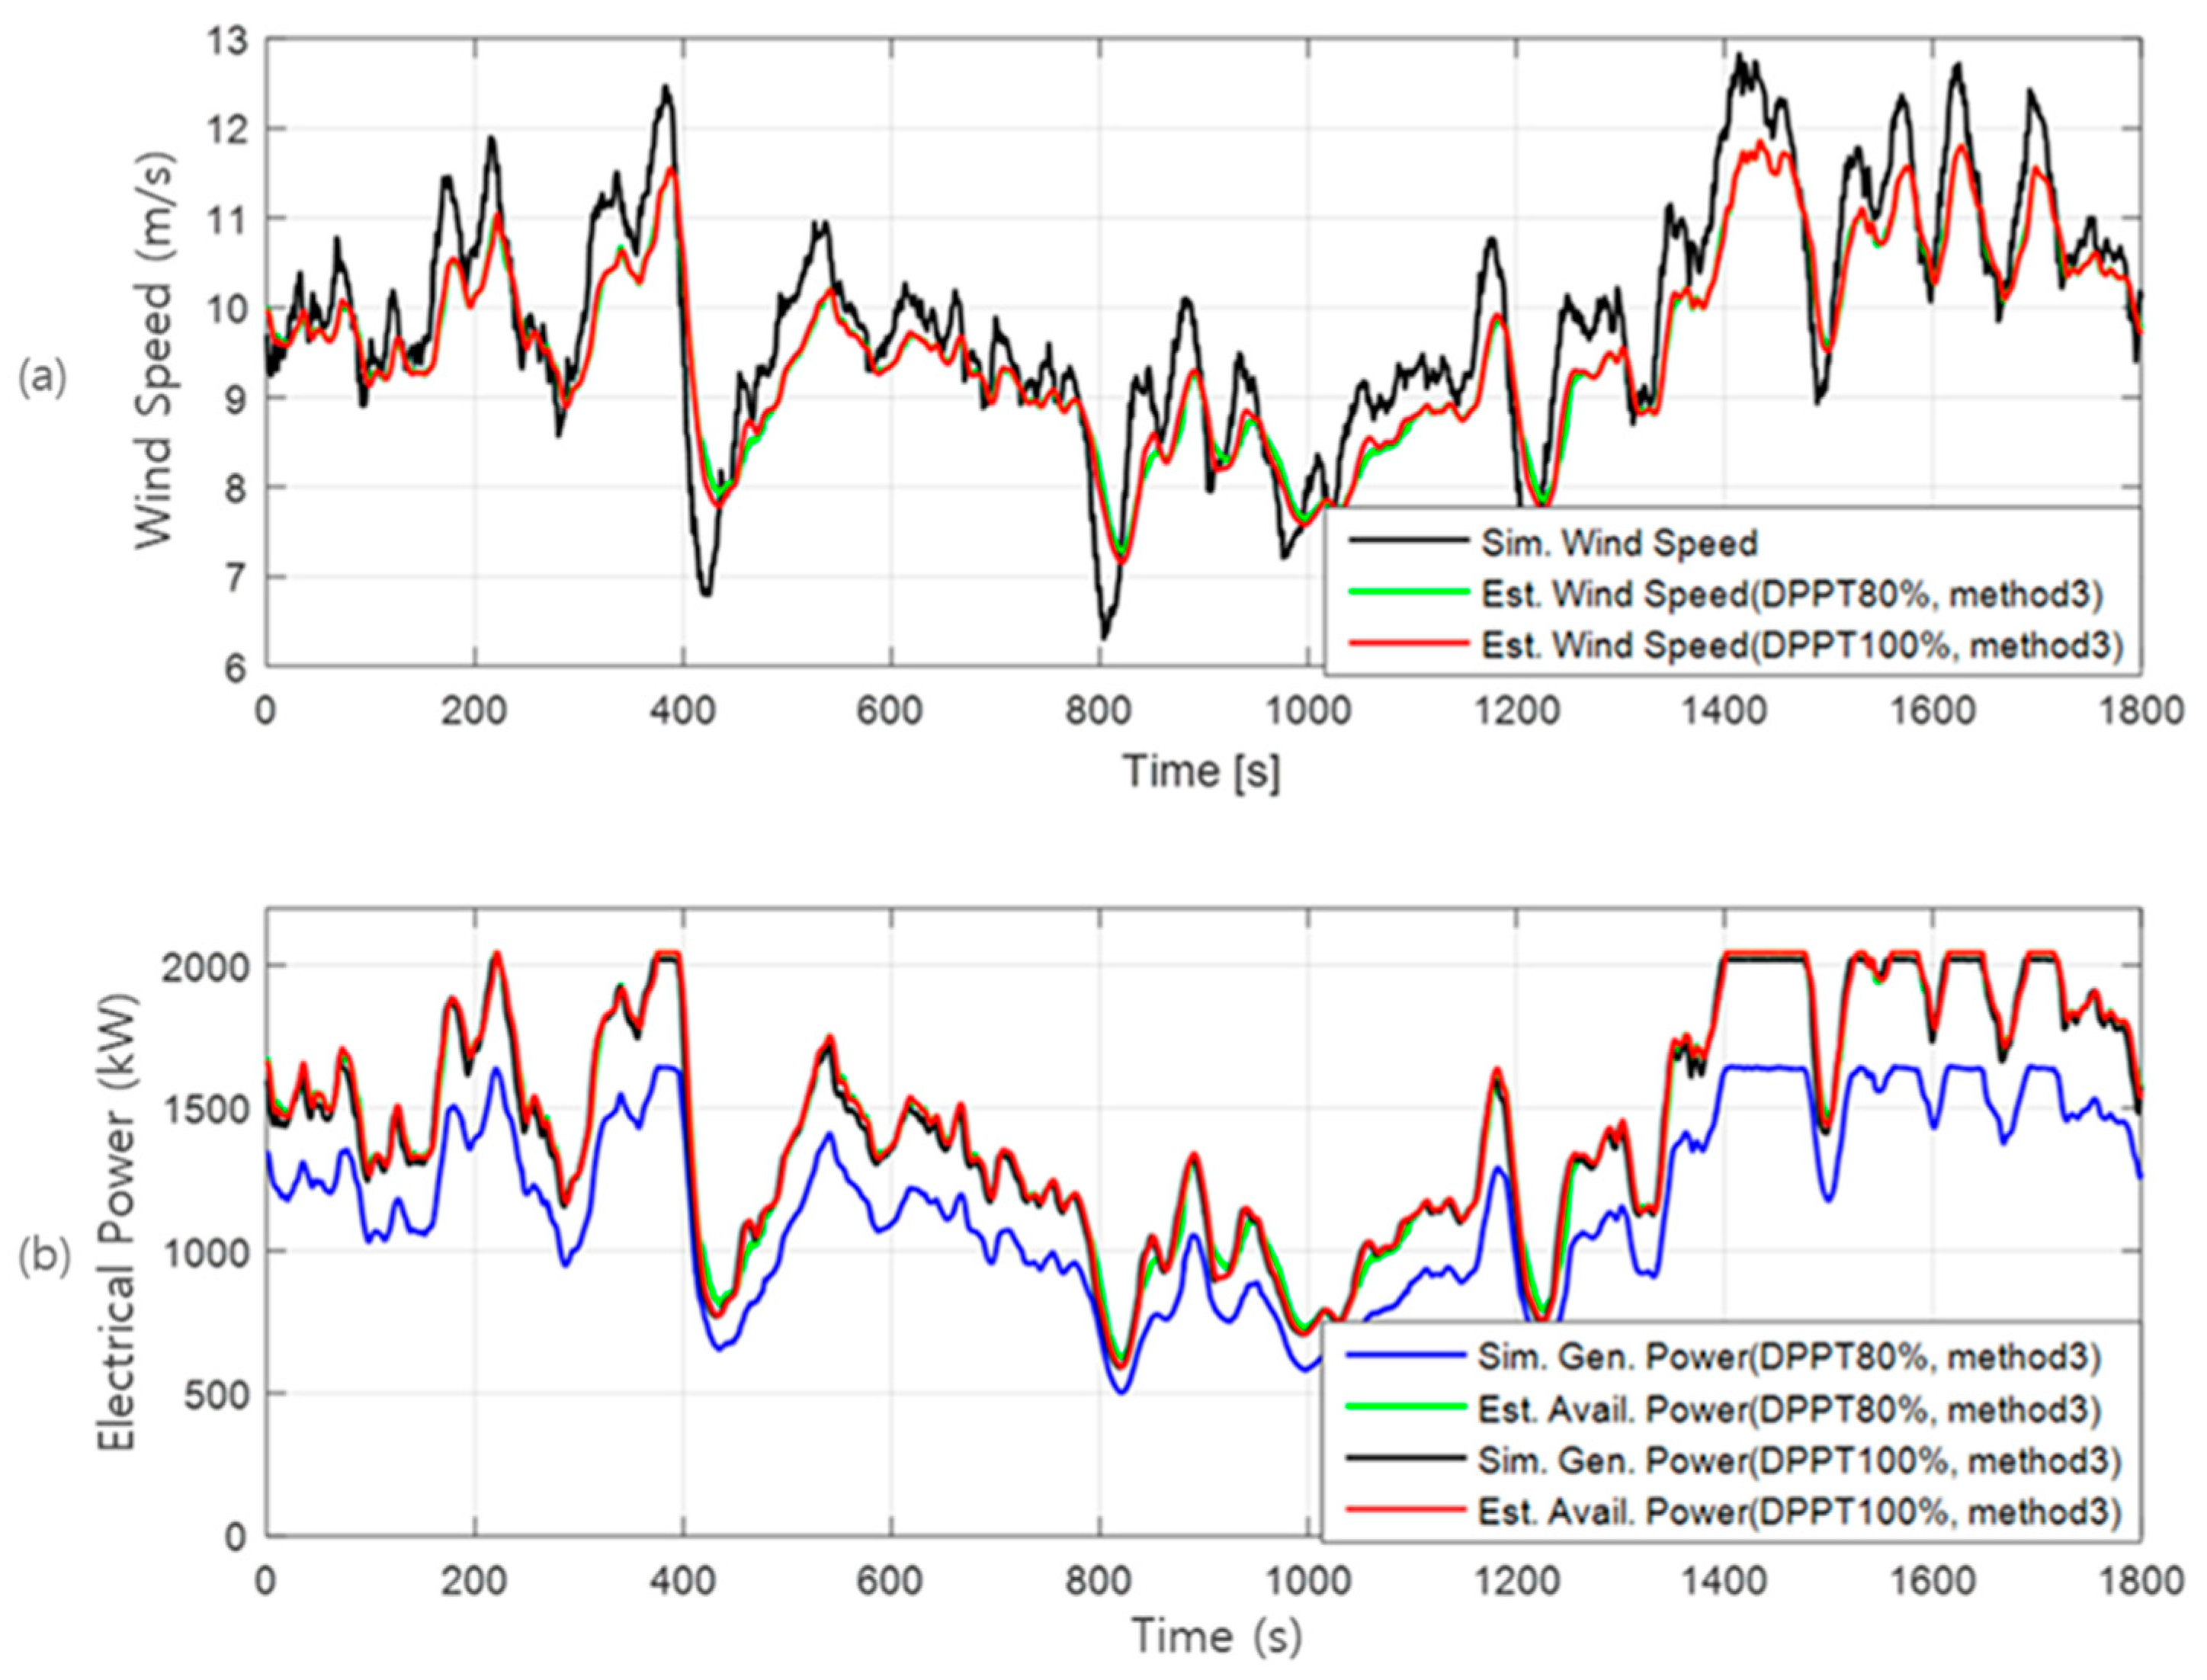
| Simulation Condition | 9.9 | - | - | - | - | - |
| DPPT (100%) | 9.6 | −3.0 | 1430.5 | 0.0 | 1458.0 | 0.0 |
| DPPT (80%) | 9.6 | −3.0 | 1167.6 | −18.4 | 1456.1 | −0.1 |
Publisher’s Note: MDPI stays neutral with regard to jurisdictional claims in published maps and institutional affiliations. |
© 2022 by the authors. Licensee MDPI, Basel, Switzerland. This article is an open access article distributed under the terms and conditions of the Creative Commons Attribution (CC BY) license (https://creativecommons.org/licenses/by/4.0/).
Share and Cite
Kim, D.; Jeon, T.; Paek, I.; Kim, D. A Study on Available Power Estimation Algorithm and Its Validation. Energies 2022, 15, 2648. https://doi.org/10.3390/en15072648
Kim D, Jeon T, Paek I, Kim D. A Study on Available Power Estimation Algorithm and Its Validation. Energies. 2022; 15(7):2648. https://doi.org/10.3390/en15072648
Chicago/Turabian StyleKim, Dongmyoung, Taesu Jeon, Insu Paek, and Daeyoung Kim. 2022. "A Study on Available Power Estimation Algorithm and Its Validation" Energies 15, no. 7: 2648. https://doi.org/10.3390/en15072648