Article

A Study on Available Power Estimation Algorithm and Its Validation

1
Department of Integrated Energy and Infra System, Kangwon National University, Engineering Building 6-319, 1 Gangwondaehak-gil, Chuncheon-si 24341, Gangwon-do, Korea
2
Department of Mechatronics Engineering, Kangwon National University, Engineering Building 6-319, 1 Gangwondaehak-gil, Chuncheon-si 24341, Gangwon-do, Korea
3
R and D Institute, Hanjin Ind. Co., Ltd., 1981-48, Yangsan-daero, Habuk-myeon, Yangsan-si 50509, Gyeongsangnam-do, Korea
*
Author to whom correspondence should be addressed.
Energies 2022, 15(7), 2648; https://doi.org/10.3390/en15072648
Submission received: 28 February 2022 / Revised: 25 March 2022 / Accepted: 28 March 2022 / Published: 4 April 2022

Abstract

:
Three different algorithms that can be used to estimate the available power of a wind turbine are investigated and validated in this study. The first method is the simplest and using the power curve with the measured nacelle wind speed. The other two are to estimate the equivalent wind speed first without using the measured Nacelle wind speed and to estimate the available power from the rotor power equation. The two methods are different in that the second method is to use the drive-train model to estimate the rotor torque but the third method is to use a simplified equation to avoid sharp peaks in the wind speed estimation. Simulations were performed to validate the constructed available power estimation algorithms with the measured data of a 2 MW target wind turbine. It was found from the validation that the third available power estimation algorithm works properly and is closer to the power actually generated from the wind turbine than the other methods considered. In addition, the third algorithm that showed the best performance was further validated with the DPPT (demanded power point tracking) operation with Matlab/Simulink environment. It was found from the simulation that the third algorithm works well in the DPPT operation to estimate the available power of the wind turbine.

1. Introduction

One of the United Nation’s 17 sustainable development goals to achieve decent lives of people on the earth by 2030 is the transition of energy production from fossil fuel to clean sources [1], and, therefore, a lot of research and developments have been performed to increase the implementation of clean technologies and their efficiencies [2,3]. As one of the renewable energy technologies, wind power generation is considered to be the most suitable technology to produce a large capacity of electricity in a relatively small occupied area. Currently a wind turbine with a unit capacity of 13 MW has been certified, and higher capacity turbines are being developed or field tested by global wind turbine manufacturers.
The capacity of wind power facilities is continuously growing worldwide, and a lot of research has been conducted to improve the power generation of wind farms. The power increase of a wind farm can be achieved on a wind turbine level by increasing the power generation of individual wind turbines. The Maximum Power Point Tracking (MPPT) algorithm is used as a main wind turbine control algorithm to maximize the electrical power output of wind turbines when the wind speed is lower than the rated wind speed of the wind turbine [4,5]. The MPPT is also applied to other power generation technologies using renewable energy like solar photovoltaic power plants [6,7].
In addition to the MPPT algorithm of individual wind turbines, the power increase from a wind farm can also be achieved on a wind farm level and this can be divided into a passive or an active way. The passive way is simply to maximize power generation by optimizing the layout of wind turbines before wind farm construction [8,9,10]. The optimization of a wind farm is commonly performed through simulations using commercial wind farm design programs. On the other hand, the active way is to increase the wind farm power output using a wind farm controller after wind farm construction. The wind farm controller plays as a higher-level controller than individual wind turbine controllers so that it controls the power of each wind turbine to increase the total power of the target wind farm [11,12,13].
One of the wind farm control techniques to improve the total power output of wind farms is the active induction control based on power derating. This method uses de-rating the power generation of upstream wind turbines in a wind farm [14,15,16,17]. Power de-rating reduces the axial induction factor and decrease the power generation of the corresponding wind turbine. However, this increases the wind speed in the downstream of the wind farm resulting in power increase of the subsequent wind turbines. If the amount of increased power in the downstream wind turbines is greater than the amount of reduced power in the upstream wind turbine due to de-rating, it can be advantageous in terms of total power output of a wind farm [18].
For the power based de-rating to be implemented to the actual wind farm, however, an available power estimation for upstream wind turbines is needed in the wind farm controller. The available power of a wind turbine means the maximum electrical power that can be generated with the given wind condition [19,20]. The available power estimation is usually performed in a wind turbine and the results are provided to the supervisory control and data acquisition (SCADA) system [21,22]. Whenever, the power output from a wind farm needs to be intentionally lowered by a command from a transmission system operator, the available power is used to determine the power commands to the individual wind turbines to achieve the target power from the wind farm, or to achieve the target power ratio of upstream wind turbine [15,16,23,24,25].
The available power estimation of the individual wind turbines in the power based de-rating is closely related to the total power output from the wind farm. If the available power is under-estimated, the power commands from the wind farm controller to upstream wind turbines will become smaller than the optimal power commands by the degree of under-estimation, and it results in the loss of power production from the wind farm. Therefore, the research to investigate and improve the accuracy of the available power estimation is needed [15,16].
The available power of a wind turbine can be estimated by a few different methods depending on the measured parameters. Recently, methods on the power estimation of a wind turbine by applying machine learning techniques have been introduced [26,27,28].
Aksoy and Selbaş proposed a method to estimate the power of a wind turbine using the multiple linear regression (MLR) algorithms. The measured values of temperature, wind speed, and wind direction were used for the model training. According to the results of comparison between the measured and the estimated power outputs from the MLR algorithms that showed the best performance, the estimation accuracy based on the root mean square error (RMSE) was found to be about 90% [26].
Astolfi and Pandit proposed a multivariate wind turbine power curve model based on the simplification of a polynomial LASSO regression to estimate the power of a wind turbine. Before training the model, the k-means algorithm was used for multi-dimensional data clustering. According to the validation study, the accuracy of the proposed model based on the mean absolute percentage error was found to be 7.2% [27].
Wu and Peng proposed a method to use the k-means clustering and the bagging neural network to improve the accuracy of the power estimation of a wind turbine. The k-means clustering was used to separate the original data sets into categories to mitigate the effect of the diversity of data. The bagging neural network was integrated into the back propagation neural network (BPNN) to improve the over-fitting problems of the BPNN. The results were compared with the results from the baseline model which is the BPNN without bagging and clustering. The proposed method was found to reduce RMSE by 38.7% compared with the baseline model [28].
The power estimation models based on machine learning techniques in the literature showed the possibility to be used to estimate the available power estimation of wind turbines. However, the method requires large number of wind turbine data for training, and complicated time-consuming training process. Also, the trained model is much affected by the environmental conditions in which the training data were measured. Therefore, the model constructed using the machine learning techniques based on the measured data at a site might not be used to estimate the available power of a wind turbine at a different site.
There also exist other simple methods to estimate the available power of a wind turbine without using machine learning techniques. One of the simplest methods is to use the wind speed measured directly from the anemometer that is normally installed on top of the nacelle of a wind turbine or use nacelle transfer function model [29]. The power curve of the wind turbine can be used with the measured wind speed to estimate the available power [30]. The wind speed obtained from the nacelle anemometer, however, is affected by the blades [31,32] and the power estimated from the normalized power curve must be converted based on the effect of the local air density in this case [33,34].
The available power can also be estimated by estimating the equivalent wind speed of a wind turbine first [35]. This is normally done by estimating the rotor torque by using a simplified equation of motion of the drive-train with the measured rotor or generator speeds [36,37,38]. Then the rotor torque is used to estimate the equivalent wind speed. There exist articles available in the literature that deal with estimating the equivalent wind speed to be used for wind turbine control algorithms [37,38]. The estimated wind speed can be used with the aerodynamic torque equation in terms of the power coefficient and other parameters to finally estimate the available power.
The drive-train model is used to estimate the rotor torque which is needed to estimate the wind speed. The model has a time-derivative term of the rotor speed that might be vulnerable to noises. Therefore, without using the dynamics of simplified drive-train model, one might think of using the measured generator torque with the gear ratio to estimate the rotor torque to avoid sharp peaks due to the time derivative term in the drive-train model. Then the rotor torque can be used to estimate the equivalent wind speed, and finally the available power.
Although a few different simple approaches are possible to estimate the available power of a wind turbine, and the available power estimation is done in the wind turbine SCADA systems, the literature on the available power estimation using different methods and also their experimental validations doesn’t exist.
Therefore, the algorithms to estimate the available power of a wind turbine are investigated and validated in this study. To validate the algorithms, the SCADA data of a multi-megawatt wind turbine are used in the simulation, and the available powers estimated with different algorithms are compared with the actual power output. Also, validation of the algorithm on the DPPT (demanded power point tracking) [39,40] operation is performed to show the capability of the algorithm in the situation when the wind turbine is operated with a lower power than the available power due to the power command received from a higher level wind farm controller.

2. Wind Turbine Model for Validation

2.1. Available Power Estimation Using Nacelle Anemometer (Method 1)

This is the simplest method to estimate the available power of a wind turbine. The wind speed is obtained from the anemometer installed on top of the wind turbine, and the power is obtained from the standard power curve. Figure 1 shows the method to estimate the available power using nacelle anemometer. Because the standard power curve is based on the air density evaluated at 15 °C and 1 atm, the power must be converted by considering the local environmental condition to estimate the available power at a local site.
The standard of power performance testing of a wind turbine, IEC 61400-12-1 [41], provides a method to convert the power curve obtained based on the measured wind speed and the power of a wind turbine at a local site to the standard power curve based on the density of air at the standard condition which is 15 °C and 1 atm. This conversion method can be used inversely to convert the standard power curve to the power curve that can be used at the local site of interest. For active pitching wind turbines, the conversion is actually made to the wind speed by using
V c = V n / [ ρ a ρ s ] 1 / 3
where, V n is the normalized wind speed, ρ a is the annual averaged air density evaluated with the measured temperature and pressure at the test site, V c is the converted wind speed, and ρ s is the standard air density which is 1.225 kg/m3. In this study, the density of air evaluated at the annual averaged temperature and pressure of the site, which is 1.078 kg/m3 was used as ρ a to convert the standard power curve to the local power curve for the site.

2.2. Available Power Estimation Using Drive-Train Model (Method 2)

Another way to estimate the available power is to estimate the equivalent wind speed first and use the algebraic power equation without using the power curve. In this method, the rotor torque must be estimated first to estimate the wind speed.
The rotor torque can be estimated using a drive-train model of the wind turbine which is available in the literature.
T r = [ J r + N 2 J g ] d Ω r d t + NT g / η e + [ B r + N 2 B g ] Ω r
In the equation, the rotor torque ( T r ), the rotor and the generator mass moment of inertia ( J r ,   J g ), the gear ratio ( N ), the electrical loss ( η e ), and the generator torque ( T g ), the rotor speed ( Ω r ) are used as input parameters. The rotor and the generator damping coefficients ( B r ,   B g ) are known to be small and, therefore, can be neglected in the torque estimation [38].
After finding the rotor torque, the equivalent wind speed can be calculated using Equation (3), which is the arithmetic equation of the mechanical torque of the rotor in terms of the equivalent wind speed normal to the rotor plane and the power coefficient. In the equation, the equivalent wind speed ( V e q ), T r , ρ a , C p , and Ω r are used as input parameters. The three-dimensional turbulent wind blowing into the rotor plane cannot be expressed as a single value of wind speed, and therefore, the estimated wind speed means the equivalent mean wind speed throughout the rotor plane. Because the power coefficient, C p , in the equation is also a function of wind speed, the equation must be solved iteratively.
T r = 1 2 ρ a A V e q 3 C p ( λ , β ) / Ω r
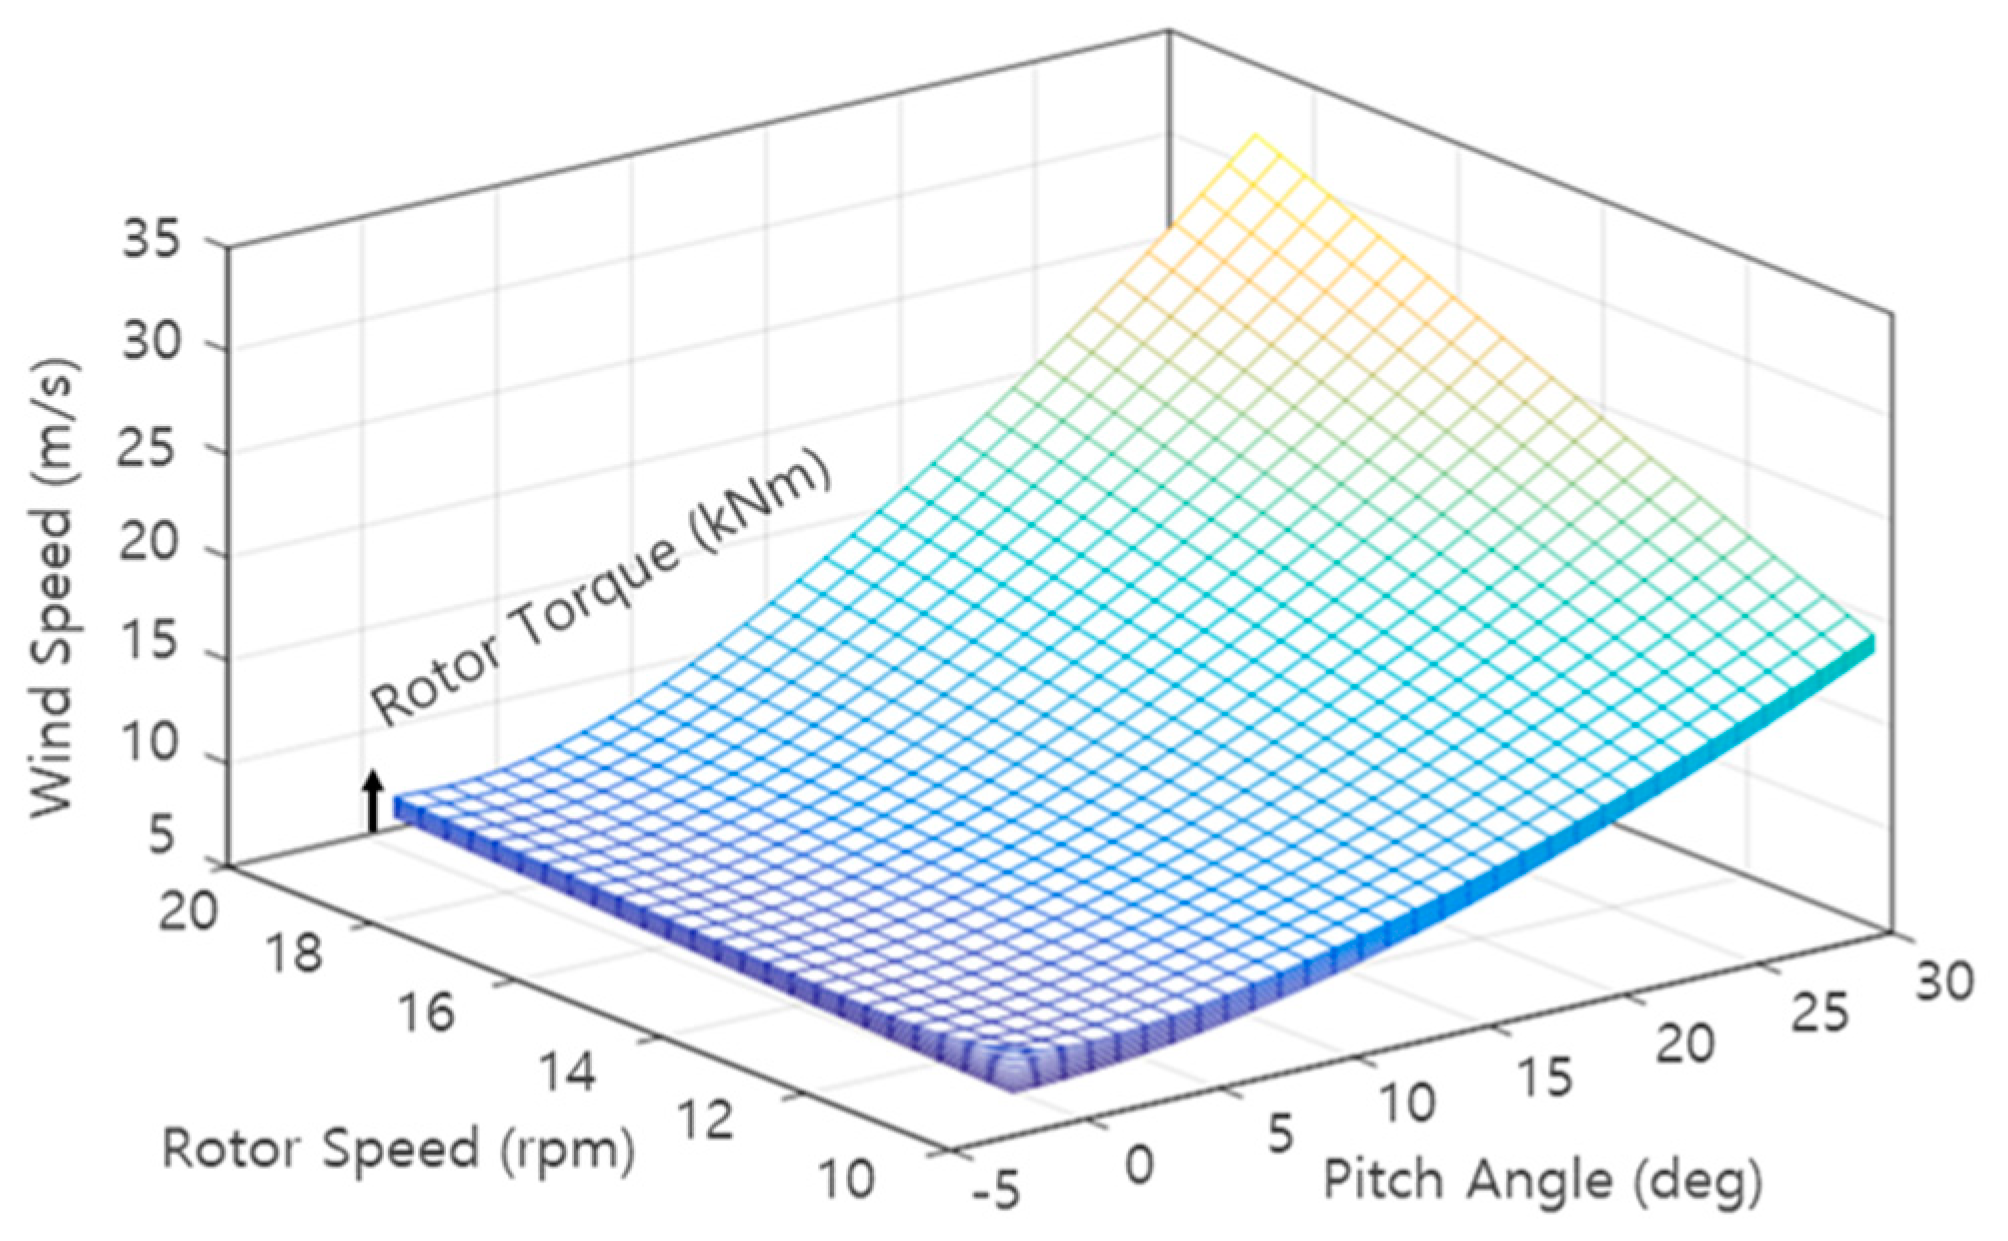
When the rotor torque, rotor speed, and the blade pitch angle are available, the associated equivalent wind speed can be estimated. The wind speed estimation process was conducted with various inputs of the rotor torque, pitch angle, and the rotor speed and a look-up table without a look-up table with an output of the equivalent wind speed with inputs of the rotor torque and two measured parameters (the pitch angle and the rotor speed) were constructed. For the look-up table construction, the density of air evaluated with the local annual average temperature and pressure, which is 1.076 kg/m3 was used.
Figure 2 shows the look-up table constructed to estimate the equivalent wind speed. For the look-up table, parameters of the target wind turbine that are described in Section 2.4 were used.
The available power is then calculated using Equation (4)
P avail , elc = 1 2 ρ a A V e q 3 C p ( V ) η m η e
where, P avail , elc is the available electrical power and η m is the mechanical loss. Equation (4) is the available electrical power considering the mechanical and electrical losses of the gearbox and the generator. In this study, the mechanical loss was assumed to be small, and the electrical loss in the form of a table provided by the wind turbine manufacturer was used. For the air density, ρ a , the value evaluated with the local annual average temperature and pressure, which is 1.076 kg/m3 was used.
The power coefficient is a one-dimensional look-up table having an input of wind speed and an output of power coefficient. The table was constructed based on the steady curves of wind turbine performances. In the region where the wind speed is lower than the rated wind speed of the target wind turbine, the look-up table yields the maximum value of the power coefficients. The look-up table yields values smaller than the maximum when the wind speed is higher than the rated wind speed. Figure 3 shows a schematic diagram of the available power estimator using the wind estimation.

2.3. Available Power Estimation without Using Drive-Train Model (Method 3)

In the drive-train model, the time derivative of rotor speed is estimated using the generator speed change in a time step divided by the gear ratio, N. The time step is normally 10 milliseconds for multi-megawatt wind turbines, and, therefore, the time derivative term is vulnerable to noises. This often yields sharp peaks in the rotor torque and also the wind speed estimations. Therefore, Equation (2) can be further approximated to be Equation (5).
T r = NT g / η e
In Equation (5), η e is the electromechanical conversion loss of the generator, N is the gear ratio, and T g is the measured generator torque. Using Equation (5) instead of Equation (2) also assumes that during a very short time interval (10 msec), the rotor speed variation will be small and approximately zero. The generator torque is normally measured using a torque meter attached to the high-speed shaft of the wind turbine. This is different from the torque command of a wind turbine controller because the electromechanical conversion loss is included in the measured generator torque.
After calculating the rotor torque, the available power can be obtained from the look-up table constructed in Section 2.2. without any modification.

2.4. Summary of Algorithms and the Target Wind Turbine

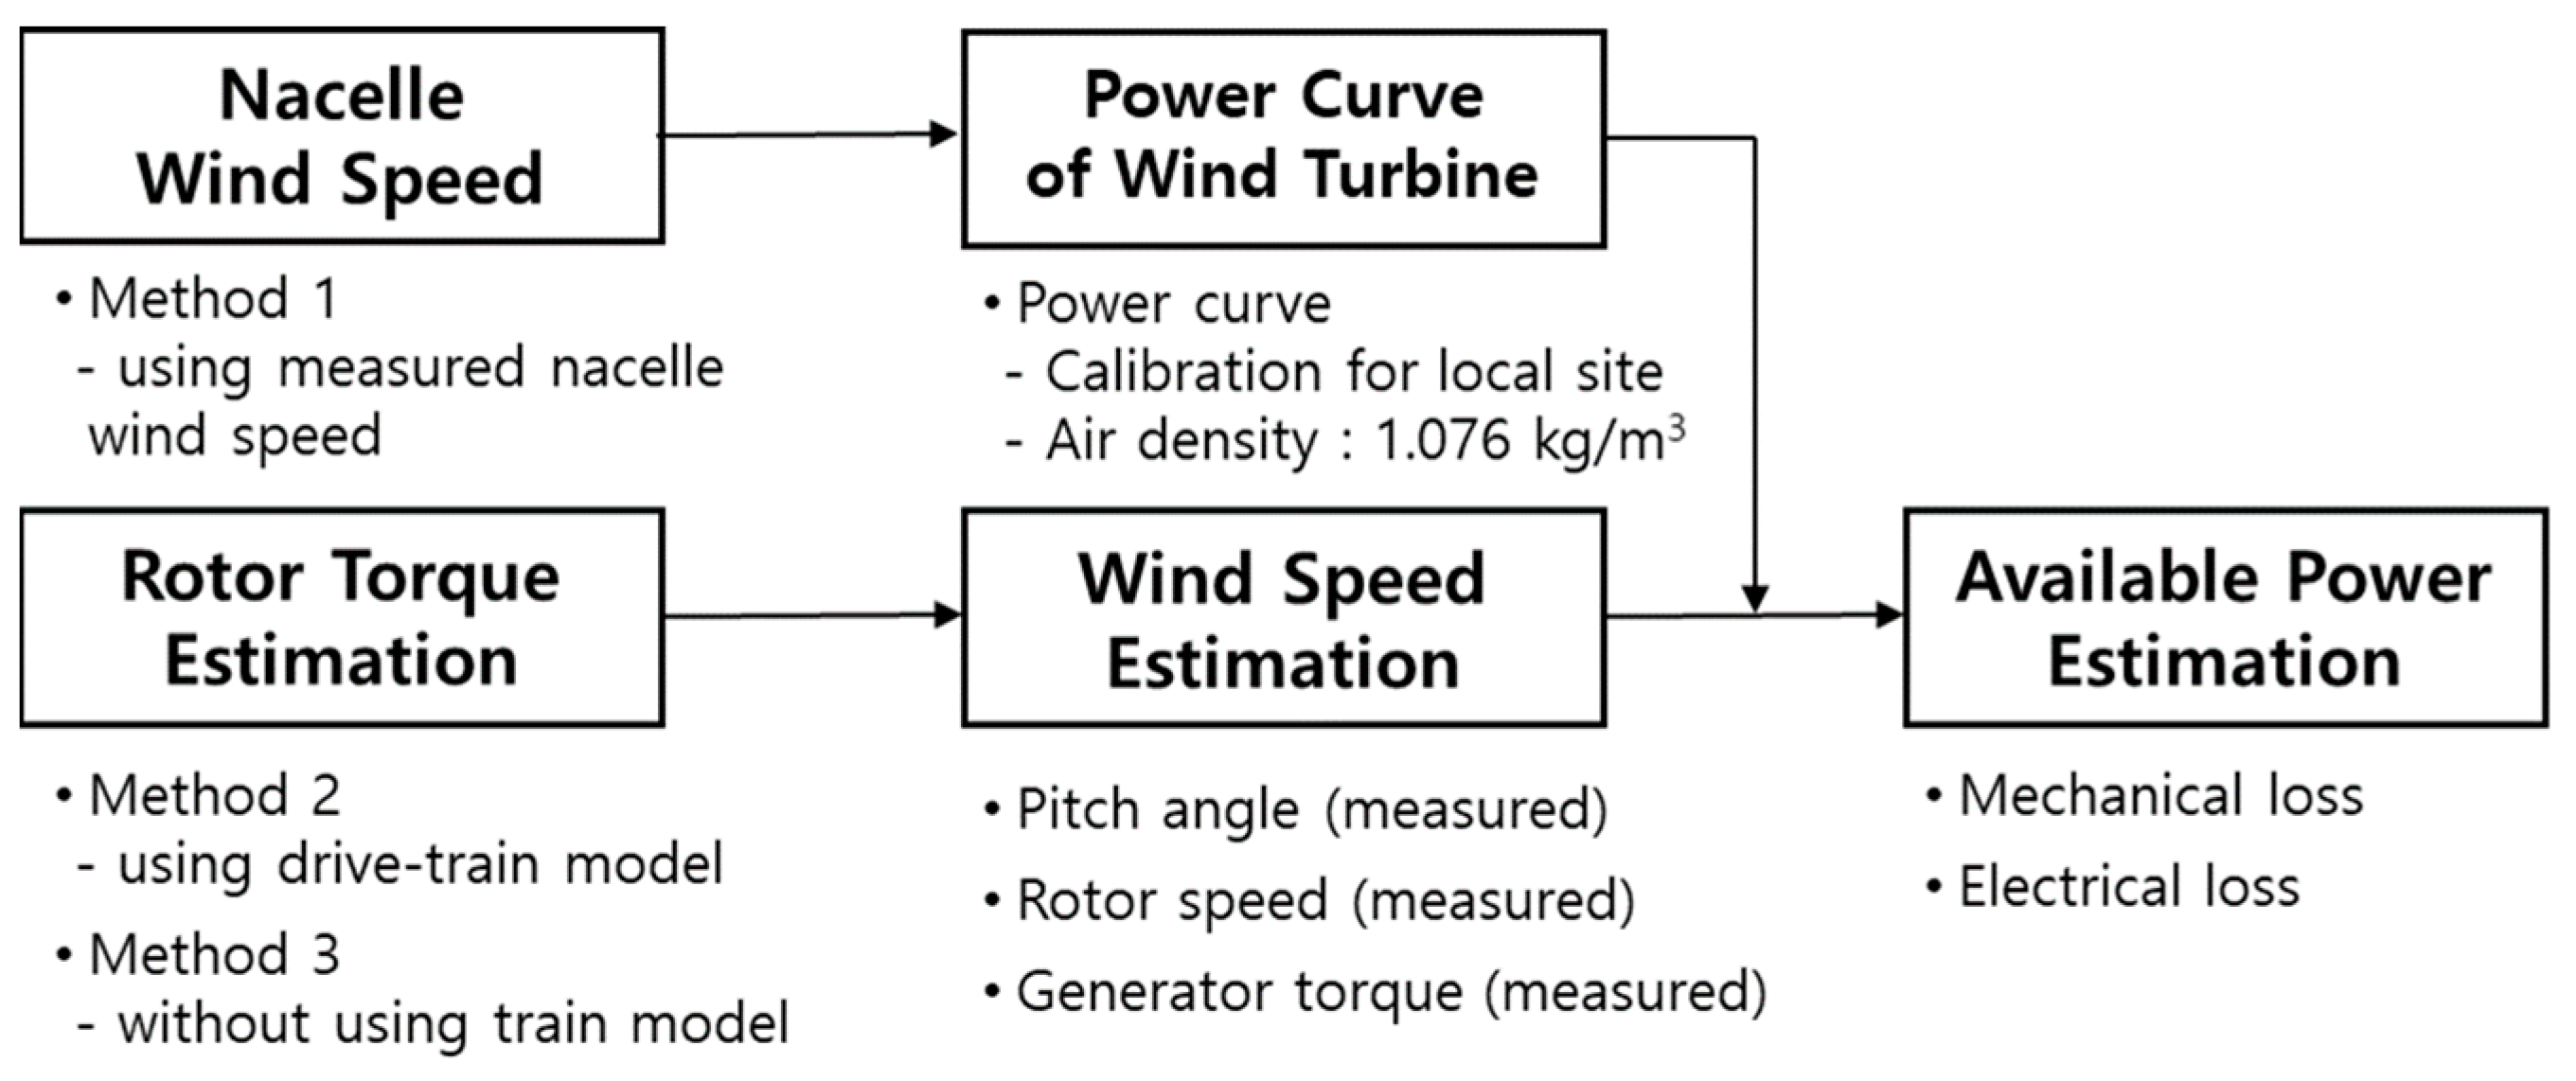
Figure 4 shows a flowchart of the overall procedure to estimate the available power. As can be seen in Figure 4, three different methods to estimate the rotor power are implemented in the algorithm for comparison.
The available power estimation algorithms were constructed for a multi-megawatt wind turbine. It is a wind turbine having a rated power of 2 MW and installed in a commercial wind farm in South Korea. Although the proposed available power estimation algorithms could not be implemented to the controller of the target wind turbine, the SCADA data provided by the operator were used as inputs in the available power estimator for validation.

3. Comparison of SCADA Data with Simulation Results

Figure 5 shows the schematic diagram of the available power estimator using the measured SCADA data for methods in Section 2.1, Section 2.2 and Section 2.3. Simulations were performed using the generator speed, pitch angle, and the generator torque obtained from the SCADA system of the target wind turbine, and the available powers were estimated by using three different methods presented in Section 2. The data measured with a sampling frequency of 50 Hz during the period from 18:50 to 19:20 on 13 September 2021 were used.

3.1. SCADA Data of Wind Turbine

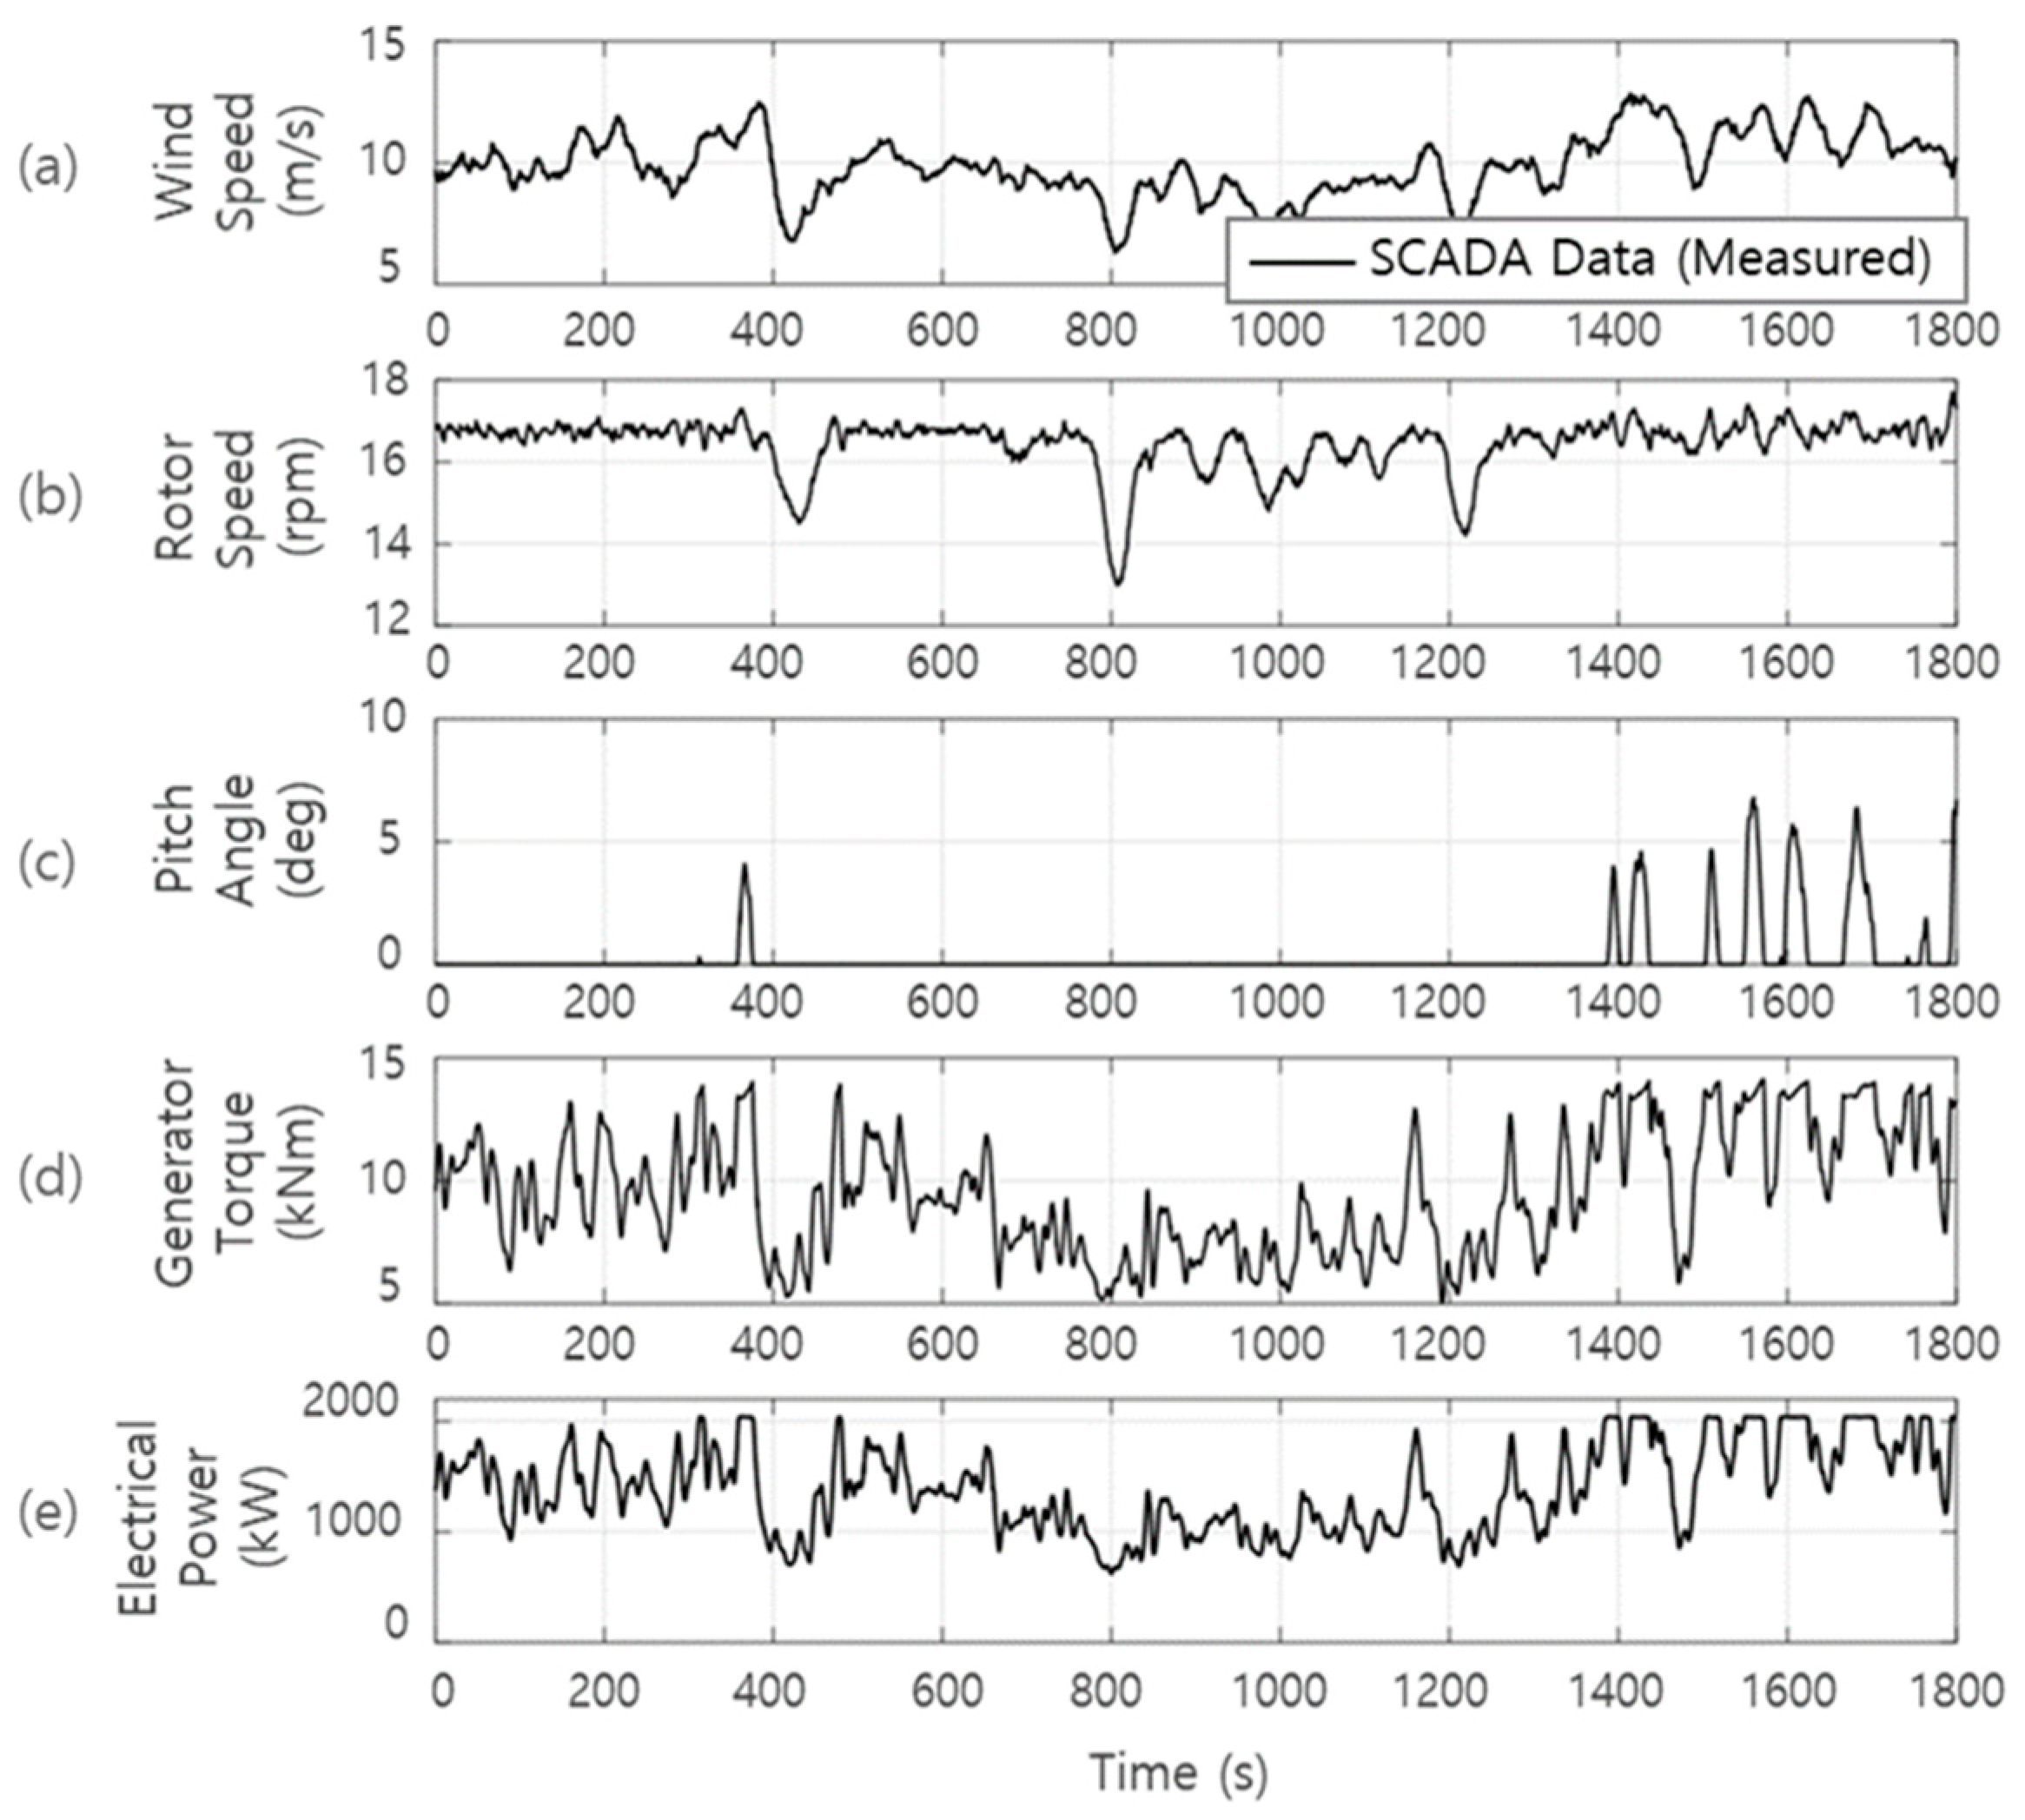
Figure 6 shows the SCADA data of the wind turbine used for the simulation. The measured nacelle wind speed in Figure 6a was used as an input for method 1 described in Section 2.1. As can be seen in the figure, the wind speed includes the turbulent components and varies up to about 40% of its maximum. Figure 6b shows the measure rotor speed of the wind turbine. Based on the figure, it can be found that the rotor speed is also fluctuating and varies up to about 20% of its maximum.
Figure 6c shows the measured blade pitch angle in degrees. Based on the figure, it can be found that the wind turbine is mostly operating in the control region of II which is the region where the wind speed is lower than the rated wind speed, and the wind turbine is operating with a fine pitch angle to achieve the maximum power coefficient. Sometimes blade pitching is performed to maintain the rated power.
Figure 6d shows the generator torque measured with a torque meter which is mounted on the high-speed shaft of the wind turbine. The generator torque in this case includes the electromechanical conversion loss of the generator.
The rotor speed, generator torque, and the blade pitch angle were used as inputs to methods 2 and 3 described in Section 2.2 and Section 2.3 to estimate the equivalent wind speed and the available power of the wind turbine.
Figure 6e shows the measured electrical power. The measured electrical power was not used as an input to the methods to estimate the available power of the wind turbine, but used to validate the available power estimation by comparison.

3.2. Simulation Results and Their Comparison with SCADA Data

Figure 7 shows the results of wind speed and available power estimation and their comparison with measured values. Figure 7a shows the measured Nacelle wind speed, and the equivalent wind speeds estimated by methods in Section 2.2 and Section 2.3, respectively. Although the wind speeds estimated are similar in magnitude to the measured Nacelle wind speed, have different peaks. This is because the wind speed estimated is the equivalent rotor averaged wind speed and therefore is different from the spot value of the wind speed measured on top of the Nacelle by an anemometer. For the two different wind speeds estimated by methods 2 and 3 in Section 2.2 and Section 2.3, they were very close but method 2 in Section 2.2 which uses the drive-train model seems to have more sharp peaks of the wind speed estimation. This is because the drive-train model has a first order time derivative term of the rotor speed.
Figure 7b shows the available powers estimated by three different methods described in Section 2.1, Section 2.2 and Section 2.3 and their comparison with the measured generated power. As shown in the figure, the available power estimated by the method using a nacelle wind speed and the power curve (method 1 in Section 2.1) has a different pattern with the measured generated power, and often deviates considerably from the measured generated power. Therefore, it doesn’t seem a good idea to use this method to estimate the available power of the wind turbine although this is the simplest method.
As shown in Figure 7b, the available powers estimated by methods 2 and 3 in Section 2.2 and Section 2.3 show similar patterns with the measured generator power. Both methods seem to give good results but, method 3 without the drive-train model shows the best performance. Like the wind speed estimation case, method 2 in Section 2.2 with the drive-train model, has more sharp peaks and often the peaks over-estimate the available power.
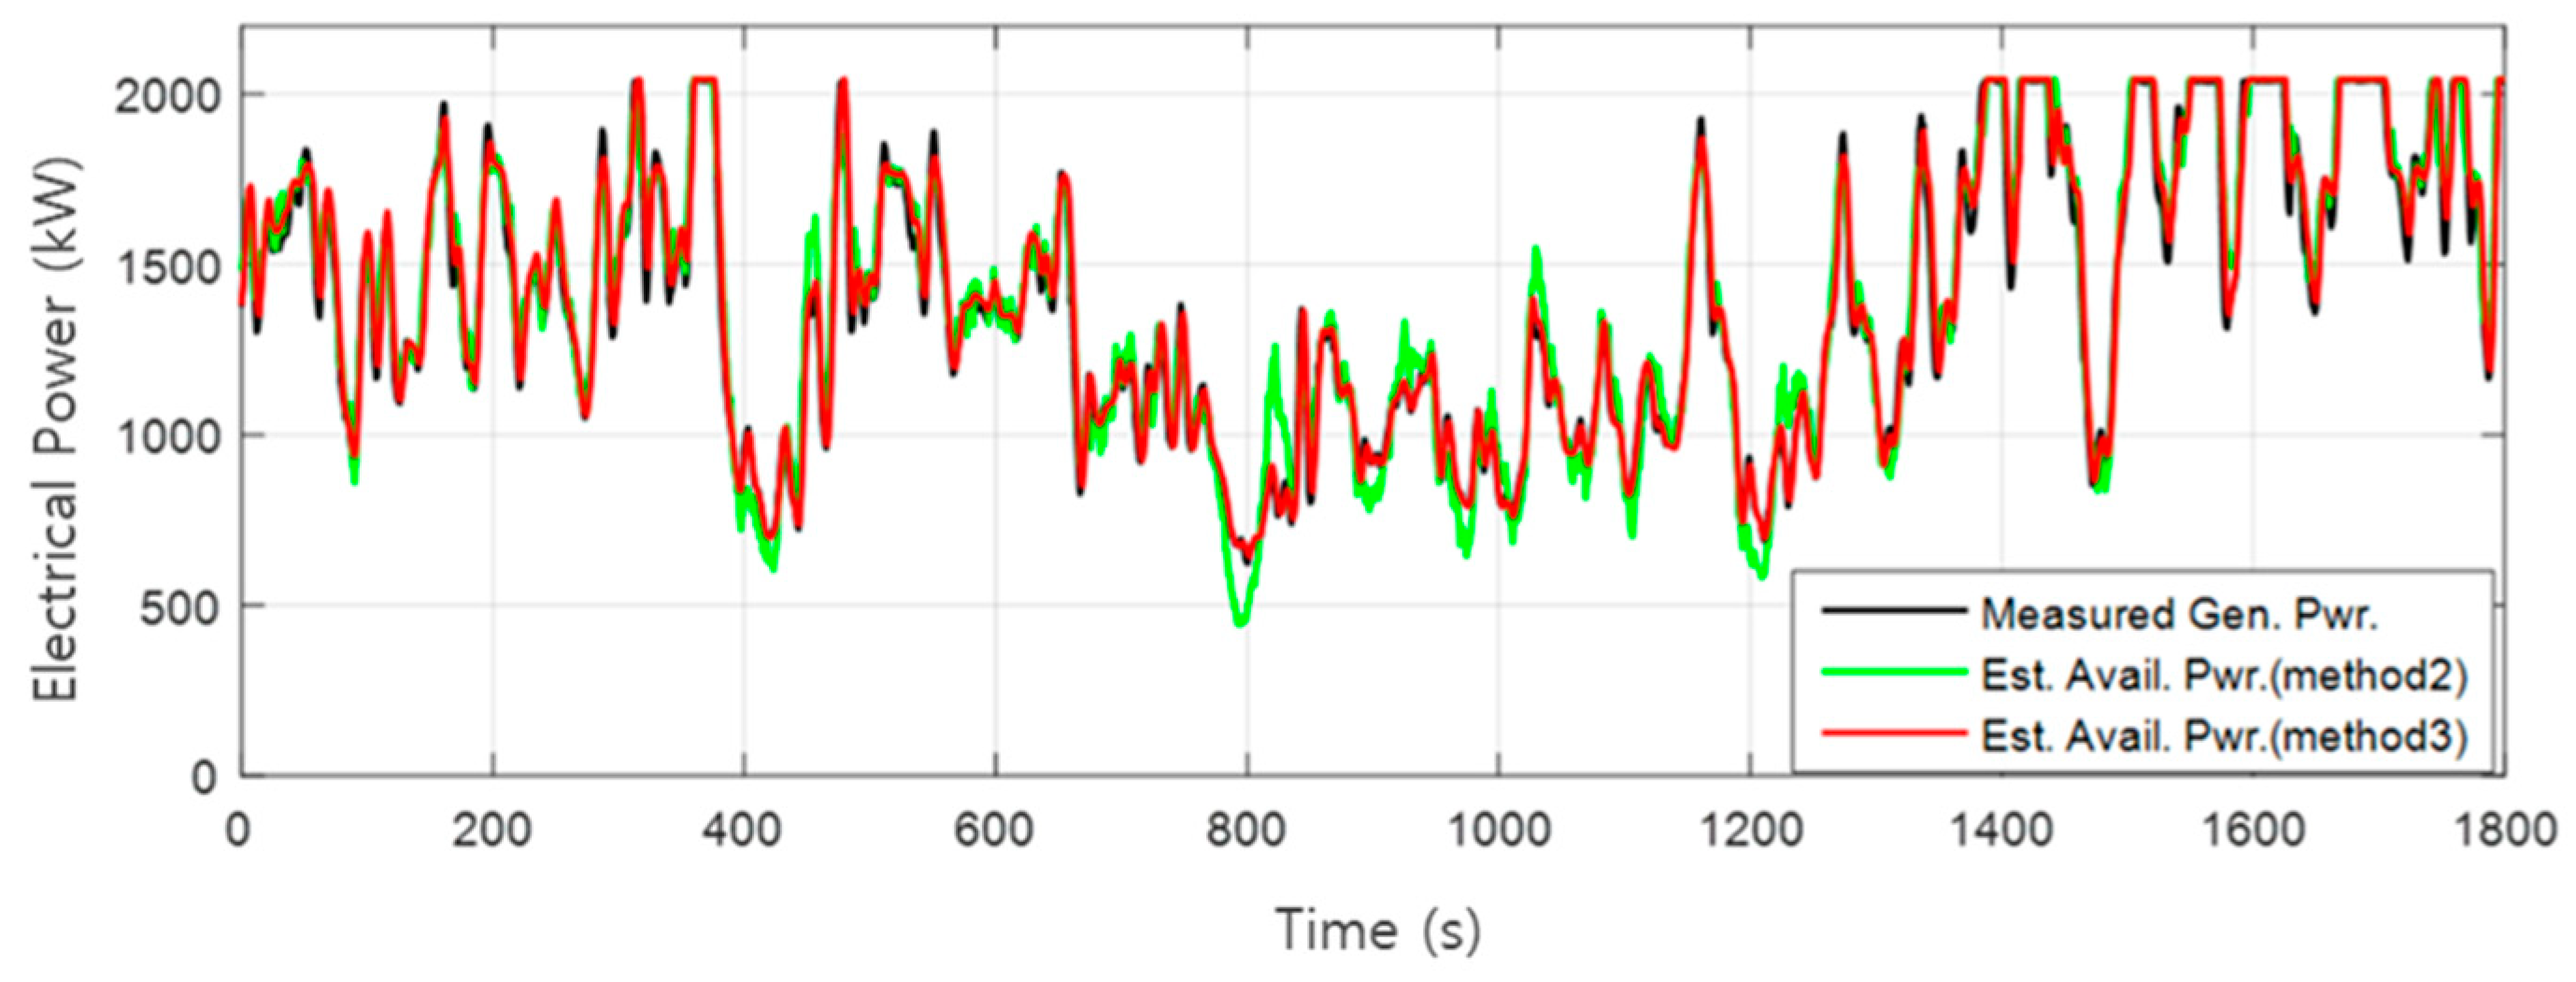
For better comparison, Figure 7b is replotted in Figure 8 without the result from method 1 in Section 2.1. As shown in the figure, it is clear that the available power estimated by the method in Section 2.3 gives the best performance. The result from method 2 often yields sharp peaks under-estimating or over-estimating the available power, and due to these peaks are not much shown in the results from method 3. This is again due to be the fact that method 2 uses the drive-train model which has a first order time-derivative term of the rotor speed as shown in Equation (2).
Table 1 shows the minimum, maximum and the average value of the measured generated power and the estimated available power by methods 1, 2 and 3 shown in Figure 7b. It can be seen from the table that the minimum values of the available power estimation by methods 1 and 2 are lower than the minimum value of the measured generated power and the errors are about −46.3% and −28.7%. The error of the minimum value from method 3 was 3.2% which is much smaller compared with the errors of methods 1 and 2. The maximum value of the available power estimation by the three different methods had a limit of 2044 kW which is the power calculated by the rated values of the generated speed and the torque. Although the maximum power reached the limit value for methods 2 and 3, the maximum from method 1 was found to be slightly smaller than the limit. The maximum value of the measured power was slightly higher than the limit because of the transient effect of the wind turbine operation in the field.

3.3. Quantitative Comparison of Simulation Results by Methods 1, 2, and 3

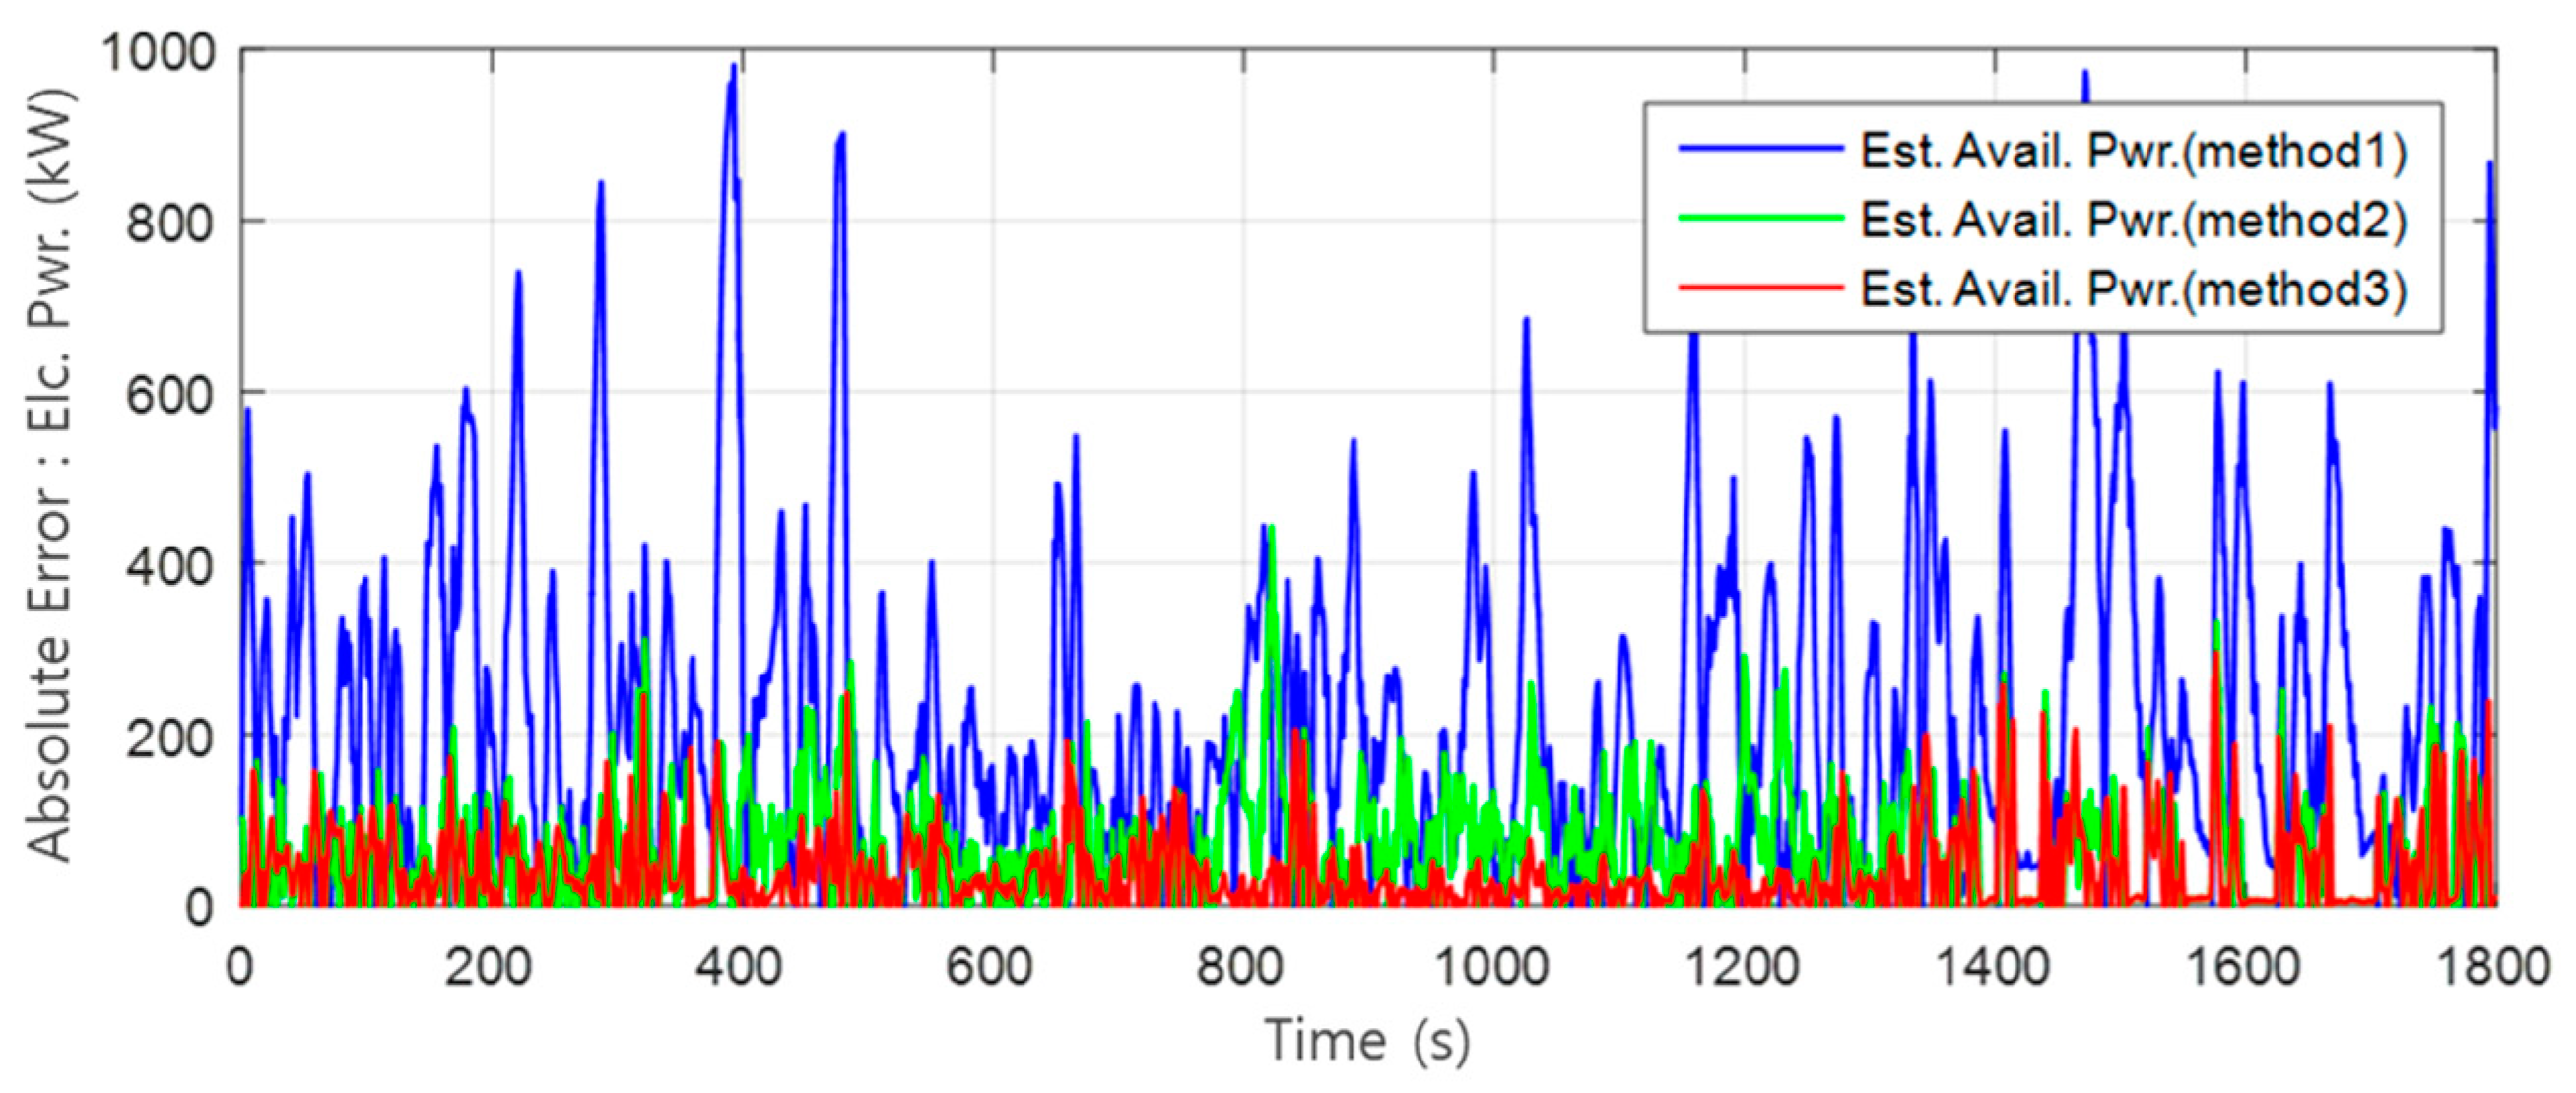
For the quantitative comparison of the available power estimation by methods 1, 2, and 3, the errors of estimation in absolute values for three different methods are plotted in Figure 9. As shown in the figure, the errors of estimation for method 1 showed the largest values and those for method 3 showed the smallest values like the expectation. For method 2, the errors of estimation were close to those for method 3 in some regions but they were close to those for method 1 in other regions. Therefore, it is clearly shown that the available power estimation by method 3 performs the best.
The root mean square error (RMSE), mean square error (MSE), and the mean absolute error (MAE) for the available power estimation by methods 1, 2, and 3 are shown in Table 2. As expected, the RMSE value from method 3 is lower than the RMSE values from methods 1 and 2. It can be seen that the available power estimation by method 3 reduces the RMSE value by 79.5% and 33.3% compared with the RMSE values by methods 1 and 2, respectively. The MSE value is reduced by 95.8% and 55.5% with the MSE values by methods 1 and 2. Also, the MAE value is reduced by 81.9% and 38.5% with method 3 compared with the MAE values by methods 1 and 2, respectively. Overall, method 3 clearly shows the best performance in the available power estimation as expected.

4. Discussion

Sometimes, wind turbines are operated to track the power commands from a higher-level wind farm controller, and the available power estimation in this DPPT (demanded power point tracking) case should be performed normally with the measured wind turbine data.
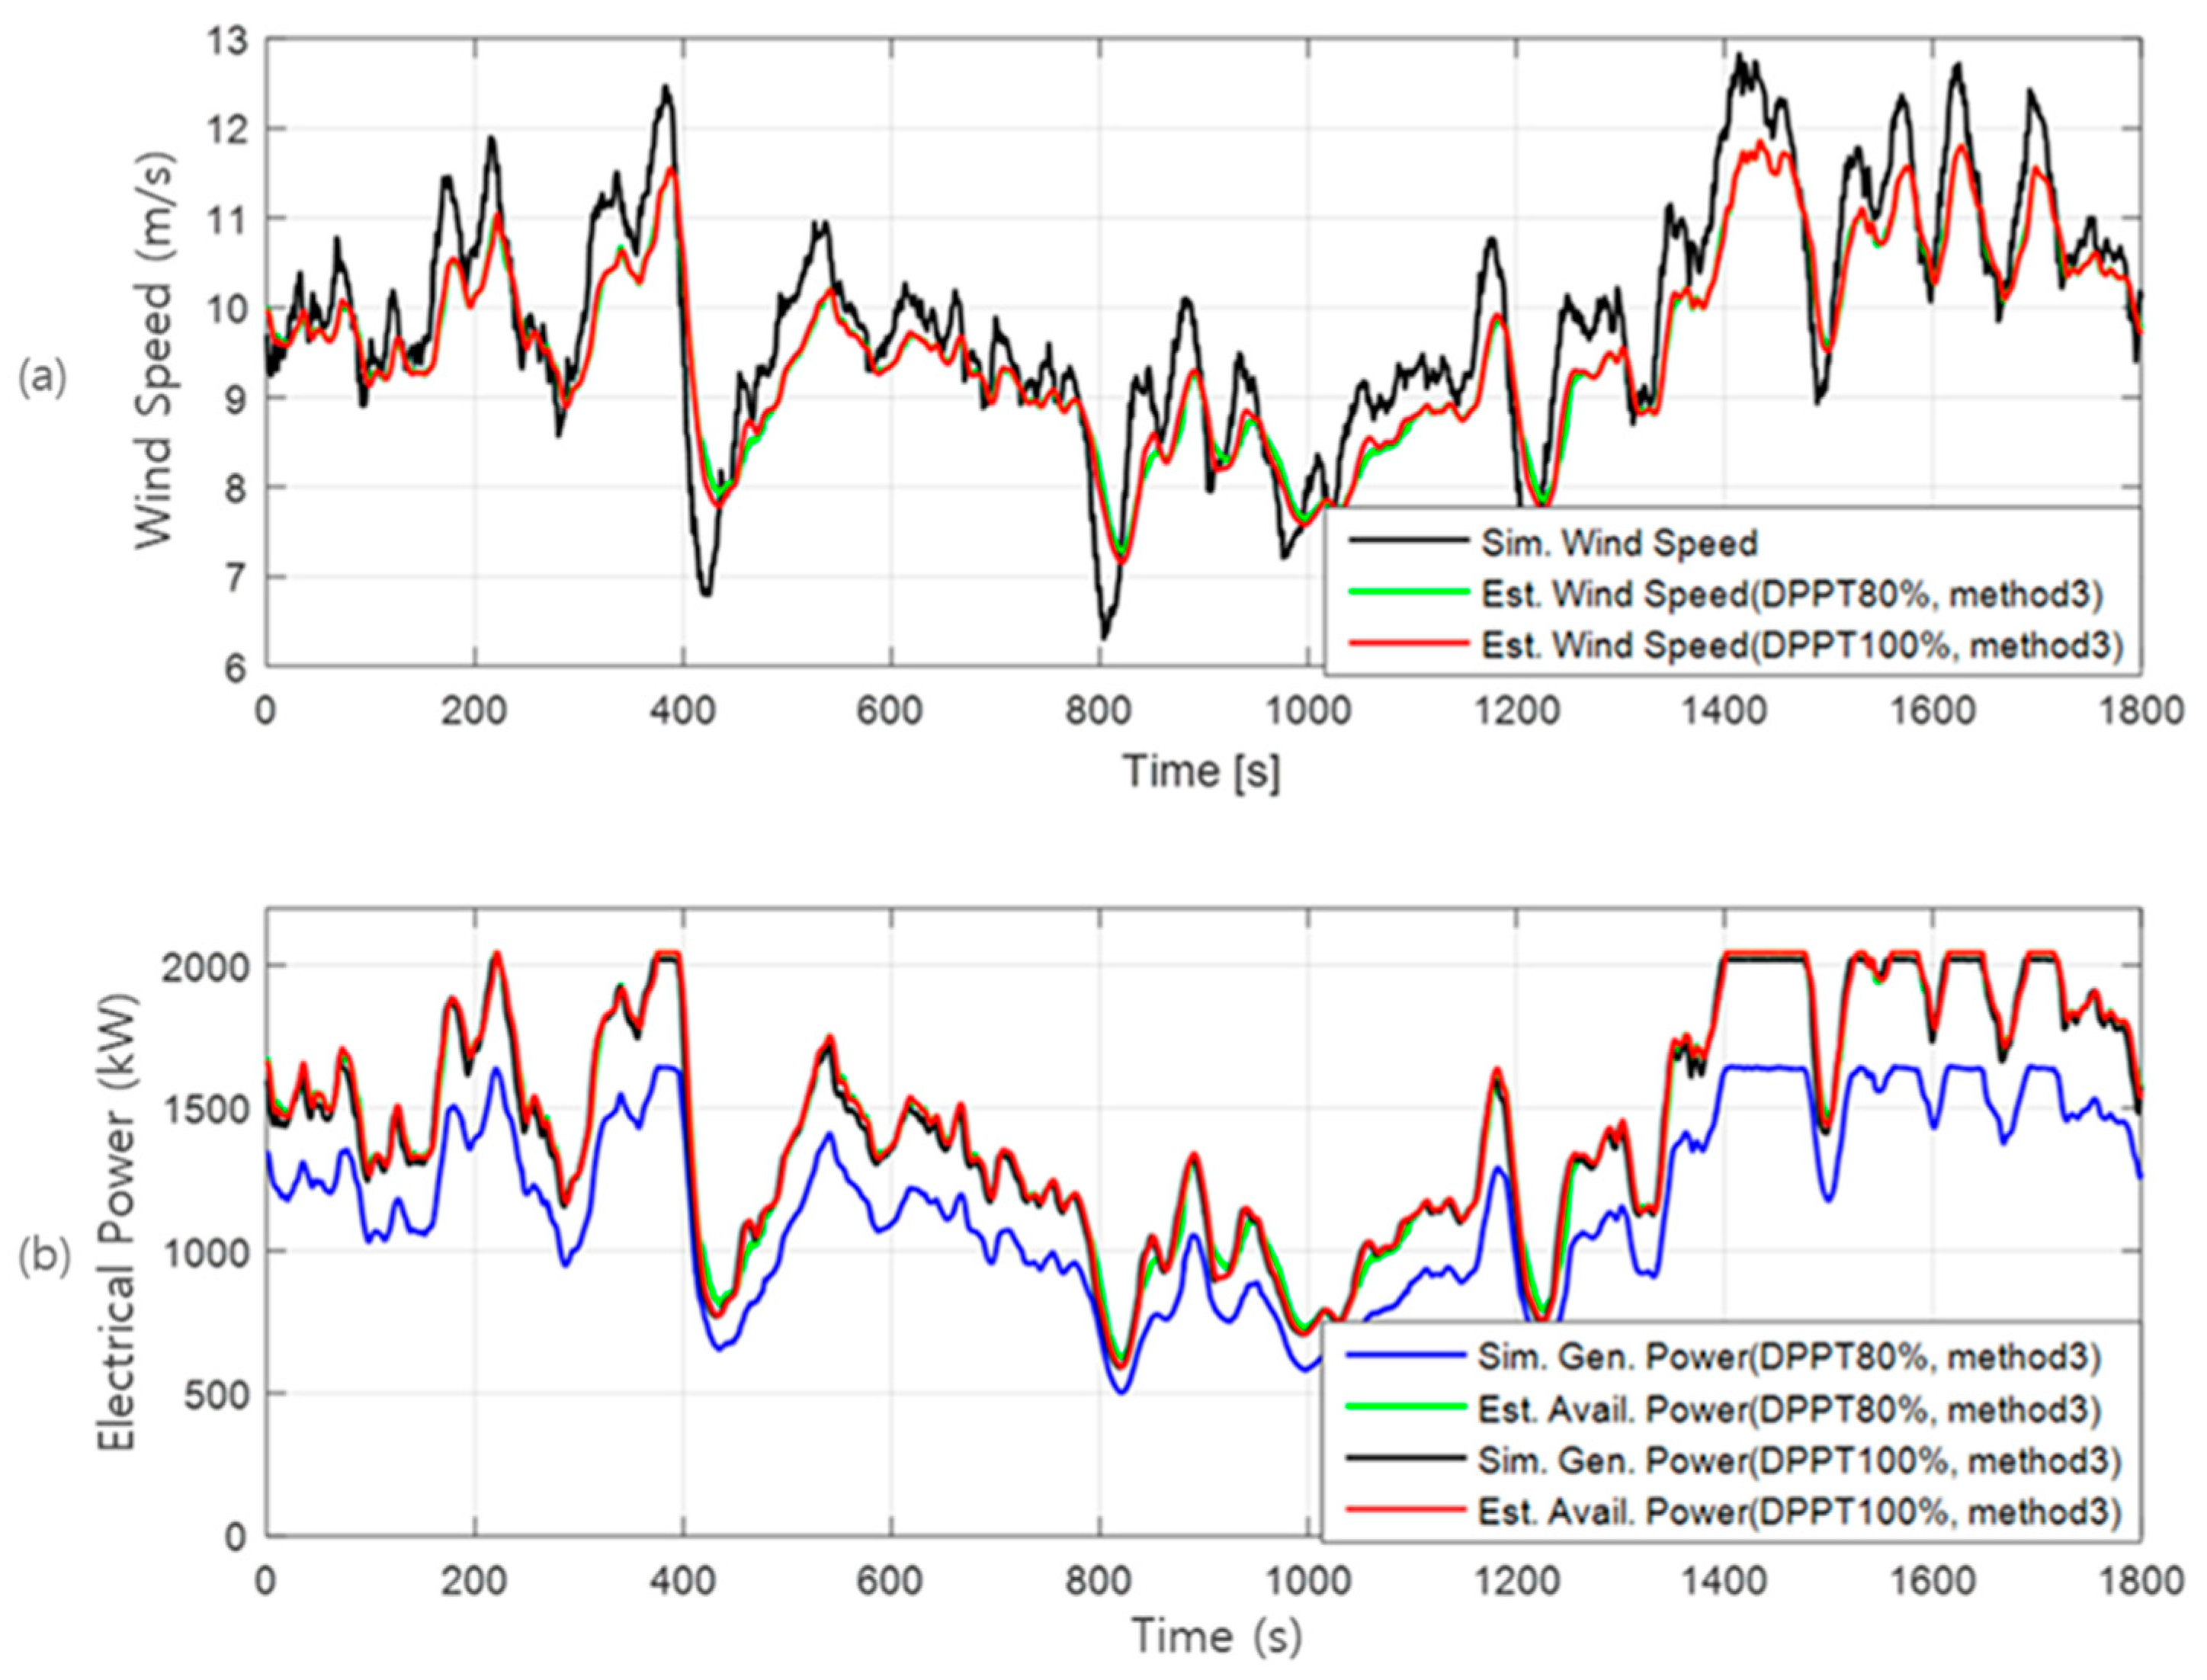
Therefore, the available power estimation algorithm in Section 2.3 (method 3) that showed the best performance was validated further through simulations using a Matlab/Simulink model that was designed based on specifications of the target wind turbine. The 100% DPPT operation is the case when the wind turbine receives a power command that is the same as the available power of the wind turbine. This is the same as the case when there is no power regulation command from a wind farm controller, and the wind turbine generates power as much as possible but not to exceed the rated power. The 80% DPPT operation is the operation that the wind turbine receives a power command that is only 80% in magnitude of the available power, and generates the 80% power of the available power although it can generate more power with the given wind speed.
Although a few different DPPT control algorithms can be used to track the power command from a higher-level controller, the pitch based method in Ref. [39] was used in this study. Detailed information on the control algorithm is available in the literature [39].
For the simulation, dynamic simulations were performed under 100% DPPT operation with a turbulent wind condition for 1800 s to obtain the generated power, first. A similar simulation was performed again with the same wind but under 80% DPPT operation, and the wind turbine parameters including the rotor speed, generated torque, and the blade pitch angle were used to estimate the equivalent wind speed and the available power of the wind turbine. The equivalent wind speed and the available power of the wind turbine obtained under 80% DPPT operation were compared with the simulation wind speed and the generated power under 100% DPPT operation.
Figure 10 shows the dynamic simulation results of the target wind turbine under both 100% and 80% DPPT operations. The simulations were conducted using 50 Hz frequency data of wind speed measured from 18:50:00 to 19:20:00 on 13 September 2021. Figure 10a illustrates the measured Nacelle wind speed used in the simulation, and the estimated wind speeds when 80% and 100% of DPPT control were applied. As can be seen in the figure, the estimated wind speeds were different from the input wind speed of the simulation because they represent the rotor averaged equivalent wind speed. However, the two wind speeds estimated with 80% and 100% DPPT operations were found to be very close. In addition, Figure 10b shows the estimated available powers and generated powers with 80% and 100% DPPT operations. As shown in the figure, although the wind turbine is operating under 80% DPPT operation, the available power estimation algorithm (method 3) worked well and yielded the available power close to the power generated with 100% DPPT operation. Also, the estimated available powers with both 80% and 100% DPPT operations were close to ensure that the algorithm could be used for different DPPT operations that sometimes occur in some real wind farms. Table 3 shows some quantitative simulation results. Based on the table, the available power estimation algorithm (method 3) is found to work correctly with different DPPT operations.

5. Conclusions

In this study, the algorithms to estimate the available power of a wind turbine were investigated and validated with the SCADA data obtained from a 2 MW commercial wind turbine. One method was to use the measured Nacelle wind speed, and the power curve. The other two methods were to estimate the equivalent wind speed first and to use the wind speed to estimate the available power. The two methods were similar but different in that the second method use the drive-train model to estimate the rotor torque but the third method didn’t use the drive-train model but used a simplified equation to estimate the rotor torque to avoid sharp peaks in the wind speed estimation.
For validation of the algorithms, the SCADA data obtained from a 2 MW wind turbine were used. The available power estimated from the three different methods were compared with the measured generated power of the wind turbine. It was found from the validation study that the third method is the best to estimate the available power. The first method used the measured Nacelle wind speed directly, but the high frequency wind speed fluctuations were not found in the generated powers because of the rotor inertia of the wind turbine. Therefore, the discrepancy between the available power estimation using the measured Nacelle wind speed and the generated power was large. The second method was good but had sharp peaks in the estimated wind speed and also the available power because of the time-derivative term of the rotor speed and showed slightly worse performance than the third method.
The third method was further validated to find out its performance under the DPPT operation that often occurs when the power output from a wind farm needs to be controlled. From the simulation with the 80% DPPT case, it was found that the third method worked well like the 100% DPPT case which is equivalent to the normal wind turbine operation without any command from a higher-level wind farm controller. The proposed method (method 3) for the available power estimation of a wind turbine can be used for the wind farm control algorithms such as the power derating based active induction control. For the power derating based induction control to work appropriately to increase the total wind farm power output, the power commands to the individual upstream wind turbines should be always slightly lower than their available powers, and, therefore, wrong estimation of the available power estimation results in wrong power commands to the wind turbines, and, finally, power decrease rather than power increase in the wind farm. The proposed method (method 3) for the available power estimation of a wind turbine is expected to reduce such undesirable power decrease in the power derating based active induction control situation.
As a future work, the proposed available power estimation by method 3 will be implemented to a wind farm simulation tool to find out the accuracy of the method will be good enough to be used for the power derating based wind farm control, and improvements on the method to increase the estimation accuracy will be performed. Also, a field test of the active-induction wind farm control algorithm with the proposed available power estimation will be performed in a wind farm.

Author Contributions

Conceptualization, D.K. (Dongmyoung Kim) and T.J.; Methodology, D.K. (Dongmyoung Kim); Software, D.K. (Dongmyoung Kim); Supervision, I.P.; Validation, D.K. (Dongmyoung Kim) and T.J.; investigation, D.K. (Dongmyoung Kim); data curation, D.K. (Dongmyoung Kim) and D.K. (Daeyoung Kim); Writing—original draft, D.K. (Dongmyoung Kim); Writing—review & editing, I.P. All authors have read and agreed to the published version of the manuscript.

Funding

This work was supported by the New and Renewable Energy-Core Technology Program of the Korea Institute of Energy Technology Evaluation and Planning (KETEP) with a granted financial resource from the Ministry of Trade, Industry and Energy, Korea (Grants. No. 20183010025440).

Institutional Review Board Statement

Not applicable.

Informed Consent Statement

Not applicable.

Data Availability Statement

Not applicable.

Conflicts of Interest

The authors declare no conflict of interest.

References

  1. “Hitting the Targets” The Case for Ethical and Empowering Population Policies to Accelerate Progress towards the Sustainable Development Golas. Available online: https://populationmatters.org/sites/default/files/Hitting%20the%20Targets%20-%20Population%20and%20the%20SDGs.pdf (accessed on 25 March 2022).
  2. Buonocore, J.J.; Choma, E.; Villavicencio, A.H.; Spengler, J.D.; Koehler, D.A.; Evans, J.S.; Lelieveld, J.; Klop, P.; Sanchez-Pina, R. Metrics for the sustainable development goals: Renewable energy and transportation. Palgrave Commun. 2019, 5, 12019. [Google Scholar] [CrossRef]
  3. Jianzhong, X.U.; Assenova, A.; Erokhin, V. Renewable energy and sustainable development in a resource-abundant country: Challenges of wind power generation in Kazakhstan. Sustainability 2018, 10, 3315. [Google Scholar] [CrossRef] [Green Version]
  4. Manwell, J.F.; Mcgowan, J.G.; Rogers, A.L. Wind Energy Explained, 2nd ed.; John Wiley and Sons Ltd.: Hoboken, NJ, USA, 2009. [Google Scholar]
  5. Hassan, A.; Rehman, A.U.; Shabbir, N.; Hassan, S.R.; Sadiq, M.T.; Arshad, J. Impact of Inertial Response for the Variable Speed Wind Turbine. In Proceedings of the 2019 International Conference on Engineering and Emerging Technologies, Lahore, Pakistan, 21–22 February 2019. [Google Scholar]
  6. Asif, R.M.; Ur Rehman, A.; Ur Rehman, S.; Arshad, J.; Hamid, J.; Tariq Sadiq, M.; Tahir, S. Design and analysis of robust fuzzy logic maximum power point tracking based isolated photovoltaic energy system. Eng. Rep. 2020, 2, e12234. [Google Scholar] [CrossRef]
  7. Siddique, M.A.B.; Khan, M.A.; Asad, A.; Rehman, A.U.; Asif, R.M.; Rehman, S.U. Maximum Power Point Tracking with Modified Incremental Conductance Technique in Grid-Connected PV Array. In Proceedings of the 5th International Conference on Innovative Technologies in Intelligent Systems and Industrial Applications, Sydney, Australia, 25–27 November 2020. [Google Scholar]
  8. Lackner, M.A.; Elkinton, C.N. An analytical framework for offshore wind farm layout optimization. Wind Eng. 2007, 31, 12007. [Google Scholar] [CrossRef]
  9. González, J.S.; Rodriguez, A.G.G.; Mora, J.C.; Santos, J.R.; Payan, M.B. Optimization of wind farm turbines layout using an evolutive algorithm. Renew. Energy 2010, 35, 82010. [Google Scholar] [CrossRef]
  10. Herbert-Acero, J.F.; Probst, O.; Réthoré, P.E.; Larsen, G.C.; Castillo-Villar, K.K. A review of methodological approaches for the design and optimization of wind farms. Energies 2014, 7, 6930–7016. [Google Scholar] [CrossRef]
  11. Kristoffersen, J.R. The Horns Rev wind farm and the operational experience with the wind farm main controller. Rev. E-Soc. R. Belg. Électriciens 2006, 122, 22006. [Google Scholar]
  12. Soleimanzadeh, M.; Wisniewski, R. Controller design for a wind farm, considering both power and load aspects. Mechatronics 2011, 21, 42011. [Google Scholar] [CrossRef]
  13. Kanev, S.; Bot, E.; Giles, J. Wind Farm Loads under Wake Redirection Control. Energies 2020, 13, 4088. [Google Scholar] [CrossRef]
  14. Steinbuch, M.; De Boer, W.W.; Bosgra, O.H.; Peeters, S.A.W.M.; Ploeg, J. Optimal control of wind power plants. J. Wind Eng. Ind. Aerodyn. 1988, 27, 237–246. [Google Scholar] [CrossRef]
  15. Kim, H.; Kim, K.; Paek, I. Model based open-loop wind farm control using active power for power increase and load reduction. Appl. Sci. 2017, 7, 1068. [Google Scholar] [CrossRef] [Green Version]
  16. Kim, H.; Kim, K.; Paek, I. Power regulation of upstream wind turbines for power increase in a wind farm. Int. J. Precis. Eng. Manuf. 2016, 17, 52016. [Google Scholar] [CrossRef]
  17. Kim, H.; Kim, K.; Paek, I.; Bottasso, C.L.; Campagnolo, F. A Study on the Active Induction Control of Upstream Wind Turbines for total power increases. J. Phys. Conf. Ser. 2016, 753, 32016. [Google Scholar] [CrossRef] [Green Version]
  18. Johnson, K.E.; Thomas, N. Wind Farm Control: Addressing the Aerodynamic Interaction among Wind Turbines. In Proceedings of the 2009 American Control Conference, St. Louis, MO, USA, 10–12 June 2009; pp. 2104–2109. [Google Scholar]
  19. Baskut, O.; Ozgener, O.; Ozgener, L. Second law analysis of wind turbine power plants: Cesme, Izmir example. Energy 2011, 36, 2535–2542. [Google Scholar] [CrossRef]
  20. Oh, Y.O.; Paek, I.S.; Nam, Y.S.; La, Y.H. Study on the Available Power of a Wind Turbine for Wind Farm Control. J. Korean Sol. Energy Soc. 2014, 34, 12014. [Google Scholar]
  21. Spudić, V.; Jelavić, M.; Baotić, M. Wind turbine power references in coordinated control of wind farms. Automatika 2011, 52, 22011. [Google Scholar] [CrossRef]
  22. Cutler, N.J.; Outhred, H.R.; MacGill, I.F. Using nacelle-based wind speed observations to improve power curve modeling for wind power forecasting. Wind Energy 2012, 15, 22012. [Google Scholar] [CrossRef]
  23. Hansen, A.D.; Sørensen, P.; Iov, F.; Blaabjerg, F. Centralised power control of wind farm with doubly fed induction generators. Renew. Energy 2006, 31, 72006. [Google Scholar] [CrossRef]
  24. Ebrahimi, F.M.; Khayatiyan, A.; Farjah, E. A novel optimizing power control strategy for centralized wind farm control system. Renew. Energy 2016, 86, 399–408. [Google Scholar] [CrossRef]
  25. Vali, M.; Petrović, V.; Steinfeld, G.; Y Pao, L.; Kühn, M. An active power control approach for wake-induced load alleviation in a fully developed wind farm boundary layer. Wind Energy Sci. 2019, 4, 12019. [Google Scholar] [CrossRef] [Green Version]
  26. Aksoy, B.; Selbaş, R. Estimation of Wind Turbine Energy Production Value by Using Machine Learning Algorithms and Development of Implementation Program. Energy Sources Part A Recovery Util. Environ. Eff. 2021, 43, 692–704. [Google Scholar] [CrossRef]
  27. Astolfi, D.; Pandit, R. Multivariate Wind Turbine Power Curve Model Based on Data Clustering and Polynomial LASSO Regression. Appl. Sci. 2021, 12, 72. [Google Scholar] [CrossRef]
  28. Wu, W.; Peng, M. A data mining approach combining $ k $-means clustering with bagging neural network for short-term wind power forecasting. IEEE Internet Things J. 2017, 4, 979–986. [Google Scholar] [CrossRef] [Green Version]
  29. Wu, Z.; Li, Y.; Xiao, Y. Nacelle anemometer measurement-based extremum-seeking wind turbine region-2 control for improved convergence in fluctuating wind. Wind Energy 2020, 23, 1118–1134. [Google Scholar] [CrossRef]
  30. Lydia, M.; Kumar, S.S.; Selvakumar, A.I.; Kumar, G.E.P. A comprehensive review on wind turbine power curve modeling techniques. Renew. Sustain. Energy Rev. 2014, 30, 452–460. [Google Scholar] [CrossRef]
  31. Smaïli, A.; Masson, C. On the rotor effects upon nacelle anemometry for wind turbines. Wind Eng. 2004, 2, 695–713. [Google Scholar] [CrossRef]
  32. Wang, X.; Liu, Y.; Wang, L.; Ding, L.; Hu, H. Numerical study of nacelle wind speed characteristics of a horizontal axis wind turbine under time-varying flow. Energies 2019, 12, 3993. [Google Scholar] [CrossRef] [Green Version]
  33. Song, Y.; Paek, I. Prediction and Validation of the Annual Energy Production of a Wind Turbine Using WindSim and a Dynamic Wind Turbine Model. Energies 2020, 13, 6604. [Google Scholar] [CrossRef]
  34. Kim, H.G.; Kim, J.Y. Analysis of wind turbine aging through operation data calibrated by LiDAR measurement. Energies 2021, 14, 2319. [Google Scholar] [CrossRef]
  35. Sipeng, H.; Yangfei, Z.; Xianyun, L.; Yue, Y. Equivalent Wind Speed Model in Wind Farm Dynamic Analysis. In Proceedings of the International Conference on Electric Utility Deregulation and Restructuring and Power Technologies, Weihai, China, 6–9 July 2011; pp. 1751–1755. [Google Scholar]
  36. Shi, W.; Kim, C.W.; Chung, C.W.; Park, H.C. Dynamic modeling and analysis of a wind turbine drive-train using the torsional dynamic model. Int. J. Precis. Eng. Manuf. 2013, 14, 12013. [Google Scholar] [CrossRef]
  37. Nam, Y.S.; Kim, J.G.; Paek, I.S.; Moon, Y.H.; Kim, S.J.; Kim, D.J. Feedforward pitch control using wind speed estimation. J. Power Electron. 2011, 11, 211–217. [Google Scholar] [CrossRef]
  38. Nam, Y. Wind Turbine System Control, 1st ed.; GS Intervision: Seoul, Korea, 2013. [Google Scholar]
  39. Kim, K.; Kim, H.G.; Kim, C.J.; Paek, I.; Bottasso, C.L.; Campagnolo, F. Design and validation of demanded power point tracking control algorithm of wind turbine. Int. J. Precis. Eng. Manuf. Green Technol. 2018, 5, 387–400. [Google Scholar] [CrossRef]
  40. Kim, K.; Kim, H.; Paek, I.; Kim, H.G.; Son, J. Field validation of demanded power point tracking control algorithm for medium-capacity wind turbine. Int. J. Precis. Eng. Manuf. Green Technol. 2019, 6, 875–881. [Google Scholar] [CrossRef]
  41. International Electrotechnical Commission (IEC). Wind Turbine Generator Systems Part 12-1: Power Performance Measurements of Electricity Producing Wind Turbines, 2nd ed.; International Electrotechnical Commission (IEC): Geneva, Switzerland, 2017. [Google Scholar]
Figure 1. Available power estimation method using nacelle anemometer for the target wind turbine.
Energies 15 02648 g001
Figure 2. Three-dimensional look-up table for wind estimation.
Energies 15 02648 g002
Figure 3. Schematic block diagram of the available power estimator.
Energies 15 02648 g003
Figure 4. Flow chart of the available power estimation algorithm.
Energies 15 02648 g004
Figure 5. Simulation model to validate performance using SCADA data.
Energies 15 02648 g005
Figure 6. Measured data of target wind turbine in the actual site. (a) Wind speed; (b) Rotor speed; (c) Pitch angle; (d) Generated torque; and (e) Electrical power.
Energies 15 02648 g006
Figure 7. Simulation results and their comparison with measured data: (a) Wind speed; and (b) Electrical power.
Energies 15 02648 g007
Figure 8. Estimated available powers and their comparison with measured data (replotted).
Energies 15 02648 g008
Figure 9. Comparison of absolute value of error in the estimated available power by methods 1, 2, and 3.
Energies 15 02648 g009
Figure 10. Comparison of estimated available power and generated power in 80% and 100% DPPT operations (a) Input simulation wind speed (measured) and estimated wind speed; and (b) generated power from simulation and estimated available power.
Energies 15 02648 g010
Table 1. Comparison of estimated available power by methods 1, 2, and 3 with measured generated power.
MethodsElectrical Power (kW, %)
Min.ErrorMax.ErrorMean.Error
Measured. Gen. Pwr.622.4-2045.3-1384.7-
Method 1334.1−46.31998.5−2.31344.6−2.9
Method 2443.8−28.72044.1−0.11403.41.4
Method 3642.53.22044.1−0.11398.61.0
Table 2. Comparison of RMSE, MSE and MAE for estimated available power by methods 1, 2, and 3.
MethodsRMSE (kW)MSE (kW)MAE (kW)
Method 1291.384843.7226.2
Method 289.27956.766.5
Method 359.53535.640.9
Table 3. Comparison of simulation results according to DPPT operations.
PropertiesWind Speed (m/s)Generated Power (kW)Available Power (kW)
MeanErrorMeanErrorMeanError
Simulation Condition 9.9-----
DPPT (100%)9.6−3.01430.50.01458.00.0
DPPT (80%)9.6−3.01167.6−18.41456.1−0.1
Publisher’s Note: MDPI stays neutral with regard to jurisdictional claims in published maps and institutional affiliations.