Abstract
A company’s productivity and success measure its effectiveness. This article presents the problem of economic efficiency and aspects related to environmental protection. The basic parameters analysed were the engine type and how it affects the environment. Over three months, the analysis was carried out and used the data envelopment analysis. As a result of the research carried out, the comparison of the amount of fuel used with the amount of transported goods should answer the following questions: What type of engine should be ordered for new trucks to show the best efficiency during operation? What is the efficiency of the currently used engines? How do they affect the environment? The method proposed in the article makes it possible to define the initial requirements for the definition of truck units, which is included in the conclusions of this paper.
1. Introduction
The measure of a company’s productivity and success is its effectiveness. On the other hand, improving efficiency is the goal of any business. Therefore, there is no single, dedicated definition of the concept of effectiveness. Explanations should be adapted to the nature of a given branch of the economy, and above all, to the individual goals set in this area by a specific enterprise. The study aimed to measure the transport efficiency at the Bring Transportløsninger AS Tromso branch. The company’s transport activity focuses on inter-terminal tasks in the intermodal chain in Norway within the Posten AS group. A three-month study (September, October, November 2021) was carried out on a group of eight vehicles, the technical characteristics of which allowed for comparison. In linear transport between the terminals, the unified means of transport are a container and a semi-trailer.
Unified means of transport allow transporting cargo expressed in the number of available transport seats [1]. Efficiency in BTL AS is understood as the ratio of the number of transported pallets to the amount of fuel used over a 100 km distance between the terminals.
The study shows which road set, consisting of a particular lorry with a specific trailer, is the most effective. Road sets are similar, but not the same; assigned weights accommodate technical differences between vehicles. After standardisation, the data envelopment analysis (DEA) model was built. This model will be allowed to select the most effective road set from the tested group of cars. Three of the tested vehicles must be replaced with new ones shortly. The study results can be considered when selecting new vehicles for the BTL to match the most optimal cars to the work of the Tromso branch.
2. Literature Review
Transportation plays an essential role in the economic freedom of developing countries. The DEA technology can be used to evaluate the performance of the decision-making units (DMUs). The trade-off method with efficient binding surfaces is used to attain the weakly efficient DMUs. The marginal rates aid this trade-off analysis [2,3]. The DEA method has also found application in the 2019 analysis of the coronavirus disease (COVID-19). The pandemic is occurring worldwide and significantly impacts our economic and social systems, particularly the healthcare businesses transport and energy businesses [4]. As shown in extreme events, the idea of resilience is used to assess the chance of a transport system to resist and recover from disturbances. Inspired by the high cumulative effects of frequent noises on transport sectors, we explored robustness quantification as a performance estimation way for High Likelihood of Low Impact (HPLI) disturbance such as road congestion. Resilience-based indices are additional to classical travel-time indices in the bibliography [5]. Taking the standard of knowledge and engineering as the verification variable and the comparative scale proficiency as the threshold variable, some papers calculate the results of the ruthless scale of the labour force, education, economy, enterprise, and transportation on sustainable development efficiency [6]. Some research results show that the adjusted sample investment efficiency value significantly improves after excluding the environmental and random factors compared to the standing DEA. This indicates that environmental factors in miscellaneous regions diminish government capital expenditure, which implies that a conventional DEA model would undervalue efficiency of the investment [7,8].
To the best of our knowledge, other than above, there is a massive pile of literature on transportation growth and its effect on energy efficiency, considering other practical and applicable methods. In paper [5], Taboada examining roadways’ elasticity to recurrent congestions as a co-operator to sustainable activity, we suggested to estimate intensity with several properties that characterise the phase of demotion, the recovery stage, and practicable paths of recovery. These features were integrated into a productivity index using DEA as a non-parametric manner. The article [9] concerns the performance and durability of urban rail transport using exploratory data analysis and DEA. The paper [10] uses DEA to analyse the non-linear relationship between the intensity of economic contacts in tourism and the tourism industry’s performance by constructing a mixed-effects model. Xiang et al. [11] use the DEA about the eco-efficiency with which ecological resources are used to meet human needs. In another study, Song et al. [12] developed an index system. They applied a three-step DEA approach, which considers various regional environmental factors and statistical noise, to assess the operational performance of regional air transport systems. The paper [13] presents an optimisation model for biogas power plant feedstock mixture concerning feedstock and transportation costs using a DEA. In other works [13,14] on people’s economic and social life in cities, results on the impact of innovative solutions in urban transport on residents’ quality of life were discussed. DEA methods were also found in security systems [15] and transport analysis [16]. The paper [17] concludes that while much effort has been made to overcome the disadvantages of traditional equal aggregation in Data Volume Analysis cross-performance, the endogenous preference structures in the cross-performance matrix are still largely unexplored. Finally, the DEA method was used to study the effectiveness of intermodal terminals [18]. The DEA method is used in many other applications. For example, the study [18] was divided into three groups, i.e., buyers, self-use sellers, in and self-users (control group). The study used the DEA approach to estimate water use efficiency.
Inspired by the empirical observation, multiple model formulations have been developed to capture the relationship between power and fuel consumption, which was presented by Barth et al. in [19]. However, no studies on the specific selection of vehicles for particular tasks have been found. The analysis presented in the article shows the possibilities of using the DEA analysis in the choice of engines used in transport.
3. Methods
This section presents a general approach to the problem under consideration and the general methodology used to solve the given situation.
3.1. A General Look
Efficiency as a reference point or measure about other units considered in the compared set can be visualised in an index method, parametric or non-parametric way.
A prevalent method of presenting effectiveness is the index method, used in everyday life to compare two units in terms of the obtained results. More widely used in financial analysis. In this case, the data is obtained directly from enterprises’ financial statements (results). The development of the effectiveness here is an easily comparable figure. An example may be the net profit of the enterprise, which, in simple terms, is obtained by comparing all costs with all receipts of a given enterprise. We are used to this form of presentation of effectiveness. This habit and the diversity and ease of applications do not notice the adverse effects of using such a method. We see only a specific part of the comparison picture [18]. We regularly come across several types of balance sheets, comparisons and profitability analyses. In many areas of life, the results obtained are sufficient. They allow making choices at a relatively low cost of purchasing a given service or product. However, it is easy to manipulate the data in the indicator method. One factor or one unusual variant of the studied phenomenon may have an adverse or beneficial effect on the entire study. The index methods used in studying complex issues show only a fragment of the whole—precisely as the author wants to indicate. For example, when examining the effectiveness of enterprises, many factors influence the positive or negative net financial result of a given enterprise. The result reflects the current situation or the company’s condition, and even a sizeable positive profit may indicate a collapse and sale of assets. In the case of testing the efficiency of less complicated forms than large enterprises with the classical method, a benchmark is always needed, for example, in the efficiency test of easy transport by truck and trailer. We get a result representing X litres of fuel per 100 km. This information alone does not say whether it is a great, average, or tragic result. The impact alone does not indicate the type of transport performed. If the vehicle is conducted with a standard 40-ton truck set and consumes X fuel per 100 km and we compare it to a large truck set, which burns 2× per 100 km but carries 300 tons, we cannot say again how effective transport is. The method requires a large comparison group. Additionally, comparing it in a broad spectrum, the result will also be influenced by the topography, road congestion, traffic volume, weather conditions, type of tires, number of driving axles, etc. Without suitable reference quantities, the data in the index method does not show much [16].
The parametric approach is much richer. Usually, the obtained results are resistant to single variations. The same quality of statistical research makes the results much more precise and more accessible to interpret unambiguously. However, parametric analysis requires knowledge of the dependencies of functions between variables. In addition, it needs to make many assumptions and have a very detailed understanding of all aspects of the phenomenon under study. The method can be challenging to apply to the analysis of uncomplicated effectiveness structures. In the case of a transport efficiency test, the traffic volume on a given road section should be accurately measured; the exact route should be given, the composition and type of surface should be known, etc. The information obtained should be taken and compared with the amount of fuel used, for which some values should also be understood, including exact composition, viscosity, and refuelling temperature. All this means that all the parameters will be precisely accurate. Still, at the same time, this method is complicated to implement and difficult to apply for trucks carrying out the transport. The statistical approach is the most accurate, but at the same time excessive for the range of data under study.
If the tested objects have standard features that can be visualised, the outlays can be compared with the obtained results [17], provided that external factors will not influence the performance result. This method allows the index results to be extended with the parameters necessary for the correct effectiveness analysis. The obtained efficiency is always measured about the tested group of objects. At the same time, the set of measured things does not have to be as extensive as in the index method because we can standardise the units using appropriate weights. The size of the effect obtained is a consequence of the expenditure incurred. The creators of DEA proposed such a method. By comparing the obtained unit results with the obtained results of maximum efficiency, the technique creates a boundary (line) around the data points so that all results are either on this line (practical) or in the area under the bar (ineffective) [20]. In this study, the DEA model is optimal to indicate transport efficiency. Vehicles move along one road section creating a certain amplitude of traffic. Fuel is refuelled in one global network of gas stations with standards for the products sold. The vehicles were additionally characterised, and the transport unit unified the pallet. All these steps show that external factors do not affect transport efficiency. The study itself was conducted in two stages. In the first part, the number of transported pallet places was compared with the fuel consumed directly. However, weights were used to show and indicate the relatively most effective unit that changed the results. The study is to demonstrate the most effective team, but at the same time in such a way that this unit is comparable to other tested vehicles in the group.
3.2. Comparison of Resources
This study aims to answer the question: What is the most efficient truck in the presented vehicles (P1)?
Direct comparison is an elementary indicator of effectiveness. This ratio compares unit input to unit output and is called the partial productivity index [20]. The information obtained is one-dimensional, but it shows the primary data on a given issue. They work great if we count the number of products obtained in a selected unit of time (number of screws produced per hour). Transport efficiency can be measured in this way as long as the means of transport are the same in all respects and perform precisely the same work. (e.g., two forklifts load one semi-trailer with the same goods in the same place at the same time). Then, it can determine which is more effective. However, the matter becomes more complicated when the means of transport are similar but not the same, and the vehicles perform tasks with a common denominator. Still, the characteristics of these tasks are slightly different. It is certainly not possible to compare completely different modes of transport in this way, or from other modes of transportation (e.g., ship and train).
The presented fleet of vehicles at Bring Transportløsninger AS, Tromsø branch, is similar and can be used for the analysis. The cars were described taking into account the characteristics of the engines (500–540 HP) and the type of trailer they cooperate with. Regardless of the type of vehicle, its cargo space is always used in 100%. Cars usually run on the same stretch of the route. The list consists of 7 cars travelling on the Tromsø-Narvik route and 1, which provides an inter-terminal transport on the Tromsø-Tana route. The type of car and trailer used in this other route is the same as some vehicles from the primary group. It can therefore be taken into account in the analysis. Vehicles carrying BDF containers and hauling trailers are considered “equipment”. For standardisation and a more accessible illustration of the transport capacity, the number of pallet places transported by a given road set is given. This value specifies the comparative aspect referred to when conducting the analysis.
3.3. Data
The data used for the analysis comes from the sensor system and the software with which the vehicles are retrofitted. Information has been standardised for all vehicles. The scope of information concerns the hours when the cars performed the actual inter-terminal transport. The following data were used for the analysis: the number of kilometres travelled in a given period and the amount of fuel burned during the transportation. Data refer to each day from 91 days (September, October, November 2021). If a vehicle from the tested group did not perform work on a given day, it would not be present in the list.
3.4. Basic Comparison
Basic information is the amount of fuel used in litres, the number of kilometres travelled on a given day, and the number of pallets transported during transport. Present the information in monthly charts to see the amount of fuel consumption and the average number of kilometres travelled. Operational measurements, however, need a standard to compare them to it [21]. The comparison will be made to give a picture of the work. Indicate the differences and connecting elements and describe (show) the work characteristics in this period using graphs.
3.5. Daily Efficiency—Simple (EP)
The vehicles work mainly on the same section, the road connecting Narvik with Tromsø and moving simultaneously and in the same weather conditions. If any random event (congestion, accident) occurs on the route line, such an event equally affects all vehicles.
A vehicle working on the Tromsø-Tana route was included in the list to check: Does the length of the way (different from the basic one) affect transport efficiency, and to what extent when we compare vehicles with the same initial parameters? (P2)
Regardless of the adopted road set, the data can determine the fuel used for 100 km. Then, it is compiled with the number of transported pallets according to the formula [22]:
Based on the analysis, a graph will be created showing the efficiency of vehicles in terms of the number of transported pallets. This will show how much pallet space will be transported for each litre of fuel consumed over 100 km. This will also connect the most efficient vehicles on a given day and a straight line running through the most effective result for three months.
This will answer the question: Which vehicle is the most effective for transport? (P3)
3.6. Daily Weighted Efficiency—DEA—Data Envelope Analysis
Efficiency is understood in the same way as the relation of the effect with the expenditure to the maximum value [23]. Such a ratio results in obtaining a decision parameter (tool) based on the relative effectiveness of the studied units [24]. The equipment will be assessed. On this basis, subjective weights will be assigned for both trucks and trailers. When scaling for HGVs, attention will be paid to:
- Year of production,
- Engine type and related vehicle servicing,
- Vehicle behaviour in winter conditions—based on feedback from vehicle users,
- Elements of equipment hindering the performance of inter-terminal transport (e.g., rear unloading elevator).
The trailer weight rating will reflect the difficulty of driving a given set after using a given trailer.
A mathematical programming model will be created [20] resulting from the observation, i.e., DEA—Data Envelopment Analysis.
Data envelopment analysis (DEA) is a nonparametric method of estimating operations research and economics production frontiers. It is used to measure the productive efficiency of decision-making units empirically. Although DEA has a solid link to production theory in economics, the tool is also used for benchmarking in operations management, where a set of measures is selected to benchmark the performance of manufacturing and service operations. In benchmarking, the efficient DMUs, as defined by DEA, may not necessarily form a “production frontier”, but rather lead to a “best-practice frontier”. This model was proposed by A. Charnes, W.W. Cooper and E. Rhodes in the 1970s. This is an objective model assuming the ratio of weighted effects to weighted inputs [25]. They used the concepts of M.J. Farell (1957).
It assumes:
where for each i and r.
Usually, this model is used to describe financial issues or compare the effectiveness of decision-making departments such as: (hospital departments, dairy farms, universities or local governments). However, the spectrum of use depends on the data to be compared. The literature on test results and the DEA method is extensive in Polish and English. So it can see that there are many possibilities to use the technique, and it is universal. From the fields that involve transport, one can find, among other things, works on trolleybuses, taking into account the analysis of the power supply system on sections created by the location of traction substations [26,27].
This method will create a graph showing the efficiency (benchmark) [28]. Additionally, compare the results with each other, indicating the most compelling entity.
The study will use the equation:
Then, the daily efficiency will be compared to the maximum value obtained in a 3-month trial. The maximum value will be assigned 100% efficiency, and the remaining results will be compared with it, creating a percentage image of the effectiveness for a given day. Thus, a relative efficiency will be made [25].
Then, the weighted average efficiency for the given vehicle over three months will be extracted.
The results obtained in this way will answer the questions asked and support decisions regarding selecting new vehicles for the BTL branch in Tromsø.
4. Description of the Problem
When deciding to choose a transport company, an informed customer often considers the quality of services provided and the impact of the company’s activities on the natural environment. It is the norm for carriers to have a modern, fully operational fleet of trucks in the contemporary world. Of course, companies supplying new trucks must meet increasingly restrictive standards: emissivity and environmental impact. Therefore, cars from the same segment often use the exact technical solutions [29].
Therefore, what should become the factor determining the selection of vehicles so that they are environmentally friendly and at the same time do not generate additional costs during operation? What evaluation criteria should be adopted? What’s the most ecological? What to avoid?
The right solution seems to be to purchase equipment intended for specific transport tasks.
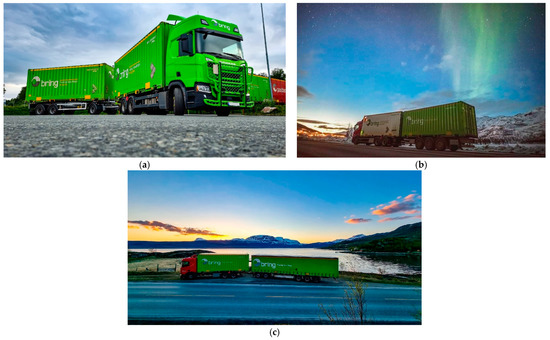
The case of the Bring Transportløsninger AS (BTL) branch, which carries out transport within the Posten AS group, was used to analyse the issue. The branch office is located in the Logistics Center (LSTr) in Tromsø, Northern Norway. LSTr plays the role of a HUB, i.e., the most modern cargo logistics centre for northern Norway. To illustrate, it is an area of land equal to 1/3 of the size of Poland. An additional task of the terminal is to maintain the flow of goods between Longyearbyen, the largest town in the Svalbard archipelago, and the mainland. The sea carries out the cargo exchange on this line with a frequency of 7 days. The goods and the lists are moved from Tromsø to smaller terminals or delivered directly with car kits. Most of the goods arrive at the Hub in an intermodal way. However, this multimodal is forced. The method of transport implementation determines the distance of the Hub from the railway station. The railroad trucks lead to Narvik, approximately 235 km from Tromsø. BTL in Tromsø is responsible for inter-terminal transport. Therefore, the transportation of goods on the Tromsø-Narvik-Tromsø route is a permanent element of the work of this department.
The unification of equipment, resulting from the need for intermodal applications, is based on containers in the BDF system and trailers from various manufacturers. The fleet of Bring Transportløsninger AS, Tromsø branch, is equipped with sub-container trucks that mate with trailers. Trailers can be divided into sub-container and cooperating with semi-trailers. In the case of sub-container trailers, two main types must be distinguished: a trailer with a steered axle and a trailed trailer. Additionally, the transport of semi-trailers is carried out with the help of cooperating trailers of the “dolly” type.
Car kits can be built in three ways:
The Tromso branch has eight trucks, five of which were put into service in 2021. The vehicles are operated during both day and night shifts. The necessity to handle an increasing number of transported loads (constantly increasing cargo flow) and the pro-ecological attitude of the entire Posten AS group obliges us to monitor the quality and efficiency of the equipment continuously used. For strategic reasons, three trucks will be replaced with new ones shortly.
The mountainous terrain and, most of the year, winter weather conditions in northern Norway, more than 300 km beyond the Arctic Circle, require engines that generate a lot of power. At the same time, the type of transport carried out by the company makes it impossible to overload the front axle, which disqualifies heavy V8 engines.
By analysing the available solutions at one of the leading truck manufacturers, two engines can be identified, the specifications included in the table below, and the characteristics of which best suit the type of transport.
BTL Tromsø uses trucks equipped with both types of engines. Based on the data from the service points of these vehicles, a simple reliability assessment was carried out. However, it did not indicate any significant differences between the engines. However, the price of cars with different types of machines varies. However, the purchase is determined not by the price, but by the intended use and the most environmentally friendly attitude to transport.
Due to the different nature of the trailers, and thus the extra weight of the whole sets, as well as the different number of pallets transported during transport, the choice of the engine is not apparent. Comparing the amount of fuel used with the number of goods transported over a distance of 100 km should answer the following questions:
- What type of engine should be ordered for new trucks to show the most excellent efficiency (understood in terms of the amount of transported goods concerning the amount of fuel consumed) during operation?
- What is the efficiency of the currently used engines? How do they affect the environment?
After getting the answers, it will select the correct engine.
The data collected from the last three months was analysed, and the DEA model was created to answer the previously asked questions.
5. Results
5.1. Data Description
Data from eight vehicles were used for the analysis. All cars are equipped with sensors that monitor basic technical parameters (e.g., fuel consumption) and locate system transmitters. The data is standardised, despite the discrepancy in terms of vehicle brands. Therefore, the data comes from a single source, despite several vehicle brands. Information on fuel consumption and the distance travelled applies to 3 months (September, October, November 2021). Inter-terminal transport takes place at night. The night shift starts at 4:00 PM and ends at 6:00 AM. The route information has been assigned according to the start date.
5.2. Criteria Analysed for Each Car Kit between 4:00 PM and 6:00 AM
The following criteria were analysed in the discussed issue:
- Fuel consumption, measured in litres,
- The length of the route measured in kilometres,
- The number of used pallet places,
- Type of trailer used during the transport.
5.3. Technical Data of Vehicles
Information on trucks with the type of engine, the kind of trailer assigned, and the number of pallet places is presented in Table 1.

Table 1.
Technical data of vehicles.
5.4. Analysis
Figure 2, Figure 3 and Figure 4 show the amount of fuel used (in litres), and Figure 5, Figure 6 and Figure 7 show the distance travelled by trucks and measured in kilometres during night trips over three months.
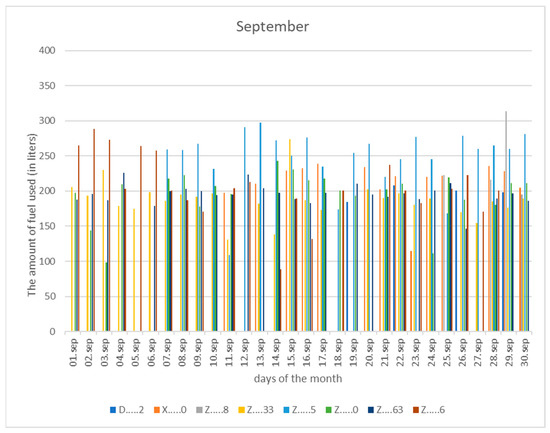
Figure 2.
The amount of fuel used (in litres) for each vehicle in September.
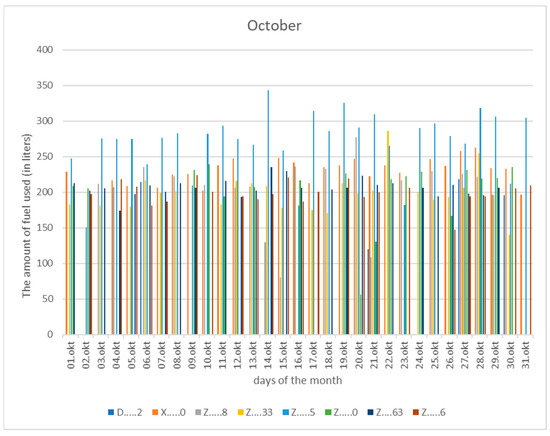
Figure 3.
The amount of fuel used (in litres) for each vehicle in October.
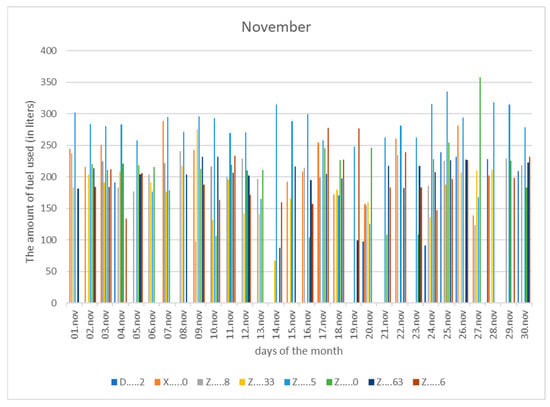
Figure 4.
The amount of fuel used (in litres) for each vehicle in November.
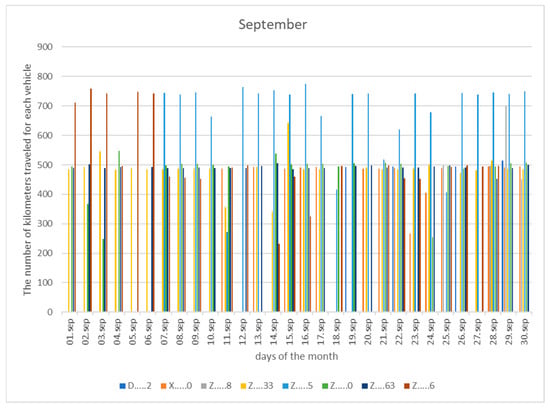
Figure 5.
The number of kilometres travelled for each vehicle in September.
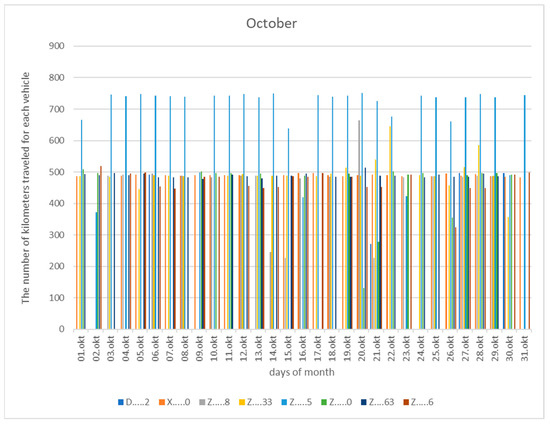
Figure 6.
The number of kilometres travelled for each vehicle in October.
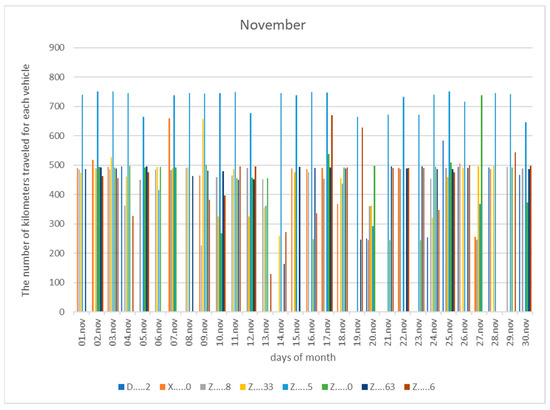
Figure 7.
The number of kilometres travelled for each vehicle in November.
In the following months, cars carried out inter-terminal transport regularly. Overall, 469 routes were completed: 143 in September, 168 in October and 158 in November. The graphs are presented (Figure 2, Figure 3, Figure 4, Figure 5, Figure 6 and Figure 7), showing the amount of fuel used and the number of kilometres travelled. Excel bar charts were used for visualisation.
The vehicles travel on the Tromsø-Narvik-Tromsø route. However, containers’ pick-up and delivery points are not always the same. Cars cyclically move along the road section in 455–505 km. In addition, they set off at a similar time in the same direction and along the same route; therefore, the terrain and weather conditions do not significantly affect the difference in the achieved fuel combustion results.
Figure 3, Figure 5 and Figure 7 show that cars travel on routes, approximately 500 km. The path’s average length calculated in the three-month understudy is 508.84 km, the shortest route is 129.1 km, and the most extended way is 775.7 km. Despite the similar distances travelled, cars consume different amounts of fuel (Figure 2, Figure 4 and Figure 6). The minimum fuel consumption is 56 litres, the maximum is 357.5 litres, and the average is 212.9 litres per route.
5.5. Summary of the Analysis
Figure 8 and Figure 9 show the simple daily efficiency. This coefficient indicates the number of pallet places transported over 100 km in the barn to the amount of fuel used.
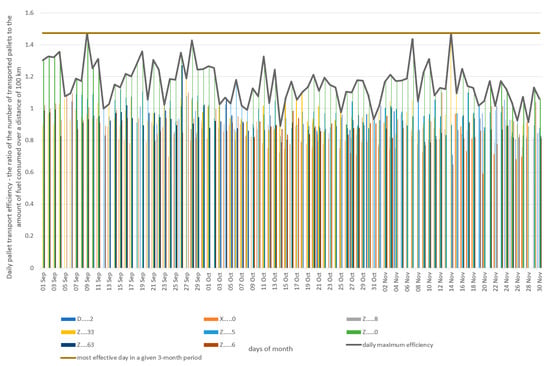
Figure 8.
Daily efficiency is the ratio of the number of transported pallets to the amount of fuel consumed over 100 km.
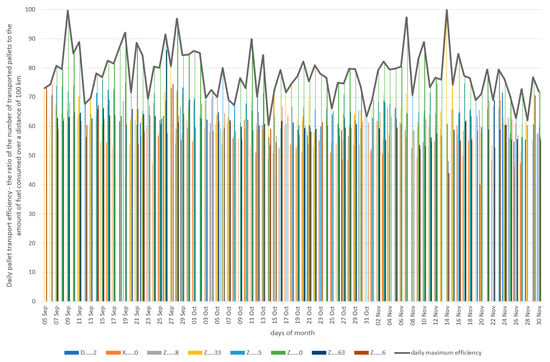
Figure 9.
Daily efficiency—the ratio of the number of transported pallets to the amount of fuel consumed over a distance of 100 km, expressed in [%], where the reference is the most effective day in a given 3-month period.
The cars differ in the type of trailer and the number of pallet places they transport. The amount of fuel used for a distance of 100 km was counted, and this value was compared with the number of transported pallets. In this way, information on fuel consumption for transporting the indicated number of pallets over 100 km was obtained.
As a result of the activities carried out, it was shown that the Z....0 car is the dominant vehicle in terms of the daily efficiency coefficient over three months. This truck transports the most significant number of pallets, often burning less fuel than other vehicles transporting the same distance on the same day. The Z...33 vehicles achieved the best efficiency ratio on 14 November. This event was a one-off, which is difficult to assign a logical explanation.
Throughout the analysed period, the modular set discredits trucks carrying two containers. Despite the lack of data on the weight of individual groups, it can be assumed that it does not affect the value of the efficiency coefficient due to the transport of similar goods by the sets (letters, parcels, drinks, etc.).
A simple comparison shows what effects a given set achieves. However, this image is subjective, as it only shows the impact of the work of a given vehicle. It does not show what expenses should be incurred to transport the pallets. To illustrate the expenditure necessary for the transport of pallets, the following factors should be taken into account, assigning appropriate weights to them:
- Age of the vehicle (the older the vehicle, the greater the number of maintenance repairs, so the utility decreases);
- Engine (type) with the availability of its service (assessed based on the current cooperation with the services and the waiting period for the workshop);
- Vehicle behaviour in winter conditions (based on the opinion of drivers working on the given equipment in BTL);
- Equipping with a rear unloading lift (it is crucial during the distribution of goods, while in the case of inter-terminal routes, where BDF containers need to be replaced—it makes such tasks very difficult).
Additionally, each time the truck is equipped with a trailer, the type determines the difficulty of driving the entire set. Therefore, it should be taken into account when showing the efficiency of the transport.
Table 2 shows the weights assigned to individual vehicles.
Table 2.
Weights assigned to the technical condition of trucks.
The second important element of the truck set is the trailer. The type of trailer affects the efficiency and the way of driving the road train. All manoeuvres with a trailed trailer are considered more straightforward than manoeuvring with a modular set. Therefore, individual types of trailers were also given weights:
Table 3 shows the weights assigned to unique trailers.
Table 3.
Weights assigned to the trailers.
5.6. Model Data Envelopment Analysis
The DEA model generated actual performance for a given road set. Efficiency is understood as the weighted sum of the effect to the weighted sum of the expenditure.
This method aims to determine the effectiveness of specific objects about their entire group.
The DMU Decision Making Unit is a truck set capable of transporting pallets most efficiently in this model.
Figure 10 shows the daily efficiency (y/x).
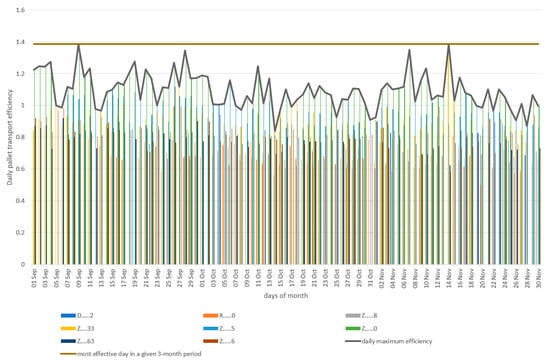
Figure 10.
Daily efficiency—the weighted ratio of the number of transported pallets to the amount of fuel consumed over a distance of 100 km, where the reference is the most effective day in a given 3-month period.
Figure 11 shows the percentage (relative) efficiency of HGVs. It is a picture of the daily efficiency up to the maximum efficiency obtained in months (September, October, November).
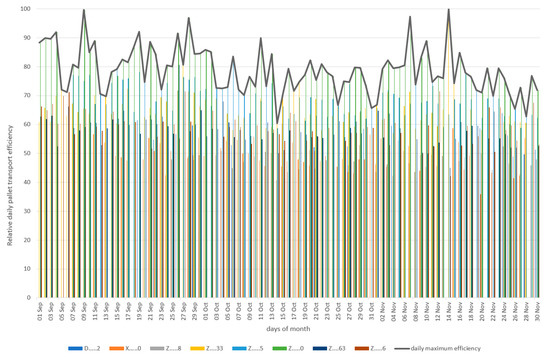
Figure 11.
Relative daily efficiency—the weighted ratio of the number of transported pallets to the amount of fuel consumed over a distance of 100 km, expressed in [%], where the reference is the most effective day from a given 3-month period.
The individual daily relative vehicle efficiencies were summed to select the most efficient transport unit, and an average was drawn from them.
Figure 12 shows the percentage of average daily vehicle efficiency.
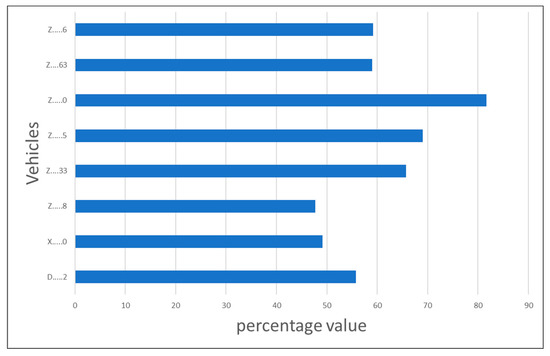
Figure 12.
Relative daily efficiency—the weighted ratio of the number of transported pallets to the amount of fuel consumed over a distance of 100 km, expressed in [%], where the reference is the most effective day from a given 3-month period.
6. Conclusions
The paper presents the following research problems:
- What is the most efficient truck in the presented vehicles (P1)?
- Does the length of the route (different from the basic one) affect transport efficiency, and to what extent when we compare vehicles with the same initial parameters (P2)?
- Which vehicle is the most effective for transport (P3)?
(P1), (P3): The most effective vehicle from the studied group is Z....0 (see Table 1). Both indirect research and with the DEA method. It is a truck that works with trailers that form a transport module. In the case of inter-terminal transport, it is essential to transport a large amount of cargo simultaneously. The hardest part of the job is driving the sets built for two trailers. On the other hand, the lack of a rear unloading lift makes it easier to work with containers. Therefore, when choosing new vehicles for Tromso, it is worth picking twin vehicles like Z...0. This car has the most powerful engine, which makes its purchase and service more expensive, but the number of pallet places transported is equal to these costs. The current transport capacity is 52 pallet places. The maximum length of a modular set in Norway is 25.25m. It would be worth building a group capable of transporting 3 BDF containers while maintaining maximum dimensions. Additionally, we will fully standardise the transport unit for this type of transport, thus gaining even more possibilities.
(P2): No. Using the DEA method, it can be seen that the set following the longer route is more effective, but this is due to the lack of a back lift. The same effect can be observed for Z...33. The rear elevator is a significant obstacle when lifting containers from the legs, a constant element of sets driving at night. We should look for equipment suited to the type of work. Transport efficiency is about maximising the number of goods transported during one trip. In this way, we save time resources devoted to fuel and the environment, because one vehicle with a slightly more powerful engine affects less than two driving vehicles at this same time.
Author Contributions
Formal analysis, T.N.; Methodology, R.Ł.; Resources, R.Ł.; Supervision, T.N.; Validation, T.N.; Writing—original draft, R.Ł.; Writing—review & editing, T.N. All authors have read and agreed to the published version of the manuscript.
Funding
This study was funded by the Gdynia Maritime University, the research project: WN/2022/PZ/07.
Conflicts of Interest
The author declares no conflict of interest.
References
- Gulcan, T.A.; Esmer, S.; Zorba, Y.; Şengonul, G. Determinants of Operational Efficiency at Chemical Cargo Terminals. TransNav Int. J. Mar. Navig. Saf. Sea Transp. 2014, 8, 289–293. [Google Scholar] [CrossRef]
- Akbar, U.; Khan, M.A.; Akmal, M.; Tóth Naárné, É.Z.; Oláh, J. Trade-Offs for the Optimal Energy Efficiency of Road Transportation: Domestic Cases in Developing Countries. Energies 2020, 13, 6538. [Google Scholar] [CrossRef]
- Mortensen, S.B.; Harkin, A.; Kofoed-Hansen, H.; Mlas, W. Next Generation of Physics-Based System for Port Planning and Efficient Operation. TransNav Int. J. Mar. Navig. Saf. Sea Transp. 2019, 13, 99–105. [Google Scholar] [CrossRef]
- Sueyoshi, T.; Ryu, Y.; Yun, J.-Y. COVID-19 Response and Prospects of Clean/Sustainable Energy Transition in Industrial Nations: New Environmental Assessment. Energies 2021, 14, 1174. [Google Scholar] [CrossRef]
- Khaghani, F.; Jazizadeh, F. MD-Resilience: A Multi-Dimensional Approach for Resilience-Based Performance Assessment in Urban Transportation. Sustainability 2020, 12, 4879. [Google Scholar] [CrossRef]
- Zhang, J.; Wang, S.; Yang, P.; Fan, F.; Wang, X. Analysis of Scale Factors on China’s Sustainable Development Efficiency Based on Three-Stage DEA and a Double Threshold Test. Sustainability 2020, 12, 2225. [Google Scholar] [CrossRef]
- Liu, Q.; Luo, C. The Impact of Government Integrity on Investment Efficiency in Regional Transportation Infrastructure in China. Sustainability 2019, 11, 6747. [Google Scholar] [CrossRef]
- Lim, D.-J.; Kim, M.-S.; Lee, K.-W. A Revised Dynamic Data Envelopment Analysis Model with Budget Constraints. Int. Trans. Oper. Res. 2022, 29, 1012–1024. [Google Scholar] [CrossRef]
- Taboada, G.L.; Han, L. Exploratory Data Analysis and Data Envelopment Analysis of Urban Rail Transit. Electronics 2020, 9, 270. [Google Scholar] [CrossRef]
- Li, Y.; Li, R.; Ruan, W.; Liu, C.-H. Research of the Effect of Tourism Economic Contact on the Efficiency of the Tourism Industry. Sustainability 2020, 12, 5652. [Google Scholar] [CrossRef]
- Xiang, H.; Wang, Y.H.; Huang, Q.Q.; Yang, Q.Y. How Much Is the Eco-Efficiency of Agricultural Production in West China? Evidence from the Village Level Data. Int. J. Environ. Res. Public Health 2020, 17, 4049. [Google Scholar] [CrossRef] [PubMed]
- Song, M.; Jia, G.; Zhang, P. An Evaluation of Air Transport Sector Operational Efficiency in China Based on a Three-Stage DEA Analysis. Sustainability 2020, 12, 4220. [Google Scholar] [CrossRef]
- Neumann, T. The Impact of Carsharing on Transport in the City. Case Study of Tri-City in Poland. Sustainability 2021, 13, 688. [Google Scholar] [CrossRef]
- Neumann, T. Comparative Analysis of Long-Distance Transportation with the Example of Sea and Rail Transport. Energies 2021, 14, 1689. [Google Scholar] [CrossRef]
- Blokus, A.; Dziula, P. Safety Analysis of Interdependent Critical Infrastructure Networks. TransNav Int. J. Mar. Navig. Saf. Sea Transp. 2019, 13, 781–787. [Google Scholar] [CrossRef]
- Yan, X.P.; Wu, B.; Zhang, D.; Zhang, J. Emergency Management of Maritime Accidents in the Yangtze River: Problems, Practice and Prospects. TransNav Int. J. Mar. Navig. Saf. Sea Transp. 2017, 11, 111–118. [Google Scholar] [CrossRef][Green Version]
- Fu, Y.; Li, M. DEA Cross-Efficiency Aggregation Based on Preference Structure and Acceptability Analysis. Int. Trans. Oper. Res. 2022, 29, 987–1011. [Google Scholar] [CrossRef]
- Gogołkiewicz, M. Wykorzystanie modeli Data Envelopment Analysis w badaniu efektywności terminali intermodalnych. Sci. J. Wars. Univ. Life Sci. Econ. Organ. Logist. 2017, 2, 15–24. [Google Scholar] [CrossRef]
- Barth, M.; Scora, G.; Younglove, T. Modal Emissions Model for Heavy-Duty Diesel Vehicles. Transp. Res. Rec. 2004, 1880, 10–20. [Google Scholar] [CrossRef]
- Szuwarzyński, A. Metoda DEA Pomiaru Efektywności Działalności Dydaktycznej Szkół Wyższych. Nauka Szk. Wyższe 2006, 2, 78–88. [Google Scholar]
- Latała, D.; Mądziel, M. Metody ustalenia normatywnego zużycia paliwa pojazdów samochodowych eksploatowanych w przedsiębiorstwach. Autobusy Tech. Eksploat. Syst. Transp. 2017, 18, 854–858. [Google Scholar]
- Tornese, F.; Gnoni, M.G.; Thorn, B.K.; Carrano, A.L.; Pazour, J.A. Management and Logistics of Returnable Transport Items: A Review Analysis on the Pallet Supply Chain. Sustainability 2021, 13, 12747. [Google Scholar] [CrossRef]
- Sekuła, A.; Julkowski, B. Zastosowanie metody DEA w ocenie efektywności wydatków jednostek samorządu terytorialnego–przegląd literaturowy wyników dotychczasowych badań w przestrzeni europejskiej. Prace Nauk. Uniw. Ekon. We Wrocławiu 2017, 477, 220–231. [Google Scholar] [CrossRef]
- Lisiecka, M. Metoda DEA w pomiarze efektywności pracowników biur rachunkowych. Progress 2020, 1, 70–83. [Google Scholar] [CrossRef]
- Grzesiak, S.; Wyrozębska, A. Wykorzystanie metody DEA (analizy obwiedni danych) do oceny efektywności technicznej oddziałów szpitalnych. Zesz. Nauk. Uniw. Szczecińskiego Studia Pr. Wydziału Nauk. Ekon. Zarządzania 2014, 36, 253–272. [Google Scholar]
- Bartłomiejczyk, M. Przykłady praktyczne zastosowania metod numerycznych w analizie trakcyjnego układu energetycznego. Zesz. Nauk. Wydziału Elektrotechniki I Autom. Politech. Gdańskiej 2016, 51, 11–15. [Google Scholar]
- Marzec, J.; Pisulewski, A.; Prędki, A. Efektywność techniczna gospodarstw mlecznych w Polsce—Analiza porównawcza za pomocą dea i bsfa. Metod. Ilościowe Bad. Ekon. 2015, 16, 7–23. [Google Scholar]
- Nowak, A.K.; Matuszyk, A. Analiza możliwości zastosowania metody DEA W modelach scoringowych. Studia Ekon. Uniw. Ekon. Katowicach 2014, 186, 113–126. [Google Scholar]
- Kuznetsov, A.; Kirichenko, A. Methodological Problems of Modern Transportation Logistics. TransNav Int. J. Mar. Navig. Saf. Sea Transp. 2018, 12, 611–616. [Google Scholar] [CrossRef]


Publisher’s Note: MDPI stays neutral with regard to jurisdictional claims in published maps and institutional affiliations. |
© 2022 by the authors. Licensee MDPI, Basel, Switzerland. This article is an open access article distributed under the terms and conditions of the Creative Commons Attribution (CC BY) license (https://creativecommons.org/licenses/by/4.0/).