Article

Environmental Impact Analysis of Portland Cement (CEM1) Using the Midpoint Method

by
Oluwafemi E. Ige
1,2,*,
Oludolapo A. Olanrewaju
1,
Kevin J. Duffy
2 and
Obiora C. Collins
2
1
Department of Industrial Engineering, Durban University of Technology, Durban 4001, South Africa
2
Institute of System Science, Durban University of Technology, Durban 4001, South Africa
*
Author to whom correspondence should be addressed.
Energies 2022, 15(7), 2708; https://doi.org/10.3390/en15072708
Submission received: 19 February 2022 / Revised: 11 March 2022 / Accepted: 23 March 2022 / Published: 6 April 2022

Abstract

:
The cement industry confronts significant challenges in raw materials, energy demands, and CO2 emissions reduction, which are global and local environmental concerns. Life cycle assessment (LCA) has been used in many studies to assess the environmental impact of cement production and investigate ways to improve environmental performance. This study aims to analyse the environmental impact of Portland cement (CEM I) on the South African cement industry using the life cycle impact assessment (LCIA), based on the Recipe 2016 v 1.04 midpoint method. The study was conducted using data modeled after the South African cement plant, considered a cradle-to-gate system boundary, starting from the extraction of the raw material to the cement production process that produces cement as the main product. The data were obtained from the Ecoinvent database v3.7.1, integrated with SimaPro 9.1.1. software, used to assess the impact categories. For simplicity, the study merged the entire production process into five processes, i.e., raw materials usage, fuel consumption, clinker production, transportation and electricity. The impact categories of the five production stages were assessed using the LCA methodology. The impact categories investigated were classified into three categories: atmospheric, resource depletion and toxicity categories. According to the results, clinker production and electricity usage stages contribute the most to atmospheric impact (global warming, which causes climatic change due to high CO2 emissions), followed by raw materials and fuel consumption, contributing to the toxicity and resource depletion impact category. These stages contribute more than 76% of CO2 eq. and 93% of CFC-11 eq. In the midpoint method, CO2 is the most significant pollutant released. Therefore, replacing fossil fuels with alternative fuels can reduce fossil fuel use and the atmospheric impact of cement kilns.

1. Introduction

Cement demand in many developing countries has increased rapidly due to the continued expansion of the construction industry, driven by fast urbanization. Cement is among the most used and produced materials in construction globally [1,2]. Despite a significant increase in cement production, from 3280 Mt to 4290 Mt, between 2010 and 2014, it has remained relatively stable at approximately 4100 Mt since 2019 [3]. Recently, attention to environmental protection and interest in environmental issues related to construction grew rapidly, and environmental considerations have become one of the main criteria for formulating social and economic policies [4]. The majority of these efforts have centered on lowering greenhouse gas (GHG) emissions, particularly carbon dioxide (CO2), which is responsible for absorbing heat from the atmosphere. Global warming and resource depletion are among the critical concerns of the cement industry. Cement production has many environmental impacts, varying from high levels of GHG to high resource usage and high energy consumption, i.e., fossil fuels and electricity. Measuring this impact is a critical step towards mitigating them. It is estimated that the cement industry causes about 5% of total anthropogenic CO2 emissions and accounts for 12–15% of global industrial energy use [5,6]. Many countries (especially developing countries) use coal as a calcination fuel and emit large GHGs. Globally, the calcination process accounts for 50% of the total CO2 emissions from cement production, and others come from burning fuel in the kiln [7,8,9]. The amount of clinker (the primary ingredient) used in cement production is directly proportional to the CO2 emissions. For example, between 2014 and 2018, the clinker to cement ratio increased at an annual rate of 1.6 percent on average, resulting in a proportional increase in direct CO2 emissions [10].
Cement production involves the extraction of raw materials, such as limestone, sand, and clay, which contain the four primary constituents needed: lime, alumina, silica, and iron. The chemical reactions that mix these constituents expose them to high temperatures and convert the partially molten raw materials into clinker. These materials are crushed and mixed before firing at 1450 °C. Many industries also use selected residues as additives or partial substitutes for raw materials [11]. The resulting clinker is mixed and grounded with gypsum and other minerals to form cement, a fine grey powder. Cement kilns use multiple energy sources to achieve the high temperatures required to produce clinker [12]. The cement production process comprises three main stages: raw material preparation, clinker combustion (pyro-processing) and cement preparation [13]. Cement production can be further categorized into four processes, based on the moisture content of the material: dry, semi-dry, semi-wet, and wet process. The dry process is usually preferred because it uses less energy than the wet process [13]. Numerous fuels can be used, including fossil fuels, such as coal, petroleum coke, fuel oil, diesel, natural gas, and alternative fuels, such as waste or biomass [14]. The cement industry is energy-intensive and has become a source of environmental concern because of the large amounts of raw materials, the energy required, and total cement produced. This is primarily because of high carbon dioxide (CO2) emissions from the use of fossil fuels, as well as the limestone decarbonization to calcium oxide in the clinker production process [1,15].
Cement production is well known for its massive total industrial energy consumption, approximating 30–40% in many countries [16,17]. Cement production employs a variety of energy sources, including thermal and electrical energy [18]. The thermal energy used in cement production accounts for roughly 90% of total specific energy consumption, with the primary fuel sources alternated between coal, fuel oil, and other notable fuels, such as biomass and animal wastes, while electricity used the remaining 10% of the total specific energy consumption [19,20]. The energy required to produce Portland cement ranged from 3–6 MJ/kg clinker, depending on the raw materials and the type of process used [16]. Cement plants in South Africa use fossil fuel (Coal) for their process and the kiln is the main energy-consuming stage in the entire cement production process. In South Africa, the energy consumption of cement plants varies considerably, in terms of electricity, as it is affected by the function and size of the plant. This occurs because most plants operate mainly in cement finishing mills, while others perform the whole process, from raw materials to cement production. Cement plants in South Africa use several megawatt-hours per year, with annual limits ranging from 55 to 194 megawatt hours (MWh) [21].
The greenhouse gas (GHG) emissions from energy consumption are the primary cause of global warming and climate change [22,23,24]. The energy consumed in the industrial sector represents about 28.3% of total global energy consumption and, consequently, releases about 38.5% of CO2 [25]. Nearly 33% of global emissions are directly related to energy consumption [26]. Cement plants are responsible for up to 7% of CO2 emissions worldwide [15,27]. South Africa ranked seventh in the world on CO2 emissions in 2019 and first in Africa, which is largely due to the country’s dependence on coal [28]. According to the Department of Environmental Affairs’ 2014 [29] reports, annual greenhouse gas emissions from cement production increased by 27% between 2000 and 2010, from 3.3 MT CO2e to 4.2 MT CO2e. The South African cement industry accounted for 1% of the country’s GHG emissions [30]. South Africa’s leading electricity service provider, Eskom, generates 95% of the country’s electricity used. The country generated 93% of this electricity from coal-fired plants, while nuclear, hydro and gas turbine plants account for the remaining 7% [31,32,33,34]. As a result, lowering the electricity demand in South African cement plants will help to reduce CO2 emissions. Environmental saving, in terms of reducing carbon dioxide (CO2) and nitrogen oxides (NOx) emissions and energy costs, is a major global concern [35]. Energy use is directly responsible for 33% of global emissions, with the cement industry liable for up to 7% of global CO2 emissions [15,27].
Apart from GHG emissions, cement production also emits other atmospheric pollutants, such as nitrogen oxides (NOx), carbon monoxide (CO), particulate matter (PM) and sulfur dioxide (SO2), among others, mainly due to the use of coal [15,36,37,38]. Raw materials’ extraction can also lead to natural resources depletion [39], air pollution [40] and land degradation [41]. Several studies have assessed cement production’s environmental impact, with different methodologies, system boundaries, variables, and environmental impacts (e.g., raw material composition, technology types, and fuels) [42].
Life cycle assessment (LCA) is a method that has been successfully used in many studies to assess the environmental impact of cement production and investigate ways to improve environmental performance. The LCA method has now been extended to organizational assessments ISO/TS 14072 [43], increasing the applications for the approach and increasing its ability to reach high-level decision- and policy-makers. The LCA methodology, recommended by ISO/TS 14072, covers the scope of ISO 14040 (2006) [44] and ISO 14044 (2006) [45], to all organizational activities standards and includes four stages: definition of goal and scope, inventory analysis, impact assessment and interpretation of results [43]. Definition of goal and scope: The first stage defined how to conduct the LCA research goal and scope and its extension. Inventory analysis: All the relevant data are researched, collected, and analyzed during the life cycle inventory (LCI) stage. Impact Assessment: This stage provides more information to help assess the LCI results of a product’s system and understand their environmental impact better. Interpretation: This is the final stage of LCA, where the results of an LCI, LCIA, or both, are summarized, discussed and interpreted, according to the study’s goals for possible recommendations. In addition to ISO 14040 (2006) [44] and ISO 14044 (2006) [45], ISO/TS 14072 [43] provides additional requirements and guidelines for effective application to organizations.
According to Petek Gursel, et al. [46], the critical stage in any LCA is the collection of reliable LCI, which can be used to conduct LCIA. The data constituting the LCI can be either primary or secondary data. The primary data are the on-site data collected from manufacturers, processes, services and associations, while secondary data are those from the published datasets, journals, consultants and considered generic data [47]. LCA is among the methods used to assess the environmental impact of cement production [48,49,50]. LCA has drawn much interest to various available tools, regarding environmental assessment and human health impact. Its scope is the main advantage of LCA. It means LCA can present a comprehensive picture of the impact caused by the product’s entire life cycle, from the extraction of raw materials to final disposal [51]. Therefore, LCA is an effective tool for organizations to provide a scientific basis to support organizations’ decision-making, to reduce environmental impact during life cycle management [52,53,54]. The environmental impact of cement production has been compared in LCA studies for different types of cement [8,55] and stages of production [56,57,58,59]. Many LCA studies developed various scenarios for replacing raw materials and fuels to reduce cement production’s harmful environmental impact [5,56,60,61] or identify the best available technology [62]. Further, the reduction in cement proportion in concrete and the addition of different cementitious materials, such as pumice, zeolite, fly ash, metakaolin, and nanomaterials, has shown strong improvements in fresh properties, mechanical strength, and durability of concrete productions [63,64,65,66,67,68,69]. Steel slag can be used as supplementary cementitious material (SCM) to produce blended cement. Steel slag could be used as a partial substitute for cement (10%), without affecting the compressive strength [70], and also as a partial substitute for limestone in kiln feed [71,72]. Replacing the same amount of clinker with various SCMs, such as steel slag in cement production, has already proven to be one of the most effective methods of reducing GHG emissions from cement production [73]. Steel slag showed good hydraulic properties and offered a standard-setting time, contributing to resource, energy, and environmental saving [74]. However, different functional units and impact assessment methods make it difficult to compare LCA studies [5,48,62,75,76]. This study aims to analyse the environmental impact of a cement plant in South Africa that produces Portland cement (CEM1), using life cycle assessment (LCA). The impact categories were classified into three categories: atmospheric, resource depletion, and toxicity categories to achieve this aim.
On average, the cement industry discharges about 500–950 kg of CO2/ton of cement produced [77]. This depends on many factors, including the amount of clinker in the cement, the type of fuel used, and the system’s energy efficiency [78,79]. Approximately 60% of these emissions are caused by the process (limestone calcination), 35% by fuel combustion, and 5% by electricity application [79]. Wang, et al. [80] discovered five significant factors affecting GHG emissions from cement production, namely: energy emission factor, energy structure, energy intensity, cement production and clinker production. Cement and clinker production activities account for most of the increased GHG emissions. The cement industry contributes the most to global warming, with CO2 emissions ranging from 98% to 100%. Despite higher characterization factors, other GHGs, for example, CH4 and N2O, have less impact [40,81]. Tun, et al. [82] used the LCA method to evaluate the environmental impact of Myanmar’s cement industry, using the Recipe 2016 method to identify the major contributors’ environmental impacts. They discovered that the major environmental impacts are climate change, ecosystem damage, photochemical oxidant formation, fine particulate matter formation, terrestrial acidification, and fossil resource scarcity. These impacts are caused primarily by CO2, SO2, NOx and PM2.5 emissions during the clinker production stage and the use of fossil resources. Marceau, et al. [83] performed an LCI for Portland cement produced in the United States. They found that limestone calcination and fuel burning in the clinker production stage contributed about 60% of the total CO2 emissions (553 kg per ton of cement) and 39% (365 kg per ton of cement) of total CO2 emissions, respectively. Feiz, et al. [8] compared the Global Warming Potential (GWP) of three cement products with different clinker contents and found that the product with the least clinker had the lowest value. Thwe, et al. [84] used the LCA approach to assess the environmental impact of OPC production in Naypyitaw, Myanmar. They developed various alternative fuel scenarios for thermal energy consumption. Their study found that current cement production practices cause different environmental impacts, including GHG emissions, eutrophication and acidification, particulate matter formation, photochemical oxidant formation, fossil depletion, etc. These are due to the calcination (clinker production) stage. Rosyid, et al. [85] found that the kiln process activities were primarily responsible for global warming and acidification impact at an Indonesian cement plant. According to Chen, et al. [59], the cement industry has three significant environmental impacts: (1) global warming, (2) respiratory inorganics, which are related to direct emissions from coal and limestone consumption, and (3) non-renewable energy, which is related to energy consumption (i.e., electricity and coal).

2. A Recipe

A Recipe is a method for LCIA. It was developed due to collaboration between PRé Sustainability, RIVM, Radboud University Nijmegen, and Leiden University, in 2008 [86]. In the Recipe, 18 midpoint indicators and three endpoint indicators are determined. Each method midpoint and endpoint include factors based on three cultural perspectives: individualistic, hierarchist and egalitarian perspectives. These perspectives signify a series of choices about issues, such as time or the expectation that proper management or future technology development can prevent future damage. The individualistic perspective relates to the short-term concern, impact types that are certain, and technological optimism about human adaptation. The hierarchist perspective relates to the scientific consensus model about the time frame and impact mechanisms credibility. The egalitarian perspective relates to the long-term precautionary perspective, as it considers the long-term time frame and all impact pathways for which data are available. The main objective of the Recipe method is to reduce life cycle inventory results into a limited number of indicator scores. The scores for these indicators indicate the relative severity of the environmental impact category. The Recipe 2016 improves on Recipe 2008, CML 2000 and Eco-indicator 99. The method is regularly updated to integrate new data and research. Radboud University is now in charge of the most recent update. The Dutch National Institute for Public Health and the Environment (RIVM), Radboud University Nijmegen, PRé and Norwegian University of Science and Technology collaborated to develop Recipe 2016 [87]. Goedkoop et al. [88] developed ReCiPe2008, an LCIA method that includes harmonized category indicators and characterization factors at the midpoint and endpoint levels. Therefore, this study aims to analyse the environmental impact of the production of Portland cement (CEM I) in the South African cement industry, using the LCIA with the Recipe 2016 v 1.04 midpoint method, according to atmospheric, resource depletion and toxicity categories. The LCA methodology was used to estimate the 18 midpoint impact categories, except for water consumption and land use, due to minor impact. This method allows for the identification of environmental hotspots in the production process and compares them with similar production scenarios, assessed using LCA. All cement plants in South Africa are produced via a dry process.

3. Methodology

Life cycle assessment is a method that has been successfully used for assessing promising environmental impact and resource usage throughout the lifetime of a product, from the acquisition of raw material to the production stage and use phases to waste management [44]. LCA method considers the environmental impact of products, services, and processes. The analysis is conducted according to ISO/TS 14072 guidelines for organizational life cycle assessment. An LCA study must include four stages: goal and scope definition, inventory analysis, impact assessment, and interpretation, with all guidelines followed. Therefore, this section discusses the LCA method of cement production stages and explains how the impact assessment was conducted based on the above stages.

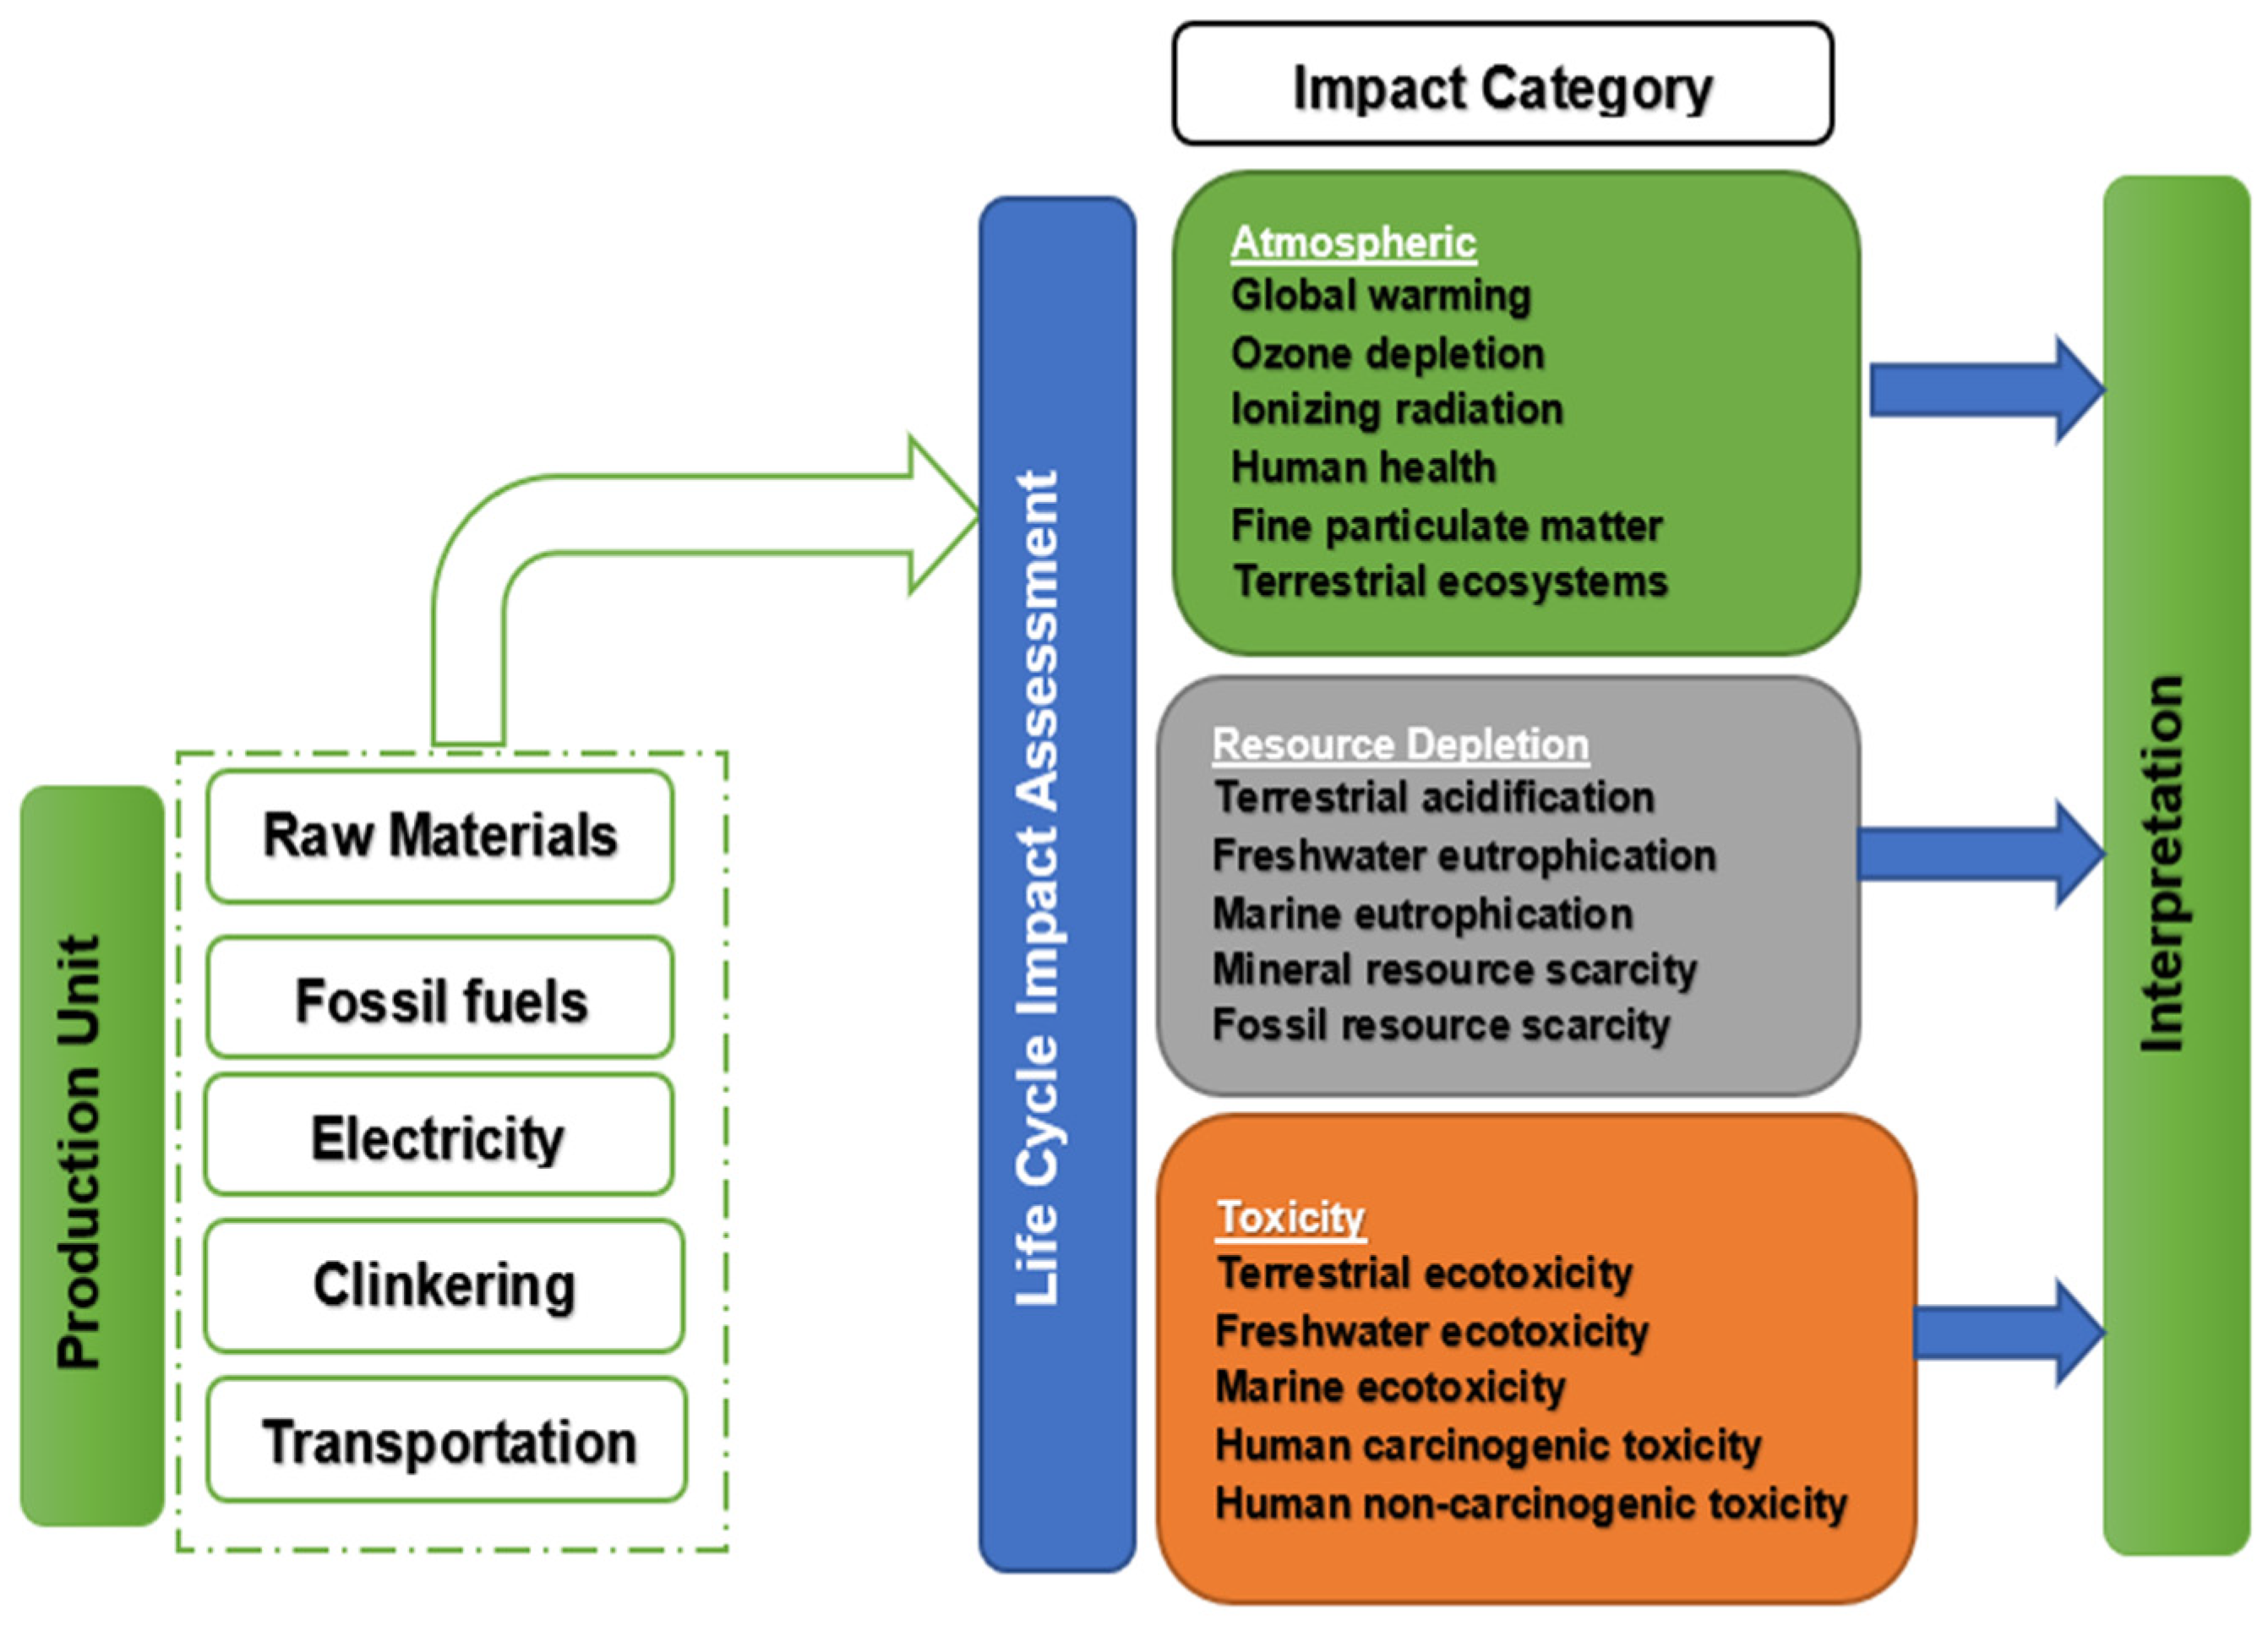
3.1. Goal and Scope Definition

The intended goal of this study is to investigate environmental impact based on data availability from a cement production unit. Regarding the system boundary, standard LCA is a cradle-to-grave method. In recent times, cradle-to-gate, gate-to-gate, gate-to-cradle are possible in some cases, even cradle-to-cradle methods. Most studies on the environmental impact of cement use the cradle-to-gate method. As shown in Figure 1, a cradle-to-gate analysis was considered in this study. Cradle-to-gate, includes the acquisition of raw material, transportation (within the plant) and production stages.
In this study, the system boundary was limited to raw material consumption, fuels, electricity use, transportation, production of Portland cement, the final product and emissions from the process. The boundary excluded the packaging unit, waste treatment, cement consumption, final cement disposal as waste due to the methodological issues. Furthermore, 1 kg of cement produced in South Africa was used as the functional unit to compare the results. To simplify the production process, the entire production process merged into five processes, i.e., raw material usage, fuels usage, electricity usage, transportation and clinker production.

3.2. Life Cycle Inventory

The inventory was developed using average South African cement production data between the 2017–2019 operations. The inventory data for the system background were obtained from the Ecoinvent database v3.7.1 [89]. Ecoinvent’s inventory data for South African cement production were primary data collected from five cement plants that characterized 90% of the country’s cement industry’s market share. The inventory input/output data for 1 kg of the South African Portland cement are included in Table 1.
According to Petek Gursel, et al. [46], developing a life cycle inventory includes quantifying and gathering all inputs, outputs, energy consumption and waste generation related data to make a functional unit of the product within the system boundary investigated. The data include all raw materials and energy used in the production process. The figures are computed based on original data on South African cement production.

3.3. Life Cycle Impact Assessment

The LCIA process combines the inputs and outputs quantified in an Inventory Analysis to estimate their potential environmental impact. There are a variety of LCIA methodologies available, with some of them being included in commercial software [90]. Most methods are based on impact categories and characterization factors and include the following steps: classification, normalization, characterization and valuation. In classification, the environmental impact measured in the inventory is grouped into a limited set of recognized environmental impact categories considering the scientific information available about the processes. The study’s goal guides selecting correct impact categories and practical considerations should limit their number. In the LCIA methodology, the characterization step assessed the relative contribution of each environmental impact [91]. The characterization is done by multiplying each substance’s amount by its characterization factor and adding all of the figures together. Characterization factors are substance-specific, measurable interpretations of a substance’s potential impact per unit emission. They determined each impact category that a substance/process could possibly contribute to [92]. Equation (1) represents generic factors while Equation (2) represents non-generic factors; the former factor is usually the outputs of characterization models and is accessible in the literature as a database.
S j = i Q j , i m i
where
  • S j = impact category j indicator
  • m i = size of the intervention of type i
  • Q j , i = characterization factor that links intervention i to impact category j [93].
Equation (2) represents some non-generic characterization factors potential variables in the human health and the natural environment impacts setting [93].
Q j , s , t = l E f f e c t ( i , l , t ) E m i s s i o n ( i , s ) = l   ( F a t e ( i , l , t ) E m i s s i o n ( i , s ) ) · l E x p o s u r e ( i , l , t ) F a t e ( i , l , t ) · ( l E f f e c t ( i , l , t ) E x p o s u r e ( i , l , t ) )
where
  • subscript i = substance,
  • s = location of the emission,
  • l = related exposure area of the receptor
  • t = period during which the potential contribution to the impact is considered [93].
The normalization stage of the LCIA method refers to a process used to compare impacts across impact categories and protected areas to prioritize product alternatives or resolve trade-offs between them [93]. This stage also discovers an impact category that has little or no impact on the overall environmental impact, reducing the number of factors that must be evaluated. According to Finnveden, et al. [94], normalization has two goals: placing LCIA indicator results in a broader context and adjusting the results to have common dimensions. A reference value is used to divide the sum of each category indicator result.
N k   = S k R k
where
  • k = impact category
  • N = normalized indicator
  • S = category indicator from the characterization phase
  • R = reference value.
The reference system is generally selected by considering the result of the overall indicator for a specific country or region for a particular year. In an LCA study, the results of the normalization can allow input grouping or weighting impact categories or directly judge the relative importance of different impact categories. This study carried out the impact assessment using the Recipe 2016 v 1.04 midpoint method consisting of 18 midpoint impact categories as shown in Table 1. The method is known as Recipe because it offers a “recipe” for calculating impact category indicators. Furthermore, this method combines two well-known techniques, resulting in a unified and consistent impact assessment structure. For simplicity, the impact categories investigated were grouped into atmospheric, resource depletion, and toxicity categories. These impact categories are affected by the substances listed in the inventory. Table 2 includes the midpoint impact categories and they can be classified as local, regional, and global impact of cement production.
The inputs and outputs in the cement production system shown in Figure 2 are divided into five production stages: raw materials consumption, production fuels consumption, clinker production, transportation and electricity. Each stage is linked to the impact categories studied using the LCA methodology. All calculations were done using SimaPro 9.1.1 software application [87,95]. Table 3 shows all processes studied in each production stage.

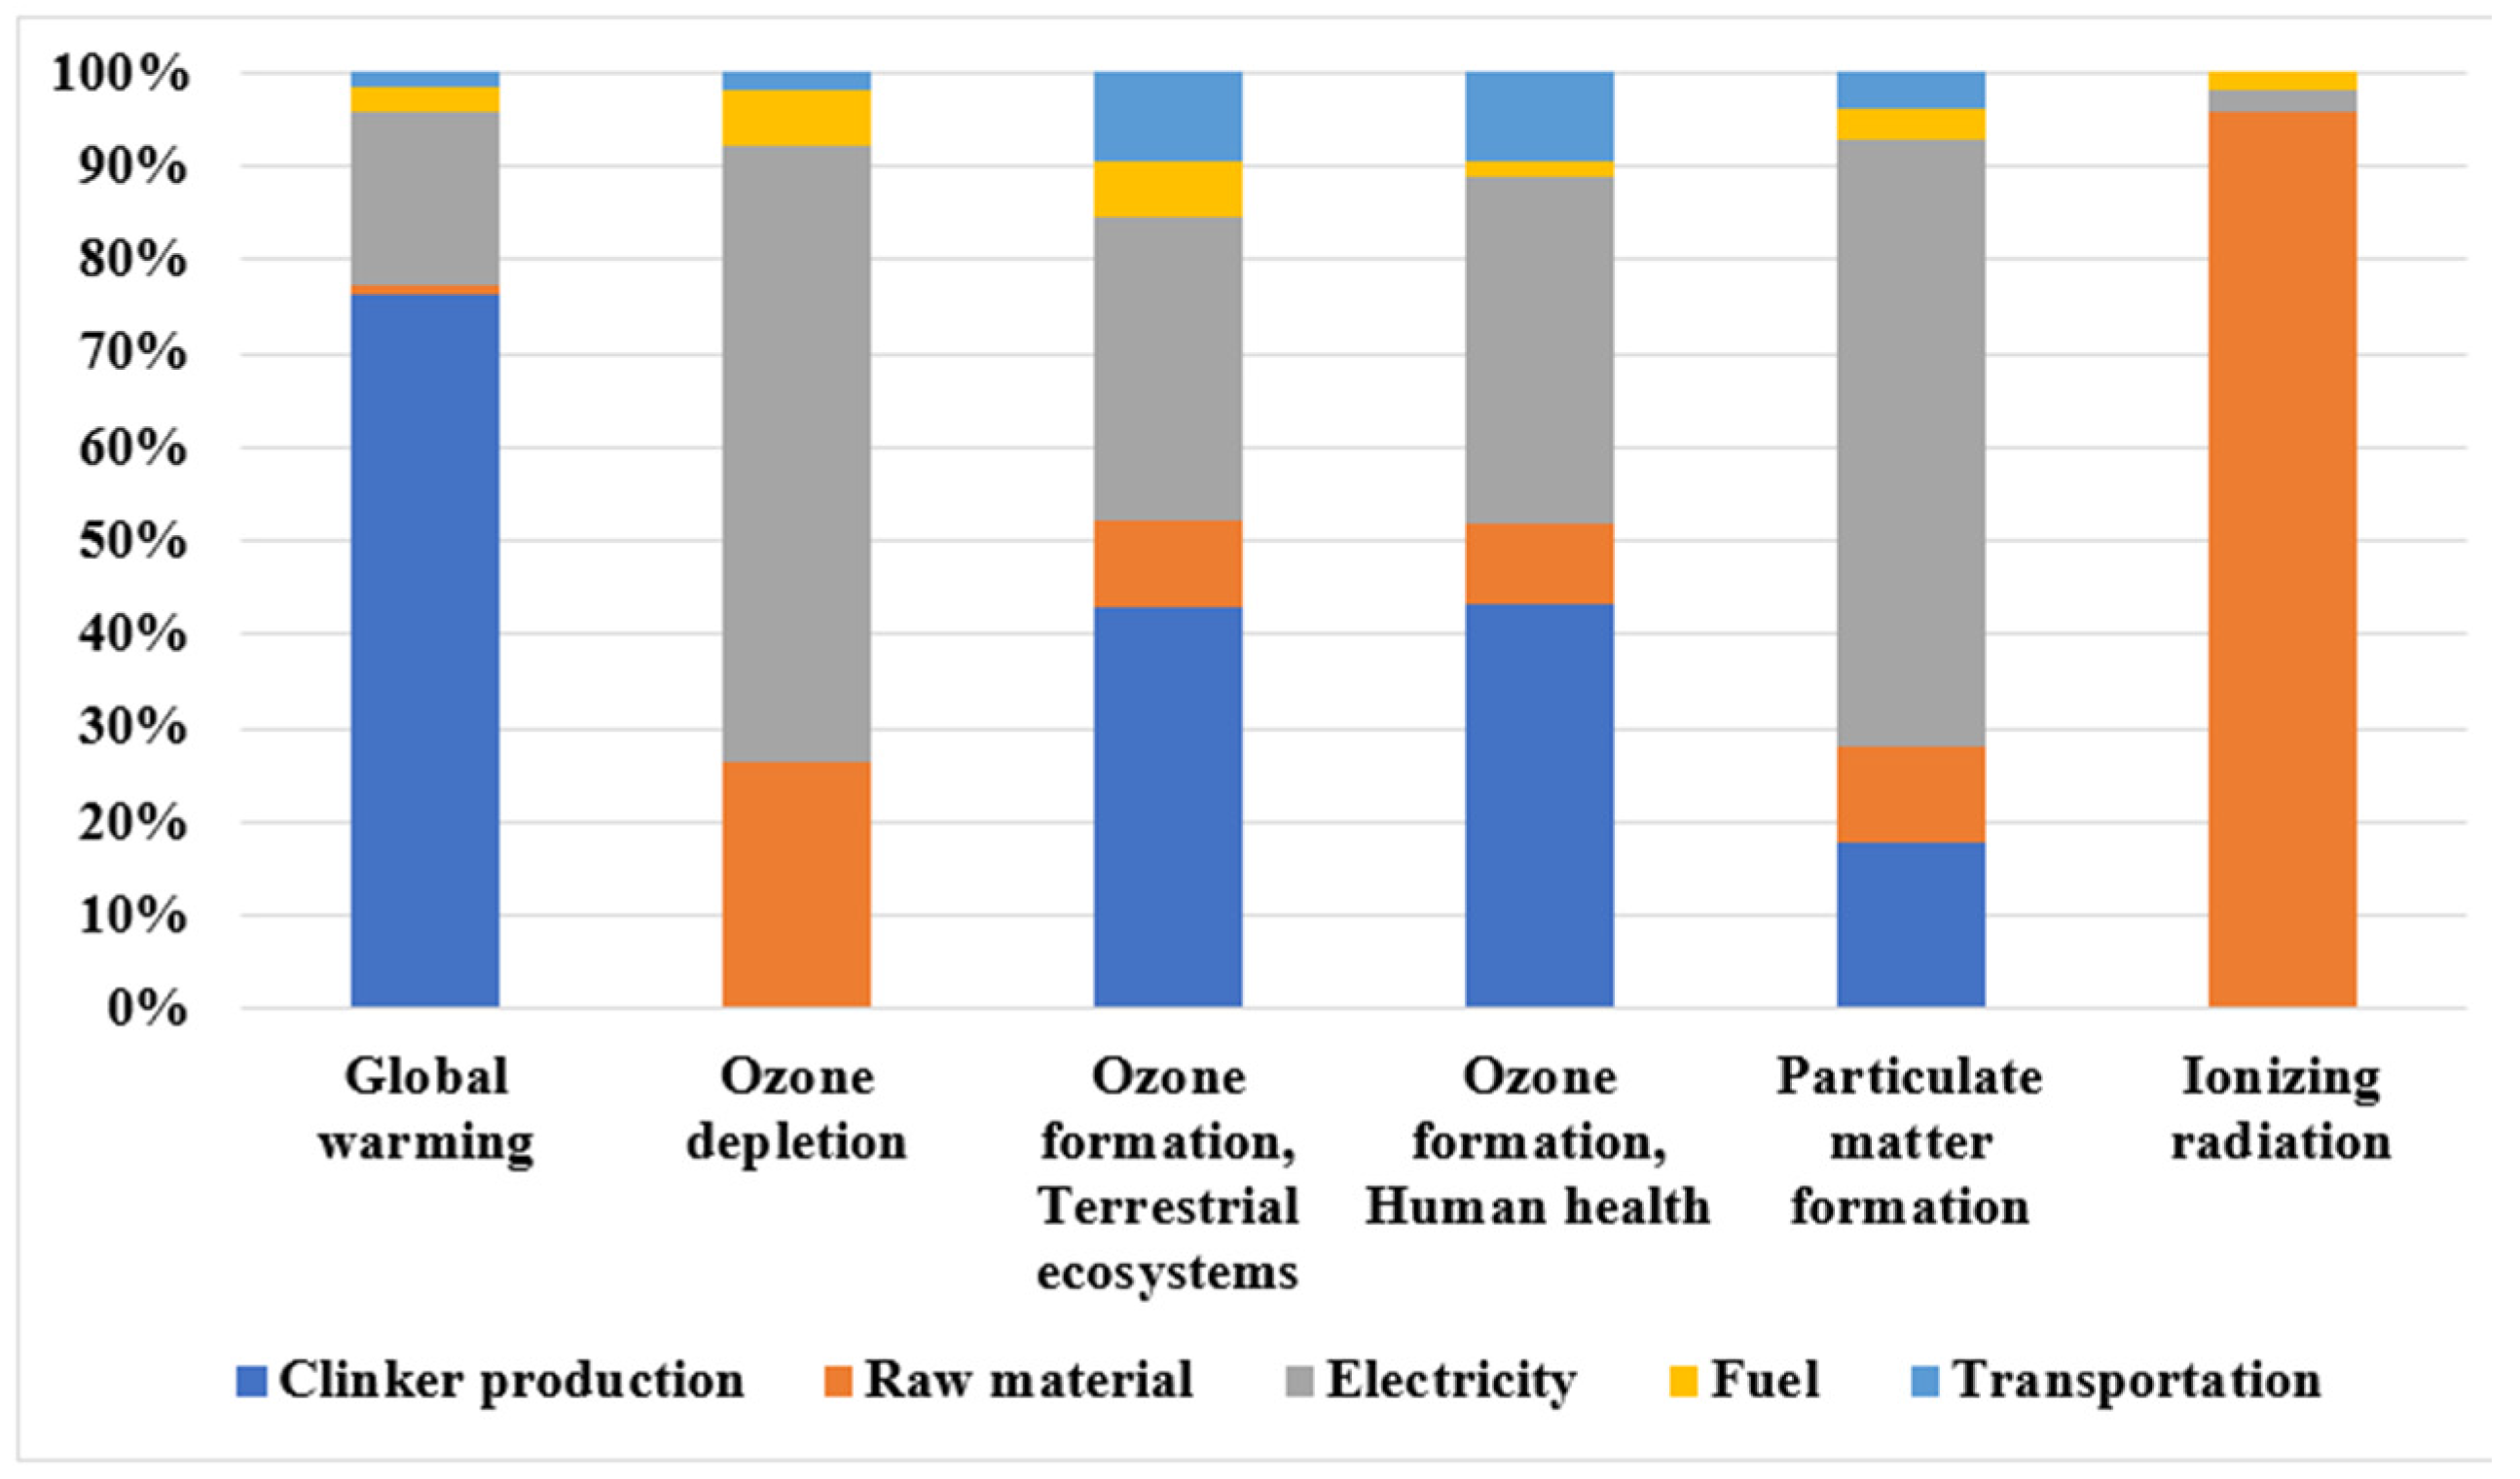
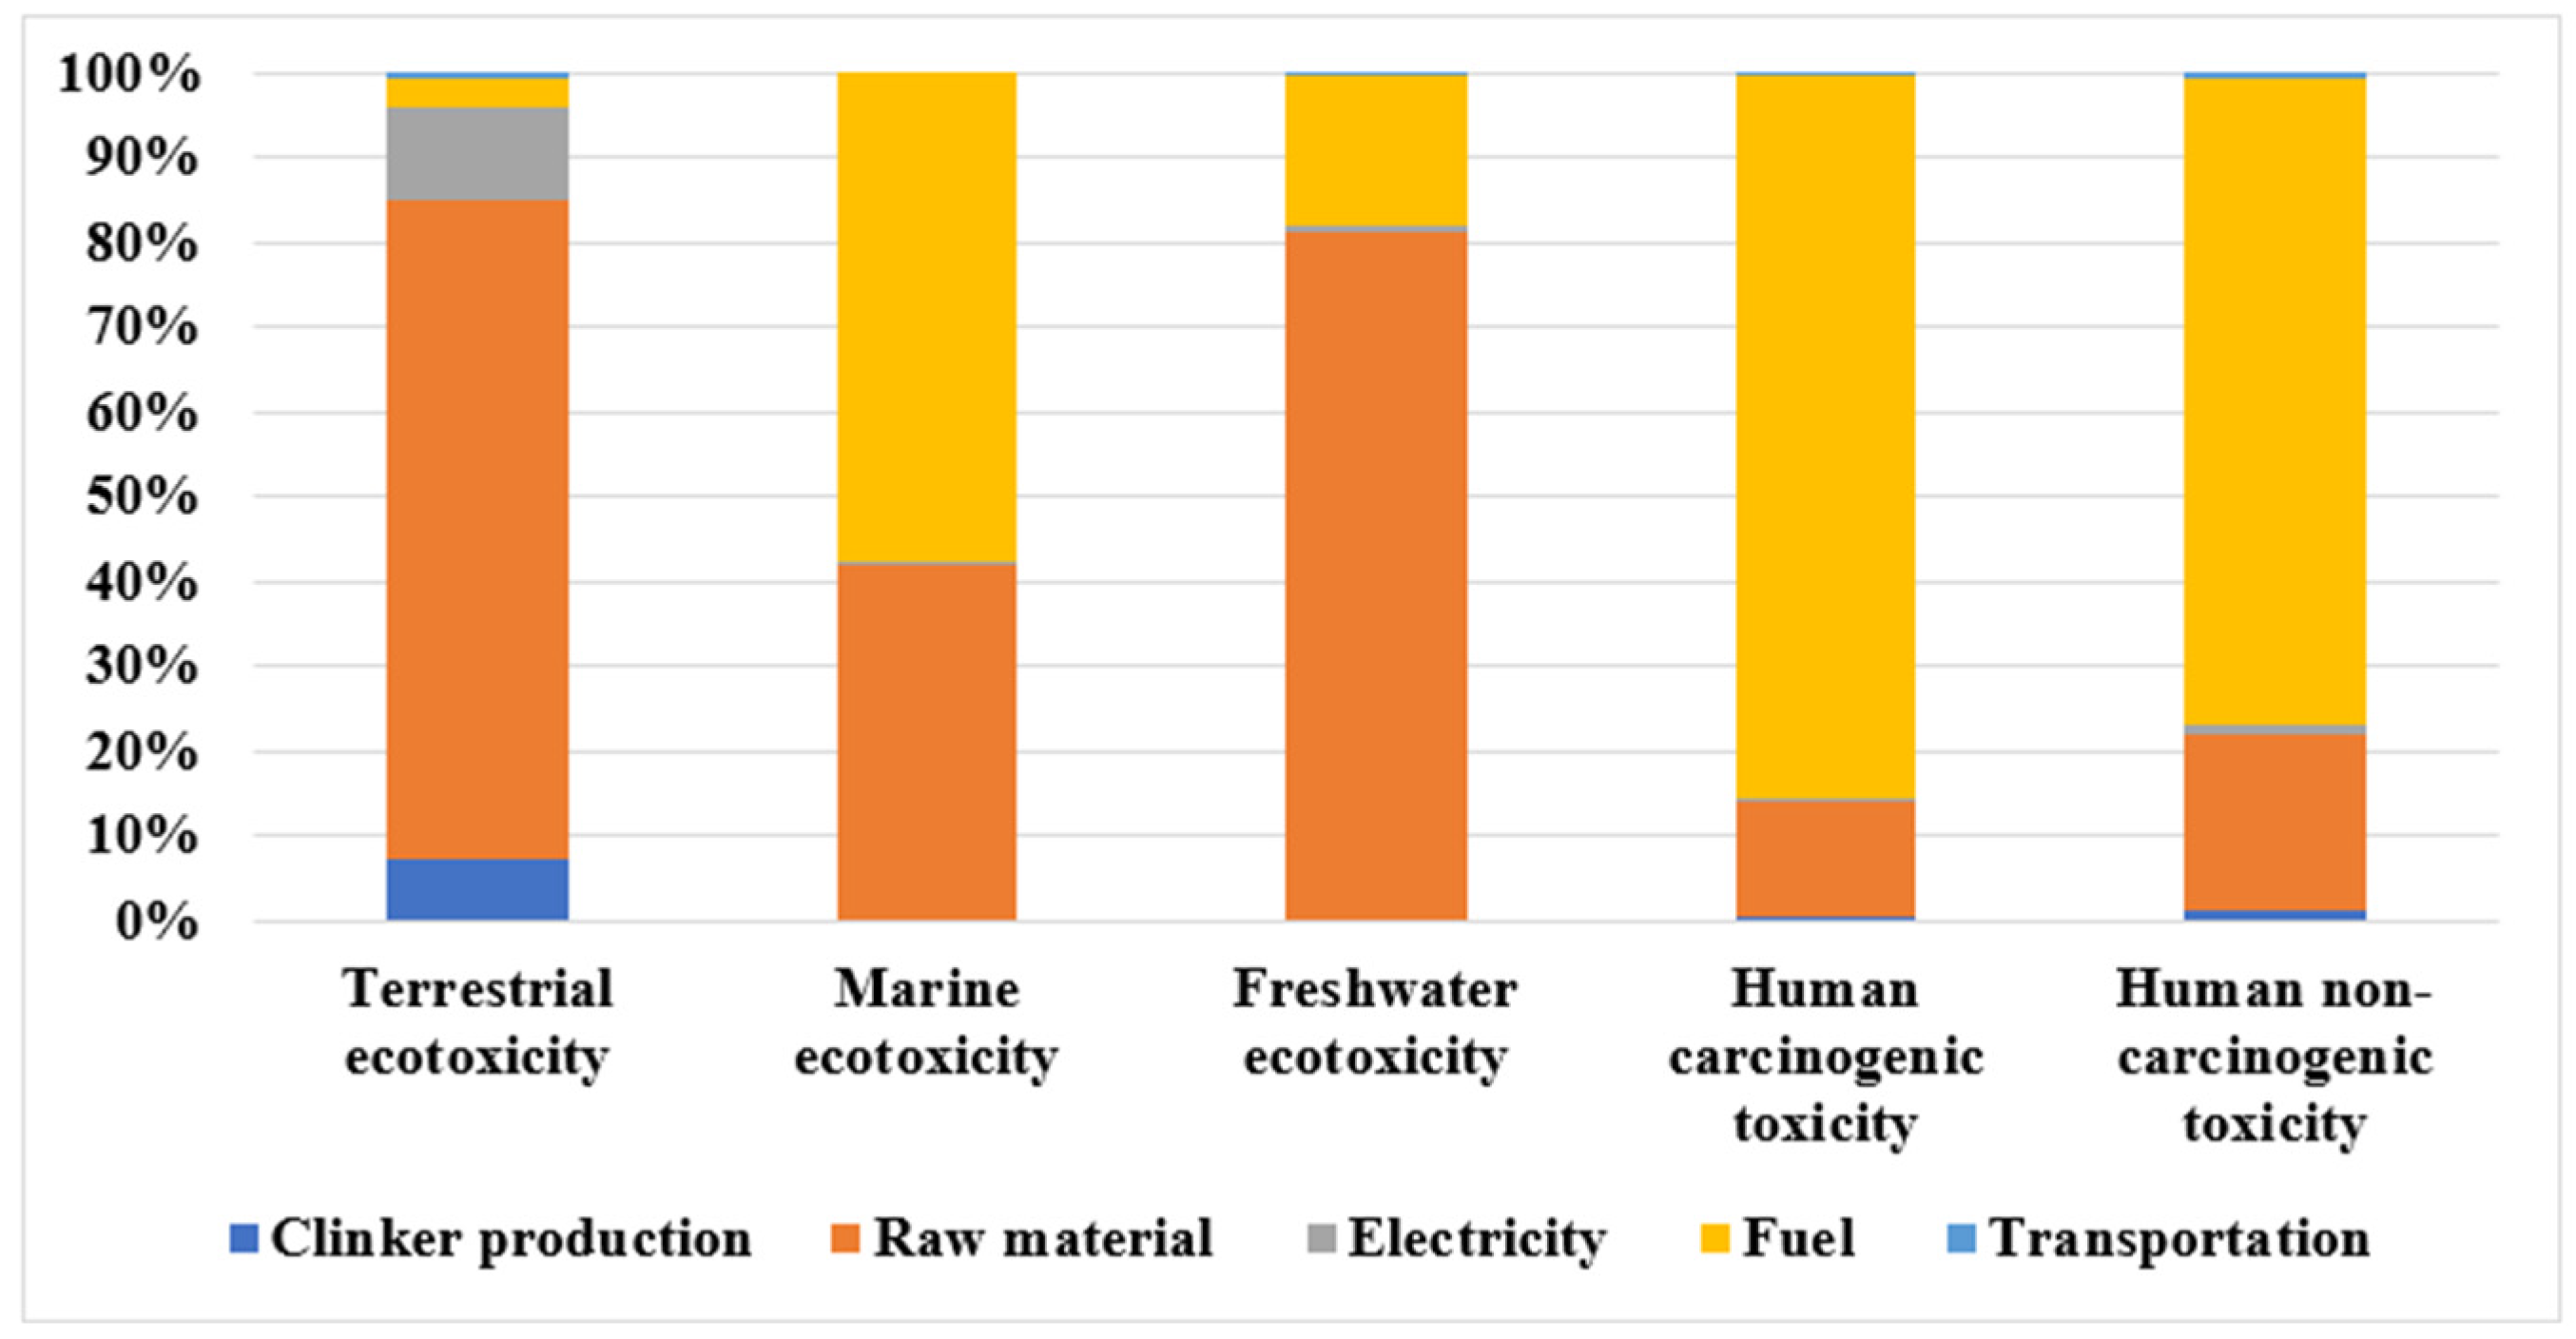
4. Results and Discussion

Figure 2 presents the contribution of each of the five production stages to atmospheric impact categories. Global warming is the most studied impact related to cement production and is measured in kg CO2 eq [8,59,78,96,97,98,99,100].
Global warming potential (GWP): Clinker production showed a high contribution, with 7.63 × 10 kg CO2 eq, to those impact in this study due to the high CO2 emissions associated with clinker production. This means 1 kg of cement produced emitted 1 kg CO2 eq, whereas other compounds, such as 1 kg of methane is equal to 25 kg of CO2 eq. According to earlier studies, CO2 emissions from cement production (calcination reaction and coal burning) are major GWP contributors [8,40,48,76,101]. Cement production emitted an average of around 0.8–1.0-ton CO2/1 ton of Portland cement globally [8,11,102].
Furthermore, global warming has been one of the most widely studied impact categories in the broader LCA literature. This study discovered that the clinker production stage is the primary source of GHG emissions and this is consistent with most studies [8,59,78,96,99,100,103]. According to Wang et al. [80], the clinker production stage is the primary source of GHG emissions in the cement industry. In this study, the South African cement industry contributed 9.93 × 10⁻¹ kg of CO2 eq to GWP. This result is consistent with the values reported in the literature, ranging from 0.628 kg to 0.92 kg CO2 eq per 1 kg of cement [40,59,104,105].
Ozone depletion (OD) happens when the rate of ozone destruction is accelerated by recalcitrant chemicals from anthropogenic emissions containing chlorine or bromine atoms [88,106]. The OD impact is measured in kg CFC11 eq (trichlorofluoromethane or Freon11) and contributed to all the stages, except clinker production. The raw materials consumption and electricity usage were due to limestone extraction and raw material transportation to the plant. The 1.90 kg CO2 eq value can be explained by the different fuel mix and the effect of transportation considered. The ozone depletion value from this study is 1.94 × 10⁷ kg CFC11 eq. The result is in line with previous studies, i.e., 3.97 × 10⁶ to 2.54 × 10⁴ kg CFC11 eq [57,59].
The electricity usage contributes to all atmospheric impact categories, except Ionizing radiation, as shown in Figure 2. The highest harmful atmospheric impact category of the raw material consumption stage was ionizing radiation impact, due to the limestone extraction. Furthermore, emissions from other production stages contributed to atmospheric impacts.
The ozone formation (terrestrial ecosystems and human health) contributed to all the production stages. It is affected by the atmospheric impact, mainly on clinker production and electricity usage. The contribution of the obtained clinker, which is considered a raw material in cement production, cannot be overlooked when it comes to transportation.
Fine particulate matter (FPM) is measured in kg PM2.5 eq and it contributes to atmospheric impact production stages. The FPM contribution is due to the coal used in electricity production during the raw material consumption stage. The atmospheric impact from the clinker production and fuel consumption stage also contributed to the calculation. The size of CO2 released from cement production clarifies why CH4 and N2O have more significant characterization factors among GHGs pollutants and leading causes of climate change.
Figure 3 presents the contribution of each of the five production stages to resource depletion impact categories
Terrestrial acidification (TA) contributed to all production stages. Electricity usage is the main contributor due to the mix, dominated by fossil fuel, followed by clinker production and other resource depletion impacts. TA is a regional environmental impact, primarily related to the SO2 and NOx emissions during fuel burning for calcination and transport, as identified in other cement LCAs [11,82]. The result of the Terrestrial acidification 2.44 × 10³ kg SO2 eq in this study is in line with Li et al. [105], in the range of 1.144–1.467 kg SO2 eq and Josa et al. [40], in the range of 0.71–3.33 kg SO2 eq. Clinker production due to coal burning contributed to the value of 3.60 × 10 in the resource depletion category.
Freshwater is measured in phosphorous (kg P eq) and Marine Eutrophication (ME) is measured in nitrogen (kg N eq) equivalent. They are primary contributors to clinker production and raw material consumption due to SO2 and fewer NOx emissions. The ME contribution to the raw material consumption stage is due to ammonia emissions from explosives, with 2.67 kg N eq. Marine eutrophication is influenced by nitrogen compounds, produced primarily by the oxidation of molecular nitrogen in combustion air (thermal NOx) and the nitrogen compounds oxidation in fuel (fuel NOx) [107].
Fossil resource scarcity is measured in oil equivalent (kg oil eq) and contributes mostly to fuel consumption. However, if fossil fuels control the fuel mix used to generate electricity, this can affect terrestrial acidification. In addition, mineral and fossil resources scarcity contribute to raw material consumption and clinker production due to fuel burning and the explosives used, as identified by Stafford et al. [57].
The contribution of the transportation stage to the terrestrial acidification (3.40 kg SO2 eq) value was due to the transportation of raw materials and fossil fuels in clinker production. Fuels used as primary energy sources in cement production, such as crude oil, natural gas, and coal, contributed to the value of fossil resource scarcity (1.39 × 101 kg oil eq) in cement plants.
Figure 4 presents the contribution of each of the five production stages to the toxicity impact categories.
The freshwater ecotoxicity and marine ecotoxicity impact categories showed similar profiles. The main contributors to the toxicity impact are raw material and fuel consumption due to fossil fuel extraction and raw material extraction, obtained with the values of 4.19 × 10. Fossil consumption contribution is attributed to coal burning. The low toxicity in transportation was due to energy usage during raw material transportation.
The human carcinogenic toxicity contribution to the fuel consumption stage was due to the coal burning in the kiln and electricity generation for the process. Human non-carcinogenic toxicity is also crucial in fuel consumption and raw material. Due to the efficient use of electricity in South African cement plants, electricity usage makes no significant contribution to any impact category. The average consumption in the United States is 142 kWh/ton of cement, while 110 kWh is consumed in South Africa [108,109].
Although there are some differences in the methods, it is widely agreed that the atmospheric category from the kiln is the primary cause of impact in the cement industry. As shown in Figure 4, these impacts depend on the fuels used, raw materials and installed technology. The Cement Sustainability Initiative states that replacing fossil fuels in cement production could reduce atmospheric emissions, if well controlled, and can be an excellent means of reducing fossil fuel usage [110]. According to Ecoinvent, extracting 100 kg of diesel oil can release 62.7 kg CO2 eq and contribute 127 kg oil eq to fossil depletion [89].
The heavy use of traditional fuels (coal) in the South African cement kiln can be replaced with alternative fuels, for example, waste-derived fuels. Using waste-derived fuels instead of traditional fuel reduces emissions and fossil resources used in the cement industry, making it a sustainable method for recycling various waste materials [111,112]. Hence, it could be agreed that the choice of materials and fuels directly influence the relationship between the cement plant and the environment.

5. Conclusions

In this study, the cement production stages, i.e., raw materials consumption, production fuels consumption, clinker production, transportation and electricity, were analyzed using the life cycle assessment method. The findings show that each process impacted the environmental categories, according to atmospheric, resource depletion and toxicity categories. The environmental impact of each process of cement production was proportional to the related inputs and outputs. In terms of the atmospheric impact of cement production, the kiln affected all impact categories, except ozone depletion and ionizing radiation. The kiln caused most of the global warming impact. This was expected, as limestone calcination, the primary source of CO2 emissions, is known to contribute to global warming. The clinker production stage produces the most significant environmental emissions due to calcium carbonate decomposition and coal consumption, particularly GHG emissions. Global warming is affected by GHGs emission.
The study’s findings show that massive raw materials consumption and fossil fuels are the factors that have the most impact on the resource depletion and toxicity categories. The production of fossil fuels significantly contributed to the atmospheric impact category. In addition, the consumption of electricity was also a significant factor, contributing to the atmospheric impact from fossil fuels used in generating electricity. Thus, using alternative raw materials and fuel could be a sustainable way to reduce environmental emissions. According to the characterization results of the mid-term analysis, the highest environmental impact of cement production was on global warming, terrestrial ecotoxicity, human non-carcinogenic toxicity and fossil resource scarcity. For each 1 kg of Portland cement produced, the highest environmental impact values were 9.93 × 10⁻¹ kg CO2 eq (global warming), 1.04 kg 1.4-DCB (terrestrial ecotoxicity), 4.97 × 10⁻¹ kg 1.4-DCB (human non-carcinogenic toxicity), and 1.39 × 10⁻¹ kg oil eq (fossil resource scarcity).
Apart from the fossil resources’ scarcity, which is linked to the consumption of fossil resources, other impacts are related to direct emissions from the clinker production stage. In this situation, measures to improve the South African cement industry’s sustainability should focus primarily on reducing emissions from the clinker production stage by upgrading the production process, increasing the ratio of clinker substitutes, such as slag and fly ash, the use of alternative fuels to reduce coal and fossil fuel use, and improving energy efficiency. Finally, further research is recommended concerning efficiency measures to reduce the environmental impact, using energy-efficient technologies in the kilns and implementing on-site energy recovery technologies.
This study indicated that the South African cement industry is responsible for significant environmental impacts, including global warming, terrestrial ecotoxicity, human non-carcinogenic toxicity and fossil resource scarcity, all identified as hotspots in the midpoint method. The main factors contributing to these impacts are CO2, NOx, SO2, and PM2.5 emissions. These are direct emissions from the clinker production and fuel consumption stage for energy (electricity and transportation). As the main impact hotspots have been identified, the options of implementing energy-efficient technologies and on-site energy recovery technologies can be considered, including fuel and energy-saving approaches and alternative fuels and materials. With the energy-efficient technologies option, fossil resource scarcity can effectively reduce and encourage the utilization of scarce resources sustainably. There are many ways to implement energy-efficient technologies options, including process integration and modification, proper maintenance, plant optimization, and energy recovery. For example, process modifications, switching from a wet to dry process, using a pre-calciner, could reduce thermal energy consumption in cement kilns by about 50%, resulting in a 20% reduction in CO2 emissions [78]. Another promising way to reduce CO2 emissions is through energy recovery from exhaust streams. During the clinker production stage, there are thermal heat losses in pyro-processing due to the flue gas and hot air streams. The heat losses can be recaptured to produce electricity using steam turbines [78]. On-site energy recovery technology options include using alternative materials, fuels and the clinker used during the cement production process [78]. The chemical decomposition of CaCO3 in the clinker production stage contributes the most to CO2 emissions. It is possible to reduce CO2 emissions during this stage by reducing the amount of clinker and replacing it with other supplementary cement materials, such as natural pozzolana (fly ash, slag, etc.). The high process temperature in cement kilns can help burn waste efficiently. Using waste co-burning or biomass material as a fuel substitute can, thus, reduce the amount of coal or fossil fuels needed in the clinker production stage (the kiln), thereby reducing CO2 and other emissions. Furthermore, it provides a sustainable waste management solution, as it contributes to GHGs reduction and other air pollutants released by the open burning of waste [15].

Author Contributions

Methodology, O.E.I.; software, O.E.I.; validation, O.E.I.; writing—original draft preparation, O.E.I.; writing—review and editing O.A.O., K.J.D. and O.C.C.; supervision, O.A.O., K.J.D. and O.C.C. All authors have read and agreed to the published version of the manuscript.

Funding

This research was funded by The National Research Foundation of South Africa (Grant Number 131604).

Institutional Review Board Statement

Not applicable.

Informed Consent Statement

Not applicable.

Data Availability Statement

Not applicable.

Conflicts of Interest

The authors declare no conflict of interest.

References

  1. Worrell, E.; Price, L.; Martin, N.; Hendriks, C.; Meida, L.O. Carbon dioxide emissions from the global cement industry. Annu. Rev. Energy Environ. 2001, 26, 303–329. [Google Scholar] [CrossRef]
  2. WBCSD. The Cement Sustainability Initiative (CSI) Recycling Concrete Excutive Summary; World Business Council for Sustainable Development: Geneva, Switzerland, 2009. [Google Scholar]
  3. IEA; WBCSD. Cement Technology Roadmap 2009—Carbon Emissions Reductions up to 2050; Energy Agency (IEA): Paris, France, 2021; pp. 1–2. [Google Scholar]
  4. Miccoli, S.; Finucci, F.; Murro, R. Criteria and procedures for regional environmental regeneration: A European strategic project. In Applied Mechanics and Materials; Trans Tech Publications Ltd.: Bäch, Switzerland, 2014; Volume 675, pp. 401–405. [Google Scholar]
  5. Usón, A.A.; Ferreira, G.; López-Sabirón, A.M.; Sastresa, E.L.; De Guinoa, A.S. Characterisation and environmental analysis of sewage sludge as secondary fuel for cement manufacturing. Chem. Eng. Trans. 2012, 29, 457–462. [Google Scholar]
  6. Summerbell, D.L.; Barlow, C.Y.; Cullen, J.M. Potential reduction of carbon emissions by performance improvement: A cement industry case study. J. Clean. Prod. 2016, 135, 1327–1339. [Google Scholar] [CrossRef]
  7. Nadal, M.; Schuhmacher, M.; Domingo, J.L. Cost–benefit analysis of using sewage sludge as alternative fuel in a cement plant: A case study. Environ. Sci. Pollut. Res. 2009, 16, 322–328. [Google Scholar] [CrossRef] [PubMed]
  8. Feiz, R.; Ammenberg, J.; Baas, L.; Eklund, M.; Helgstrand, A.; Marshall, R. Improving the CO2 performance of cement, part I: Utilizing life-cycle assessment and key performance indicators to assess development within the cement industry. J. Clean. Prod. 2015, 98, 272–281. [Google Scholar] [CrossRef] [Green Version]
  9. Cao, Z.; Shen, L.; Zhao, J.; Liu, L.; Zhong, S.; Sun, Y.; Yang, Y. Toward a better practice for estimating the CO2 emission factors of cement production: An experience from China. J. Clean. Prod. 2016, 139, 527–539. [Google Scholar] [CrossRef]
  10. IEA. “Cement”, IEA Report. 2020. Available online: https://www.iea.org/reports/cement (accessed on 15 January 2022).
  11. Pacheco-Torgal, F.; Cabeza, L.F.; Labrincha, J.; De Magalhaes, A.G. Eco-Efficient Construction and Building Materials: Life Cycle Assessment (LCA), Eco-Labelling and Case Studies; Woodhead Publishing: Cambridge, UK, 2014. [Google Scholar]
  12. IEA. Enrgy Technology Transitions for Industry, Paris, France. 2009. Available online: https://www.iea.org/publications/freepublications/publication/industry2009.pdf (accessed on 15 January 2022).
  13. IEAGHG. CO2 Capture in the Cement Industry. IEA Greenhouse Gas R&D Programme, Technical Study, Report, UK 2008/3; IEA Greenhouse Gas R & D Programme: Cheltenham, UK, 2008. [Google Scholar]
  14. Madlool, N.; Saidur, R.; Hossain, M.; Rahim, N. A critical review on energy use and savings in the cement industries. Renew. Sustain. Energy Rev. 2011, 15, 2042–2060. [Google Scholar] [CrossRef]
  15. Ali, M.; Saidur, R.; Hossain, M. A review on emission analysis in cement industries. Renew. Sustain. Energy Rev. 2011, 15, 2252–2261. [Google Scholar] [CrossRef]
  16. Ige, O.E. Energy Efficiency in the South African Cement Finishing Plant: Drivers, Barriers and Improvement; UKZN: Durban, South Africa, 2018. [Google Scholar]
  17. Ige, O.E.; Inambao, F.L.; Olanrewaju, O.A.; Duffy, K.J.; Collins, O.C. Drivers and Barriers to Industrial Energy Efficiency: A Case Study of South Africa’s Cement Finishing Mill Plant; Acosta, M.J., Ed.; Nova Science Publishers: New York, NY, USA, 2020; Volume 33, p. 45. [Google Scholar]
  18. Ige, O.E.; Olanrewaju, O.A.; Duffy, K.J.; Collins, O.C. A review of the effectiveness of Life Cycle Assessment for gauging environmental impacts from cement production. J. Clean. Prod. 2021, 324, 129213. [Google Scholar] [CrossRef]
  19. Wang, J.; Dai, Y.; Gao, L. Exergy analyses and parametric optimizations for different cogeneration power plants in cement industry. Appl. Energy 2009, 86, 941–948. [Google Scholar] [CrossRef]
  20. Singhi, M.; Bhargava, R. Sustainable Indian cement industry. In Proceedings of the Workshop on International comparison of Industrial Energy Efficiency, New Delhi, India, 27–28 January 2010; pp. 27–28. [Google Scholar]
  21. Lidbetter, R.T. Demand Side Management Opportunities for a Typical South African Cement Plant; North-West University: Pochefstrum, South Africa, 2010. [Google Scholar]
  22. Kumar, A. Global warming, climate change and greenhouse gas mitigation. In Biofuels: Greenhouse Gas Mitigation and Global Warming; Springer: New Delhi, India, 2018; pp. 1–16. [Google Scholar]
  23. O’Connor, R.E.; Bord, R.J.; Yarnal, B.; Wiefek, N. Who wants to reduce greenhouse gas emissions? Soc. Sci. Q. 2002, 83, 1–17. [Google Scholar] [CrossRef]
  24. Dodman, D. Blaming cities for climate change? An analysis of urban greenhouse gas emissions inventories. Environ. Urban. 2009, 21, 185–201. [Google Scholar] [CrossRef] [Green Version]
  25. Statistics, I. Key World Energy Statistics; Paris International Energy Agency: Paris, France, 2014. [Google Scholar]
  26. Arto, I.; Capellán-Pérez, I.; Lago, R.; Bueno, G.; Bermejo, R. The energy requirements of a developed world. Energy Sustain. Dev. 2016, 33, 1–13. [Google Scholar] [CrossRef] [Green Version]
  27. Anand, S.; Vrat, P.; Dahiya, R. Application of a system dynamics approach for assessment and mitigation of CO2 emissions from the cement industry. J. Environ. Manag. 2006, 79, 383–398. [Google Scholar] [CrossRef] [PubMed]
  28. Bekun, F.V.; Emir, F.; Sarkodie, S.A. Another look at the relationship between energy consumption, carbon dioxide emissions, and economic growth in South Africa. Sci. Total Environ. 2019, 655, 759–765. [Google Scholar] [CrossRef] [PubMed]
  29. DEA. GHG Inventory for South Africa 2000–2010; Forestry, Fisheries and the Environment, Republic of South Africa: Pretoria, South Africa, 2013.
  30. DEA. GHG National Inventory Report For South Africa 2000–2010; Department of Environmental Affairs (DEA): Pretoria, South Africa, 2014. Available online: http://www.saaqis.org.za (accessed on 9 January 2022).
  31. Mann, M.; Spath, P. A life cycle assessment of biomass cofiring in a coal-fired power plant. Clean Prod. Process. 2001, 3, 81–91. [Google Scholar] [CrossRef]
  32. Whitaker, M.; Heath, G.A.; O’Donoughue, P.; Vorum, M. Life cycle greenhouse gas emissions of coal-fired electricity generation: Systematic review and harmonization. J. Ind. Ecol. 2012, 16, S53–S72. [Google Scholar] [CrossRef]
  33. Inglesi, R.; Pouris, A. Forecasting electricity demand in South Africa: A critique of Eskom’s projections. S. Afr. J. Sci. 2010, 106, 50–53. [Google Scholar] [CrossRef]
  34. Gross, C. Electricity Generation Options considered by Eskom. In Presentation at the Energy Planning Colloquium; Eskom Holding: Johannesburg, South Africa, 2012; Volume 30. [Google Scholar]
  35. Swanepoel, J.A.; Mathews, E.H.; Vosloo, J.; Liebenberg, L. Integrated energy optimisation for the cement industry: A case study perspective. Energy Convers. Manag. 2014, 78, 765–775. [Google Scholar] [CrossRef]
  36. Humphreys, K.; Mahasenan, M. Towards a Sustainable Cement Industry. Substudy 8: Climate Change; World Business Conuncil for Sustainable Development: Geneva, Switzerland, 2002. [Google Scholar]
  37. Karagiannidis, A. Waste to Energy; Opportunities and Challenges for Developing and Transition Economies; Springer: London, UK, 2012. [Google Scholar]
  38. Scalet, B.M. Best Available Techniques (BAT) Reference Document for the Production of Cement, Lime and Magnesium Oxide (CLM BREF); European Commission Joint Research Centre Institute for Prospective Technological Studies: Luxembourg, 2013. [Google Scholar]
  39. Phair, J.W. Green chemistry for sustainable cement production and use. Green Chem. 2006, 8, 763–780. [Google Scholar] [CrossRef]
  40. Josa, A.; Aguado, A.; Cardim, A.; Byars, E. Comparative analysis of the life cycle impact assessment of available cement inventories in the EU. Cem. Concr. Res. 2007, 37, 781–788. [Google Scholar] [CrossRef] [Green Version]
  41. Al-Dadi, M.; Hassan, H.; Sharshar, T.; Arida, H.; Badran, H. Environmental impact of some cement manufacturing plants in Saudi Arabia. J. Radioanal. Nucl. Chem. 2014, 302, 1103–1117. [Google Scholar] [CrossRef]
  42. Galvez-Martos, J.-L.; Schoenberger, H. An analysis of the use of life cycle assessment for waste co-incineration in cement kilns. Resour. Conserv. Recycl. 2014, 86, 118–131. [Google Scholar] [CrossRef]
  43. ISO/TS 14072:2014; Environmental Management Life Cycle Assessment Requirements and Guidelines for Organizational Life Cycle Assessment. International Organization for Standardization: Geneva, Switzerland, 2014. Available online: https://www.iso.org/obp/ui/#iso:std:iso:ts:14072:ed-1:v1:en (accessed on 1 March 2022).
  44. ISO. 14040 Environmental Management: Life Cycle Assessment; Principles and Framework; International Organization for Standardization: Geneva, Switzerland, 2006. [Google Scholar]
  45. ISO. 14044 Environmental Management: Life Cycle Assessment; Requirements and Guidelines; ISO: Geneva, Switzerland, 2006. [Google Scholar]
  46. Petek Gursel, A.; Masanet, E.; Horvath, A.; Stadel, A. Life-cycle inventory analysis of concrete production: A critical review. Cem. Concr. Compos. 2014, 51, 38–48. [Google Scholar] [CrossRef]
  47. Centre, J. ILCD Handbook: Analysing of Existing Environmental Impact Assessment Methodologies for Use in Life Cycle Assessment; Euronpean Union: Rome, Italy, 2010. [Google Scholar]
  48. Huntzinger, D.N.; Eatmon, T.D. A life-cycle assessment of Portland cement manufacturing: Comparing the traditional process with alternative technologies. J. Clean. Prod. 2009, 17, 668–675. [Google Scholar] [CrossRef]
  49. Boesch, M.E.; Hellweg, S. Identifying improvement potentials in cement production with life cycle assessment. Environ. Sci. Technol. 2010, 44, 9143–9149. [Google Scholar] [CrossRef]
  50. Amrina, E.; Vilsi, A.L. Key performance indicators for sustainable manufacturing evaluation in cement industry. Procedia Cirp 2015, 26, 19–23. [Google Scholar] [CrossRef] [Green Version]
  51. Wang, X.; Chan, H.K.; Li, D. A case study of an integrated fuzzy methodology for green product development. Eur. J. Oper. Res. 2015, 241, 212–223. [Google Scholar] [CrossRef]
  52. Blengini, G.A.; Busto, M.; Fantoni, M.; Fino, D. Eco-efficient waste glass recycling: Integrated waste management and green product development through LCA. Waste Manag. 2012, 32, 1000–1008. [Google Scholar] [CrossRef] [PubMed]
  53. Mazari, M.; Aval, S.F.; Satani, S.M.; Corona, D.; Garrido, J. Developing Guidelines for Assessing the Effectiveness of Intelligent Compaction Technology; Mineta Transportation Institute Publication: San Jose, CA, USA, 2021. [Google Scholar] [CrossRef]
  54. Satani, S.; Aval, S.; Garrido, J.; Mazari, M. Preliminary evaluation of using intelligent compaction for life cycle assessment and life cycle cost analysis of pavement structures. In Pavement, Roadway, and Bridge Life Cycle Assessment 2020; Taylor & Franscis Group: London, UK, 2020; pp. 460–468. [Google Scholar]
  55. Boughrara, S.; Aksas, H.; Louhab, K. Comparative Study of Wet and Dry Process of Cement Manufacturing Using Life Cycle Assessment Approach; University of Boumerdes: Boumerdes, Algeria, 2014. [Google Scholar]
  56. García-Gusano, D.; Garraín, D.; Herrera, I.; Cabal, H.; Lechón, Y. Life Cycle Assessment of applying CO2 post-combustion capture to the Spanish cement production. J. Clean. Prod. 2015, 104, 328–338. [Google Scholar] [CrossRef]
  57. Stafford, F.N.; Raupp-Pereira, F.; Labrincha, J.A.; Hotza, D. Life cycle assessment of the production of cement: A Brazilian case study. J. Clean. Prod. 2016, 137, 1293–1299. [Google Scholar] [CrossRef]
  58. Morsali, S. Emissions from portland cement production using life cycle assessment inventory and method. Environ. Energy Econ 2016, 1, 1–8. [Google Scholar]
  59. Chen, W.; Hong, J.; Xu, C. Pollutants generated by cement production in China, their impacts, and the potential for environmental improvement. J. Clean. Prod. 2015, 103, 61–69. [Google Scholar] [CrossRef]
  60. Hong, J.; Li, X. Environmental assessment of sewage sludge as secondary raw material in cement production—A case study in China. Waste Manag. 2011, 31, 1364–1371. [Google Scholar] [CrossRef] [PubMed]
  61. Strazza, C.; Del Borghi, A.; Gallo, M.; Del Borghi, M. Resource productivity enhancement as means for promoting cleaner production: Analysis of co-incineration in cement plants through a life cycle approach. J. Clean. Prod. 2011, 19, 1615–1621. [Google Scholar] [CrossRef]
  62. Valderrama, C.; Granados, R.; Cortina, J.L.; Gasol, C.M.; Guillem, M.; Josa, A. Implementation of best available techniques in cement manufacturing: A life-cycle assessment study. J. Clean. Prod. 2012, 25, 60–67. [Google Scholar] [CrossRef]
  63. Dabbaghi, F.; Sadeghi-Nik, A.; Libre, N.A.; Nasrollahpour, S. Characterizing fiber reinforced concrete incorporating zeolite and metakaolin as natural pozzolans. In Structures; Elsevier: Amsterdam, The Netherlands, 2021; pp. 2617–2627. [Google Scholar]
  64. Mousavi, M.A.; Sadeghi-Nik, A.; Bahari, A.; Jin, C.; Ahmed, R.; Ozbakkaloglu, T.; de Brito, J. Strength optimization of cementitious composites reinforced by carbon nanotubes and Titania nanoparticles. Constr. Build. Mater. 2021, 303, 124510. [Google Scholar] [CrossRef]
  65. Mazari, M.; Aval, S.F.; Rodriguez-Nikl, T. Evaluating the Use of Recycled and Sustainable Materials in Self-Consolidating Concrete for Underground Infrastructure Applications; U.S. Department of Transportation. Office of the Assistant Secretary for Research and Technology: Washington, DC, USA, 2020.
  66. Bahari, A.; Sadeghi-Nik, A.; Cerro-Prada, E.; Sadeghi-Nik, A.; Roodbari, M.; Zhuge, Y. One-step random-walk process of nanoparticles in cement-based materials. J. Cent. South Univ. 2021, 28, 1679–1691. [Google Scholar] [CrossRef]
  67. Bahari, A.; Sadeghi-Nik, A.; Shaikh, F.U.A.; Sadeghi-Nik, A.; Cerro-Prada, E.; Mirshafiei, E.; Roodbari, M. Experimental studies on rheological, mechanical, and microstructure properties of self-compacting concrete containing perovskite nanomaterial. Struct. Concr. 2021, 29, 19262–19272. [Google Scholar] [CrossRef]
  68. Askarian, M.; Fakhretaha Aval, S.; Joshaghani, A. A comprehensive experimental study on the performance of pumice powder in self-compacting concrete (SCC). J. Sustain. Cement-Based Mater. 2018, 7, 340–356. [Google Scholar] [CrossRef]
  69. Vahabi, M.Y.; Tahmouresi, B.; Mosavi, H.; Aval, S.F. Effect of pre-coating lightweight aggregates on the self-compacting concrete. Struct. Concr. 2021, 1–12. [Google Scholar] [CrossRef]
  70. Tüfekçi, M.; Demirbaş, A.; Genc, H. Evaluation of steel furnace slags as cement additives. Cem. Concr. Res. 1997, 27, 1713–1717. [Google Scholar] [CrossRef]
  71. Xu, X.; Tian, Y. Application of Electric Arc Furnace Dust in Cement Production. Iron Steel 1998, 33, 61–64. [Google Scholar]
  72. Hilton, R.G. Use of Stabilized EAFD as a Raw Material in the Production of a Portland Cement Clinker. U.S. Patent 5,853,474, 29 December 1998. [Google Scholar]
  73. Yüksel, İ. A review of steel slag usage in construction industry for sustainable development. Environ. Dev. Sustain. 2017, 19, 369–384. [Google Scholar] [CrossRef]
  74. Zhang, X.; Zhao, S.; Liu, Z.; Wang, F. Utilization of steel slag in ultra-high performance concrete with enhanced eco-friendliness. Constr. Build. Mater. 2019, 214, 28–36. [Google Scholar] [CrossRef]
  75. Josa, A.; Aguado, A.; Heino, A.; Byars, E.; Cardim, A. Comparative analysis of available life cycle inventories of cement in the EU. Cem. Concr. Res. 2004, 34, 1313–1320. [Google Scholar] [CrossRef] [Green Version]
  76. Chen, C.; Habert, G.; Bouzidi, Y.; Jullien, A. Environmental impact of cement production: Detail of the different processes and cement plant variability evaluation. J. Clean. Prod. 2010, 18, 478–485. [Google Scholar] [CrossRef]
  77. Beltran, L.; Arnesh, T. Uses of Alternative Fuels as Best Practices to Reduce CO2 Emissions from the South African Cement Industry. In Proceedings of the International Conference on Industrial Engineering and Operations Management Pretoria/Johannesburg, Bogota, Colombia, 29 October–1 November 2018. [Google Scholar]
  78. Benhelal, E.; Zahedi, G.; Shamsaei, E.; Bahadori, A. Global strategies and potentials to curb CO2 emissions in cement industry. J. Clean. Prod. 2013, 51, 142–161. [Google Scholar] [CrossRef]
  79. Hasanbeigi, A.; Springer, C. California’s Cement Industry: Failing the Climate Challenge; Global Efficiency Intelligence: San Francisco, CA, USA, 2019. [Google Scholar]
  80. Wang, Y.; Zhu, Q.; Geng, Y. Trajectory and driving factors for GHG emissions in the Chinese cement industry. J. Clean. Prod. 2013, 53, 252–260. [Google Scholar] [CrossRef]
  81. Sagastume Gutiérrez, A.; Cabello Eras, J.J.; Gaviria, C.A.; Van Caneghem, J.; Vandecasteele, C. Improved selection of the functional unit in environmental impact assessment of cement. J. Clean. Prod. 2017, 168, 463–473. [Google Scholar] [CrossRef]
  82. Tun, T.Z.; Bonnet, S.; Gheewala, S.H. Life cycle assessment of Portland cement production in Myanmar. Int. J. Life Cycle Assess. 2020, 25, 2106–2121. [Google Scholar] [CrossRef]
  83. Marceau, M.; Nisbet, M.A.; Van Geem, M.G. Life Cycle Inventory of Portland Cement Manufacture; Portland Cement Association: Skokie, IL, USA, 2006. [Google Scholar]
  84. Thwe, E.; Khatiwada, D.; Gasparatos, A. Life cycle assessment of a cement plant in Naypyitaw, Myanmar. Clean. Environ. Syst. 2021, 2, 100007. [Google Scholar] [CrossRef]
  85. Rosyid, A.; Boedisantoso, R.; Iswara, A. Environmental impact studied using life cycle assessment on cement industry. In Proceedings of IOP Conference Series: Earth and Environmental Science; IOP Publishing: Philadelphia, PA, USA, 2020; Volume 506, p. 012024. [Google Scholar]
  86. Goedkoop, M.; De Schryver, A.; Oele, M.; Durksz, S.; de Roest, D. Introduction to LCA with SimaPro 7; PRé Consultants: San Francisco, CA, USA, 2008. [Google Scholar]
  87. PRé Sustainability. “SimaPro”, Software to Measure and Improve the Impact of Your Product Life Cycle. 2017. Available online: Pre-sustainability.com/simapro (accessed on 13 June 2017).
  88. Goedkoop, M.; Heijungs, R.; Huijbregts, M.; De Schryver, A.; Struijs, J.; Van Zelm, R. ReCiPe 2008: A life Cycle Impact Assessment Method which Comprises Harmonised Category Indicators at the Midpoint and the Endpoint Level; PRé Consultants: Amersfoort, The Netherland, 2009; Volume 1, pp. 1–126. [Google Scholar]
  89. Moreno Ruiz, E.; Valsasina, L.; FitzGerald, D.; Symeonidis, A.; Turner, D.; Müller, J.; Minas, N.; Bourgault, G.; Vadenbo, C.; Ioannidou, D. Cement Production: Documentation of Changes Implemented in Ecoinvent Database v3. 7 & v3. 7.1. Documentation Cement Production, Portland-ZA”, Ecoinvent Association, Allocation, Cut-off ed. Identifying Improvement Potentials in Cement Production with Life Cycle Assessment 2010, 2019; Ecoinvent Association: Zürich, Switzerland, 2020. [Google Scholar]
  90. Dreyer, L.C.; Niemann, A.L.; Hauschild, M.Z. Comparison of three different LCIA methods: EDIP97, CML2001 and Eco-indicator 99. Int. J. Life Cycle Assess. 2003, 8, 191–200. [Google Scholar] [CrossRef]
  91. Azapagic, A.; Clift, R. The application of life cycle assessment to process optimisation. Comput. Chem. Eng. 1999, 23, 1509–1526. [Google Scholar] [CrossRef]
  92. Huijbregts, M.A.J.; Thissen, U.; Guinée, J.B.; Jager, T.; Kalf, D.; van de Meent, D.; Ragas, A.M.J.; Wegener Sleeswijk, A.; Reijnders, L. Priority assessment of toxic substances in life cycle assessment. Part I: Calculation of toxicity potentials for 181 substances with the nested multi-media fate, exposure and effects model USES–LCA. Chemosphere 2000, 41, 541–573. [Google Scholar] [CrossRef]
  93. Pennington, D.W.; Potting, J.; Finnveden, G.; Lindeijer, E.; Jolliet, O.; Rydberg, T.; Rebitzer, G. Life cycle assessment Part 2: Current impact assessment practice. Environ. Int. 2004, 30, 721–739. [Google Scholar] [CrossRef] [PubMed]
  94. Finnveden, G.; Hofstetter, P.; Bare, J.; Basson, L.; Ciroth, A.; Mettier, T.; Seppälä, J.; Johansson, J.; Norris, G.; Volkwein, S. Normalization, grouping and weighting in life cycle impact assessment. In Life Cycle Impact Assessment: Striving towards Best Practice. Society of Environmental Toxicology and Chemistry (SETAC); SETAC Press: Pensacola, FL, USA, 2002; pp. 177–208. [Google Scholar]
  95. Pré Consultants, B. SimaPro. 2016. Available online: https://network.simapro.com/esuservices (accessed on 15 December 2021).
  96. Uwasu, M.; Hara, K.; Yabar, H. World cement production and environmental implications. Environ. Dev. 2014, 10, 36–47. [Google Scholar] [CrossRef]
  97. Zhang, J.; Liu, G.; Chen, B.; Song, D.; Qi, J.; Liu, X. Analysis of CO2 emission for the cement manufacturing with alternative raw materials: A LCA-based framework. Energy Procedia 2014, 61, 2541–2545. [Google Scholar] [CrossRef] [Green Version]
  98. Feiz, R.; Ammenberg, J.; Baas, L.; Eklund, M.; Helgstrand, A.; Marshall, R. Improving the CO2 performance of cement, part II: Framework for assessing CO2 improvement measures in the cement industry. J. Clean. Prod. 2015, 98, 282–291. [Google Scholar] [CrossRef] [Green Version]
  99. Vatopoulos, K.; Tzimas, E. Assessment of CO2 capture technologies in cement manufacturing process. J. Clean. Prod. 2012, 32, 251–261. [Google Scholar] [CrossRef]
  100. Ammenberg, J.; Baas, L.; Eklund, M.; Feiz, R.; Helgstrand, A.; Marshall, R. Improving the CO2 performance of cement, part III: The relevance of industrial symbiosis and how to measure its impact. J. Clean. Prod. 2015, 98, 145–155. [Google Scholar] [CrossRef] [Green Version]
  101. Güereca, L.P.; Torres, N.; Juárez-López, C.R. The co-processing of municipal waste in a cement kiln in Mexico. A life-cycle assessment approach. J. Clean. Prod. 2015, 107, 741–748. [Google Scholar] [CrossRef]
  102. Hu, D.; Guo, Z.; Wang, Z.; Xiao, Q. Metabolism analysis and eco-environmental impact assessment of two typical cement production systems in Chinese enterprises. Ecol. Inform. 2015, 26, 70–77. [Google Scholar] [CrossRef]
  103. Zhang, J.; Cheng, J.C.; Lo, I.M. Life cycle carbon footprint measurement of Portland cement and ready mix concrete for a city with local scarcity of resources like Hong Kong. Int. J. Life Cycle Assess. 2014, 19, 745–757. [Google Scholar] [CrossRef]
  104. García-Gusano, D.; Herrera, I.; Garraín, D.; Lechón, Y.; Cabal, H. Life cycle assessment of the Spanish cement industry: Implementation of environmental-friendly solutions. Clean Technol. Environ. Policy 2015, 17, 59–73. [Google Scholar] [CrossRef]
  105. Li, C.; Cui, S.; Nie, Z.; Gong, X.; Wang, Z.; Itsubo, N. The LCA of Portland cement production in China. Int. J. Life Cycle Assess. 2015, 20, 117–127. [Google Scholar] [CrossRef]
  106. Huijbregts, M.A.; Steinmann, Z.J.; Elshout, P.M.; Stam, G.; Verones, F.; Vieira, M.; Zijp, M.; Hollander, A.; Van Zelm, R. ReCiPe2016: A harmonised life cycle impact assessment method at midpoint and endpoint level. Int. J. Life Cycle Assess. 2017, 22, 138–147. [Google Scholar] [CrossRef]
  107. Neuffer, B.; Laney, M. Alternative Control Techniques Document Update: NOX Emissions from New Cement Kilns; US Environmental Protection Agency, Office of Air Quality Planning and Standards: Washington, DC, USA, 2007.
  108. Ottermann, E.W. Energy management challenges and opportunities in the South African cement industry. In Proceedings of the 2011 Proceedings of the 8th Conference on the Industrial and Commercial Use of Energy, Cape Town, South Africa, 16–17 August 2011; pp. 34–39. [Google Scholar]
  109. Ohanyere, C.; Alexander, M. The South African Cement Industry: A Review of Its Energy Efficiency and Environmental Performance Since 1980; University of Cape Town: Cape Town, South Africa, 2012. [Google Scholar]
  110. WBCSD. Guidelines for co-processing fuels and raw materials in cement manufacturing. In Cement Sustainability Initiative (CSI); World Business Council for Sustainable Development Geneva: Geneva, Switzerland, 2014. [Google Scholar]
  111. Tun, T.Z.; Bonnet, S.; Gheewala, S.H. Emission reduction pathways for a sustainable cement industry in Myanmar. Sustain. Prod. Consum. 2021, 27, 449–461. [Google Scholar] [CrossRef]
  112. Chatziaras, N.; Psomopoulos, C.; Themelis, N. Use of alternative fuels in cement industry. In Proceedings of the 12th International Conference on Protection and Restoration of the Environment, Skiathos Island, Greece, 29 June–3 July 2014; Volume 1, pp. 521–529. [Google Scholar]
Figure 1. System boundaries of the LCA of Portland cement in South Africa.
Energies 15 02708 g001
Figure 2. Contribution of each production stage to atmospheric impacts.
Energies 15 02708 g002
Figure 3. Contribution of each production stage to resource depletion.
Energies 15 02708 g003
Figure 4. Contribution of each production stage to toxicity.
Energies 15 02708 g004
Table 1. List of input/output data of Portland production [89].
Amount
Cement Factory5.36 × 10−11 unit
Input
Clinker0.902 kg
Gypsum, mineral0.0475 kg
Limestone0.05 kg
Ethylene glycol0.00019 kg
Steel, low-alloyed5.25 × 10−5 kg
Electricity0.0376 kWh
Output
Emissions to air (Heat, waste)0.135 MJ
Products (Cement, Portland)1 kg
Table 2. The environmental impact indicators investigated (midpoint impacts categories).
Atmospheric
Environmental IndicatorAbbreviationUnit
Global warmingGWPkg CO2 eq
Ozone depletionODPkg CFC11 eq
Ozone formation, Terrestrial ecosystemEOFPkg NOx eq
Ozone formation, Human healthHOFPkg NOx eq
Particulate matter formationPMFPkg PM2.5 eq
Ionization radiationIRPkBq Co-60 eq
Resource Depletion
Terrestrial acidificationTAPkg SO2 eq
Freshwater eutrophicationFEPkg P eq
Marine eutrophicationMEPkg N eq
Mineral resource scarcitySOPkg Cu eq
Fossil resource scarcityFFPkg oil eq
Toxicity
Human carcinogenic toxicityHTPckg 1,4-DCB eq
Terrestrial ecotoxicityTETPkg 1,4-DCB eq
Freshwater ecotoxicityFETPkg 1,4-DCB eq
Marine ecotoxicityMETPkg 1,4-DCB eq
Human non-carcinogenic toxicityHTPnckg 1,4-DCB eq
Table 3. Processes studied in each production stage of Portland cement in South Africa.
Production UnitProcesses Considered
Raw materialsLimestone and steel. Clinker and ethylene glycol, including the inputs and outputs
Fossil fuelsDiesel, coal, light fuel oil and lubrication oil, including inputs and outputs.
ElectricityElectricity used in mills and other equipment, in agreement with South Africa production and distribution regulation
TransportationThe transportation of raw materials, fuels and energy resources from the extraction site up to the gate of the plant
Clinker productionParticulate matter, NOx, CO2, emitted by the kiln during clinker production
Publisher’s Note: MDPI stays neutral with regard to jurisdictional claims in published maps and institutional affiliations.

