Article

Full Core Pin-Level VVER-440 Simulation of a Rod Drop Experiment with the GPU-Based Monte Carlo Code GUARDYAN

1
Department of Nuclear Techniques, Institute of Nuclear Techniques, Budapest University of Technology and Economics, H-1111 Budapest, Hungary
2
Wigner Research Center for Physics, H-1121 Budapest, Hungary
3
MVM Paks NPP Ltd., H-7030 Paks, Hungary
*
Author to whom correspondence should be addressed.
Energies 2022, 15(8), 2712; https://doi.org/10.3390/en15082712
Submission received: 15 February 2022 / Revised: 25 March 2022 / Accepted: 31 March 2022 / Published: 7 April 2022
(This article belongs to the Special Issue Advanced Numerical Modelling Techniques for Nuclear Reactors)

Abstract

:
Targeting ultimate fidelity reactor physics calculations the Dynamic Monte Carlo (DMC) method simulates reactor transients without resorting to static or quasistatic approximations. Due to the capability to harness the computing power of Graphics Processing Units, the GUARDYAN (GpU Assisted Reactor DYnamic ANalysis) code has been recently upscaled to perform pin-by-pin simulations of power plant scale systems as demonstrated in this paper. A recent rod drop experiment at a VVER-440/213 (vodo-vodyanoi enyergeticheskiy reaktor) type power plant at Paks NPP, Hungary, was considered and signals of ex-core detectors placed at three different positions were simulated successfully by GUARDYAN taking realistic fuel loading, including burn-up data into account. Results were also compared to the time-dependent Paks NPP in-house nodal diffusion code VERETINA (VERONA: VVER Online Analysis and RETINA: Reactor Thermo-hydraulics Interactive). Analysis is given of the temporal and spatial variance distribution of GUARDYAN fuel pin node-wise power estimates. We can conclude that full core, pin-wise DMC power plant simulations using realistic isotope concentrations are feasible in reasonable computing times down to 1–2% error of ex-core detector signals using current GPU (Graphics Processing Unit) High Performance Computing architectures, thereby demonstrating a technological breakthrough.

1. Introduction

GUARDYAN (GpU Assisted Reactor DYnamic ANalysis) [1] is a dynamic Monte Carlo reactor dynamics code having been developed at the Budapest University of Technology and Economics (BME), Hungary. The Monte Carlo (MC) approach to the direct simulation of time dependent phenomena in nuclear reactors called Dynamic Monte Carlo (DMC) evolved from the original tests [2] through the realisations with a production Monte Carlo code [3] TRIPOLI-4 [4] until recent years with kinetic extension [5] of Serpent [6] and the G4-STORK [7] of Geant4 [8] and the kinetic extension [9] of OpenMC [10], or quite recently MC3-TD [11] to name a few. At the beginning of the DMC method development application to more, real systems with comparison to measured data was envisioned to happen at the end of the first half of our decade. This forecast on computer resource demands was based on taking running times for either simpler benchmark geometries or small scale real systems, and this quantity was then multiplied linearly with the nominal power difference. Comparisons to measurements for small or heavily subcritical reactors has been published using GUARDYAN [1] and very recently dynamic Serpent [12] for a somewhat larger scale 65 MW assembly [13]. Report on upscaling to NPP size for a benchmark scenario with Serpent-2 can be found in Reference [14]. Experiences gathered when simulating a fast absorber insertion and subsequent withdrawal experiment at the BME Training Reactor using GUARDYAN [1] led us to believe that computer resource demand is not directly proportional to reactor power as for small reactor cores high leakage heavily increases the sample variance. For realistic, NPP-sized systems samples mostly stay inside the core and necessity to replace lost samples by splitting of a low number of remainders is, therefore, also low. This eases to keep the population diverse, in more mathematical terms to keep intersample covariances low.
In this paper we describe our attempt to simulate a Hot Zero Power (HZP) rod drop experiment of unit 4 at Paks NPP of type VVER-440. A recent safety rod drop experiment routinely performed at campaign starts was selected and three ex-core detector signals were simulated as a function of time. With excellent match to measured data results are also well within the margin that was provided by the simulation results of Paks NPP in-house code VERETINA. Detailed burn-up data was used to ensure that running times correspond to realistic model. Our results are conclusive on GUARDYAN being able to maintain a stable neutron population on the seconds’ time scale without collapsing, i.e., without steeply increasing statistical fluctuations in time. The detector sensitivities limited to peripheral subsections of the core were expected to cause spatial undersampling resulting in high variance, but in practice detector relative errors stayed below 5%.
Section 2 recaptures the main features of GUARDYAN, and introduces the code VERETINA. Also, Section 2 describes the VVER core model at the time of the experiment. Section 3 presents the ex-core detector results and comparisons, with detailed analysis of the spatial and temporal distribution of the statistical variance and the required computer resources. Section 4 offers some concluding remarks.

2. Materials and Methods

2.1. Current State of the GUARDYAN Development

GUARDYAN is a 3D continuous energy MC code capable of simulating direct time dependence in multiplying systems using GPUs. Capabilities of GPUs have grown exponentially in the last years, a single commercially available GPU possesses performance of 5 × 10 13 floating point operations per second. In scientific computations the application of GPUs proved to be successful many times in the past, for a recent example from the MC neutron transport field see e.g., Ref. [15]. Due to the contrast between GPU and CPU hardware however, it would be prohibitively expensive and unreasonable to rewrite existing MC codes for GPUs, as the entire code would have to be restructured. As a novel MC code, GUARDYAN was developed with the purpose of efficient utilization of the GPU in mind, that resulted not only in structural differences compared to conventional MC codes, but various unique approaches and algorithms as well. Major features are shown in [1], a short summary is given here.
The model geometry is given by cells of homogeneous material composition, bounded by a set of currently up to fourth order surfaces connected by boolean operators, also known as Constructive Solid Geometry. Densities and temperatures may be given per cell or by a superimposed mesh. Cross sections can be provided in ACE format. Time dependent input is given in separate input files for each time step, or by change in density and/or temperature. GUARDYAN applies Woodcock (delta-) tracking, thus time dependent changes can be taken into account on a continuous scale if needed. We consider reactions with the following MT numbers: 2, 5, 11, 16, 17, 18, 19, 20, 21, 22, 23, 24, 25, 28, 29, 30, 32, 33, 34, 35, 36, 37, 38, 41, 44, 45, 51–90, 101. After choosing the reaction, the determination of the new energy and angle of the neutron depends on the given ACE law (ACE Laws 3, 4, 7, 9, 11, 44, 61 or 66). Verification of the transport physics included code-to-code comparison of criticality and fixed-source calculations [1] for every isotope separately comparing about half a million data points and many integral benchmark cases of the ICSBEP [16] set. Validation of GUARDYAN used measurement data of kinetic transients of the Training Reactor of BME.
GUARDYAN splits the simulation into time intervals. Two time grids are considered: one, that is required to take feedback mechanisms into account, during these steps the model parameters like geometry, density and material composition do not change. The other is the population control time grid used for variance reduction, here restrictions on model changes are not imposed. Population control is found to function better if occurring more frequently than feedback, a typical resolution of the population control time grid is 10 5 s in thermal systems, less for fast reactors.
DMC suffers from unstable statistical properties as neutron population size decreases in time due to neutron escape. As a result, maintaining the neutron population is a martingale game with a high probability of extinction within practical simulation timeframes. Population control is achieved by tailoring the neutron population at the beginning of a time interval using adjoint weighted combing techniques. A combing technique is an algorithm that creates a preset number of samples out of a sample population of arbitrary size without introducing statistical bias. Tactics of population combing vary, some techniques developed at BME NTI [17] rely on optimizing combing parameters with respect to transport simulation variance on top of the conventionally used importance function.
When implementing a MC neutron transport code special attention must be paid to choosing the right kernels, as the slowest working thread will determine the efficiency of parallelization. All other threads in a warp must wait for the thread finishing last. Loops, conditional and branching statements lead to thread divergence, an uneven distribution of work-load. This issue is targeted by the vectorization of the code, i.e., the event-based Monte Carlo simulation. In event-based GUARDYAN this is implemented by distinguishing kernel functions for different types of events instead of just one “big” kernel (as in the history-based GUARDYAN). When calling these kernels, threads of a warp executing the same operations on particles (the same event is simulated) do not branch, whereas in a history-based simulation threads may easily diverge as one particle may be in a transition step while the other scatters or induces fission. Branching statements in a warp are executed serially in CUDA: an if-else statement is executed for all warps in two cycles (both branch is executed one after the other). When the “if” branch is executed, the threads that do not satisfy the condition (would diverge to the “else” branch) are flagged and perform a NOP (no operation). This results in the degradation of parallel performance. However, it does not necessarily mean that the vectorized version of the code will execute faster. One reason was given in the previous section, regarding memory management issues. To prevent branching during time intervals, GUARDYAN uses the improved branchless method [3]. Neutron sample size is maintained such that at each population control time step the population is tailored to contain again the initial sample size via splitting. Only statistical splitting creates new trajectories, physical branching, like fission, is accounted for by weight change.
In fissile material interaction sampling is biased towards favouring fission, resulting in a transport where collision and fission induce the same amount of weight change, but fission occurs more frequently.
The time shift of delayed neutrons has a significant impact on the time evolution of a neutron population. While static MC calculations neglect this delay, dynamic simulations must handle both prompt and delayed neutrons. This is non-trivial due to the several orders of magnitude difference between prompt and delayed neutron lifetimes. GUARDYAN applies delayed neutron precursor sampling and forced decay of precursors. The delayed neutron sampling algorithm is outlined in Figure 1.
Throughout this paper, the sample number N will be given in a sense that N is the maximum of the number of samples used by the full workflow, or in other words, the allocated total storage size on the GPU taken up for the samples. As detailed in Figure 1, half of N is used for the prompt neutron samples (n), a quarter for precursors (C) and a quarter is left for buffer. At step 1. every precursor sample is split into two: a forced decay part (d) for the current time interval and a forced survival to the subsequent intervals, with weights proportional to the probability of occurrence. The decayed d number of precursors are then undergo combing to the average weight of n to even out the workload per sample. The transport of particles follows resulting in new precursors ( C n e w ), prompt neutrons surviving the time step without fission (n), and new prompt neutrons originating from fission events ( n ). Next, another combing step merges n and n together, and similarly C and C n e w together to arrive back to step one.
A converged initial state is needed for a time–dependent simulation: both the neutron and the precursor distributions must be obtained before launching a time-dependent calculation. In GUARDYAN, initial conditions are obtained assuming the transient starts from steady-state, thus both neutron and precursor source can be calculated in a simulation with each neutron decaying promptly. Thus, initial convergence iteration happens in time dependent mode rather than by fission source iteration. After the flux distribution has converged precursors are generated at time interval boundaries. If a sample is located in fissile material a precursor is generated with probability
P i = f k β i ν d , i σ f , k k = 0 N f k Σ f , k i = 0 6 β i ν d , i
where k is the isotope type being present in atomic fraction f k , β i is the delayed neutron fraction for delayed group i, ν d , i is the expected number of delayed neutrons emerging, σ f , k is the fission cross section. The weight of the precursor becomes
w = v k = 0 N f k σ f , k i = 0 6 β i ν d , i λ i
where v is the velocity of the neutron inducing the fission event, λ i is the decay constant.

2.2. The Time-Dependent Nodal Diffusion Code VERETINA

The basis of the time dependent neutron physics in VERETINA code [18] is the well known IQS method [19], where the time and space dependence of neutron flux are separated from each other. The advantage of this approach is that the time consuming calculation of the spatial flux distribution needs to be done rare while the amplitude function given by the set of point kinetics equations can be solved very frequently. Further advantage of IQS method is that the equation for calculation of spatial flux is almost the same as it is used in static eigenvalue problem, so all numerical approximations applied in a static eigenvalue model are applicable. In the VERETINA code the hybrid finite element method [19] combined with discontinuous flux at node boundaries [20] is applied similarly to C-PORCA code. During the calculation of the spatial resolution two group diffusion model was applied taking into account 349 × 48 homogenized nodes. All effects caused by changes of fuel and moderator temperature and density are taken into account by nodewise two group cross section data recalculated in each feedback cycle. The time dependency of the amplitude function governed by dynamic reactivity is determined by Runge-Kutta method [21]. The basic equations of the time dependent diffusion model without temperature feedback have been presented in Reference [22]. To follow real operational transients at VVER 440 units we needed to consider the calculation of delayed power in each node as well. In VERETINA code one of the most detailed method of delayed heat generation, described by NUREG/CR-6999 ORNL/TM-2007/231, was implemented. During the development of neutron physics we also keep in mind that the accuracy of the model can be mainly characterise by measured data. In power reactors the most reliable tools to measure the flux are ex-core detectors located around the core. From this consideration the VERETINA has a method to predict the signals of ex-core detectors [23].

2.3. VVER-440/213 Transient Modelling Details

Power Plant measurements were conducted in 2019 at Paks NPP, unit 4. This unit contains approximately 42 tons of lightly enriched uranium-dioxide, with a mainly three-, partially four year cycle before disposal. A power uprating at 2009 raised the power of this block to 500 MWe from the nominal 440 MWe, in this process several design elements were changed including the replacement of pins in some assemblies with burnable Gd poison. Both GUARDYAN and VERETINA computer models incorporated these changes, using the current state of the core. Burnup calculations were performed by the code system VERONA [24] beforehand independent of the research detailed in this paper and material composition data were provided for fuel cycle 32.

GUARDYAN Geometry Model

312 (see Figure 2) out of the total 349 hexagonal assemblies in the core are fuel assemblies, 37 assemblies are safety assemblies, out of which 7 is used for control in normal operation. For shortening terms we will refer to the former ones as safety, the latter ones as control assemblies. The borated steel control and safety rods are connected to fuel assemblies called followers. The 37 control assemblies (rods) are divided into 6 groups. All the 6 groups consist of 6 rods in 60 degree symmetry excluding the 6-th one which has an extra member in the centre of the core.
Each fuel assembly contains 126 fuel pins. Some assemblies contain Gd for burnable poison. Figure 3a,b shows the pin map of a Gd47-type assembly with 6 Gd containing pins, one of the new type of assemblies used after the power uprating. A similarly new type, Gd2n with 3 Gd pins are shown in Figure 3c,d.
Simplifications were made with the Zirconium placeholders, here a mixture of water, Zr, Hf and Nb was considered along the length of the water channels between the fuel pins.

2.4. Experiment and Measurement Details

The measurement performed is part of the safety routine check before start-up. At HZP and stable power every control and safety rods are dropped except for the safety rod with the highest reactivity worth. Model geometry as shown in Figure 4, Figure 4a shows the ends of the attached followers of the 7 control assemblies protruding from the core downwards, and the 30 safety assemblies visible on top of the core. Figure 4b shows the state of the geometry at the end of the transient with every safety and control assembly (except for one) inserted fully in the core, with their respective follower assemblies protruding from the bottom of the core. The single safety assembly envisioned to get stuck and remain in an uphold position (with its follower assembly still in the core) is also visible on top of the core.
Although for each assembly positions are measured separately, the simulations used average dropping speed of 21 cm s after about 0.5 s acceleration period. Assembly position time evolution is shown in Figure 5.
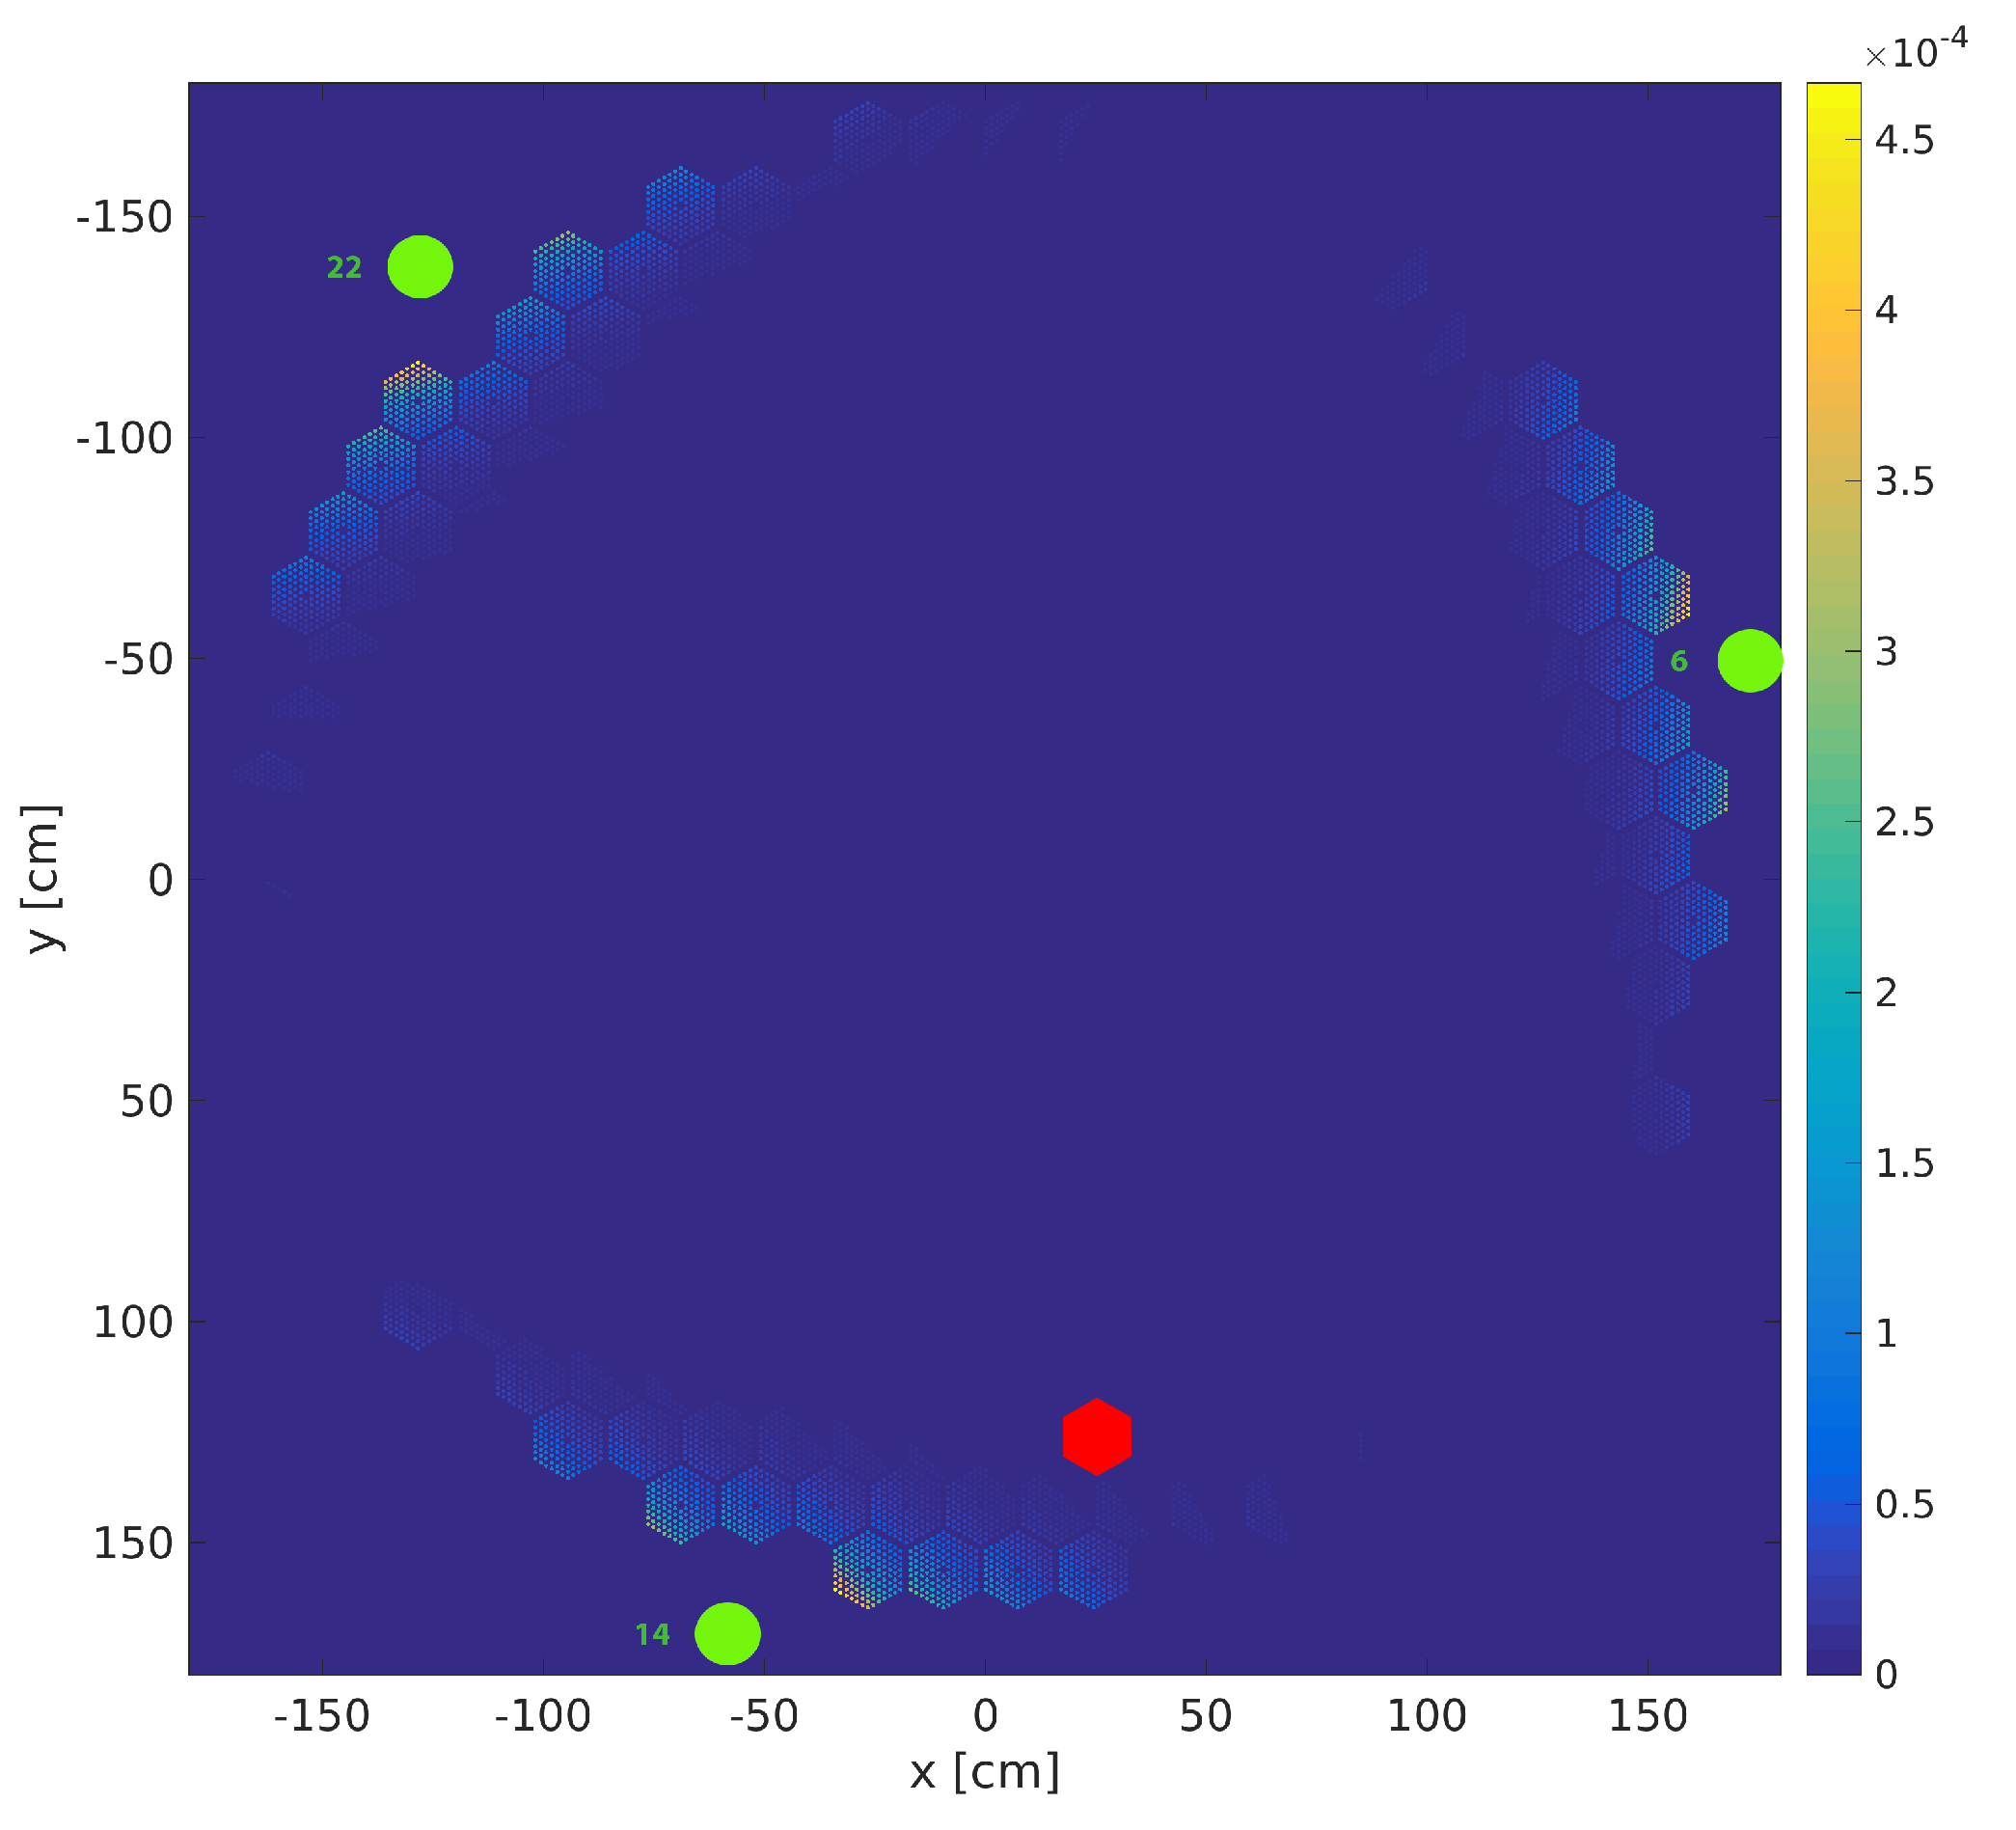
Different type of ionisation chambers are placed around the core in 24 ex-core positions, vertically at the maximum of nominal neutron flux distribution, somewhat lower than the middle elevation. Measured data was available from CFUL08 type fission chambers numbered 6, 14 and 22, their horizontal positions are indicated in Figure 6. Detector signals were simulated using weight functions pre-calculated independently by Monte Carlo [25] and was provided as an input for our research. Weight functions were calculated for 21 axial nodes, sensitivity values are plotted in Figure 6 merged for the three detectors. Weight functions are interpreted as the detector reading per node and per single fission event sampled with Watt-spectrum. Only the pins closest to the detectors give sizeable contributions to the detector readings, and further, those are located at the edge of the core, with rapidly decreasing values with distance from the ionization chambers. Highest values are about 5 × 10 4 , with an order of magnitude lower values on the other side of the respective assembly. Thus very low statistical variances are needed at the core edges if we wish to achieve reasonable detector reading estimates. Weight function changes are neglected due to geometry changes, and further the time required for the progenies of a fission event to reach a detector is considered to be instant.

3. Results

3.1. Initial State Calculations

A static GUARDYAN simulation was done using N = 1,048,576 neutrons, with 200 inactive and 800 active cycle with core temperature T = 211.2 °C, control rod position 189.9 cm, pressure 123.01 bar and measured boric acid concentration of 11.17 g kg . At nominal power temperature would be T = 263.8 °C at the pressure of 123.01 bar With these settings we obtained k e f f = 0.99834 with relative errors of r = 0.00003. Though the difference of 166 pcm from criticality appears to be small and within the margin of error for the Boron concentration measurement, a DMC calculation would require more precise settings to hold the power stable in time. We have determined a critical boric acid concentration of 11.02 g kg for GUARDYAN and for comparison 11.10 g kg for VERETINA.
With critical Boron concentration determined, the delayed neutron precursors were generated in a time dependent calculation. Visualisations of the node-wise power release in a 0.1 s interval generated by the time-dependent calculation for the critical scenario can be seen in Figure 7. Only a quarter of the zone in the upper half of the core is shown.
Power release data per node is saved throughout the whole calculation. Examples for the power release distributions at 5 s and 9 s are shown in Figure 8. (a) shows hollow areas only where the control assemblies are already inserted halfway into the core, (b) shows power release gaps also along the safety rod positions too, being all of the rods inserted at the end of the transient.

3.2. Comparison of Ex-Core Detector Signals

Ex-core detector signals were simulated with sample number N = 1,048,576 starting from the steady-state initial state, with population combing at every 10 5 s. The whole calculation from precursor generation to the end of the transient was repeated 8 times with independent starting random numbers to estimate the statistical varianceFigures (relative variances, running times) are given as if only a single run produced them. Measured data is available in varying time intervals ranging from 0.05 s (up to approx. 10 s) to 0.2 s in later times. GUARDYAN results are shown for every 0.05 s, VERETINA data is plotted at every 0.2 s. Measured signal amplitudes vary for each detector due to hardware differences, therefore amplitudes are normalized to the starting signal amplitude for measurement, VERETINA and GUARDYAN alike. The timing of the rod drop is not registered, thus also a time shift is applied, freely chosen to achieve best fit, while the same time offset is used for each of the three detectors. Large measurement errors would prohibit to show results as a difference to detector readings, results are given thus in linear and logarithmic scale, (see Figure 9 and Figure 10. GUARDYAN results are given with error bars.
Results match very well, GUARDYAN simulations follow the detector readings within ( 1 σ ) error bound of the MC simulation, while VERETINA results tend to overestimate at the first half of the transient with deviations being small but systematic. On logarithmic scale it is apparent that at the end of the transient VERETINA predicts values correctly, fulfilling a design requirement of this code to allow for correct inverse kinetics solutions.
To further analyse differences, we have compared the time evolution of relative detector signals by normalising at every time point with simulated or measured signal averages respectively of the three detectors. For detector 14 a positive deviation in time is expected, being this detector closest to the stuck assembly. A 10-point moving average had to be applied to the measured data because of large statistical fluctuations. Result are shown in Figure 11.
The asymmetry in detector readings due to the distance from the stuck assembly is correctly predicted by both codes. Positive deviations can be observed for detector 14 of about 25%, negative deviations for the other two, in the range of 15%. Both time evolution and amplitude are similarly accurate for GUARDYAN and VERETINA.

3.3. Variances

Relative error figures for the ex-core detectors are a few percent (see Figure 12). A prerequisite of this is a calculation that provides very small variances per pin nodes also at the edges of the reactor. This task is very challenging in whole-core simulations; being able to hold variances so low exceeded our expectations. For DMC a connection exists between the variance of a detector reading and the variance of the whole neutron population in preceding times [17]: the variance accumulated by the population cannot be undone at a later time point. Thus, small variance of the detector reading can only be a consequence of a very accurate calculation beforehand. The first 5 s of the transient brings a magnitude drop in power, during this time the ex-core detector relative errors are under 2%. The reactivity at this point falls below about −10 $ and relative error starts increasing in this heavily subcritical state. Intuition may suggest that the heavy drop in power in the first 5 seconds of the simulation would already result in lower number of fissions per time interval, and, consequently in a steep relative variance increase. Figures show, that rather, a slow increase of the variance occurs. We speculate that the variance associated with maintaining the fission chains, the “prompt population variance” [17] is responsible for the larger part of the variance, which is around 1.5%. This error term would also show itself if the total power release of the whole core would be estimated even though the total number of contributions to the full core power and the contribution to the node power release differs in orders of magnitudes. Along this hypothesis, the variance term associated with hitting or missing a certain node by a fission event would be much smaller, not dominant. After the 5 s mark with heavy subcriticality, the population cannot maintain itself, at this point precursor generation should start providing the contribution to fission energy release and also to maintaining the precursor source population. When the system becomes dominated by precursor initiated short living chains with only a few fission events, the variance starts following the expected behaviour of a steep increase with decreasing number of samples successfully contributing to the tally.
Being the ultimate goal to provide accurate node-wise power estimates for thermal-hydraulic calculations, analysis of spatial distribution of power estimates is paramount. Pins were divided into 41 axial nodes, variances of the power release in each was estimated for 0.1 s long time intervals. The general trend is that variances are lower in the middle of the core and tend to increase outward. With time the variances tend to increase.
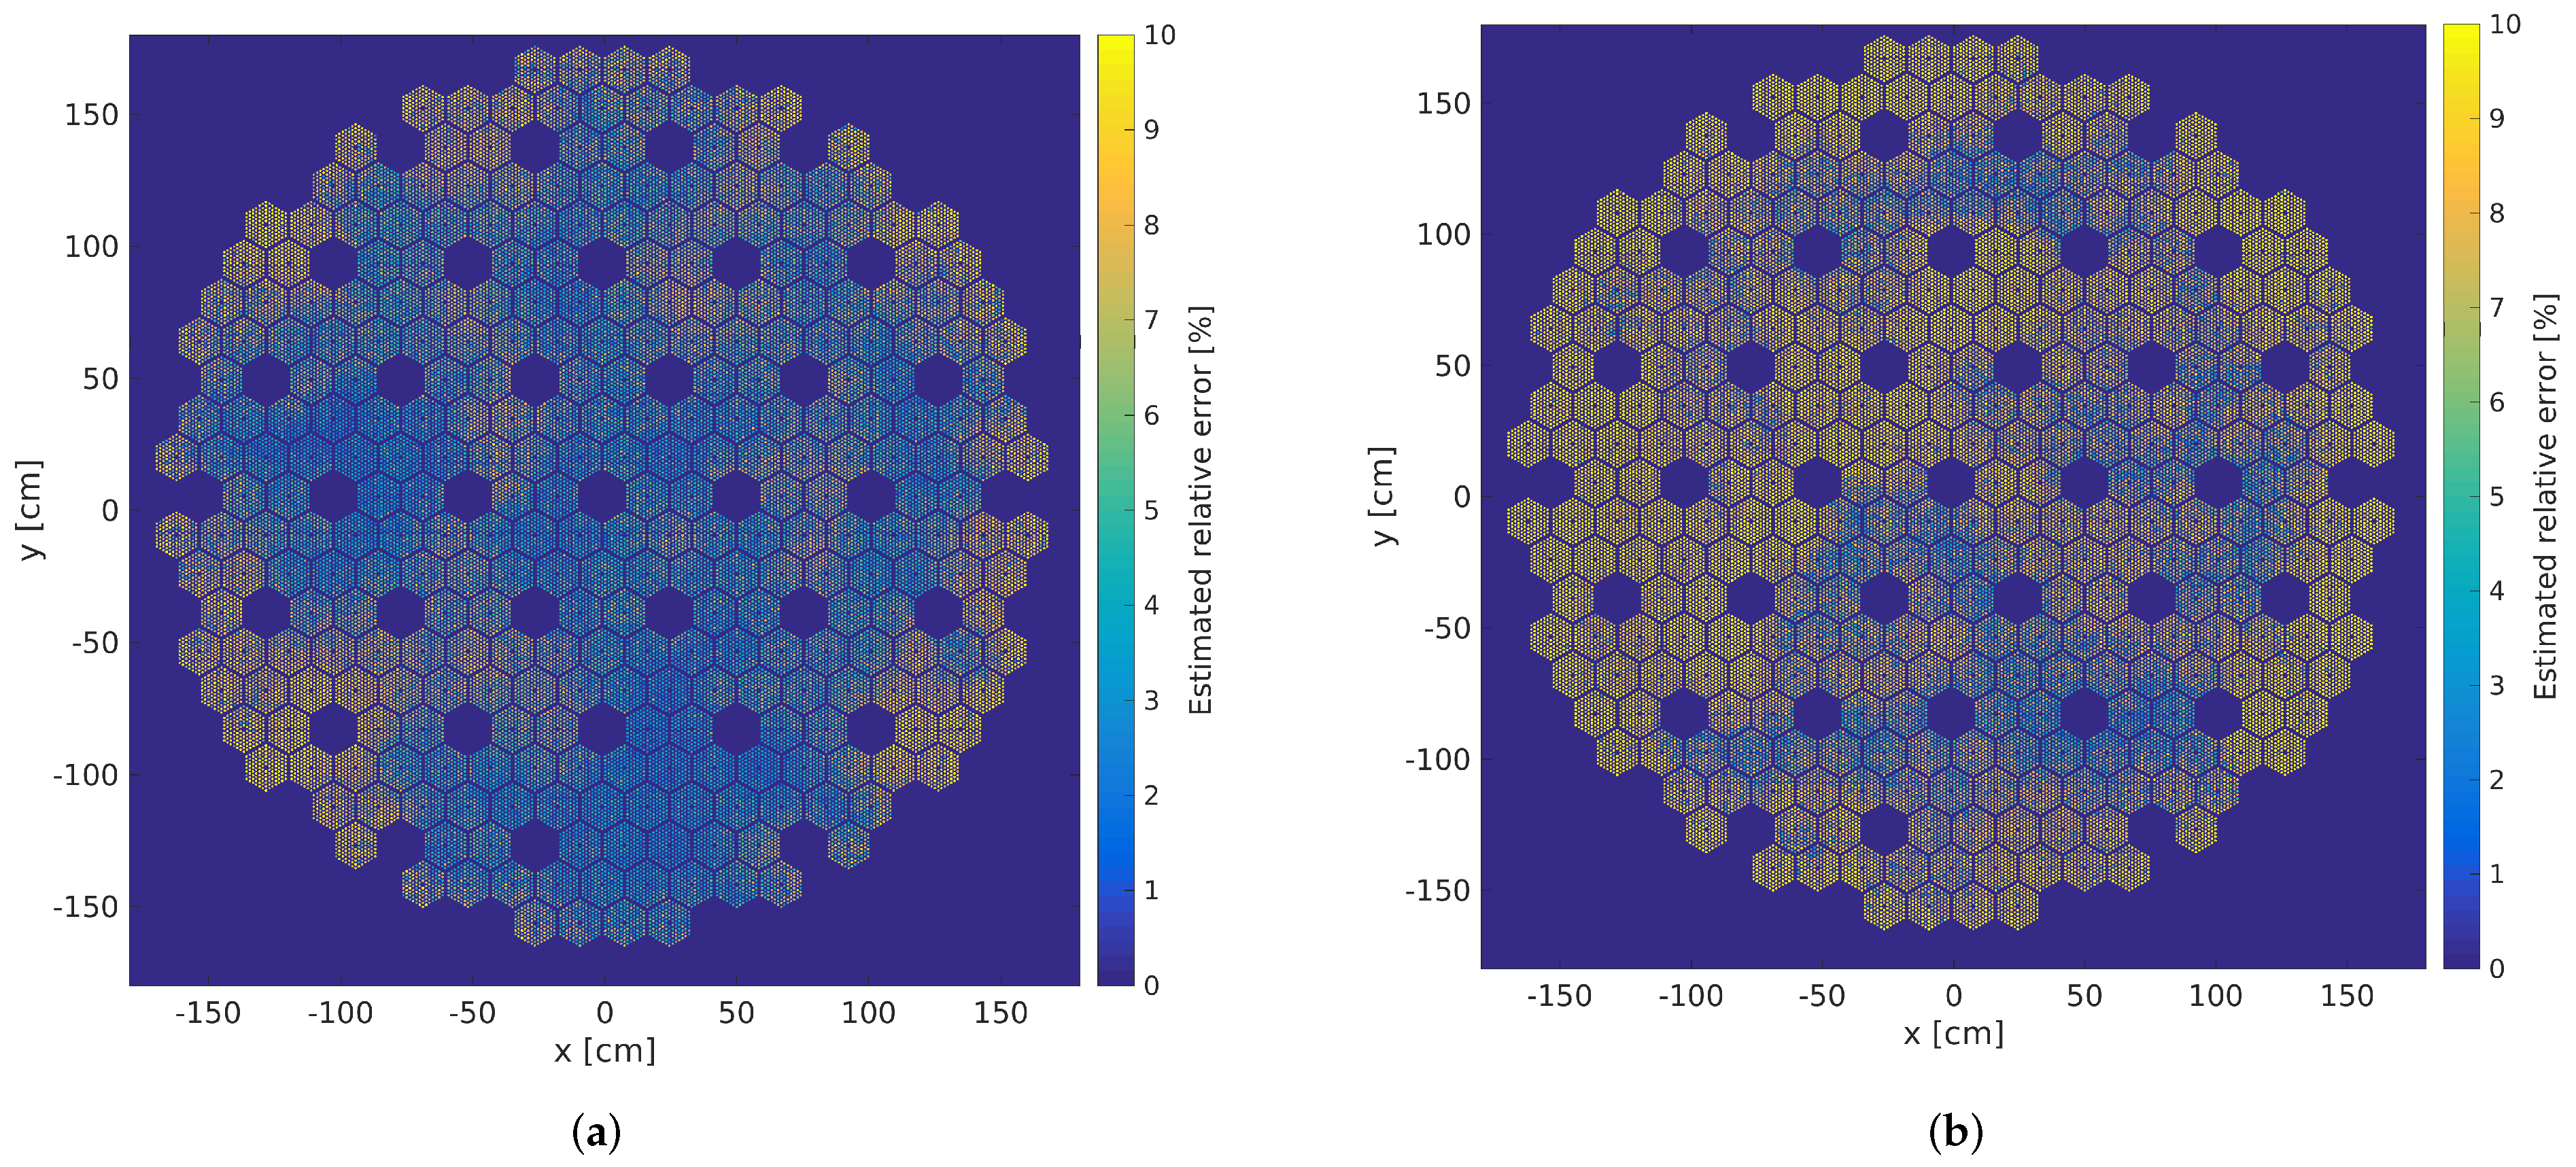
At the beginning relative errors are in the range of a few percent, generally being lower than 10% even at outer and topmost nodes averaging to 4.52% for all nodes, detailed results are visualised in Figure 13. Similarly to the ex-core detector signal time evolution, variances increase with time, at the end of the simulation (13.8 s) relative errors reach the average of 8.16%, the corresponding spatial distributions are shown in Figure 14.
Relative error values indicate converged Monte Carlo solutions and their magnitudes are properly low for thermal-hydraulic coupling. Figure 15 shows the histogram of relative error for every node at the beginning and at the end of the transient. Appearance of some nodes with relative errors higher than 10% at the end of the transient indicate that more samples or more effective variance reduction is amiss, in case such a very subcritical reactor state is relevant.
Another apparent feature of the heavily subcritical end-state variance is that localized spatial structures appear. This pattern seems to be independent of the material geometry. Often, it is a result of clustering, when Monte Carlo samples correlate in their spatial coordinates, Usually this as a result of applying some variance reduction technique. Most prominently we have experienced localized anomalies of variance as a result of suboptimal precursor sampling as illustrated by Figure 16a.
Concentrated in spherical regions, excess variance originated from a precursor sample in their centre with large weight, replicated by the combing process into identical samples tens of thousands in number. Figure 16a was generated setting precursor group probabilities P i of Equation (1) uniformly for emphasising the spatial effect of this phenomenon, causing the weight factor of Equation (2) to fluctuate. To obtain the smooth variance distribution shown in Figure 16b, apart from sampling proportionally to P i further variance reduction was necessary. The precursor generation step was modified to apply combing with a weighting factor of 1 λ i and further by applying a Russian Roulette with survival probability v v m a x , requiring to continue the precursor generation longer until the bank is full. The resulting precursor weights will be then:
w = v m a x k = 0 N f k σ f , k i = 0 6 β i ν d , i

3.4. Computing Resource Needs

The simulations were executed on three different types of NVIDIA Graphics Processing Units:
  • a professional grade NVIDIA A100 Tensor Core GPU (A100 for short) with product launch of May 2020, it is designed for scientific use;
  • an NVIDIA GeForce RTX 3090 (RTX 3090 for short), launched in September 2020, regarded as consumer electronics;
  • an earlier NVIDIA GeForce GTX 1080 (GTX 1080 for short), launched in May 2016, also considered to serve lower performance computing tasks.
Simulation times for 1 real second are given in Table 1 in GPU computing hours. Taking into account realistic burnup values a single A100 card needs about a day to complete one real time second. Performance surplus over the GTX 3090 card originates from the higher number of GPU cores and the greater L2 Cache size. GUARDYAN performance is vastly hindered by the available amount of cache often resulting in a shortage causing stalling cores while other threads use all the available registers. The larger L2 Cache size of the A100 offered the larger part of the performance difference. A lack of expected acceleration is experienced when looking at the double precision performance ratio, where a factor 20 in double precision arithmetic speed fails to result in any speed-up. The authors hope that significant part of this double precision computing resource can be exploited in the future with an improved algorithm structure. The obsolete GTX 1080 card huge running time values for a core with burnup originates from the memory limitations, as for the vast amount of isotope mixtures it is useful to interpolate the cross section energy grid to union of energy grids for every isotope in the system, for that purpose 8 GB is insufficient. For fresh fuel however a set of GTX 1080 cards may still be usefully applied for full core NPP calculations.

4. Conlcusions and Discussion

We have demonstrated here that the Dynamic Monte Carlo method with the help of GPU architectures is capable of simulating Nuclear Power Plant-scale reactor kinetics for a core with realistic burnup. Stochastic errors were low enough to allow for the estimation of ex-core detector signals. Node-wise variance figures for critical states averaged to 5% that seems sufficiently small to attempt pin-wise thermal-hydraulic coupling. Running times on commercially available architectures remained reasonable, staying below 1 day of computing time for 1 real second. Measured data reproduction was successfully carried out with GUARDYAN for a smaller Nuclear Reactor with 200 kW nominal thermal power earlier. Upscaling to simulate a 500 MWth NPP was shown to be adequately performed using the same number (1 million) of samples. To demonstrate that fully realistic simulations are practically feasible with GUARDYAN the core model considered realistic burnup values corresponding to the beginning of campaign 32 of unit 4 of Paks NPP. An asymmetric rod drop experiment was performed and ex-core detector signals were registered. Node-wise weight functions were used for the estimation of detector readings. Acceptable variance of the ex-core detector signals can only be achieved if the fission rate estimates at the very edges of the core are statistically sound. Though this challenge is hard to meet, detector response relative errors stayed below 2% for the first 5 s of the simulation. Comparison to measured data provided excellent fit, not only for GUARDYAN but also for VERETINA results. The fact, that both VERETINA and GUARDYAN each applying entirely different calculation schemes can reproduce the measured signals correctly, offered both verification and validation of these codes. Analysis of space- and time dependence of relative errors showed that for near-critical states, estimation of the power release for a fortieth of a pin within one tenth of a second can be achieved with sub-10% relative errors with the average of 5%. Such low figures are expected to allow for pin-wise thermal-hydraulic coupling. We have found that special care has to be taken of the precursor sampling as reactivity decreases and delayed neutrons become more prominent. With haphazardly sampled precursor population low reactivity states will exhibit strongly uneven variance distributions. Current commercial availability of cluster nodes with A100 cards (usually containing 4–8 cards) renders the GUARDYAN transient calculations within reach of easily accessible, small scale HPC architectures. Even so, if the analysis targets fresh core loadings, when calculation times are a factor 4 faster, a hard transient simulation (e.g., a Rod Ejection Accident) fits into a single day using a single A100 card. This paper presented here the validation of a fully realistic, fully detailed Dynamic Monte Carlo simulation when simplifications play little role neither when modelling error neither when model data is considered. Natural next step is the validation of a coupled simulation with thermal hydraulic solvers keeping the level of detail as close as possible to a real NPP state.

Author Contributions

Conceptualization, D.L. and G.T.; methodology, D.L., G.T. and T.H.; software, G.T. and T.P.; validation, E.P., G.T., I.P. and T.H. All authors have read and agreed to the published version of the manuscript.

Funding

The research reported in this paper was supported by the BME Artificial Intelligence TKP2020 IE grant of NKFIH Hungary (BME IE-MI-SC TKP2020).

Institutional Review Board Statement

Not applicable.

Informed Consent Statement

Not applicable.

Acknowledgments

Authors acknowledge the support and the computational resources of the Wigner Scientific Computational Laboratory (WSCLAB) (the former Wigner GPU Laboratory).

Conflicts of Interest

The authors declare no conflict of interest.

References

  1. Molnar, B.; Tolnai, G.; Legrady, D. A GPU based direct Monte Carlo simulation of time dependence in nuclear reactors. Ann. Nucl. Energy 2019, 132, 46–63. [Google Scholar] [CrossRef]
  2. Legrady, D.; Hoogenboom, J.E. Scouting the feasibility of Monte Carlo reactor dynamics simulations. In Proceedings of the International Conference on the Physics of Reactors 2008 (PHYSOR08), Interlaken, Switzerland, 14–19 September 2008. [Google Scholar]
  3. Sjenitzer, B.L.; Hoogenboom, J.E. Dynamic Monte Carlo method for nuclear reactor kinetics calculations. Nucl. Sci. Eng. 2013, 175, 94–107. [Google Scholar] [CrossRef]
  4. Brun, E.; Damian, F.; Diop, C.M.; Dumonteil, E.; Hugot, F.X.; Jouanne, C.; Lee, Y.K.; Malvagi, F.; Mazzolo, A.; Petit, O.; et al. TRIPOLI-4A, CEA, EDF and AREVA reference Monte Carlo code. Ann. Nucl. Energy 2015, 82, 151–160. [Google Scholar] [CrossRef]
  5. Leppanen, J. Development of a dynamic simulation mode in Serpent 2 Monte Carlo code. In Proceedings of the International Conference on Mathematics and Computational Methods Applied to Nuclear Science and Engineering (M&C 2013), Sun Valley, ID, USA, 5–9 May 2013. [Google Scholar]
  6. Leppanen, J.; Pusa, M.; Viitanen, T.; Valtavirta, V.; Kaltiaisenaho, T. The Serpent Monte Carlo code: Status, development and applications in 2013. Ann. Nucl. Energy 2015, 82, 142–150. [Google Scholar]
  7. Russell, L.; Buijs, A.; Jonkmans, G. 4-STORK: A Monte Carlo Reactor Kinetics Simulation Code. Nucl. Sci. Eng. 2014, 176, 370–375. [Google Scholar] [CrossRef]
  8. Agostinelli, S.; Allison, J.; Amako, K.; Apostolakis, J.; Araujo, H.; Arce, P.; Asai, M.; Axen, D.; Banerjee, S.; Barrand, G.; et al. Geant4 simulation toolkit. Nucl. Instrum. Methods Phys. Res. Sect. A Accel. Spectrometers Detect. Assoc. Equip. 2003, 506, 250–303. [Google Scholar] [CrossRef] [Green Version]
  9. Mylonakis, A.G.; Varvayanni, M.; Grigoriadis, D.G.E.; Catsaros, N. Developing and investigating a pure Monte-Carlo module for transient neutron transport analysis. Ann. Nucl. Energy 2017, 104, 103–112. [Google Scholar] [CrossRef]
  10. Romano, P.K.; Horelik, N.E.; Herman, B.R.; Nelson, A.G.; Forget, B.; Smith, K. OpenMC: A state-of-the-art Monte Carlo code for research and development. Ann. Nucl. Energy 2015, 82, 90–97. [Google Scholar] [CrossRef] [Green Version]
  11. Ajami, M.; Kamkar, A.; Zangian, M.; Minuchehr, A.; Zolfaghari, A. A pure dynamic Monte Carlo code for the neutronic analysis of nuclear reactors. Ann. Nucl. Energy 2022, 165, 108627. [Google Scholar] [CrossRef]
  12. Talamo, A.; Cao, Y.; Gohar, Y.; Valtavirta, V.; Leppänen, J.; Sikorin, S.; Mandzik, S.; Polazau, S.; Hryharovich, T. Serpent transient analyses of GIACINT geometrical change experiments. Ann. Nucl. Energy 2021, 164, 108601. [Google Scholar] [CrossRef]
  13. Fridman, E.; Huo, X. Dynamic simulation of the CEFR control rod drop experiments with the Monte Carlo code Serpent. Ann. Nucl. Energy 2020, 148, 107707. [Google Scholar] [CrossRef]
  14. Ferraro, D.; Valtavirta, V.; García, M.; Imke, U.; Tuominen, R.; Leppänen, J.; Sanchez-Espinoza, V. OECD/NRC PWR MOX/UO2 core transient benchmark pin-by-pin solutions using Serpent/SUBCHANFLOW. Ann. Nucl. Energy 2020, 147, 107745. [Google Scholar] [CrossRef]
  15. Choi, N.; Kim, K.M.; Joo, H.G. Optimization of neutron tracking algorithms for GPU-based continuous energy Monte Carlo calculation. Ann. Nucl. Energy 2021, 162, 108508. [Google Scholar] [CrossRef]
  16. Bess, J.D.; Ivanova, T. International Handbook of Evaluated Criticality Safety Benchmark Experiments; No. NEA-1486/16; NEA Nuclear Science Committee: Washington, DC, USA, 2018. [Google Scholar]
  17. Legrady, D.; Halasz, M.; Kophazi, J.; Molnar, B.; Tolnai, G. Population-based variance reduction for dynamic Monte Carlo. Ann. Nucl. Energy 2020, 149, 107752. [Google Scholar] [CrossRef]
  18. Pós, I.; Kálya, Z.; Házi, G.; Páles, J.; Horváth, C.; Végh, J. Validation of VERETINA, a new nuclear reactor analyzer system for VVER-440. In Proceedings of the 22th Symposium of AER, Pruhonice, Czech Republic, 1–5 October 2012. [Google Scholar]
  19. Henry, A.F. The Application of reactor Kinetics to the Analysis of Experiments. Nucl. Sci. Eng. 1958, 3, 52–70. [Google Scholar] [CrossRef]
  20. Pós, I.; Kálya, Z.; Parkó, T.; Horváth, M.; Szabó, S.P. C-PORCA 7: A nodal diffusion reactor calculation code to support off-line and on-line core analysis at Paks nuclear power plant. Kerntechnik 2019, 84, 228–241. [Google Scholar] [CrossRef]
  21. Ralston, A.; Wilf, H.S. Mathematical Methods For Digital Computers; Wiley: New York, NY, USA; London, UK, 1960; pp. 110–120. [Google Scholar]
  22. Pós, I.; Parkó, T. New practice for the evaluation of rod efficiency measurement by rod drop at the NPP Paks. Kerntechnik 2012, 77, 286–291. [Google Scholar] [CrossRef]
  23. Csom, G.; Czifrus, S.; Fehér, S.; Berki, T. Calculation of Spatial Weight Functions for VVER-440 Ex-Core Neutron Detectors. In Proceedings of the 11th Symposium of AER, Csopak, Hungary, 24–28 September 2001. [Google Scholar]
  24. Végh, J.; Pós, I.; Horváth, C.; Kálya, Z.; Parkó, T.; Ignits, M. VERONA V6.22—An enhanced reactor analysis tool applied for continuous core parameter monitoring at Paks NPP. Nucl. Sci. Eng. 2015, 292, 261–276. [Google Scholar] [CrossRef]
  25. Czifrus, S.; Fehér, S.; Bozsó, T. Vizsgálatok ÁNEREM Ex-Core Detektorok Térbeli Súlyfüggvényének Meghatározásához Monte-Carlo-Módszerrel—II; BME NTI Kutatás-Fejlesztési Jelentés BME-NTI-950/2020; BME NTI: Budapest, Hungary, 2020. (In Hungarian) [Google Scholar]
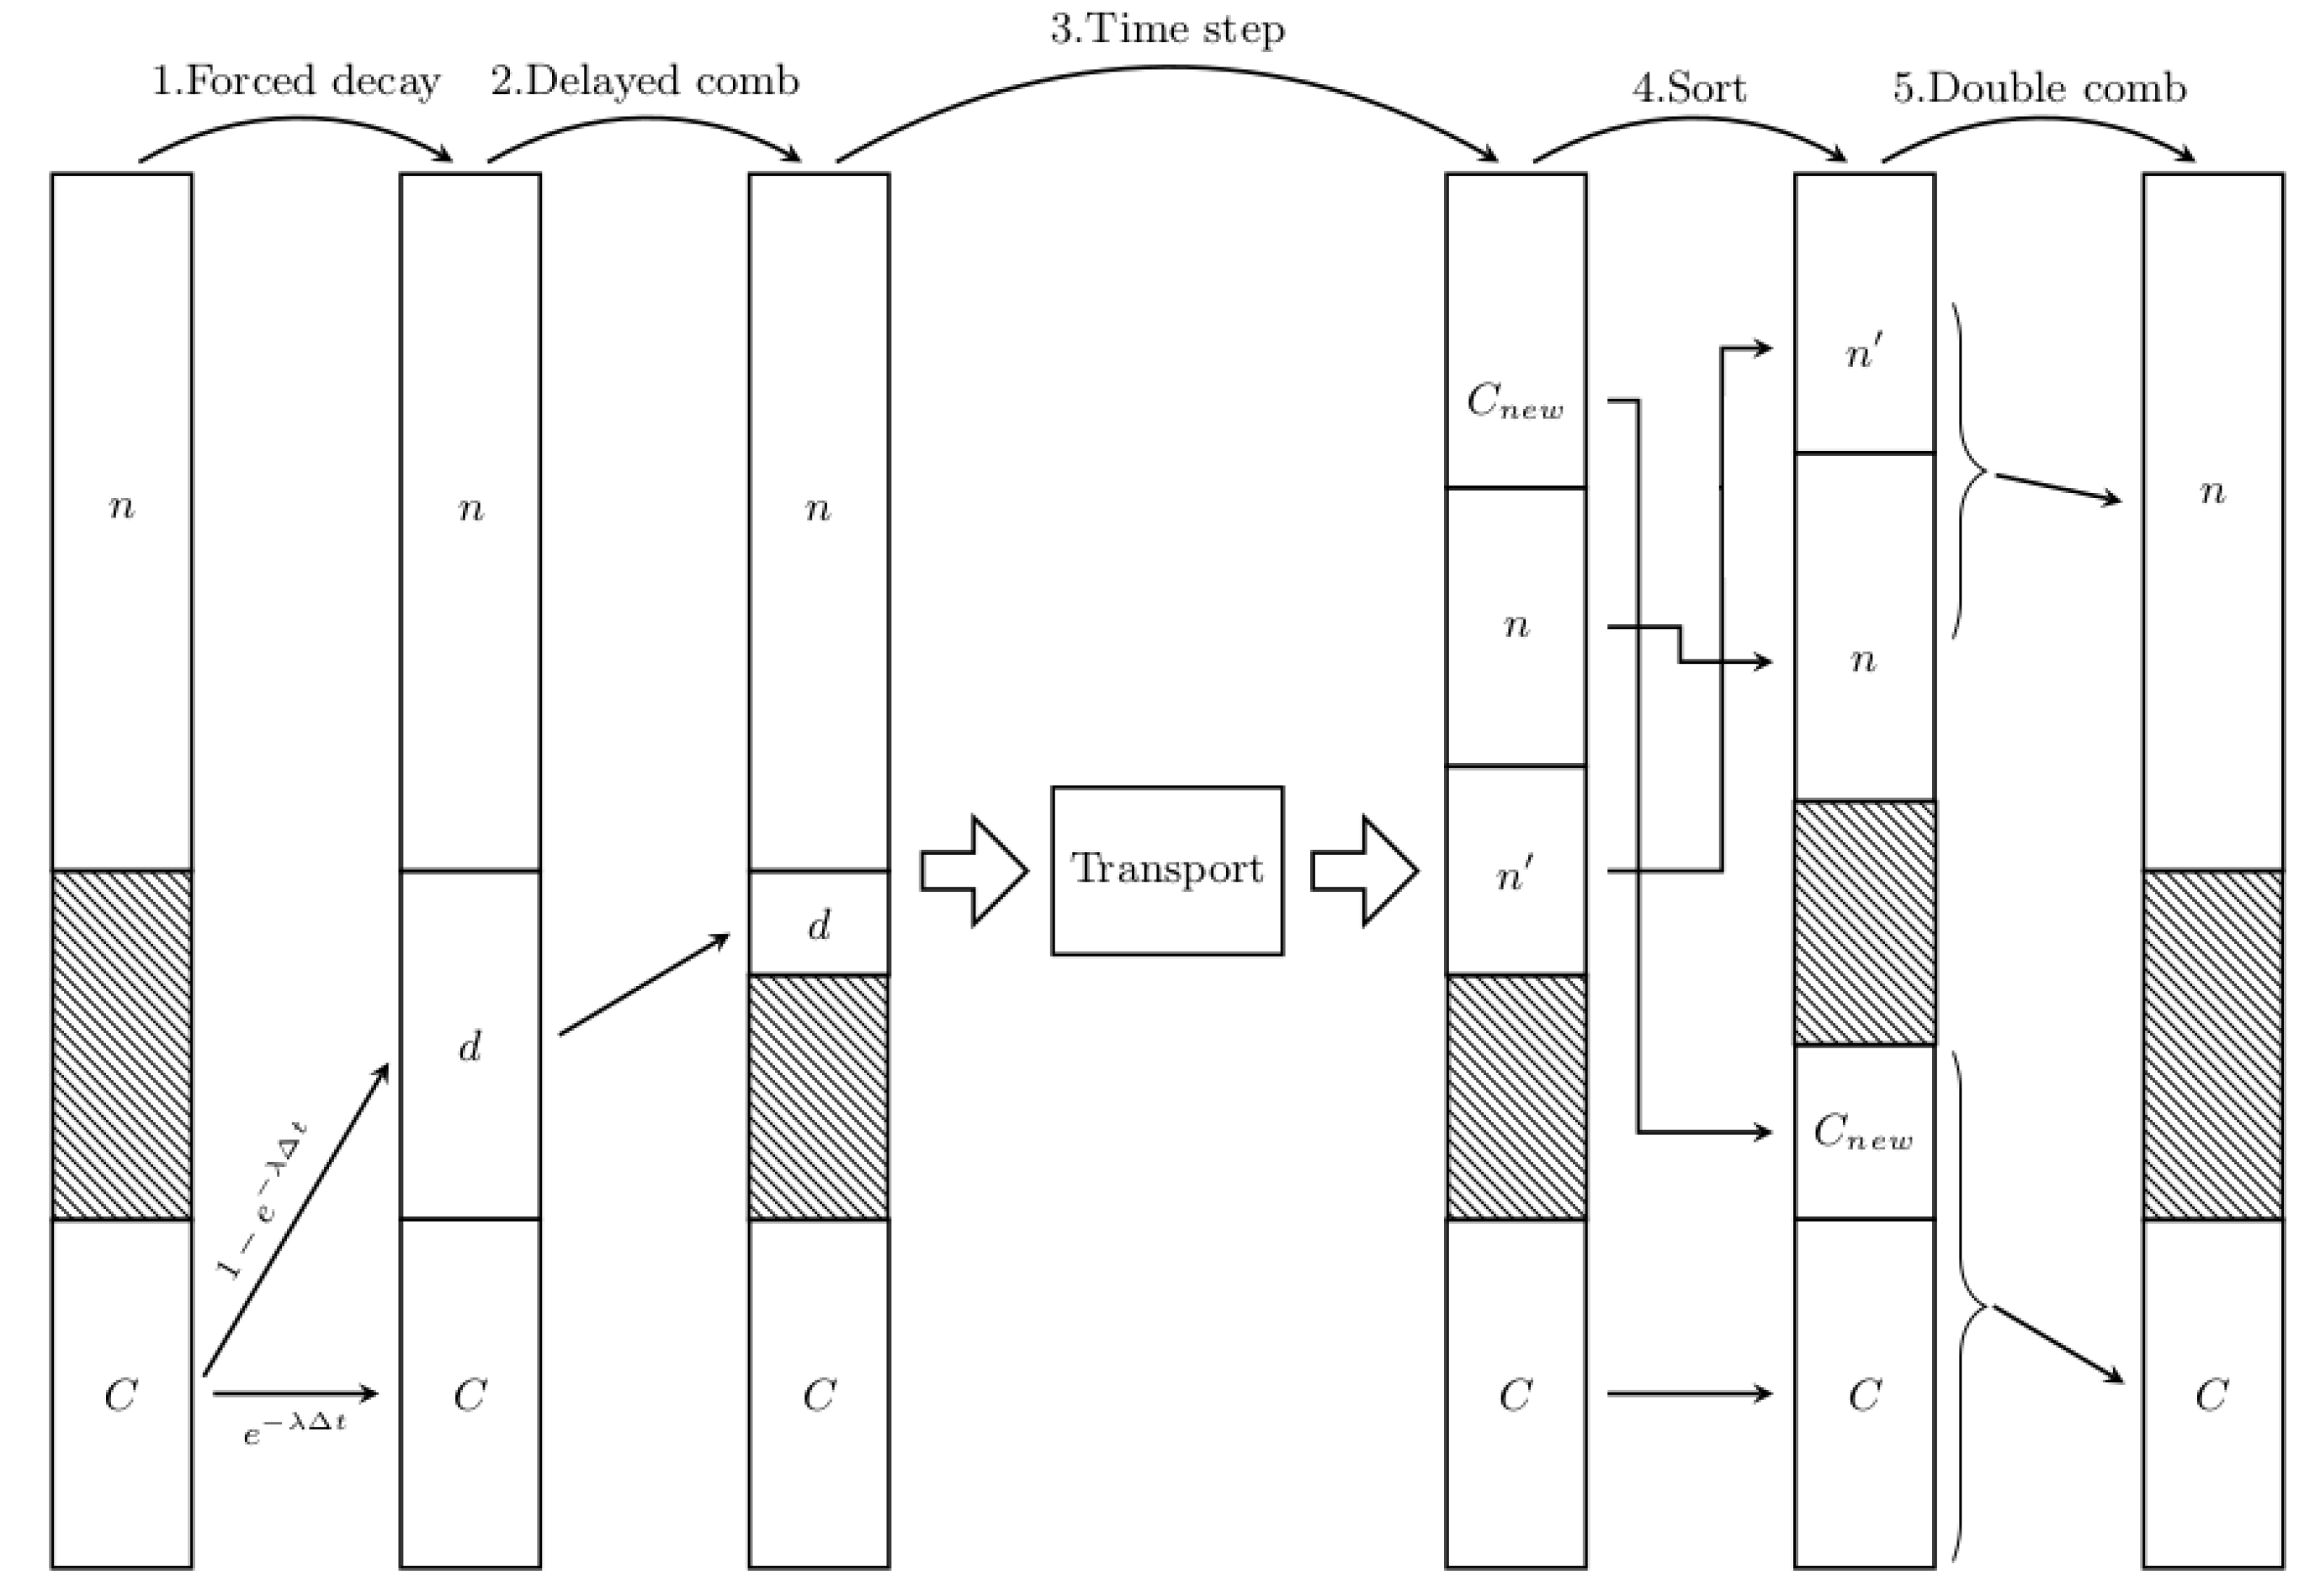
Figure 1. Prompt and delayed neutron handling workflow.
Energies 15 02712 g001
Figure 2. (a) VVER core model (with burnup) transaxial slice and (b) axial slice, different colours indicate different material composition.
Energies 15 02712 g002
Figure 3. (a) Fresh fuel assembly of type Gd47 containing burnable Gd poison (blue pins) and (b) the same assembly after the burnup calculation. (c) Fresh fuel assembly of type Gd2n containing burnable Gd poison (blue pins) and (d) the same assembly after the burnup calculation. Different colours indicate different material compositions.
Energies 15 02712 g003
Figure 4. Model geometry at the beginning of the transient (a) and at the end state (b).
Energies 15 02712 g004
Figure 5. Averaged assembly positions in time.
Energies 15 02712 g005
Figure 6. Detector sensitivities in count/fission for all three detectors, detector positions (green circles) and the position of the stuck safety assembly (red hexagon).
Energies 15 02712 g006
Figure 7. (a) Static power distribution for the whole core (b) and for a single assembly of type Gd-2n containing three pins filled with 3.35% G d 2 O 3 burnable poison at HZP, with approx power of 1.5 Me.
Energies 15 02712 g007
Figure 8. Power distribution at 5 s (a) and at 9 s (b) into the transient.
Energies 15 02712 g008
Figure 9. Comparison of ex-core detector signals to GUARDYAN and VERETINA results, linear scale.
Energies 15 02712 g009
Figure 10. Comparison of ex-core detector signals to GUARDYAN and VERETINA results, logarithmic scale.
Energies 15 02712 g010
Figure 11. Relative detector readings.
Energies 15 02712 g011
Figure 12. Time evolution of the relative error of ex-ore detector estimates.
Energies 15 02712 g012
Figure 13. Pin-wise relative error distribution for middle nodes (a) and topmost nodes at t = 0 s (b).
Energies 15 02712 g013
Figure 14. Pin-wise relative error distribution for middle nodes (a) and topmost nodes at the end of the transient, t = 13.8 s (b).
Energies 15 02712 g014
Figure 15. Histogram of node-wise power release relative errors.
Energies 15 02712 g015
Figure 16. 3D distribution of relative error in percents for suboptimal (a) and for improved precursor sampling (b).
Energies 15 02712 g016
Table 1. GPU resources and running times.
A100RTX 3090GTX 1080
Running time with burnup22 h48 h820 h
Running time with fresh fuel5.3 h10 h37 h
Number of CUDA cores691252482560
Memory size80 GB24 GB8 GB
Double Precision Performance (TFLOPS)9.70.450.25
L2 Cache40 MB6 MB2 MB
Publisher’s Note: MDPI stays neutral with regard to jurisdictional claims in published maps and institutional affiliations.