Article

Utility-Scale Storage Integration in the Maltese Medium-Voltage Distribution Network

by
Alexander Micallef
1,*,
Cyril Spiteri Staines
1 and
Alan Cassar
2
1
Department of Industrial Electrical Power Conversion, University of Malta, MSD 2080 Msida, Malta
2
Network Planning & Operations Control Centre, Enemalta PLC, MRS 1571 Marsa, Malta
*
Author to whom correspondence should be addressed.
Energies 2022, 15(8), 2724; https://doi.org/10.3390/en15082724
Submission received: 16 March 2022 / Revised: 30 March 2022 / Accepted: 6 April 2022 / Published: 8 April 2022

Abstract

:
Deployment of renewable energy sources in Malta is limited by grid integration constraints. Photovoltaic (PV) systems pose a significant risk to grid stability due to their inherent intermittency and result in overvoltages at the medium-voltage and low-voltage networks. Investments in utility-scale battery energy storage systems (BESS) will facilitate further deployment of renewables and will help to achieve energy security. This study proposed a novel sizing strategy for utility-scale battery energy storage systems (BESS) based only on technical considerations to find the minimum required storage capacity based on historical electricity demand and PV generation. The modeling and simulation were constrained to a section of the Gozitan 11 kV electrical distribution network and the results showed that the utility-scale storage can reduce the impact of PV systems on the grid infrastructure by avoiding reverse power flows and improve the local energy security by reducing the peak electricity demand. The central BESS and the decentralized coordinated BESS with “equal sizing” stored 3.4 MWh while the decentralized coordinated BESSs with “optimal sizing” stored 5.307 MWh. In all three cases, the evening peak demand was reduced by 30.5% from 2.62 MW down to a defined limit of 1.82 MW. From the results presented in this paper, the “optimal sizing” strategy showed that the BESSs have most benefit when installed next to the local PV generation. Hence, by deploying coordinated utility-scale BESSs sized according to the PV generation potential, it is expected that the penetrations of PV generation can be increased even with the present distribution network infrastructure.

Graphical Abstract

1. Introduction

The potential of renewable energy source (RES) deployment in Malta is limited by grid integration constraints. Malta reached an RES share of 10.7% by the end of 2020 as a percentage of the gross final energy consumption, with 9.5% for electricity generation [1]. With an 11.5% RES share set for 2030 [2], photovoltaic (PV) generation is expected to remain as the Malta’s highest RES contributor. However, PVs pose a significant risk to grid stability due to their inherent intermittency and could result in overvoltages in the medium-voltage (MV) and low-voltage (LV) networks [3]. Grid stability will require significant spinning capacity, diversification of RES generation and energy storage, leading to the formation of microgrid communities. Investments in utility-scale battery energy storage systems (BESSs) will facilitate further deployment of RES and help achieve energy security by providing services such as peak shaving, voltage support, energy shifting and frequency regulation when not interconnected to Italy.
According to a 2020 study by the EC on Energy Storage in member states, Germany and the United Kingdom lead the BESS current market in Europe [4]. Even though Malta has highlighted storage in its R&I Action Plan, there is no dedicated budget to address the present barriers for deployment at scale [4]. Currently, the local distribution network operator (DNO) is considering setting up an experimental storage system in another section of the electrical grid as a pilot study. As of 2020, only a pilot scheme supporting the integration of battery storage with PV systems is available to promote behind-the-meter storage installations. Malta has no other utility-scale battery storage facilities, and keeping large spinning capacity is highly inefficient and may not be technically viable at all times. Stationary battery energy storage systems (BESS) are well-suited and well-researched options for short term flexibility needs and can serve various applications.
RES electricity in Malta is almost exclusively generated from PV systems. Their inherent intermittency is presently being mitigated by the Malta–Italy interconnector and local generation facilities. However, the present RES share is already having some impact on Malta’s’ grid infrastructure, causing problems such as voltage rise and reverse power flows. As the Maltese electricity grid was planned to support unidirectional power flow (from high to low voltage levels), this could lead to several problems. Increasing the RES share to meet 2030 targets shall cause the local grid infrastructure to struggle with the additional operational challenges. Malta’s potential for large-scale storage is mainly affected by physical and spatial limitations, with cost of land being a predominant barrier for further deployment. Therefore, sizing strategies for utility-scale BESS are critical to minimize the space requirements and maximize asset utilization. BESSs can be categorized as behind-the-meter (within buildings) or front-of-the-meter (utility-scale). Behind-the-meter BESSs are outside the scope of this paper since the focus is on utility-scale BESSs. However, the readers are directed to a review by Khezri et al. in [5] that considers in depth the optimal planning and sizing of a PV-battery system for grid-connected residential applications.
In the literature, large-scale energy storage systems have been considered for a wide range of applications including power quality services (e.g., voltage regulation), energy arbitrage, firming capacities and spinning reserves, amongst others [6]. A critical review of large-scale energy storage systems that also includes reliability studies for modern distribution networks with high amounts of RES is given in [7]. This work highlights the fact that there are numerous articles investigating the technical and economic benefits of utility-scale storage and their potential role in the transition to power systems with high penetrations of RES. To limit the scope of the discussion, the focus of this section shall be concerned with the storage capacity sizing and requirements for peak shaving applications. By peak shaving applications, the authors mean that the electricity from RES is stored during off-peak periods and then discharged to meet the peak power demand. In [8], the authors propose using the levelized cost of storage (LCOS) as an indicator to quantify the cost of a utility-scale BESS in relation to the dispatchable energy in MWh. The LCOS gives an indication of the existing costs per produced energy over the expected lifetime of the BESS. However, there is no standardized definition of the LCOS and the calculation is also subject to the selection of arbitrary parameters. In [9], fixed values for battery capacities were defined and their optimal placement was determined by a particle swarm optimization methodology. This approach limits the installation of the BESSs in the mid-buses due to the voltage swells/sags during the discharging/charging of the batteries, respectively, since the decentralized storage is not broadly available to the distribution network. Danish et al. [10] propose a simple BESS sizing strategy based on the reshaping of the aggregated historical load profile seen from the main distribution substation. However, not factoring in the actual range of SoC variations in the sizing strategy can result in oversizing of the batteries and underutilization of the battery assets. Lange et al. [11] discuss a BESS sizing method for peak shaving applications based on a real-time control algorithm. However, the distribution network was not explicitly modeled, but the sizing strategy was only based on electricity demand readings at a specific site. Kichou et al. [12] developed a BESS sizing methodology that depends on the evaluation of the energy balance between generation and demand during a defined sizing period. However, the distribution network was not explicitly modeled, but the sizing strategy was only based on electricity demand readings at a specific site. The authors in [13] evaluate the storage capacity needs to achieve high penetrations of RES in a regional electricity grid with an average load of approximately 20 GW.
The authors in [14,15,16,17,18] consider optimization methods to determine the best BESS size. The optimization methods are mainly based on economic factors, that ultimately result in the maximization of profit and involve complex and intensive algorithms. In [14], Park proposes a stochastic BESS planning model to determine optimal capacity of the BESSs in a high-voltage power system. However, the optimization strategy is only limited to BESS coupled with utility-scale PVs. Yao and Cai in [15] propose a multi objective optimization strategy that minimizes the levelized cost of energy (LCOE). However, the optimization strategy in this case is also limited to BESS coupled with utility-scale PVs. In [16], the authors propose an optimization-based BESS sizing strategy for peak shaving and frequency regulation with the goal of maximizing net profit. In this case, even though stacking of services provides advantages to the BESS utilization, the quantification of the battery utilization was only limited to economic revenue. Hong et al. [17] propose a data-driven capacity demand analysis method to size BESS participating in grid auxiliary peak shaving that also aims to maximize the revenue. The strategy in this case is highly dependent on the availability of wind power and is clearly not applicable to the Maltese scenario where all the RES generation is from PVs. Alamri et al. propose an optimized BESS sizing strategy in [18] that minimizes costs for the central generation (production, startup and shutdown) in addition to ESS investment costs. However, the distribution network was not explicitly modeled, as the sizing strategy was only based on collective electricity demand and generation readings.
This study proposes a novel sizing strategy for utility-scale BESS, based only on technical considerations. The aim of the sizing strategy is to find the minimum required storage capacity based on historical electricity demand and PV generation. One of the main contributions of this paper is that the BESS sizing strategy was specifically developed for peak shaving applications. Since the sizing strategy is based on a whole year, the seasonal variability of both the PV generation and electricity demand is taken into account. An additional contribution is that the sizing strategy considers centralized and decentralized BESSs that are generally available to the distribution network (applied to peak shaving) instead of just being dedicated to an RES. The effectiveness of the sized utility-scale storage was evaluated by implementing the determined storage sizes in the model of the distribution network. Many studies that consider similar applications do not explicitly model the network [6]. An additional contribution of this study is that it highlights the risks of overvoltage issues in the Maltese network based on the present penetrations of RES.
The rest of the paper is organized as follows. Section 2 describes the methodology used for the study reported in this paper including the description of the simulation model for the considered 11 kV feeder section. The battery sizing strategy is also defined for centralized and decentralized BESSs deployed to avoid reverse power flows and peak shaving applications. A summary of the obtained simulation results is given in Section 3 on how utility-scale BESSs can reduce the impact of PV systems on the grid infrastructure. A discussion of the obtained results is given in Section 4 highlighting the findings from this study.

2. Methodology

The modeling, simulation and analysis summarized in this paper were constrained to a section of the Gozitan 11 kV electrical distribution network. The feeder section originates from one of the transformers at the Xewkija distribution center (DC) and connects 21 secondary 11 kV/400 V substations. The 11 kV network section including the 33/11 kV transformer was modeled according to data provided by the Enemalta (Maltese DSO). The net-demand profiles for each of the 21 secondary substations were obtained from measurements by master meters installed in each substation for a one-year period from 1 June 2020 to 30 May 2021. The time resolution was either of 15 or 30 min depending on the type of master meter installed at the respective substation.

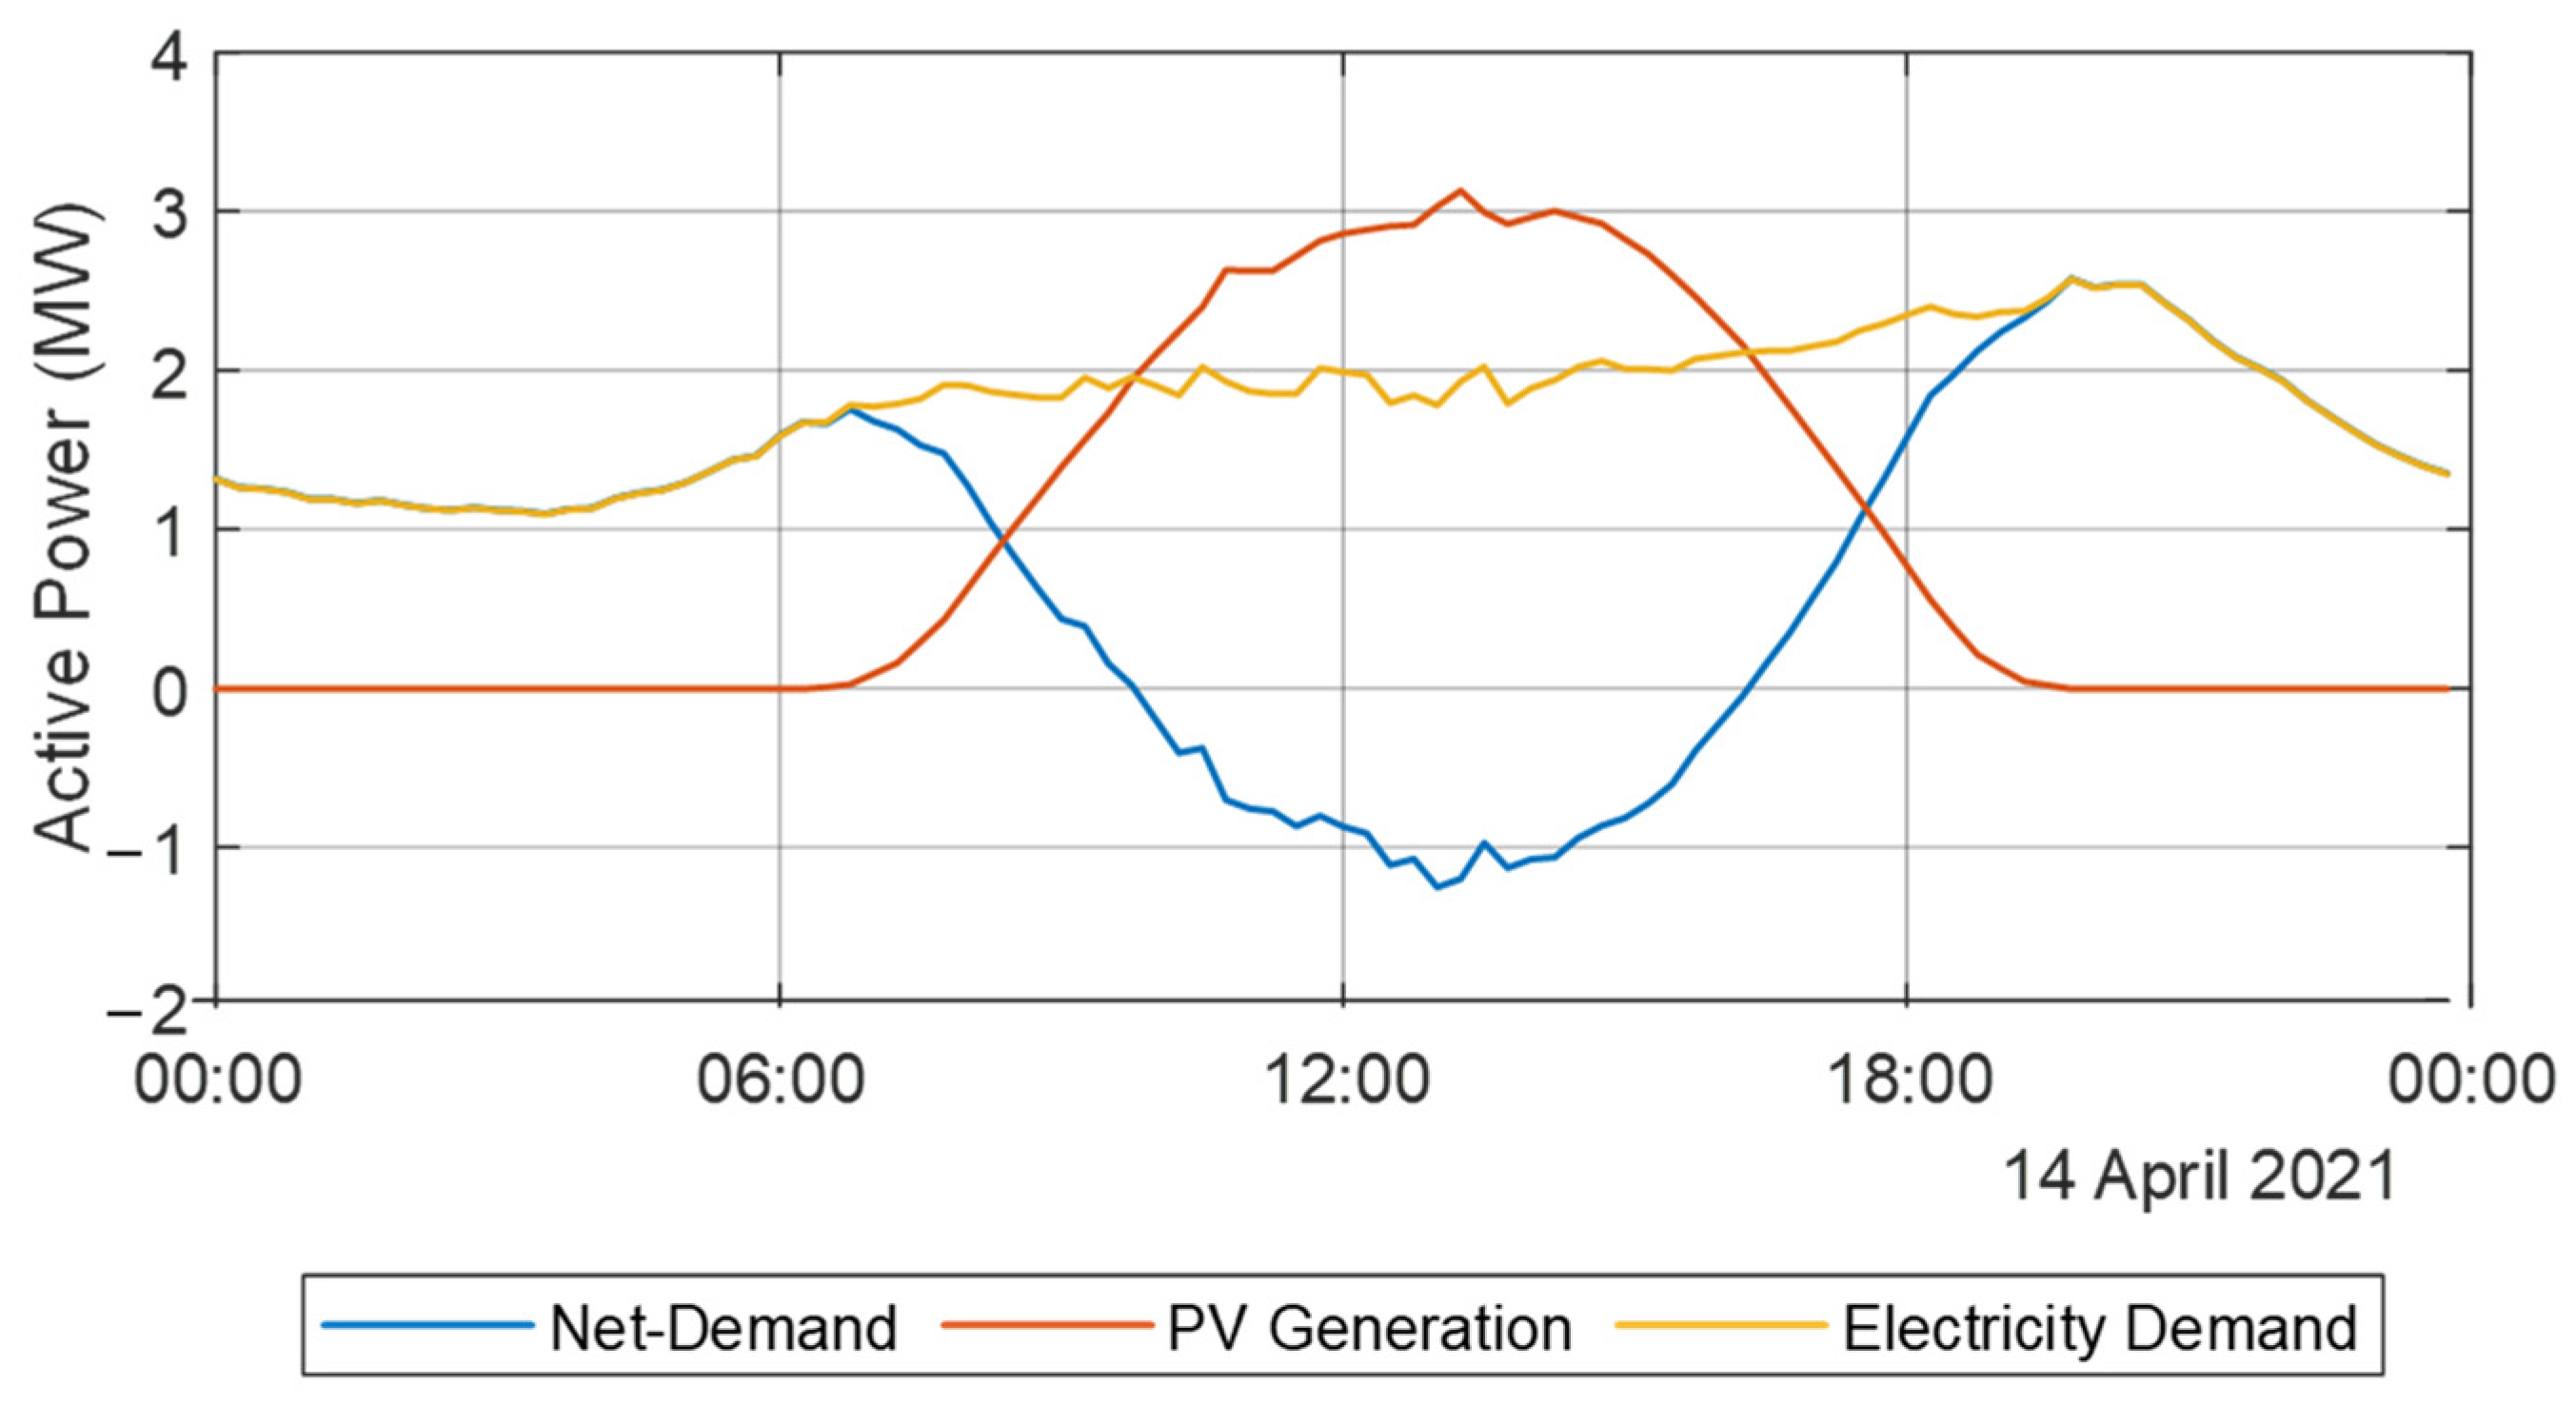
2.1. Analysis of the Net-Demand and Selection of Case Scenario

2.1.1. Analysis of the Net-Demand

When the local generation exceeds the demand, reverse power flows from the 11 kV/400 V substations through the 11 kV network back to the Xewkija DC. The resulting net-demand curve at the DC for the considered period is shown in Figure 1. The estimated net-demand characteristics were determined from the measured net-demand at each of the 21 substations. This gives a good approximation of the net-demand at the DC that however does not factor in the losses in the network. Positive active power values for the net-demand represent the power consumption by the loads connected to that substation while negative active power values represent the reverse power flow due to the local PV generation. One should note that this study was performed during the COVID-19 pandemic. The COVID-19 pandemic has affected every aspect of life including the operation of the utility grid due to changes in the energy usage patterns of residential, commercial and public entities. According to a study published by the Malta National Statistics Office in [19], the total electricity supplied in 2020 amounted to 2496.4 GWh, which is a decrease of 5.4% when compared to the previous year. The electricity demand during this period is expected to be reduced due to lockdowns affecting services and industry, while the electricity demand from residential use should be increased. The magnitude of the reverse power flows from the secondary substations during normal times are expected to be even higher than those reported in Figure 1 as these are mainly due to residential consumers.

2.1.2. Selection of Case Scenario

A detailed analysis of the daily net-demand of the considered feeder section for the period between June 2020 and May 2021 shows that oversupply occurred on 241 days. This implies that overgeneration occurred on 66% of the days during this period and always occurred during the middle of the day. One of the primary concerns resulting from the reverse power flow is the significant voltage rise that can occur along the feeder. The feeder voltage could potentially increase enough to violate the ±5% steady state tolerance defined in the Enemalta network code [20]. In addition, this voltage rise forces the DSO to frequently operate any existing voltage control devices (such as on-load tap changers) leading to a faster deterioration of their operating life. As the reverse power is injected in the 33 kV network, the voltage of the other feeders in the 11 kV network can also be affected especially since the on-load tap changer (OLTC) at the DC transformer acts on all the feeders connected at its output. An additional concern is that the reverse power flow could create dynamic stability issues due to the lack of system inertia during these instances. This factor becomes even more critical when considering the intermittency risks associated with PV generation. Higher shares of PV in the local grid are expected to lead to more oversupply events in the near future with higher magnitudes of reverse power flow.
An analysis of the estimated net-demand curve in Figure 1 reveals that the maximum peak reverse power flow occurred on 14 April 2021. As expected, the maximum reverse power flow was observed in the spring season. There are two main factors that contribute to this phenomenon. Even though the 30° tilt of PV systems in Malta favors generation during the summer months, the cooler temperatures of spring combined with high levels of sun-hours contribute to high PV generation in spring. In addition, the electricity demand curves are highly dependent on weather-related factors [21]. An analysis of the monthly heating degree days and cooling degree days for Malta for the year 2020 as reported by EUROSTAT [22] reveals that in April to June 2020 there were low requirements for heating/cooling days. This results in a lower electricity demand during the spring months when compared to either summer or winter, which have higher cooling/heating requirements. The hourly demand, net demand and PV curves for this day are shown in Figure 2. One can observe that the demand curve for this day follows the camel curve characteristic with the total electricity demand reaching 42.8 MWh. The base load when considering the electrical demand (without the effect of the PVs) is at 1.09 MW while the evening peak demand reaches 2.57 MW. The PV peak generation reaches 3.13 MW at 1 p.m. with the total generated energy during this day reaching 23.2 MWh. The net-demand duck curve characteristic shows that oversupply occurs during the middle of the day since this coincides with the peak of PV generation. This negative net-demand from 9.45 a.m. to 4.15 p.m. reaches a peak of −1.25 MW at 1 p.m. The impacts of oversupply on the considered 11 kV feeder section for the selected case study and how utility-scale BESS can be used to mitigate the effects shall be considered in the following sections of this paper.

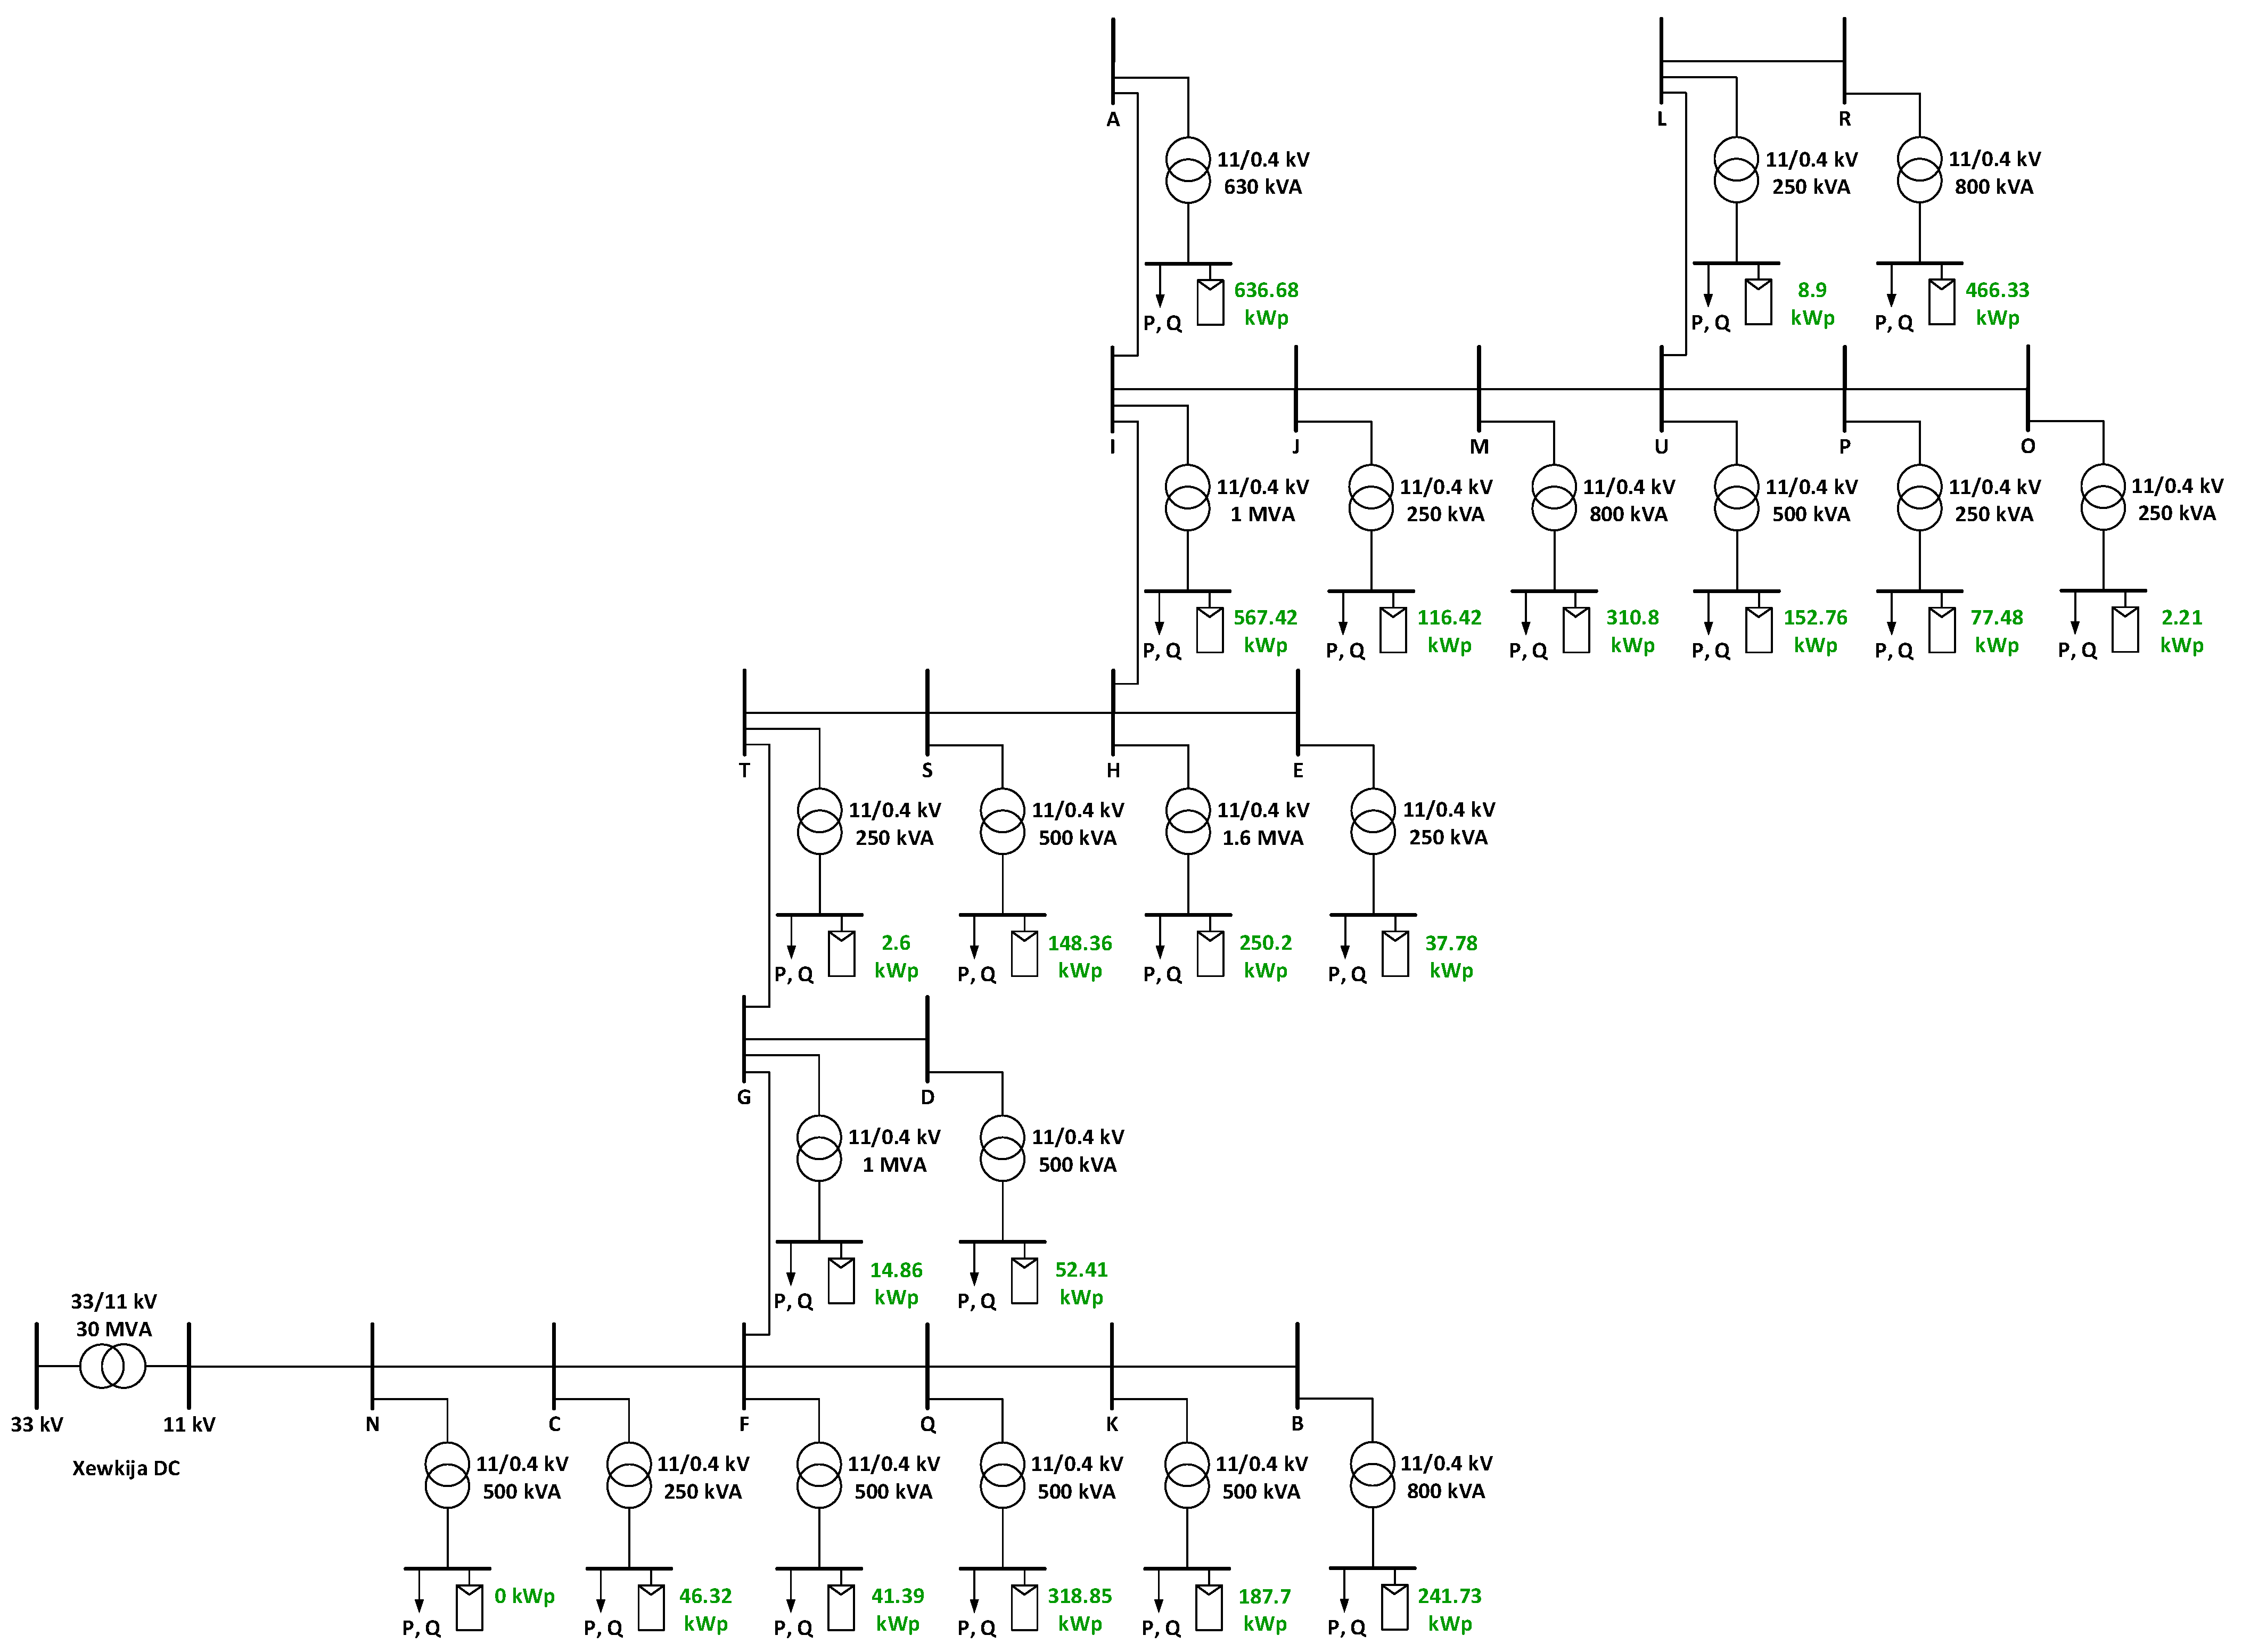
2.2. Gozo Network Simulation Model

The line diagram of the considered portion of the 11 kV network is shown in Figure 3 with each of the secondary substations labelled from A to U. The feeder section has a total of 17 segments, each represented with distributed Pi-transmission line models. Technical data on each of the feeder sections including the cable type per segment, segment lengths, and electrical parameters per unit length (resistance, inductance, and line-to-ground capacitance) were provided to achieve a detailed schematic. These detailed cable parameters are critical to the evaluation of the effects of high periods of renewable generation on the voltage profiles at each node in the network. Finally, the transformer electrical parameters at the Xewkija DC and secondary substations are also important to evaluate the effects of high periods of renewable generation on the voltage profiles at each node in the network.

2.2.1. Slack Bus

In the following simulations, the primary side of the DC transformer acts as the slack bus (or swing bus) to balance the active power and reactive power in the modeled feeder section. The slack bus provides or absorbs active and/or reactive power to/from the feeder section to provide for the system losses since these are unknown at the start of the simulation. This bus acts as a reference to the simulation model and is the only known voltage at the start of the simulation. Load buses (or PQ buses) were implemented on the secondary side of the 11/0.4 kV transformers. The active and reactive power drawn by the loads at each substation can then be used to determine the bus voltage magnitude |Vi| and its angle δi, with respect to the reference voltage, for any day of the considered period. The secondary voltage profile depends on the primary voltage profile and the tap positions of the OLTC.

2.2.2. Decentralized PV Generation Capacity

The installed PV capacity (in kWp) at each substation is also shown in Figure 3, giving a total installed PV capacity of 3.68 MWp. Substation A and M are dedicated to PV farms and only the PV generation curves for these two substations were available. The total electricity produced from substation A reached 1.025 GWh from June 2020 to May 2021, resulting in a specific yield of 1609 kWh/kWp. The total electricity produced from substation M reached 637 MWh resulting in a specific yield of 1200 kWh/kWp. The specific yield of substation A is within the expected range for Malta while substation M is seen to underperform based on the local potential. Due to the proximity of all the 21 substations, the PV generation curve of substation A was used to estimate the PV generation curves for all the other substations (except substation M) over the period of interest. The total energy generated from the installed PV capacity (including those of substation A and M) was estimated to amount to 6.06 GWh.

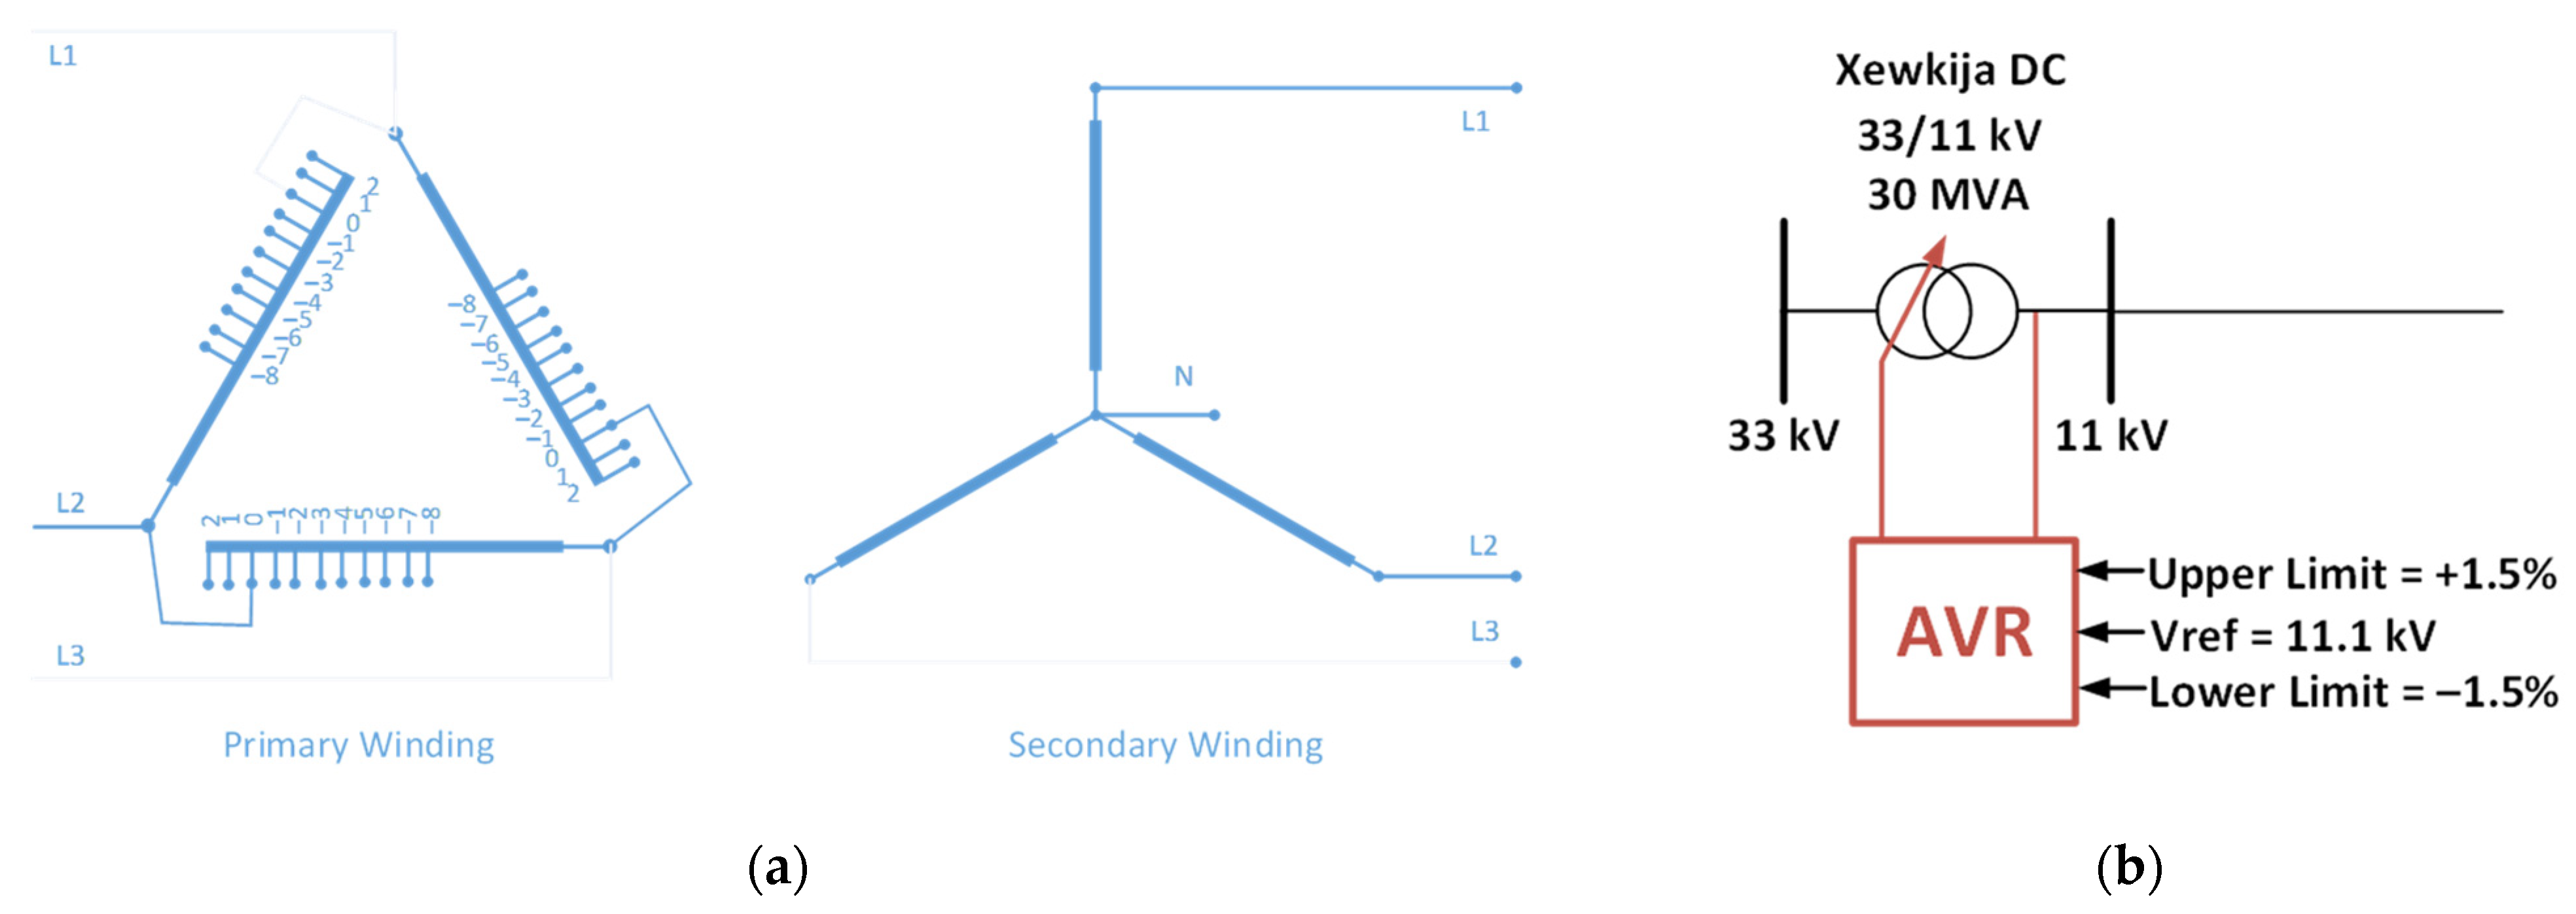
2.2.3. On-Load Tap Changer (OLTC)

An on-load tap changer (OLTC) on the primary winding of the DC transformer enables regulation of the voltage on the 11 kV side (secondary side) by adjusting the turns ratio. This is achieved by changing the tap position, thus adding/removing turns from the primary windings, when the DC transformer is carrying load and without the need to disconnect the loads. The simplified circuit diagram of the Xewkija DC transformer is given in Figure 4a. The steps (each of 2.5%) can vary from tap −8 to +2 (11 positions) while tap position 0 corresponds with the nominal transformer voltage ratio of 33/11.5 kV. Assuming unidirectional power flow (from the primary to the secondary), a reduction in the tap setting results in an increase in the secondary voltage and vice versa.
The taps of the transformer are adjusted by an automatic voltage regulator (AVR) that causes the on-load tap changer to switch to a new tapping when the voltage on the secondary varies by ±1.5% of 11.1 kV. A block diagram of the considered control loop is shown in Figure 4b. The AVR measures the busbar voltage at the DC 11 kV side, and the voltage regulation algorithm compares the measured voltage with the set target voltage of 11.1 kV. The OLTC switches the transformer to a new tapping when the measured voltage exceeds the ±1.5% deadband range. The deadband range is introduced to avoid unnecessary frequent changes in tappings and during normal operation the busbar voltage stays within the deadband.

2.3. Utility-Scale Battery Storage Systems

Utility-scale battery storage systems (BESSs) have a typical storage capacity ranging from a few megawatt-hours (MWh) to hundreds of MWh. Batteries provide an effective and energy-efficient method to limit the reverse power flows in the MV distribution network. BESSs at the utility scale can be sized according to a wide variety of performance considerations and location needs. In this paper, the BESS are deployed for peak shaving purposes. Deploying BESSs can help defer new grid investments by meeting peak demand with energy stored from lower-demand periods, thereby reducing congestion and improving overall distribution asset utilization.
The 11 kV feeder model in Figure 3 was modified to evaluate two types of utility-scale BESS architectures. The centralized storage architecture consists of deploying a single BESS at the DC. The BESS is controlled to absorb the reverse power flow on the feeder before this is injected into the 33 kV network. Decentralized storage solutions consider the deployment of BESS units in each of the 11/0.4 kV secondary substations. In this case, the feeder voltage is regulated by the coordinated control of all the BESS units according to the desired strategy. The following assumptions were considered for the simulations of the BESS units:
  • The self-discharge rate was considered negligible.
  • Round-trip energy efficiency is 85% (includes the battery and power electronic converter efficiencies).
  • The efficiency of the power electronic converter does not vary with the output power from the BESS.
  • The state of charge (SoC) varies between 20% and 80% to prolong the lifetime of the battery banks.
  • Other battery-specific characteristics were not considered.
  • The BESS is assumed to be discharged at the start of the simulation (initial SoC of 20%).
Further details on the 11 kV feeder section models with centralized and decentralized storage models are given below. In this paper, five case scenarios were modeled and simulated: the present net demand, present demand, central storage, decentralized storage (equal sizing) and decentralized storage (optimal sizing). Simulation models were implemented in Matlab/Simulink using the Simscape toolbox and simulations were performed for the demand characteristics on 14 April 2021. These simulations were used to determine the voltage magnitude of each busbar at a 15-min resolution over the whole day. For the following simulation results, the input to the slack bus voltage source was the measured voltage on the 33 kV side of the DC averaged over every hour, as shown in Figure 5. This voltage profile depends on the power flows further up the 33 kV network in addition to that of the 11 kV feeder itself. The following results are given in per unit (p.u.) with the base voltage on the secondary side of the DC transformer set at 11 kV.

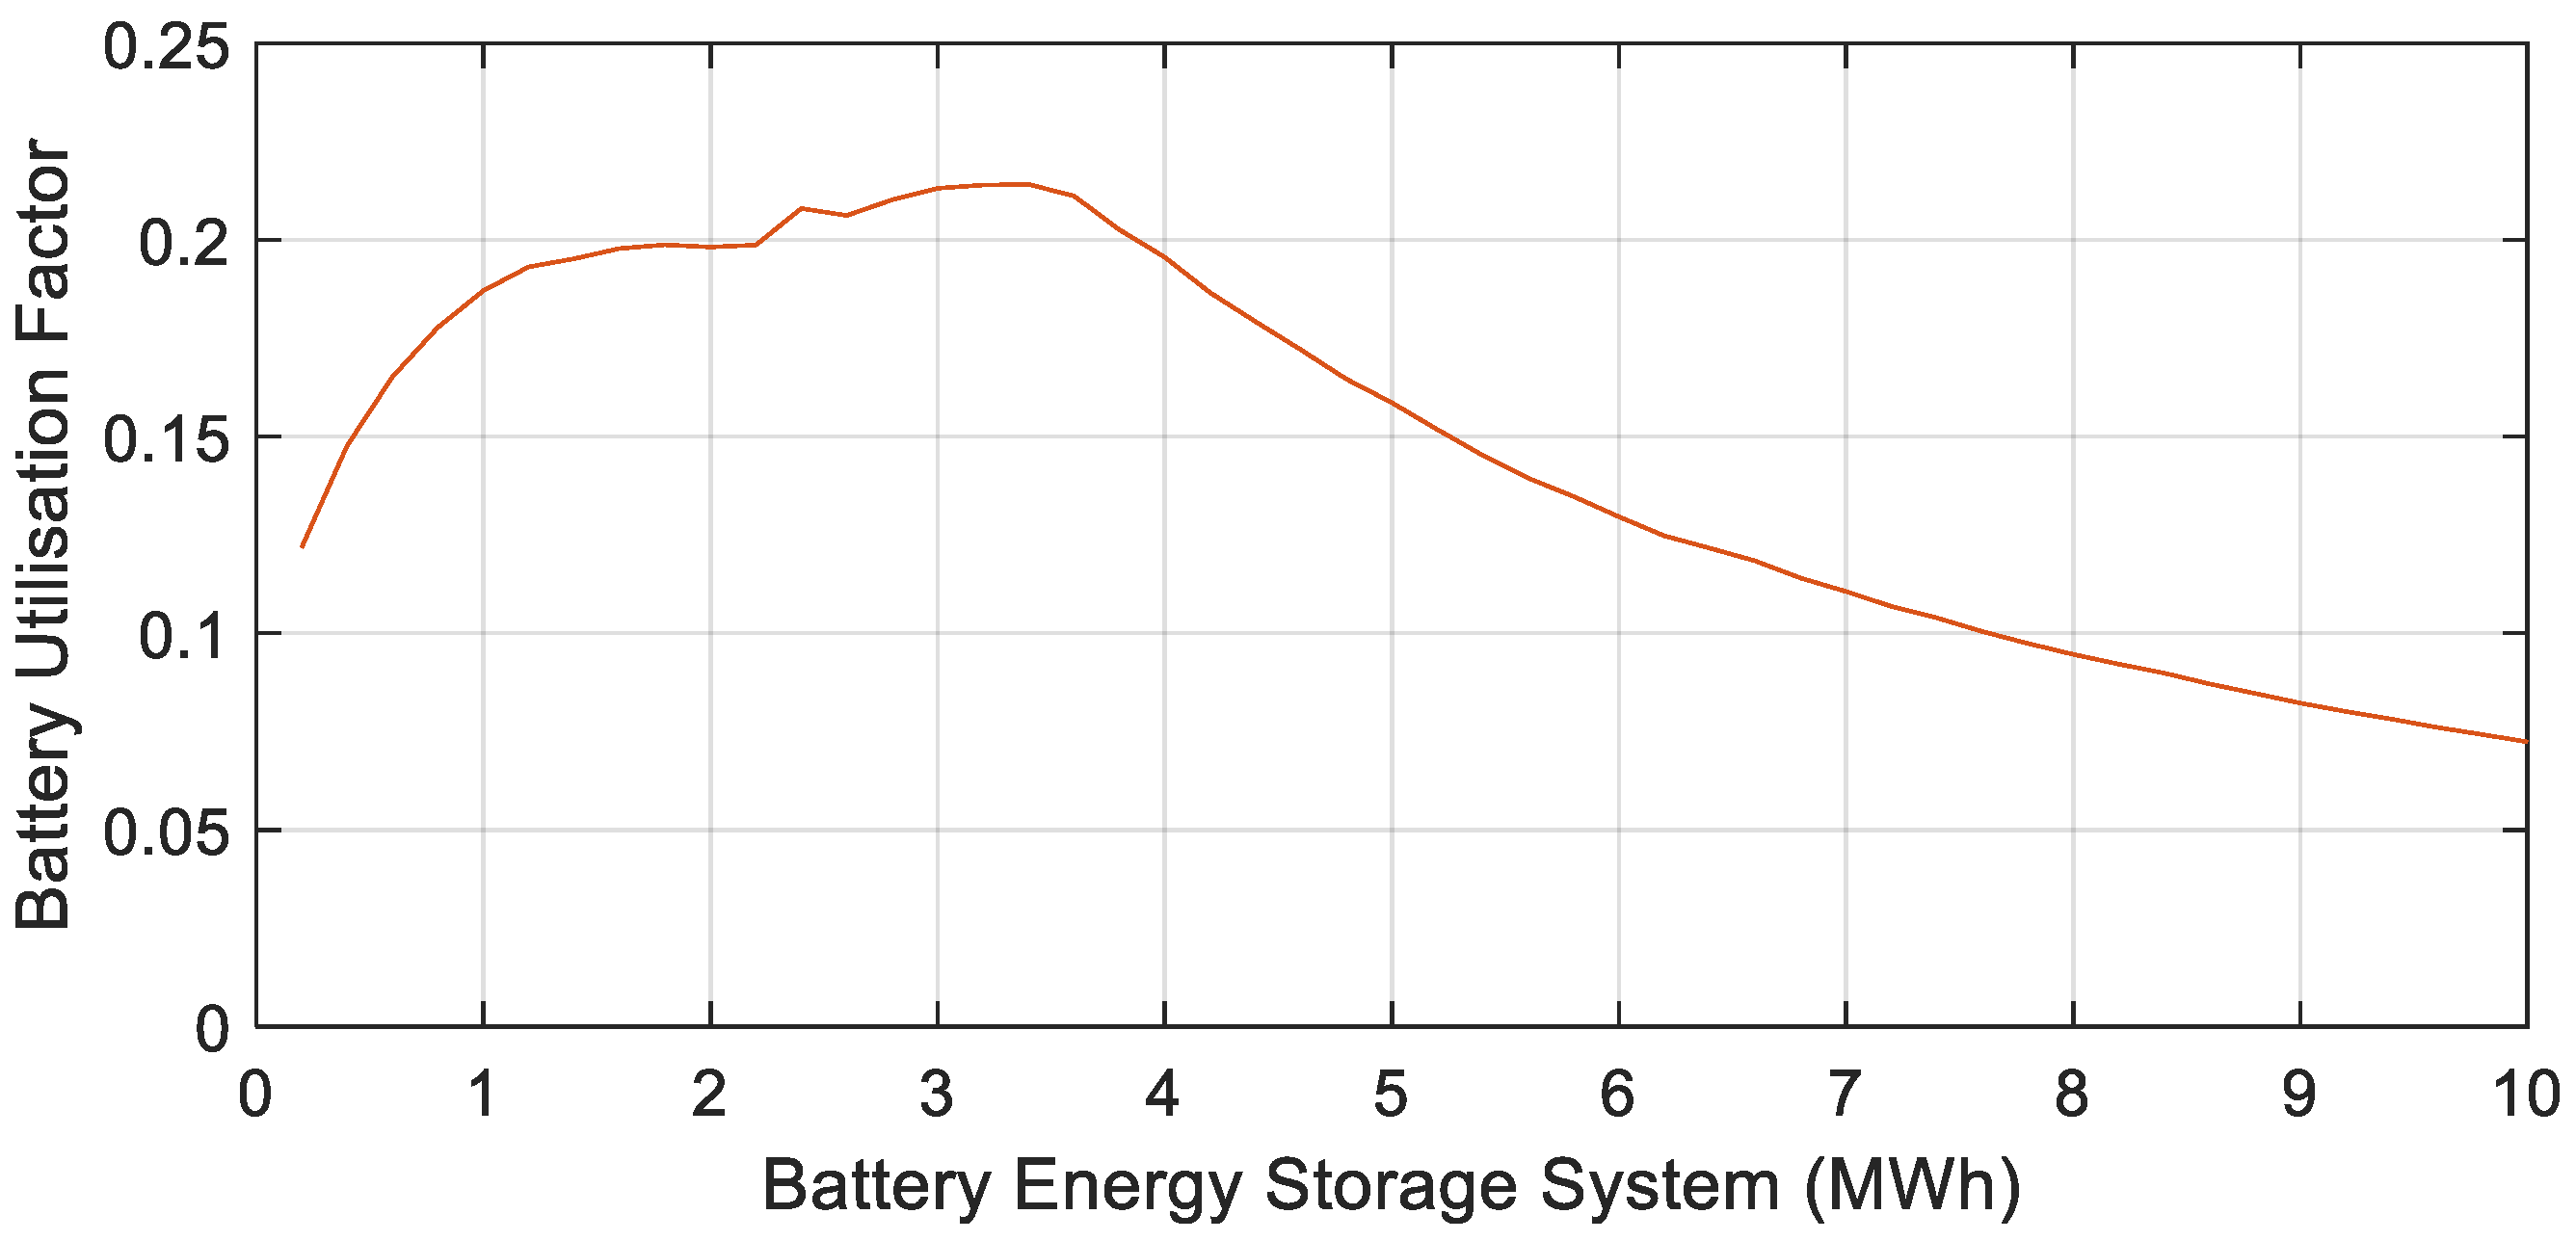
2.3.1. Utility-Scale BESS Sizing Strategy for Peak Shaving Functionality

In the literature, there is no standardized method to determine the optimal size of a BESS for a specific application. Sizing strategies typically result in a trade-off between near-term cost and longer-term technical complexity. Sizing the battery energy storage systems based on the long-term storage potential is not realistic and would result in an oversized battery bank with an unnecessarily high capex and low utilization factor.
In this study, a battery utilization factor (BUF) was defined as a tool to size BESS in peak shaving applications. The BUF is dependent on the expected duty cycle of the BESS with weighting based on the variations in the SoC. The battery storage duty cycle is affected by the operating conditions of a battery including factors such as charge and discharge rates, depth of discharge, cycle duration, and length of time in the standby mode. Hence, the BUF can enable determination of the minimum battery size that achieves the best performance based on the interrelation of the operating conditions. Thus, the capex costs are kept at a minimum. The BUF for centralized utility-scale BESS is averaged over the considered period (1 June 2020 to 31 May 2021), and can be defined by:
BUF = n = 1 365 ( W 1 T Charge n T ReversePower n ) ( W 2 T Discharge n T EveningPeak n ) Number   of   days
where n = 1, …, 365 are the days over the considered period, W1 is the weighting during charging, W2 is the weighting during discharging. The daily charging duty cycle for the nth day is defined as the ratio of the actual charging time (TCharge in minutes) to the reverse power flow duration (TReveresePower in minutes). The actual charging time is the time duration required to charge the battery to full capacity each day while the reverse power flow duration is the daily time interval during which reverse power flows into the 33 kV network at the DC. The daily discharging duty cycle for the nth day is defined as the ratio of the actual discharging time (TDischarge in minutes) to the duration of the evening peak (TEveniengPeak in minutes). The actual discharging time is the daily time duration required to discharge the battery to the minimum SoC while the daily duration of the evening peak is the time interval during which the maximum power at the DC exceeds the set daily limit.
In cases where coordinated operation of decentralized utility-scale BESS is required, the equation for the BUF should be modified to:
BUF = n = 1 365 ( W 1 T Charge n T ReversePower n ) ( W 2 T XewkijaDC _ Discharge n T XewkijaDC _ EveningPeak n ) Number   of   days
where the daily discharging duty cycle for the nth day is defined for the point in the network that shall be regulated (in this case the DC) as the ratio of the actual discharging time (TXewkijaDC_Discharge in minutes) to the duration of the evening peak (TXewkijaDC_EveniengPeak in minutes).

2.3.2. Centralized Utility-Scale Storage Strategy

The centralized utility-scale BESS was defined according to (1). The BUF averaged over a year was determined for BESS systems rated from 0 MWh to 10 MWh as shown in Figure 6. The optimal size for the central BESS was determined to be 3.4 MWh. Increasing further the size of the BESS reduces the BUF due to lower SoC values even though the charging times increase up to the maximum possible values. Hence, increasing the BESS beyond 3.4 MWh would increase the capex costs without improving the peak shaving functionality. The BUF is low since the utility-scale BESS can only charge and discharge during reverse power and peak loads respectively, while it remains idle in other periods.

2.3.3. Decentralized Utility-Scale Storage Strategy

Decentralized power balancing can benefit from short distances between the PV generation, consumers, and the storage system, thereby minimizing the distribution losses and the demand seen by the utility. Two methodologies for sizing the coordinated decentralized BESS were evaluated. The first strategy was of “equal sizing” where the centralized utility-scale storage of 3.4 MWh is divided equally among the 21 substations (i.e., 162 kWh per substation). The second strategy for “optimal sizing” employed the use of the BUF defined by (2). A set of characteristics similar to that of Figure 5 can be obtained and the determined BESS sizes for each of the substations are given in Table 1. One should note that in systems with low/no installed PV capacity, the optimal BESS size was determined to be 0 MWh based on the considered sizing strategy.

3. Simulation Results

In this section, the present scenario at Xewkija DC was modeled to analyze the impact that the present penetration of PVs has on the voltage at the 21 substations. Simulations were initially performed with the measured net-demand profile (Case 1) and with the estimated electricity demand excluding any PV generation (Case 2). These simulations define the expected maximum and minimum voltage profiles at the respective secondary substations. Simulations were then performed for the centralized (Case 3) and both decentralized utility-scale BESSs (Cases 4 and 5) to verify the effect on the voltage profile at the distribution center and secondary substations. Two storage sizing strategies were simulated. The first strategy considers the BUF as defined in Section 4 while the second strategy considers the case where the BESS absorbs all reverse power flow such that the minimum demand at the DC does not go below 0 MW.

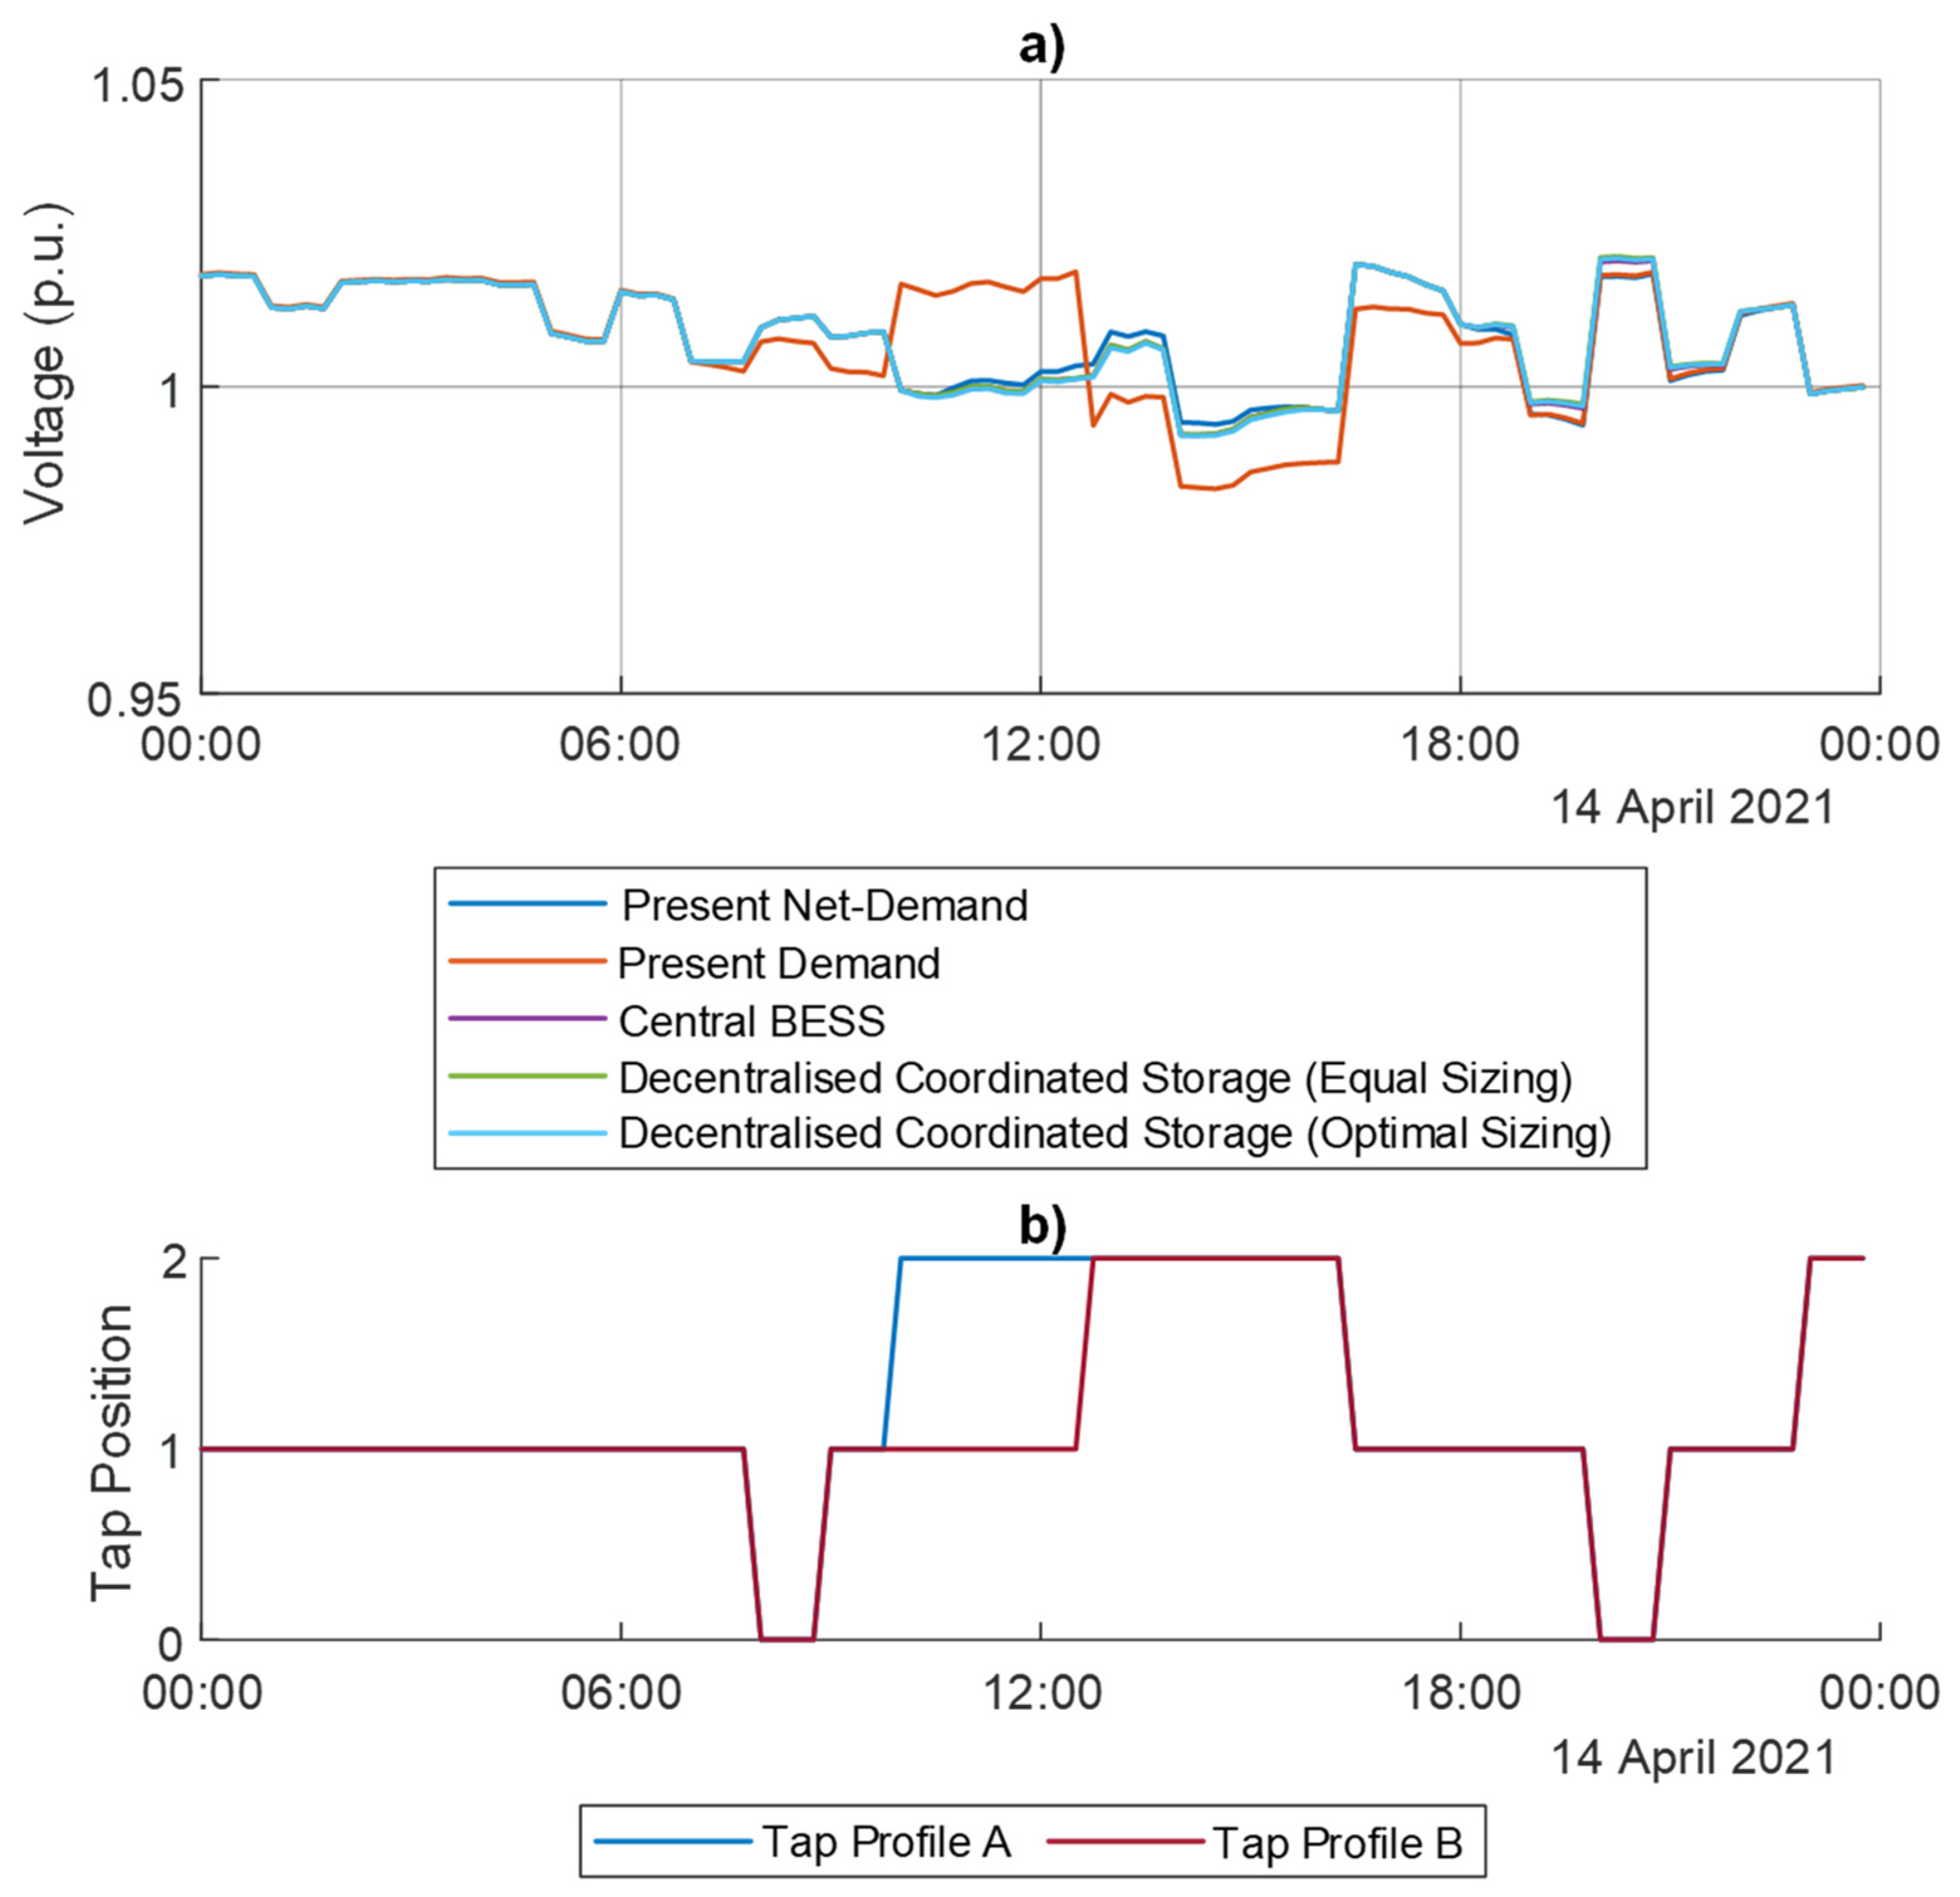
3.1. OLTC Tap Positions

One should note that the considered feeder section, as described in Section 2.2, is only part of the network connected to the secondary of the transformer at the DC. The tap positions of the OLTC at the DC depend on the voltage profile at the 33 kV side and the net demand of all the feeders connected to the 11 kV side of the transformer. The measured total hourly net-demand curve for the DC transformer on the considered day is shown in Figure 7.
The tap positions for the OLTC at the DC were estimated as shown in Figure 8 since there is no record of the actual tap positions. These tap positions were determined from the measured voltage profile on the 33 kV side (Figure 5) and the total measured power at the 11 kV side of the transformer.
However, simulations with the tap positions as given in Figure 8 would yield voltages that exceed the 11.1 kV + 1.5% range for the AVR as defined in Section 3.3 during midday. This occurs due to the difference in net-demand profiles from the total seen by the transformer to that of the considered feeder section. Therefore, in the following simulations, the DC transformer was modeled, as described in Section 3, to include the voltage regulation functionality by the OLTC. The AVR determines the best tap position depending on the net-demand at the secondary of the DC transformer and the primary voltage profile. The aim of these simulations is to show the impact of the reverse power flows on the voltage profile at each of the secondary substations and at the DC for the feeder section.

3.2. BUF Sizing Strategy

In this section, the central and decentralized BESSs designed in Section 4 were modeled and simulated. In these simulations, the objective of the BESSs is to absorb the reverse power flow, according to the designed battery capacity, before this is injected into the 33 kV network. In addition, the objective of the peak shaving algorithm was to use the energy stored in the BESSs to reduce the evening peaks by discharging the stored energy to match the magnitude of the morning peak (if enough capacity was available) or to offset the demand by the available stored energy. The initial scenarios set the benchmark for the current situation, while the next case scenarios show how utility-scale BESS can be used to achieve higher penetrations of PVs in the local grid. Simulations were initially performed with the measured net-demand profile (Case 1) and with the estimated electricity demand excluding any PV generation (Case 2). Simulations for the centralized (Case 3) and both decentralized utility-scale BESSs (Cases 4 and 5) were performed according to the BUF sizing strategy defined in Section 4 to verify the effect on the voltage profile at the distribution center and secondary substations.

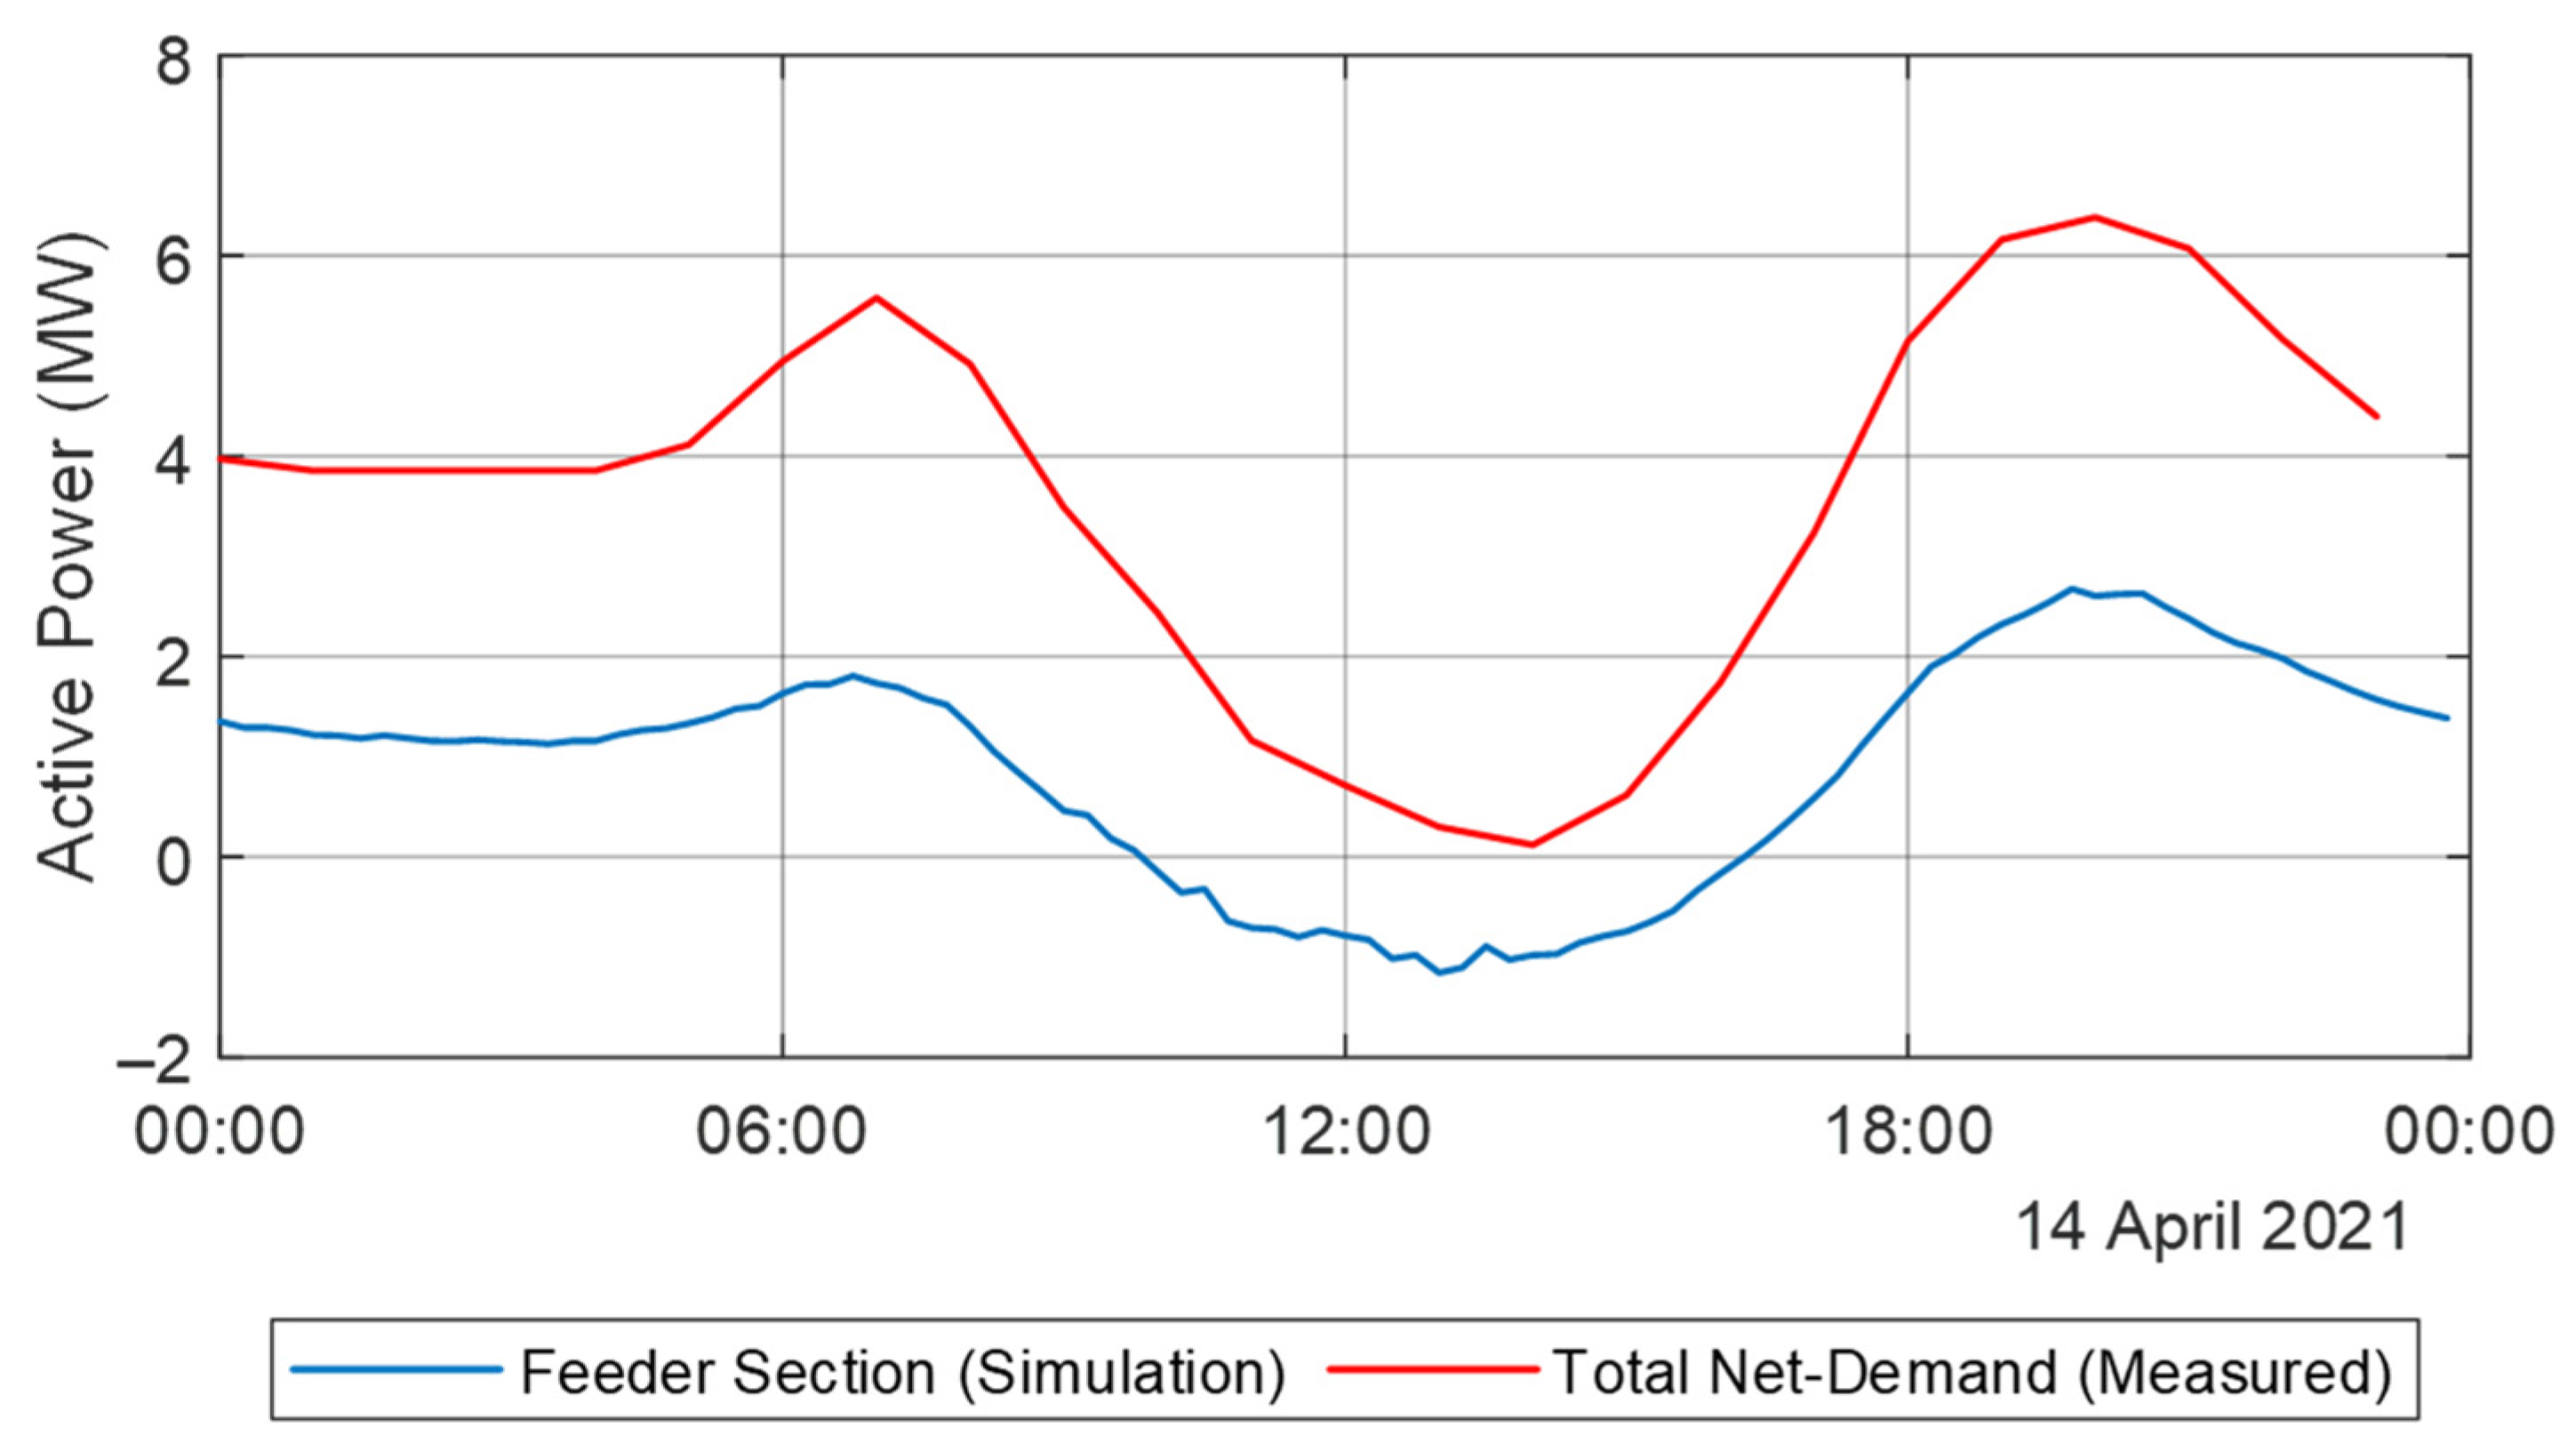
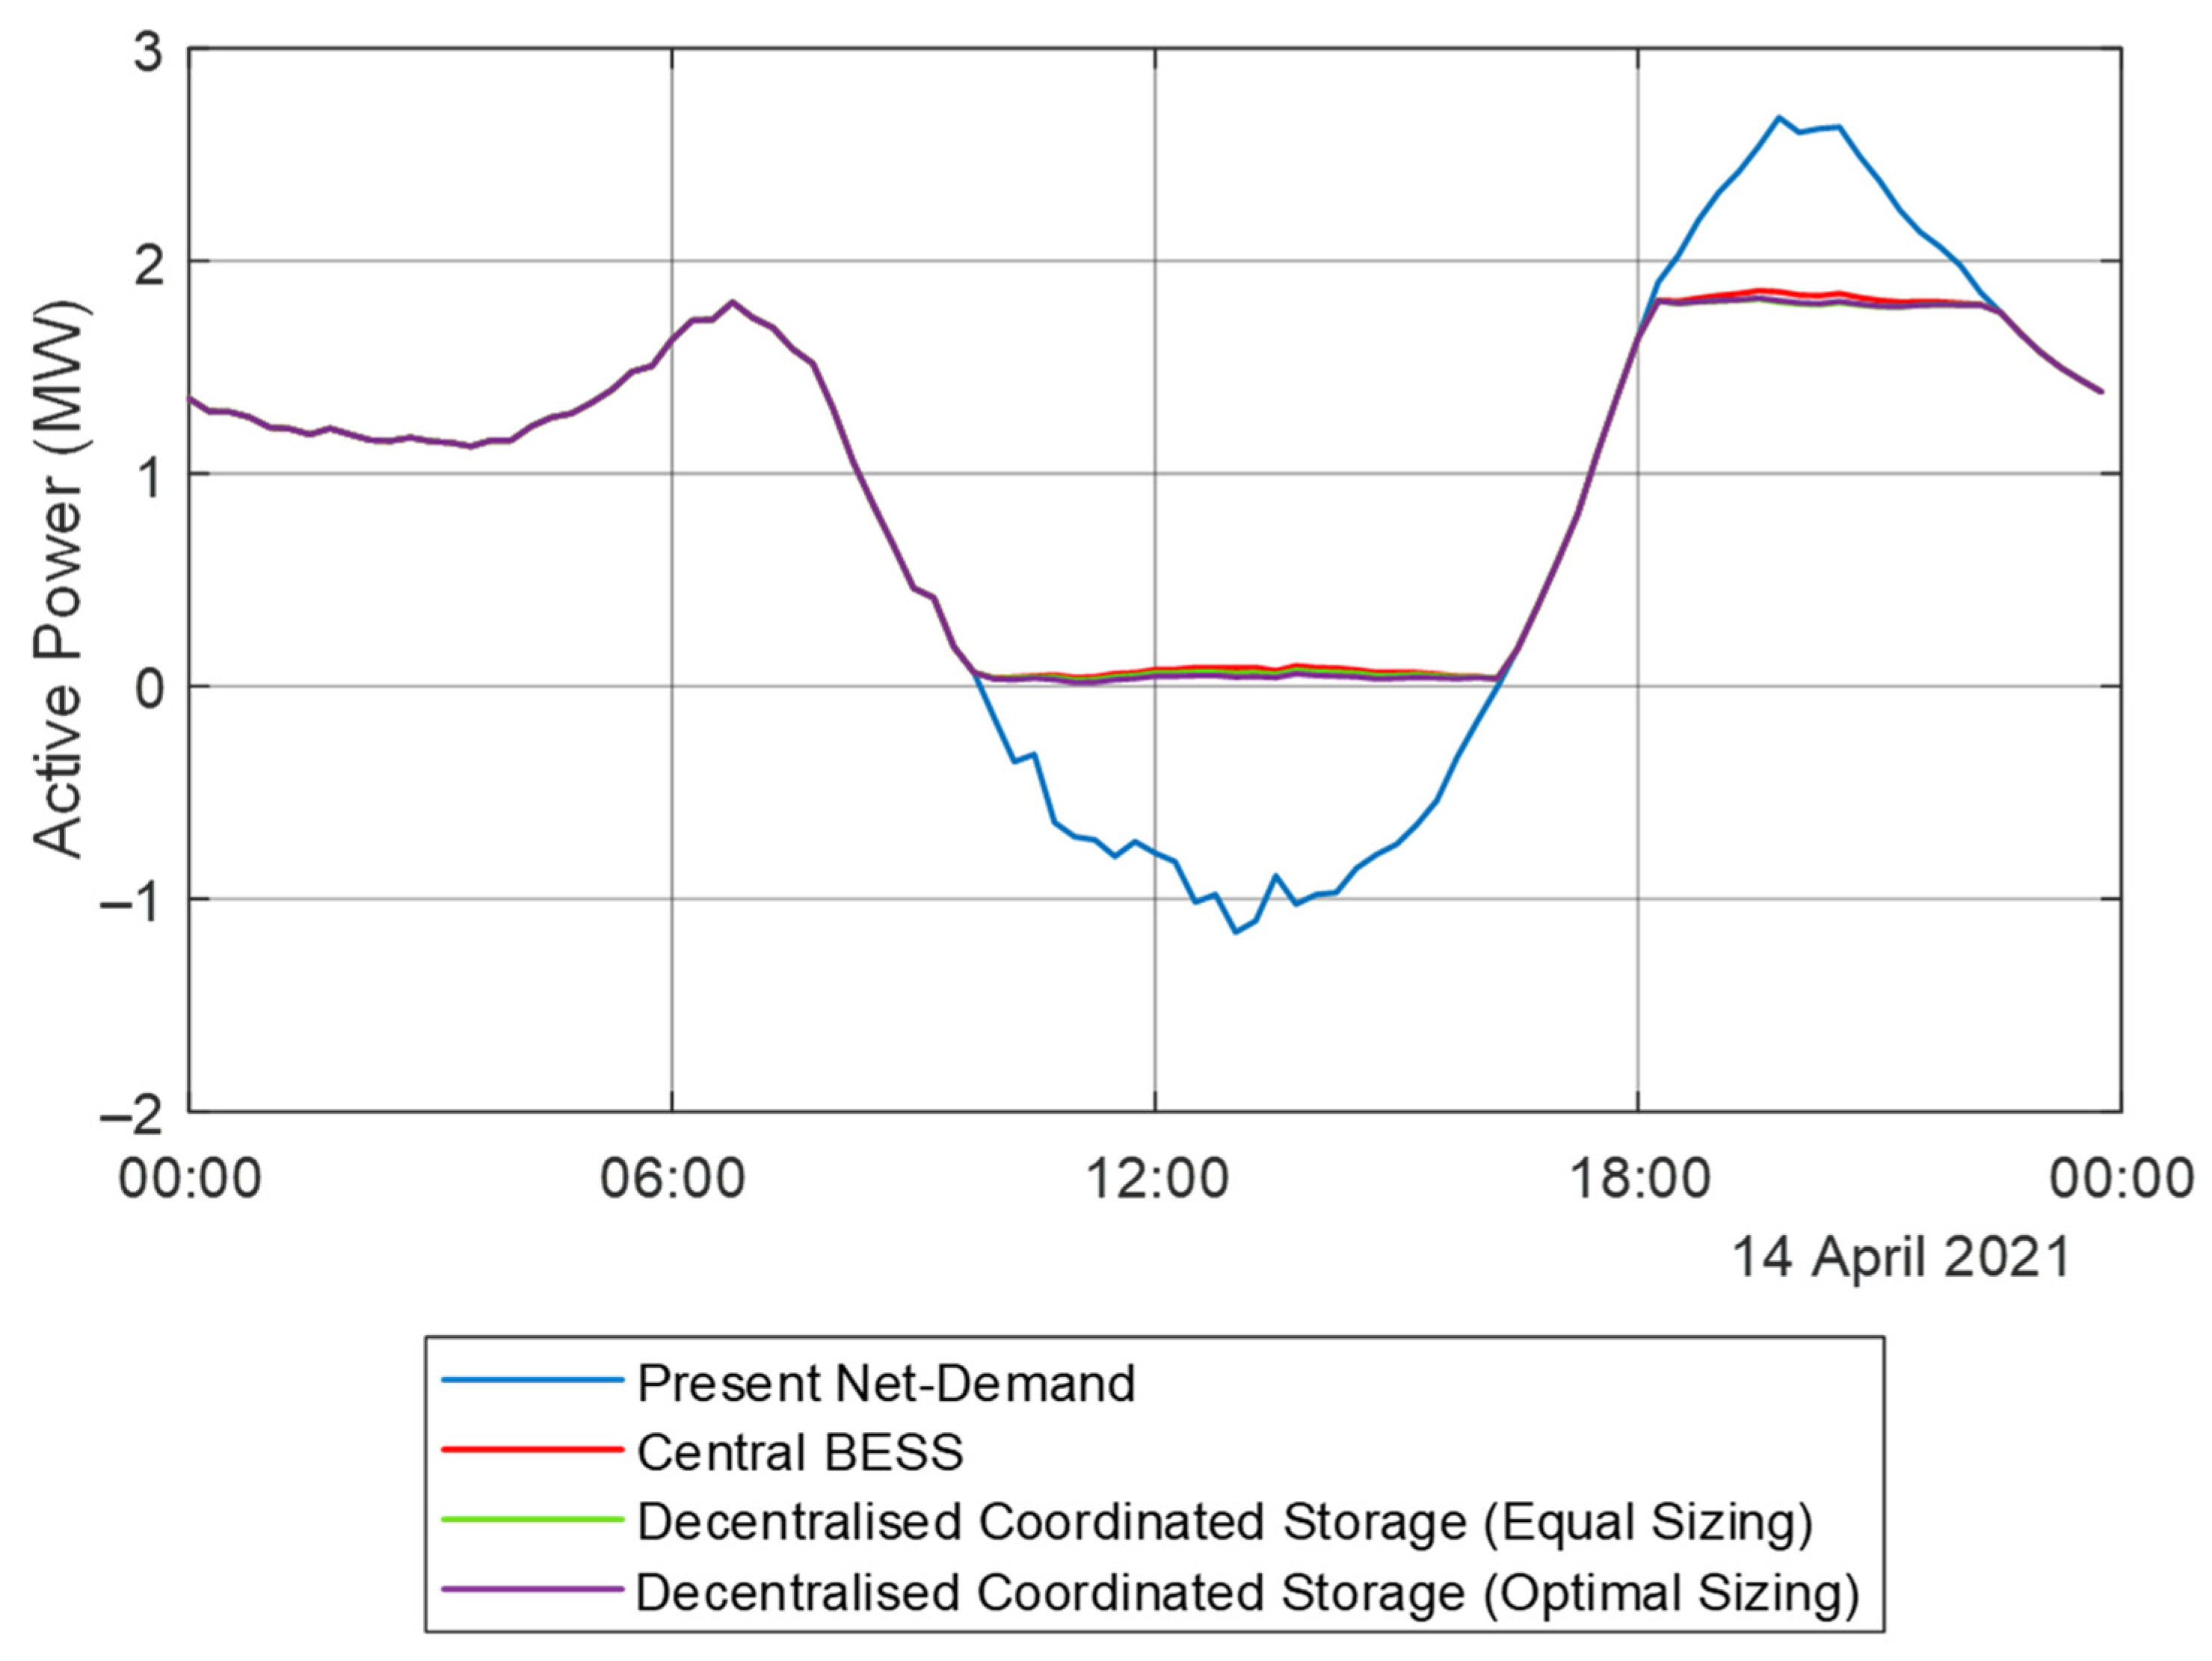
3.2.1. Net Demand Characteristics

The hourly net-demand curves obtained from the simulations carried out for this day for both the central and decentralized BESSs are shown in Figure 9. One can observe that all three of the net-demand curves with storage follow the desired net-demand characteristic. In all three cases, there is a reduction in the reverse power flow during midday while the peak evening demand is limited to the defined power limit (morning peak of 1.82 MW) since the energy storage had sufficient energy to compensate down to this power level. The central BESS and the decentralized coordinated BESS with equal sizing showed similar performance since both methods stored 3.4 MWh (SoC reached the maximum of 80%). On the other hand, the decentralized coordinated BESSs with optimal sizing stored a higher amount of energy (5.307 MWh) and reduced even more the reverse power flow into the 33 kV network.

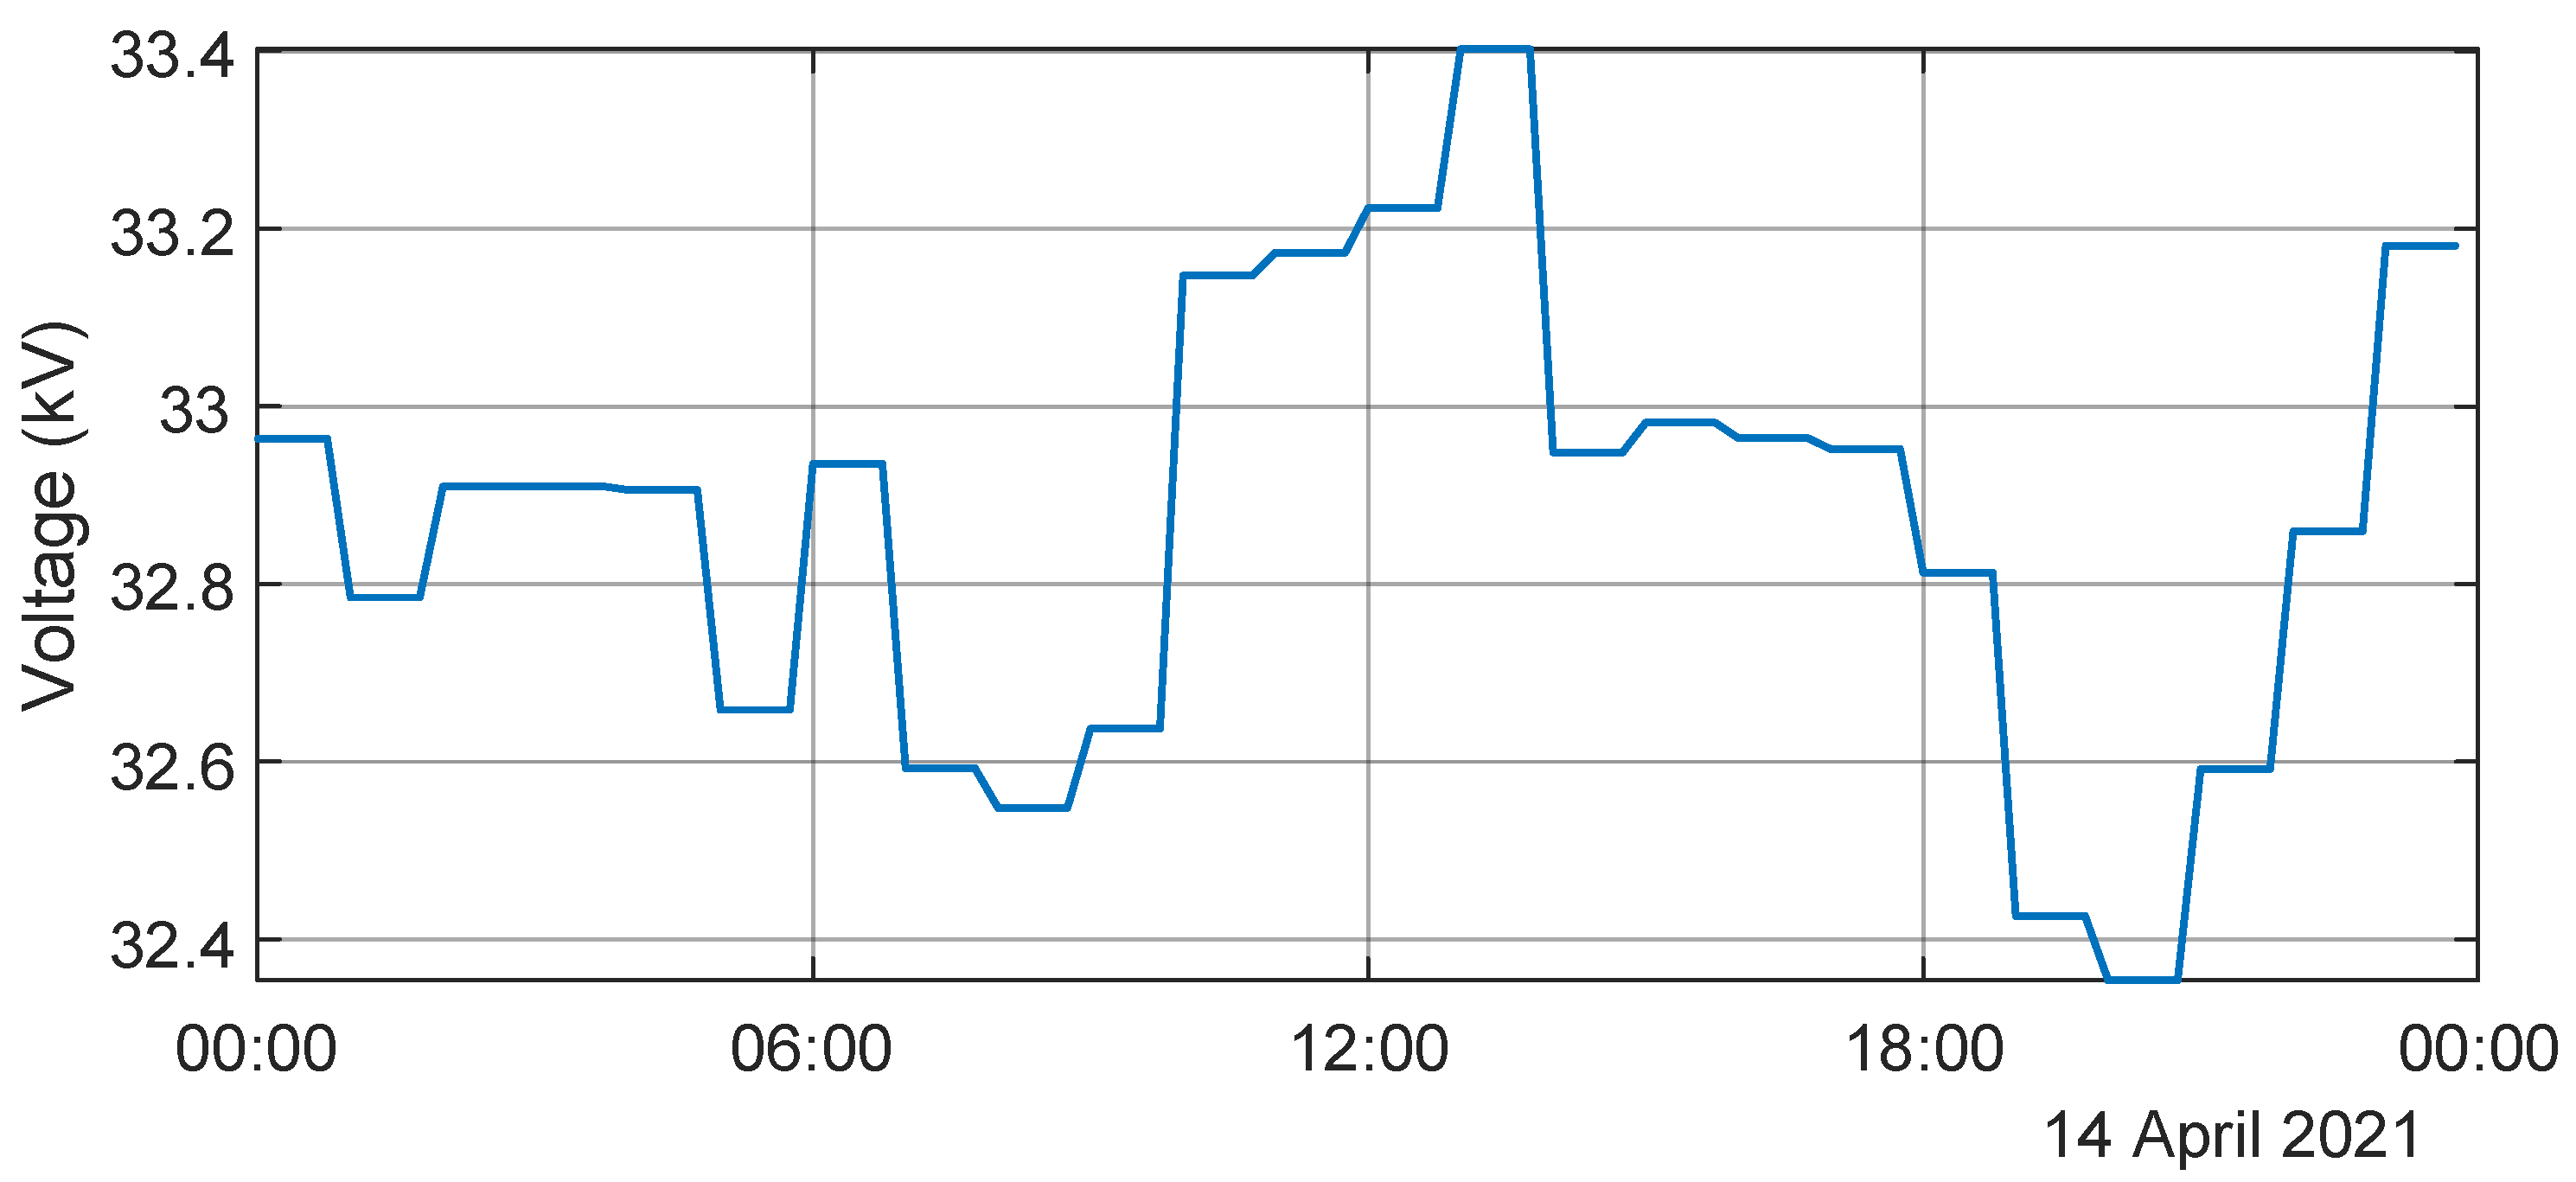
3.2.2. Xewkija DC Voltage Profile

The resulting voltage profiles at the DC are shown in Figure 10. The voltage profile in all five cases is regulated in the range of 11.1 kV ± 1.5% throughout the whole day. For the simulations of Case 1, 3, 4 and 5, the OLTC followed tap profile A. The taps of the transformer are at the maximum setting during midday (10 a.m. to 4.15 p.m.). This corresponds with the period when there is reverse power flow into the 33 kV network (i.e., direction is from DC transformer secondary to the primary). On the other hand, the OLTC followed tap profile B for the simulations of Case 2. The tap profiles are the same during the day except between 10 a.m. and 12.15 p.m.

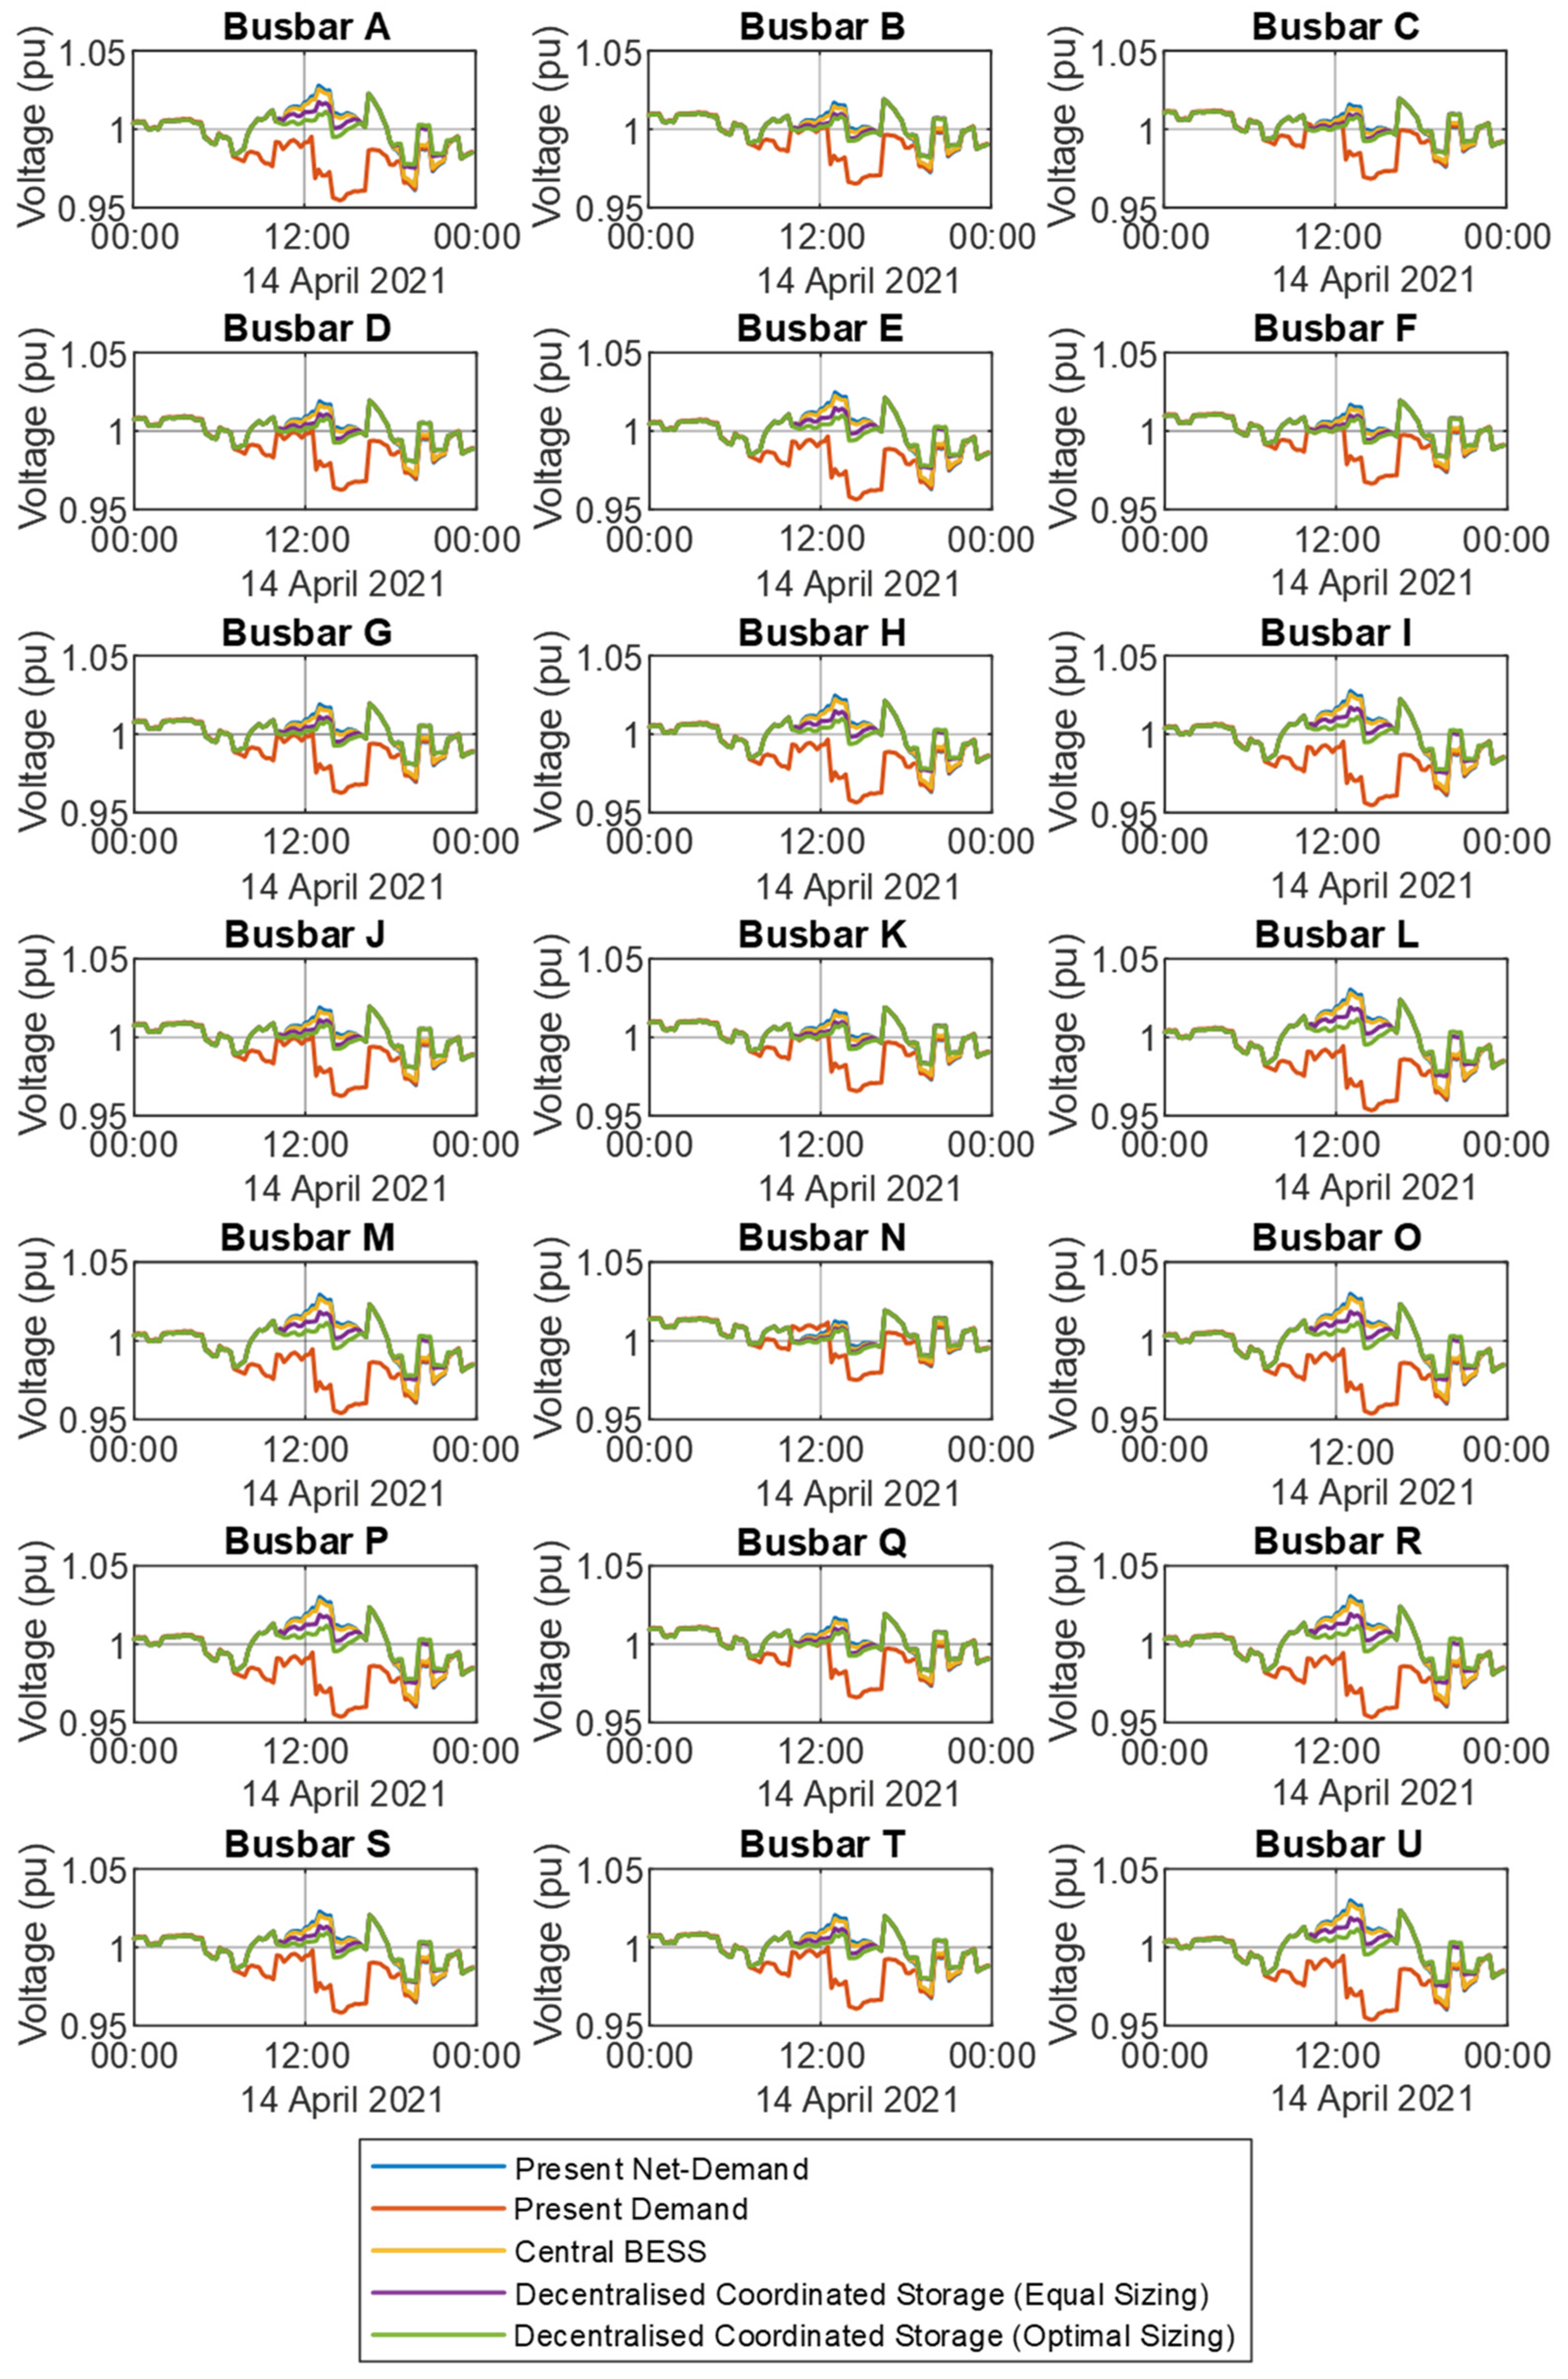
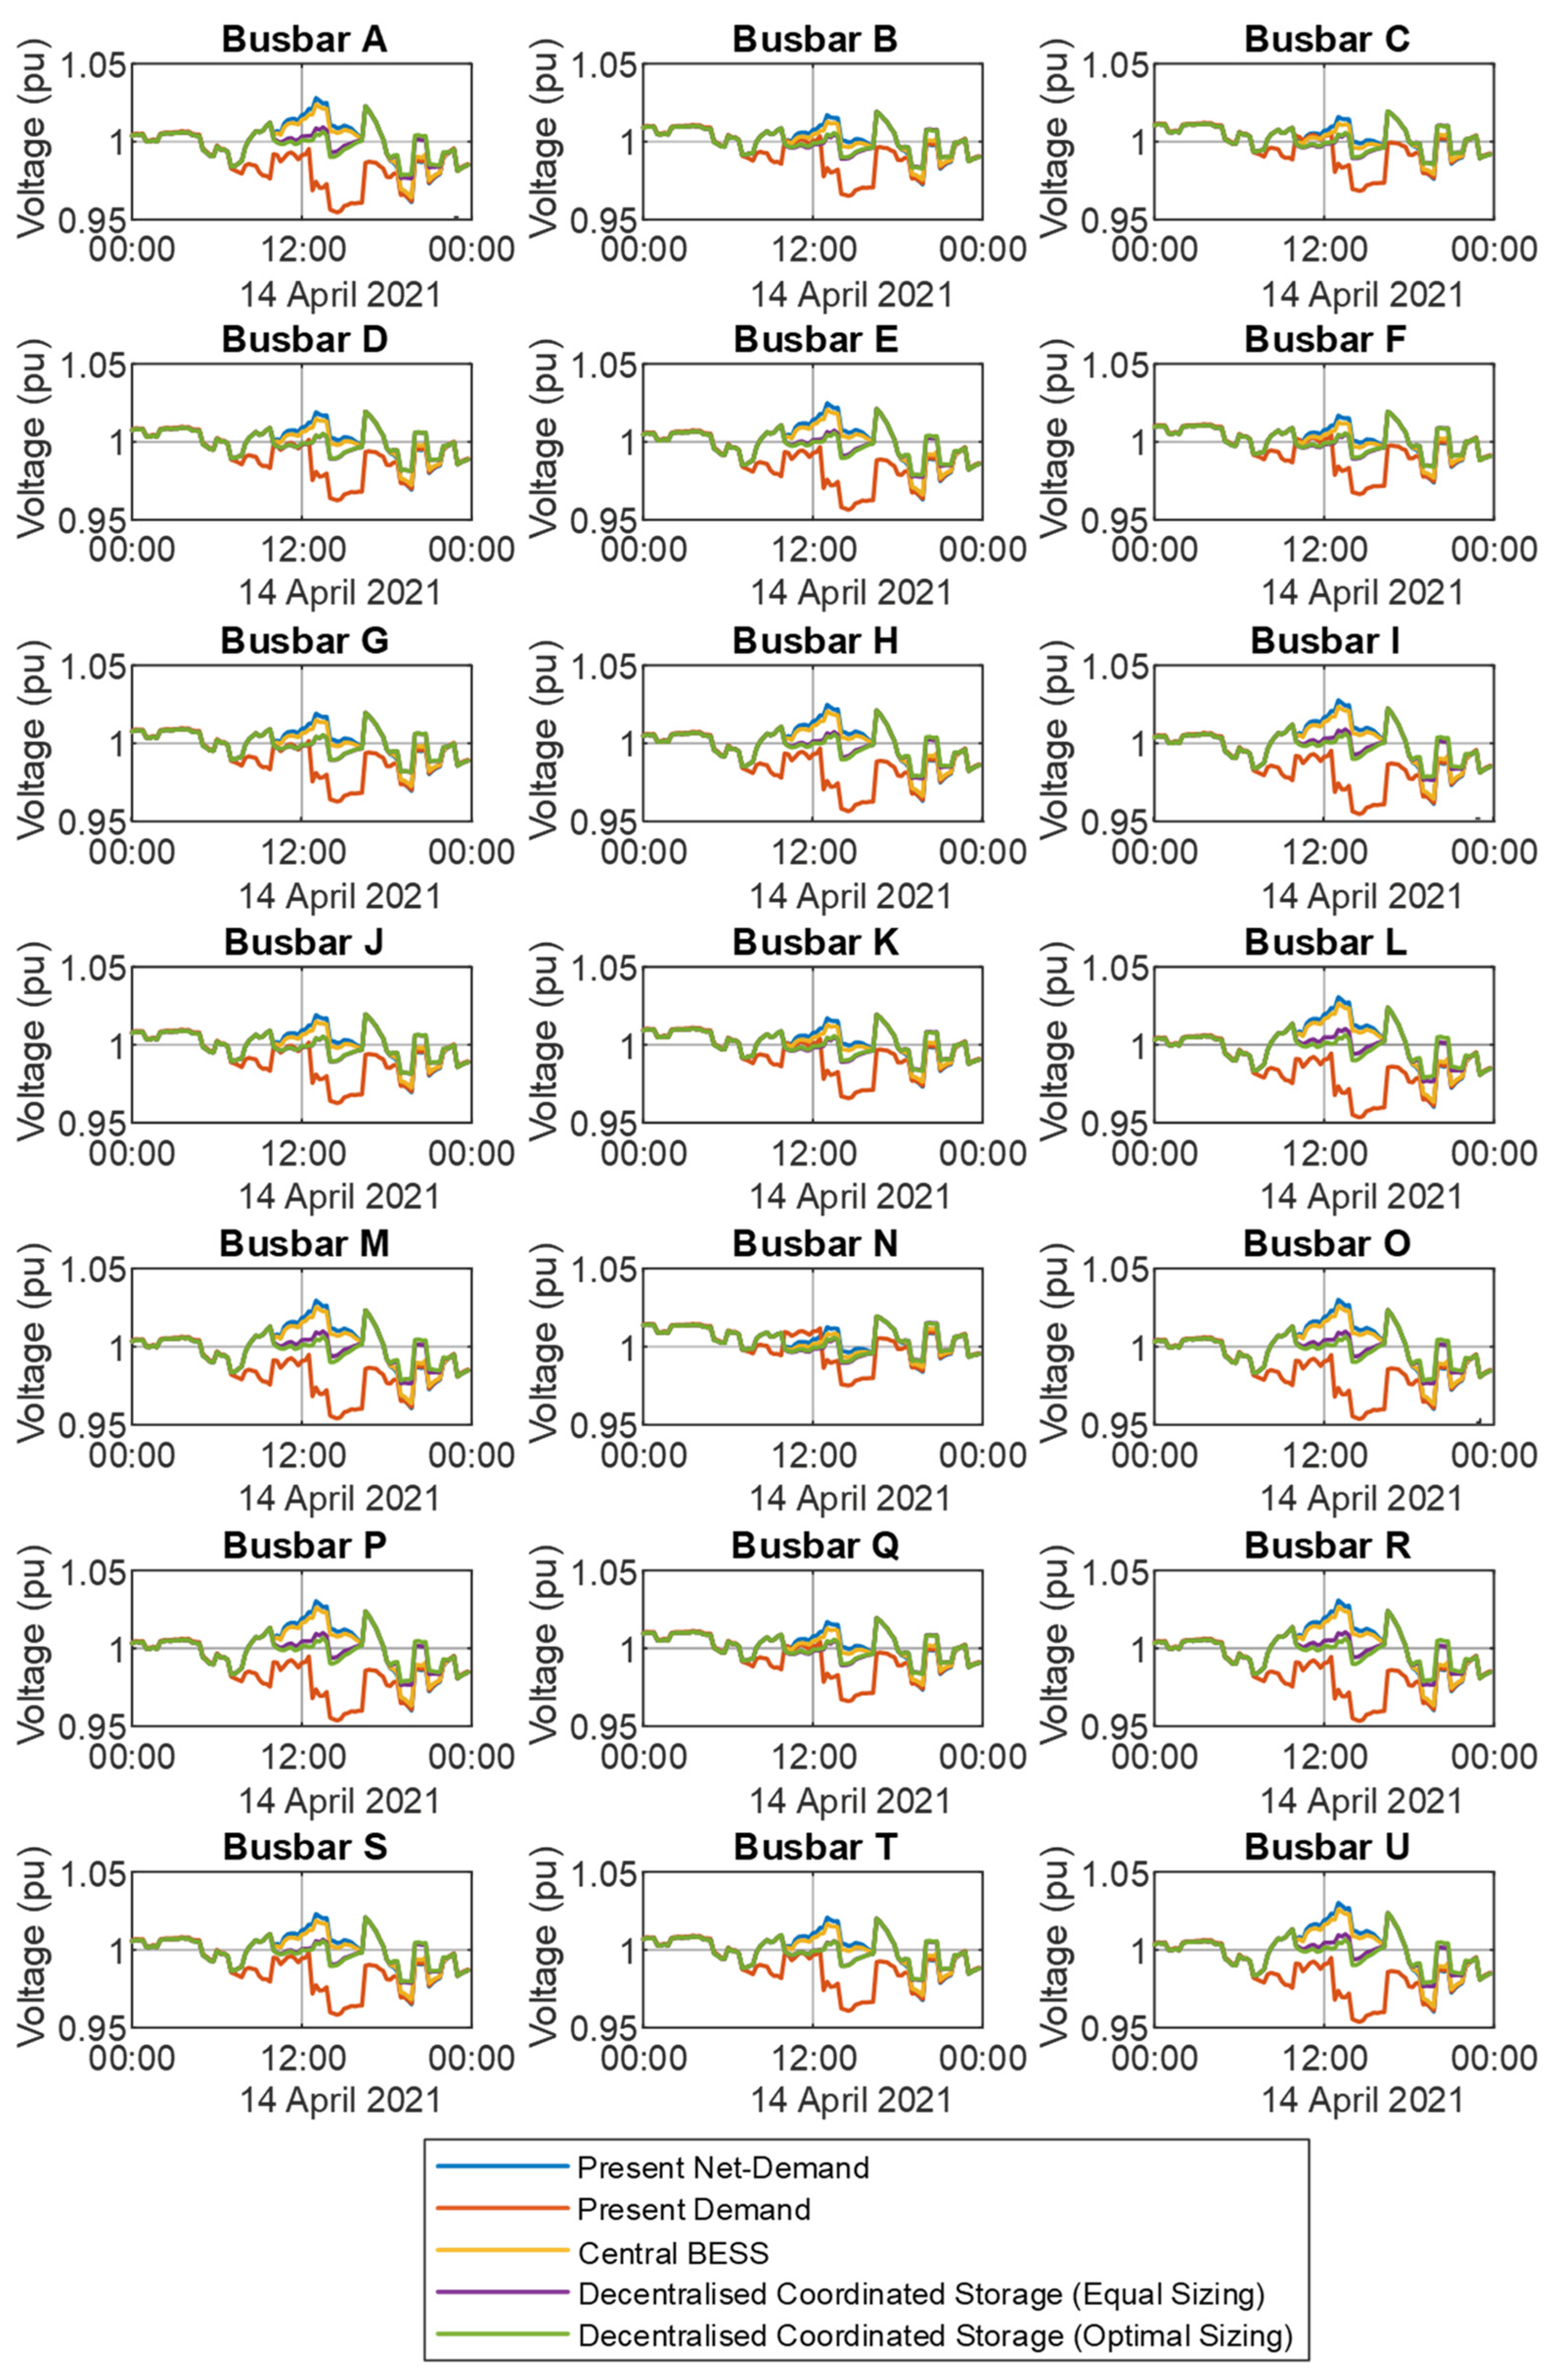
3.2.3. Substation Voltage Profiles

The resulting voltage profiles at each of the 21 substations are shown in Figure 11. The voltage profile in all cases ranges from 11 kV ± 5% throughout the whole day. For the present net-demand profile simulations (Case 1), voltage rise can be observed in all substations during the period when there is reverse power flow (10 a.m. to 4.15 p.m.), even in substations in which there were no PVs installed (e.g., substation N). One can note that the centralized utility-scale BESS has a negligible effect on the voltage profiles at the secondary substations. The central BESS is not able to compensate for the voltage rise along the feeder since the reverse active power flow from the secondary substations still affects the system voltage along the feeder sections up to the distribution center. On the other hand, the decentralized utility-scale BESS strategies were both effective in regulating the voltage at the secondary substations, with the optimal sizing strategy resulting in lower voltage profiles in the substations where storage was deployed. The decentralized BESSs are deployed at the LV side of the secondary substations and effectively mitigate the voltage rise along the feeder since the reverse active power flow from the secondary substations is not allowed to flow further upstream.

3.3. Zero Reverse Power at Xewkija DC

In the following simulations, the objective of the utility-scale BESS is to avoid reverse power flows into the 33 kV network (i.e., defining a minimum demand of 0 MW at the DC). The objective of the peak shaving algorithm was as defined in Section 3.2. Simulations were then performed for the centralized (Case 3) and both decentralized utility-scale BESSs (Cases 4 and 5) to verify the effect on the voltage profile at the distribution center and secondary substations.

3.3.1. Net Demand Characteristics

The hourly net-demand curves obtained from the simulations carried out for this day for both the central and decentralized BESSs are shown in Figure 12. One can observe that all three of the net-demand curves with storage follow the desired net-demand characteristic. In all three cases, there is no reverse power flow from 9.45 a.m. to 4.15 p.m. while the peak evening demand is limited to the defined power limit (morning peak of 1.82 MW) since the energy storage had sufficient energy to compensate down to this power level. The central BESS and both decentralized coordinated BESS strategies showed similar performance since all three methods stored 7.93 MWh and therefore resulted in no reverse power flow into the 33 kV network.

3.3.2. Xewkija DC Voltage Profile

The resulting voltage profiles at Xewkija DC are shown in Figure 13. The voltage profile in all five cases is regulated in the range of 11.1 kV ± 1.5% throughout the whole day. For the simulations of Case 1, 3, 4 and 5, the OLTC follows tap profile A and the taps of the transformer are at the maximum setting during midday (10 a.m. to 4.15 p.m.). This corresponds with the period when there is reverse power flow into the 33 kV network (secondary to the primary side). On the other hand, the OLTC follows tap profile B for the simulations of Case 2. Simulations for Cases 2–5 now all exhibit unidirectional power flow from the primary to the secondary side.

3.3.3. Substation Voltage Profiles

The resulting voltage profiles at each of the 21 substations are shown in Figure 14. The voltage profile in all cases ranges from 11 kV ± 5% throughout the whole day. The minimum system voltage of 0.9602 p.u. was observed in substation O at 7.45 p.m. (during the evening peak). This is expected since this substation is the furthest away from the DC. Analyzing the simulation results for the present net-demand profile, voltage rise can be observed in all substations during the period when there is reverse power flow (10 a.m. to 4.15 p.m.). Voltage rise was also observed in substations in which there were no PVs installed (e.g., substation N). The maximum voltage at each substation was observed at 1 p.m. with the maximum voltage of 1.032 p.u. occurring at substation P.
One can note that the centralized utility-scale BESS has little effect on the voltage profiles at the secondary substations. The centralized BESS resulted in a maximum reduction of 0.6% at substation P (from 1.032 p.u. down to 1.026 p.u.). In addition, the peak shaving functionality was also seen to be ineffective at improving the voltage magnitudes at the secondary substations. The central BESS is not able to compensate for the voltage rise/drops along the feeder since the active power flow from the secondary substations still affects the system voltage along the feeder sections from/up to the distribution center. On the other hand, the decentralized utility-scale BESS strategies were both effective in regulating the voltage at the secondary substations. The optimal sizing strategy results in a higher reduction in voltage magnitudes at each substation. With the optimal sizing strategy, the maximum voltage observed at 1 p.m. for substation P was reduced by a maximum of 2.7% at substation P (from 1.032 p.u. down to 1.005 p.u.) while with the equal sizing strategy this was reduced by 2.2% (from 1.032 p.u. down to 1.009 p.u.). The decentralized BESSs are deployed at the LV side of the secondary substations and effectively mitigate the voltage rise along the feeder. This clearly shows that deploying optimally sized storage closer to the generation provides the best option as the reverse active power flow from the secondary substations is not allowed to flow further upstream. In addition, the peak shaving functionality was also seen to be very effective at improving the voltage magnitudes at the secondary substations. In this case, both decentralized BESS sizing strategies obtained identical voltage profiles where the maximum increase in voltage magnitude was of 1.98% at 7.45 p.m.

4. Discussion

Voltage rise caused by high PV power generation is considered as the main problem that limits the penetration of PVs. This study has shown that voltage rise effects are already present in the Maltese network based on the current penetration of PVs. Reverse power flows were observed during 66% of the year which could lead to several problems (e.g., existing protection systems rendered ineffective) since the Maltese electricity grid was planned to support unidirectional power flow.
The effectiveness of the utility-scale central and decentralized BESSs in limiting the voltage rise was evaluated by implementing the modeling and simulations of a portion of the Gozitan 11 kV network. The maximum voltage at each substation was observed at 1 p.m. with the maximum voltage of 1.032 p.u. occurring at substation P. A minimum storage capacity of 3.4 MWh was determined for the centralized BESS based on the BUF sizing strategy. This resulted in 42.9% of the energy flowing back into the DC being absorbed while resulting in a maximum voltage magnitude reduction of only 0.39% at substation P. Increasing the size of the BESS to absorb 100% of the energy flowing back into the DC only resulted in a maximum voltage magnitude reduction of 0.6% at substation P. The centralized utility-scale BESS has little effect on the voltage profiles at the secondary substations.
Both coordinated decentralized BESSs strategies were seen to be the most effective in reducing the voltage rise effects in each of the substations. The coordinated operation of the decentralized BESSs implies that these are available to the distribution rather than being dedicated to a PV system. The “optimal sizing” strategy based on the BUF sizing resulted in 67% absorption of the energy flowing back into the DC. The maximum voltage observed at 1 p.m. for substation P was reduced by a maximum of 2%, while with the equal sizing strategy this was reduced by 1.3%. Increasing the size of the BESSs to absorb 100% of the energy flowing back into the DC, the maximum voltage observed at 1 p.m. for substation P was reduced by a maximum of 2.6%, while with the equal sizing strategy this was reduced by 2.3%. These results show that the utility-scale BESS are effective at the voltage level to which they are interconnected or higher, but not at the lower voltage levels.
Reverse power flow is a key factor that affects the OLTC voltage control in the MV distribution network. In fact, it was shown that the tap profiles A and B are at a maximum setting during certain hours of the day. As the OLTC is already at the maximum position, the voltage at the secondary of the DC transformer is expected to rise as the magnitude of the reverse power flow increases until the +5% limit is exceeded. However, simulations have shown that by deploying coordinated utility-scale BESS sized according to the PV generation potential, the voltage rise can be limited/controlled. Therefore, with BESSs the penetrations of PV generation can be increased even with the present distribution network infrastructure.
A limitation of this study is that the interconnection to the rest of the 11 kV network of Gozo was not considered. In addition, the interconnection to the Maltese mainland was also not considered with the voltage of the simulation models being the measured primary voltage at the Xewkija DC transformer. These interconnections could play an additional role in highlighting further restrictions on the penetrations of RES in the distribution network.

5. Conclusions

Voltage rise caused by high power generation from distributed PV sources is considered as the main problem that limits the increased penetration of PVs. This study has shown that with the current penetration of PVs in the Maltese network there are already considerable voltage rise effects. This study proposes a novel sizing strategy for utility-scale BESS, based only on technical considerations. The strategy makes use of historical electrical power data for both demand and PV generation for a section of the electrical network. Simulations were constrained to a section of the Gozitan 11 kV electrical distribution network. The simulations considered the impact of utility-scale storage on the current electrical network and the results showed that storage reduces the impact of PV systems on the grid infrastructure by avoiding reverse power flows. Simulations also showed how BESS can improve the local energy security by reducing the peak electricity demand. The central BESS and the decentralized coordinated BESS with “equal sizing” stored 3.4 MWh while the decentralized coordinated BESSs with “optimal sizing” stored 5.307 MWh. In all three cases, the evening peak demand was reduced by 30.5% from 2.62 MW down to a defined limit of 1.82 MW. Results also showed that decentralized coordinated BESS obtained better voltage rise control than the central BESS system at the high voltage side of the DC. Moreover, only decentralized BESS systems are capable of obtaining control of the lower voltage side which make them superior to central BESS systems.

Author Contributions

Conceptualization, A.M. and C.S.S.; methodology, A.M., C.S.S. and A.C.; software, A.M.; validation, C.S.S. and A.C.; formal analysis, A.M.; investigation, A.M., C.S.S. and A.C.; resources, A.C.; data curation, A.M.; writing—original draft preparation, A.M.; writing—review and editing, C.S.S. and A.C.; visualisation, A.M.; project administration, A.M. and C.S.S. All authors have read and agreed to the published version of the manuscript.

Funding

This research was financed by the Energy and Water Agency under the National Strategy for Research and Innovation in Energy and Water (2021–2030), grant agreement reference number ESTELLE EWA 110/20/2/001-C.

Institutional Review Board Statement

Not applicable.

Informed Consent Statement

Not applicable.

Data Availability Statement

The original data used for the simulations are not publicly available.

Acknowledgments

The authors would like to acknowledge Enemalta for readily providing the data required to conduct this study.

Conflicts of Interest

The authors declare no conflict of interest. The funders had no role in the design of the study; in the collection, analyses, or interpretation of data; in the writing of the manuscript, or in the decision to publish the results.

References

  1. Eurostat, Share of Renewable Energy in Gross Final Energy Consumption by Sector. 2020. Available online: https://ec.europa.eu/eurostat/databrowser/product/view/NRG_IND_REN (accessed on 20 February 2022).
  2. Energy & Water Agency. National Strategy for Research and Innovation in Energy and Water (2021–2030); Energy & Water Agency: Qormi, Malta, 2020. [Google Scholar]
  3. Micallef, A.; Spiteri-Staines, C. Voltage rise mitigation and low voltage ride through capabilities for grid-connected low voltage microgrids. In Proceedings of the 19th European Conference on Power Electronics and Applications (EPE’17), Warsaw, Poland, 11–14 September 2017. [Google Scholar]
  4. European Commission; Directorate-General for Energy; Andrey, C.; Barberi, P.; Nuffel, L.; Gérard, F.; Gorenstein Dedecca, J.; Rademaekers, K.; El Idrissi, Y.; Crenes, M.; et al. Study on Energy Storage: Contribution to the Security of the Electricity Supply in Europe. Publications Office. 2020. Available online: https://data.europa.eu/doi/10.2833/077257 (accessed on 20 January 2022).
  5. Khezri, R.; Mahmoudi, A.; Aki, H. Optimal planning of solar photovoltaic and battery storage systems for grid-connected residential sector: Review, challenges and new perspectives. Renew. Sustain. Energy Rev. 2022, 153, 111763. [Google Scholar] [CrossRef]
  6. Castillo, A.; Gayme, D.F. Grid-scale energy storage applications in renewable energy integration: A survey. Energy Convers. Manag. 2014, 87, 885–894. [Google Scholar] [CrossRef]
  7. Mohamad, F.; Teh, J.; Lai, C.-M.; Chen, L.-R. Development of Energy Storage Systems for Power Network Reliability: A Review. Energies 2018, 11, 2278. [Google Scholar] [CrossRef] [Green Version]
  8. Killer, M.; Farrokhseresht, M.; Paterakis, N.G. Implementation of large-scale Li-ion battery energy storage systems within the EMEA region. Appl. Energy 2020, 260, 114166. [Google Scholar] [CrossRef]
  9. Saboori, H.; Hemmati, R.; Abbasi, V. Multistage distribution network expansion planning considering the emerging energy storage systems. Energy Convers. Manag. 2015, 105, 938–945. [Google Scholar] [CrossRef]
  10. Danish, S.M.S.; Ahmadi, M.; Danish, M.S.S.; Mandal, P.; Yona, A.; Senjyu, T. A coherent strategy for peak load shaving using energy storage systems. J. Energy Storage 2020, 32, 101823. [Google Scholar] [CrossRef]
  11. Lange, C.; Rueß, A.; Nuß, A.; Öchsner, R.; März, M. Dimensioning battery energy storage systems for peak shaving based on a real-time control algorithm. Appl. Energy 2020, 280, 115993. [Google Scholar] [CrossRef]
  12. Kichou, S.; Markvart, T.; Wolf, P.; Silvestre, S.; Chouder, A. A simple and effective methodology for sizing electrical energy storage (EES) systems based on energy balance. J. Energy Storage 2022, 49, 104085. [Google Scholar] [CrossRef]
  13. Conlon, T.; Waite, M.; Modi, V. Assessing new transmission and energy storage in achieving increasing renewable generation targets in regional grid. Appl. Energy 2019, 250, 1085–1098. [Google Scholar] [CrossRef]
  14. Park, H. A Stochastic Planning Model for Battery Energy Storage Systems Coupled with Utility-Scale Solar Photovoltaics. Energies 2021, 14, 1244. [Google Scholar] [CrossRef]
  15. Yao, M.; Cai, X. Energy Storage Sizing Optimization for Large-Scale PV Power Plant. IEEE Access 2021, 9, 75599–75607. [Google Scholar] [CrossRef]
  16. Wei, W.; Wang, Y.; Dai, S.; Chen, C.; Chen, L. Energy Storage Economic Optimization Scheduling Method for Multi-Scene Demand of Peak and Frequency Modulation. Energies 2021, 14, 8605. [Google Scholar] [CrossRef]
  17. Hong, Z.; Wei, Z.; Li, J.; Han, X. A novel capacity demand analysis method of energy storage system for peak shaving based on data-driven. J. Energy Storage 2021, 39, 102617. [Google Scholar] [CrossRef]
  18. Alamri, A.; Alowaifeer, M.; Meliopoulos, A.P.S. Energy Storage Sizing and Probabilistic Reliability Assessment for Power Systems Based on Composite Demand. IEEE Trans. Power Syst. 2022, 37, 106–117. [Google Scholar] [CrossRef]
  19. Regional, Geospatial, Energy and Transport Statistics Unit, Electricity Supply: 2016–2020; News Release 181/2021; National Statistics Office: New Castle, PA, USA, 2021.
  20. Enemalta Corporation. The Network Code. Malta. 2013. Available online: https://www.enemalta.com.mt/wp-content/uploads/2018/05/Network-Code-EMC-Approved-October-2013-1.pdf (accessed on 5 October 2021).
  21. Staffell, I.; Pfenninger, S. The increasing impact of weather on electricity supply and demand. Energy 2018, 145, 65–78. [Google Scholar] [CrossRef]
  22. Eurostat, Cooling and Heating Degree Days by Country—Monthly Data. Available online: http://appsso.eurostat.ec.europa.eu/nui/show.do?dataset=nrg_chdd_m (accessed on 18 November 2021).
Figure 1. Daily net-demand curve for the period June 2020 to May 2021.
Energies 15 02724 g001
Figure 2. The hourly demand, net demand and PV generation curves for 14 April 2021.
Energies 15 02724 g002
Figure 3. Line diagram of the considered feeder section including the installed PV capacity at each secondary substation.
Energies 15 02724 g003
Figure 4. (a) Xewkija DC 33/11 kV Delta/Star Transformer with taps on the primary winding; (b) voltage regulation by the OLTC at Xewkija DC with an AVR.
Energies 15 02724 g004
Figure 5. Measured voltage profile at the 33 kV side of the Xewkija DC transformer.
Energies 15 02724 g005
Figure 6. Battery utilization factor for different sizes of BESSs.
Energies 15 02724 g006
Figure 7. The measured total net-demand profile vs. simulated net-demand for the considered feeder section at Xewkija DC.
Energies 15 02724 g007
Figure 8. Estimated tap positions for the total net-demand of the OLTC at Xewkija DC.
Energies 15 02724 g008
Figure 9. Net-demand profile at Xewkija DC with and without storage sized as determined by the BUF defined in Section 2.3.
Energies 15 02724 g009
Figure 10. (a) Simulated voltage profiles at the 11 kV side of the Xewkija DC transformer. (b) Tap positions for simulations. Profile B is for the Case 2 (Demand) while Profile A was common to the other four scenarios.
Energies 15 02724 g010
Figure 11. Simulated voltage profiles at the 11 kV side of the Xewkija DC transformer for all five case scenarios.
Energies 15 02724 g011
Figure 12. Net-demand profile at Xewkija DC with and without storage.
Energies 15 02724 g012
Figure 13. (a) Simulated voltage profiles at the 11 kV side of the Xewkija DC transformer. (b) Tap positions for simulations. Profile B is for the Case 2 (Demand) while Profile A was common to the other four scenarios.
Energies 15 02724 g013
Figure 14. Simulated voltage profiles at the 11 kV side of the Xewkija DC transformer for all five case scenarios.
Energies 15 02724 g014
Table 1. Optimal sizing of decentralized utility-scale BESS using the BUF.
SubstationBESS (MWh)
A1.800
B0.030
C0
D0
E0.040
F0.005
G0
H0
I0.100
J0.060
K0.100
L0.002
M1.400
N0
O0
P0.110
Q0.100
R1.500
S0.010
T0.010
U0.040
Publisher’s Note: MDPI stays neutral with regard to jurisdictional claims in published maps and institutional affiliations.

