Abstract
Two of the most commonly used solid biomass sources for fuel are wood chips and wood pellets. The calorific value and the moisture content of those biofuels determine the efficiency of the CHP and the biorefinery plants. Therefore, with the increased shift towards a biobased economy, the biomass cost and its physical properties must be precisely determined. Most of the current standards are lacking and provide neither enough details about the issues caused by the biomass heterogeneity nor with the variation in experimental practice. Phenomena such as data scattering, poor repeatability and wide uncertainty, are mostly observed during the measurements of the calorific value and the moisture content. To overcome such issues, an interlaboratory comparison between three national metrology institutes using bomb calorimetry has taken place. The comparison helped to identify the root causes behind the poor reproducibility of the wood samples. Factors such as the equilibrium moisture content of the biomass, the pellet mass, the applied pressure to form the pellet, the handling techniques and the determination errors are highlighted and analyzed. The final results paved the way to provide an enhanced detailed experimental practice where the repeatability and reproducibility have been strongly improved. Moreover, the detailed uncertainty sources and calculations are presented. It has been found that by fulfilling the recommended approach the measurement repeatability improved by up to 50–80%, while the final uncertainty improved by 10–30%. This enhancement leads to a maximum relative expanded uncertainty of around ±1% (coverage factor of k = 2 and a confidence level of 95%).
1. Introduction
The release of greenhouse gas emissions represents a major world threat as it causes the rise of the earth’s temperature. This is mainly due to the excessive utilization of fossil fuels as it releases CO2 into the atmosphere when combusted. Here biomass plays an important role as an energy alternative by providing relatively green energy compared to fossil fuels. Moreover, it is becoming one of the most important commercial products for heating supply [1]. Therefore, their quality has become an object of increased interest. All the different stages of wood chip and wood pellet production are crucial for efficient combustion, e.g., tree felling, storage, transport, pretreatment and sample preparation [2,3].
With the high demand for biomass utilization, strict quality control criteria must be provided to guarantee accurate characterization of the physical properties of the biomass feedstock. In particular, the calorific value and the moisture content are the most important factors for the selection of biomass material for usage [4]. The calorific value is also considered one of the main properties responsible for evaluating the efficiency of thermal processes such as in CHP plants and biorefinery. The thermal efficiency is defined as how much of the fuel is converted into the desired energy services. Moreover, it defines both the economical and the environmental terms of any particular process [5]. Therefore, if the calorific value of the biomass is not measured precisely within a small margin of error, there is a risk of making false decisions by perceiving a process as more favorable over another. Furthermore, the biomass is being purchased based on its dry calorific value [6]. If this value is inaccurately measured, financial loss maybe experienced. This loss would eventually impact the biomass provider or the end-user. The wider the scattering between the measurements, the more the probability of a financial loss and vice versa.
To resolve the issue of the inconsistency between the measurements, three metrological institutes from three different European countries have cooperated to specify the best measurement strategy. These institutes are Physikalisch-Technische Bundesanstalt (PTB) from Germany, National Metrology Institute from Turkey (TUBITAK UME) and Biroul Roman de Metrologie (BRML) from Romania. The partners have agreed on performing an interlaboratory comparison on a metrological level to measure the calorific value by calorimetric techniques. The word calorimetry refers to the measurement of heat quantities and it is used to determine the heat of a reaction through experiments. Calorimetric techniques are commonly used in industrial and academic laboratories. Typically, isoperibol bomb calorimetry is the most dominant approach and it has been used for around a century [7]. The measurements of the calorific value of biofuels via bomb calorimeter tends to show poor results in inter-comparisons between different laboratories. Furthermore, the uncertainty of the calorific value measurements in the industry varies between 2–5%. This high value can affect the calculations of plants thermal efficiencies and the biomass cost. It deserves to be mentioned that the uncertainty range was determined after an online survey that was performed within the scope of this study. The survey received answers from 66 participants including biofuel producers, power plants and research facilities [8].
There are several standards for the determination of the calorific value of biofuels, i.e., ISO 18125:2017, ASTM D240-19 and DIN 51900-2. However, the available standards do not provide enough information regarding each aspect of the experiment. In addition, the standards are general and neither take into consideration the different nature of different biomass materials nor the mistakes that can occur by different operators and handling techniques. Therefore, to improve the measurements and minimize the uncertainty, the challenges that are associated with the material nature, the experimental practice and the limitations of the standards must be overcome.
Wood chips and wood pellets are the most common type of biomass used as solid raw fuels [9]. Therefore, this study focuses on both of these materials. Sample criteria such as the optimum sieve size, sample mass, the applied pellet pressure to form the test pellets and equilibrium moisture content are studied to provide an improved technical practice. The aim of providing such practice is to improve the repeatability and reproducibility of the measurements. Repeatability (or retest reliability) is commonly used to describe the deviation between successive measurements of the same sample under the same conditions. These conditions are, e.g., same operator, institute, room condition, instrument and technical procedure within a short period of time [10,11].Reproducibility is another component of the precision of the measurements. It refers to the ability to obtain the same results but performed under completely different conditions including the location and the operator [12,13]. The main objective is to improve the repeatability which will decrease the margin of error between each measurement, while minimizing the reproducibility difference between the institutes. The reproducibility difference refers to the maximum value in any given set of results of a comparison minus the minimum value from the same comparison. Minimizing the reproducibility will eventually help provide an accurate estimation of biomass cost since the possibility of scattering would be reduced.
Moreover, a detailed uncertainty is computed by defining all the uncertainty sources that influence the calorific value. The final overarching objective of this paper is to support the energy transition into a neutral CO2 energy alternative where the biobased economy has a crucial role to secure the future of energy supply.
2. Materials and Methods
To achieve the objective of this study, the partners agreed to perform two different test cycles. The two cycles were used to evaluate and compare the obtained repeatability and reproducibility between the different institutes. In cycle 1, the samples were measured based on ISO 18125:2017 [14]. Some aspects of the experiment did not have a specific value in the standard, e.g., the crucible weight, the exact oxygen pressure and the uncertainty sources. For these, each institute followed their own practice and handling procedures. After evaluating the results of cycle 1, an improved protocol was followed to improve the measurements. Cycle 2 was performed with the new experimental protocol.
2.1. Materials
The two cycles were performed with the same samples that are made of three different types of woody biomass. The three samples were wood chips of high quality (WC-HQ), wood chips of industrial quality (WC-IQ) and wood pellets (WP). These samples were provided by the project coordinator from the Danish Technological Institute (DTI) in Denmark. The samples were treated to lower the moisture content to around 15%. The samples were delivered to the institutes in air-tight bags with each package containing around 1 kg of the sample.
2.2. Sample Prepration
The samples had a diameter of around 50 mm which is not suitable for combustion in a bomb calorimeter [15]. Sample preparation in each institute took place according to the ISO 14780 for solid biofuels with the aim of reducing the mass of the original batch into a homogeneous smaller sample portion [16]. The original composition should be maintained during any stage of the sample preparation [16]. Firstly, sample grinding was needed to reduce the sieve size. A sieve size of 1 mm was used since it is suitable for combusting most of the wood samples and commonly used by the different operators. Secondly, sample division took place by dividing the ground sample into different batches to create out one representative and homogenized portion. It should be noted that after grinding and selecting a sample portion, the moisture content of that portion would no longer represent the moisture of the original batch before grinding. In the case of cycle 2, TUBITAK UME followed once again the ISO 14780 to grind 500 g from the original batches of the samples to 1 mm by using Fritsch Pulverisettle 19 (2800–3400 rpm). These new produced samples by TUBITAK were shipped to each institute to be measured.
2.3. Experimental Setup and Methodology
In both cycles, after the test portion was produced, the samples were analyzed on a wet basis, i.e., as per determined basis. A total of 8 to 10 measurements were performed for each sample by every institute. All the institutes followed the ISO 18134:03 for the determination of the moisture content of biofuels by the oven dry method [17]. It states that the moisture of the sample should be measured a minimum of two times using a sample mass not less than 1 g. The sample can be left in the oven at 105 °C for up to 3 h and the test would end when the sample mass becomes stable. It is important to highlight that when leaving the sample too long under these conditions, additional release of oils and volatile elements might occur. The measured moisture value is later used to calculate the calorific value on a dry basis.
Both cycles of the measurements were performed with the different institutes’ respective isoperibol bomb calorimeters to determine the calorific value (see Table 1). The experimental procedure is the same as long as an isoperibol bomb calorimeter is used. In such a procedure, the calorimeter needs to be calibrated to determine the heat capacity of the system. The heat capacity refers to the amount of heat needed to raise the temperature of the calorimeters’ components by 1 °C measured in J/°C [18]. All the operational parameters are kept fixed during the calibration and the actual determination of the calorific value of the samples, to avoid recalibrating the system. The calorimeter is typically calibrated using a mass of a reference material such as benzoic acid which is traced to the SI system. When combusted, the mass of the benzoic acid should cause a temperature rise equivalent to that which is expected by the sample mass in (g). The calorimetric experiment involves charging a known mass of the sample in a closed vessel called the bomb. The bomb is filled with oxygen at around 30 bar [19]. The charged bomb is placed inside a bucket of water where a thermometer records the temperature. The bucket with the bomb inside (the system) is surrounded by water tubes that have a fixed temperature, which is commonly called the jacket. The jacket guarantees a fixed heat transfer between the system and the surrounding. When the combustion begins, the water temperature increases due to heat transfer from the bomb to the water. The temperature rise is recorded. After combustion the bomb is rinsed with distilled water to collect the liquid which resulted from the combustion. This liquid is then diluted and analyzed for nitrate and sulphate anions depending on the method used.

Table 1.
Different instruments used in each laboratory for the calorific value determination.
The nitrate and sulphate anions refer to the presence of their respective acids, HNO3 and H2SO4 in the liquid. These acids influence the final calorific value by adding energy into the system, therefore the calorific value needs to be corrected after combustion. Determining these acids to correct the calorific value are called the thermochemical correction [20]. This can be done by titration or ion chromatography depending on the available instrument in each laboratory as shown in Table 1.
2.4. Calorific Value Calculations
Equation (1) shows the calculation of the heat capacity of the calorimeter as given in the ISO 18125:2017 [14]. This is used to calibrate the system by using benzoic acid with a known heat of combustion. When it combusts, the temperature rise is recorded, and the contribution caused by the fuse, cotton thread and the formation of nitric acid is calculated as given in ISO 18125:2017 [14].
where is the heat capacity of the system, mba is the mass (in g) of benzoic acid, qV,ba is the certified gross calorific value (in J/g) for the benzoic acid, is the temperature rise in K or any arbitrary unit. Qfuse is the contribution from the fuse combustion, Qz is the contribution from the ignition aid and QN is the contribution from the formation of nitric acid (all in unit J).
The determination of the calorific value on a wet basis is according to the Regnault Pfaundler method as shown in Equation (2) [14]. A fuel sample is weighed and combusted in the calorimeter. Similar to Equation (1), after combustion, the temperature rise is recorded and the corrections are performed to eventually calculate the calorific value of the fuel.
where Hw is the gross calorific value of the fuel on a wet basis in J/g, m1 is the sample mass in g and Qs is the contribution from the formation of sulfuric acid in J.
From the obtained calorific value on a wet basis, the value on a dry basis can be calculated as shown in the following equation:
where Hd is the gross calorific value on a dry basis and M is the moisture content in percentage. According to Equation (3), the moisture content of the sample needs to be measured. Therefore, the sample moisture was determined as described above. The reason behind this is to avoid any moisture variation in the samples because of the continuous change in the environmental conditions [21].
3. Results and Discussion
This chapter will cover the results of the cycle 1 samples, followed by a root cause analysis of any source of error and is concluded by a further investigation into improved technical criteria. A similar structure is followed in cycle 2.
3.1. Results of Cycle 1
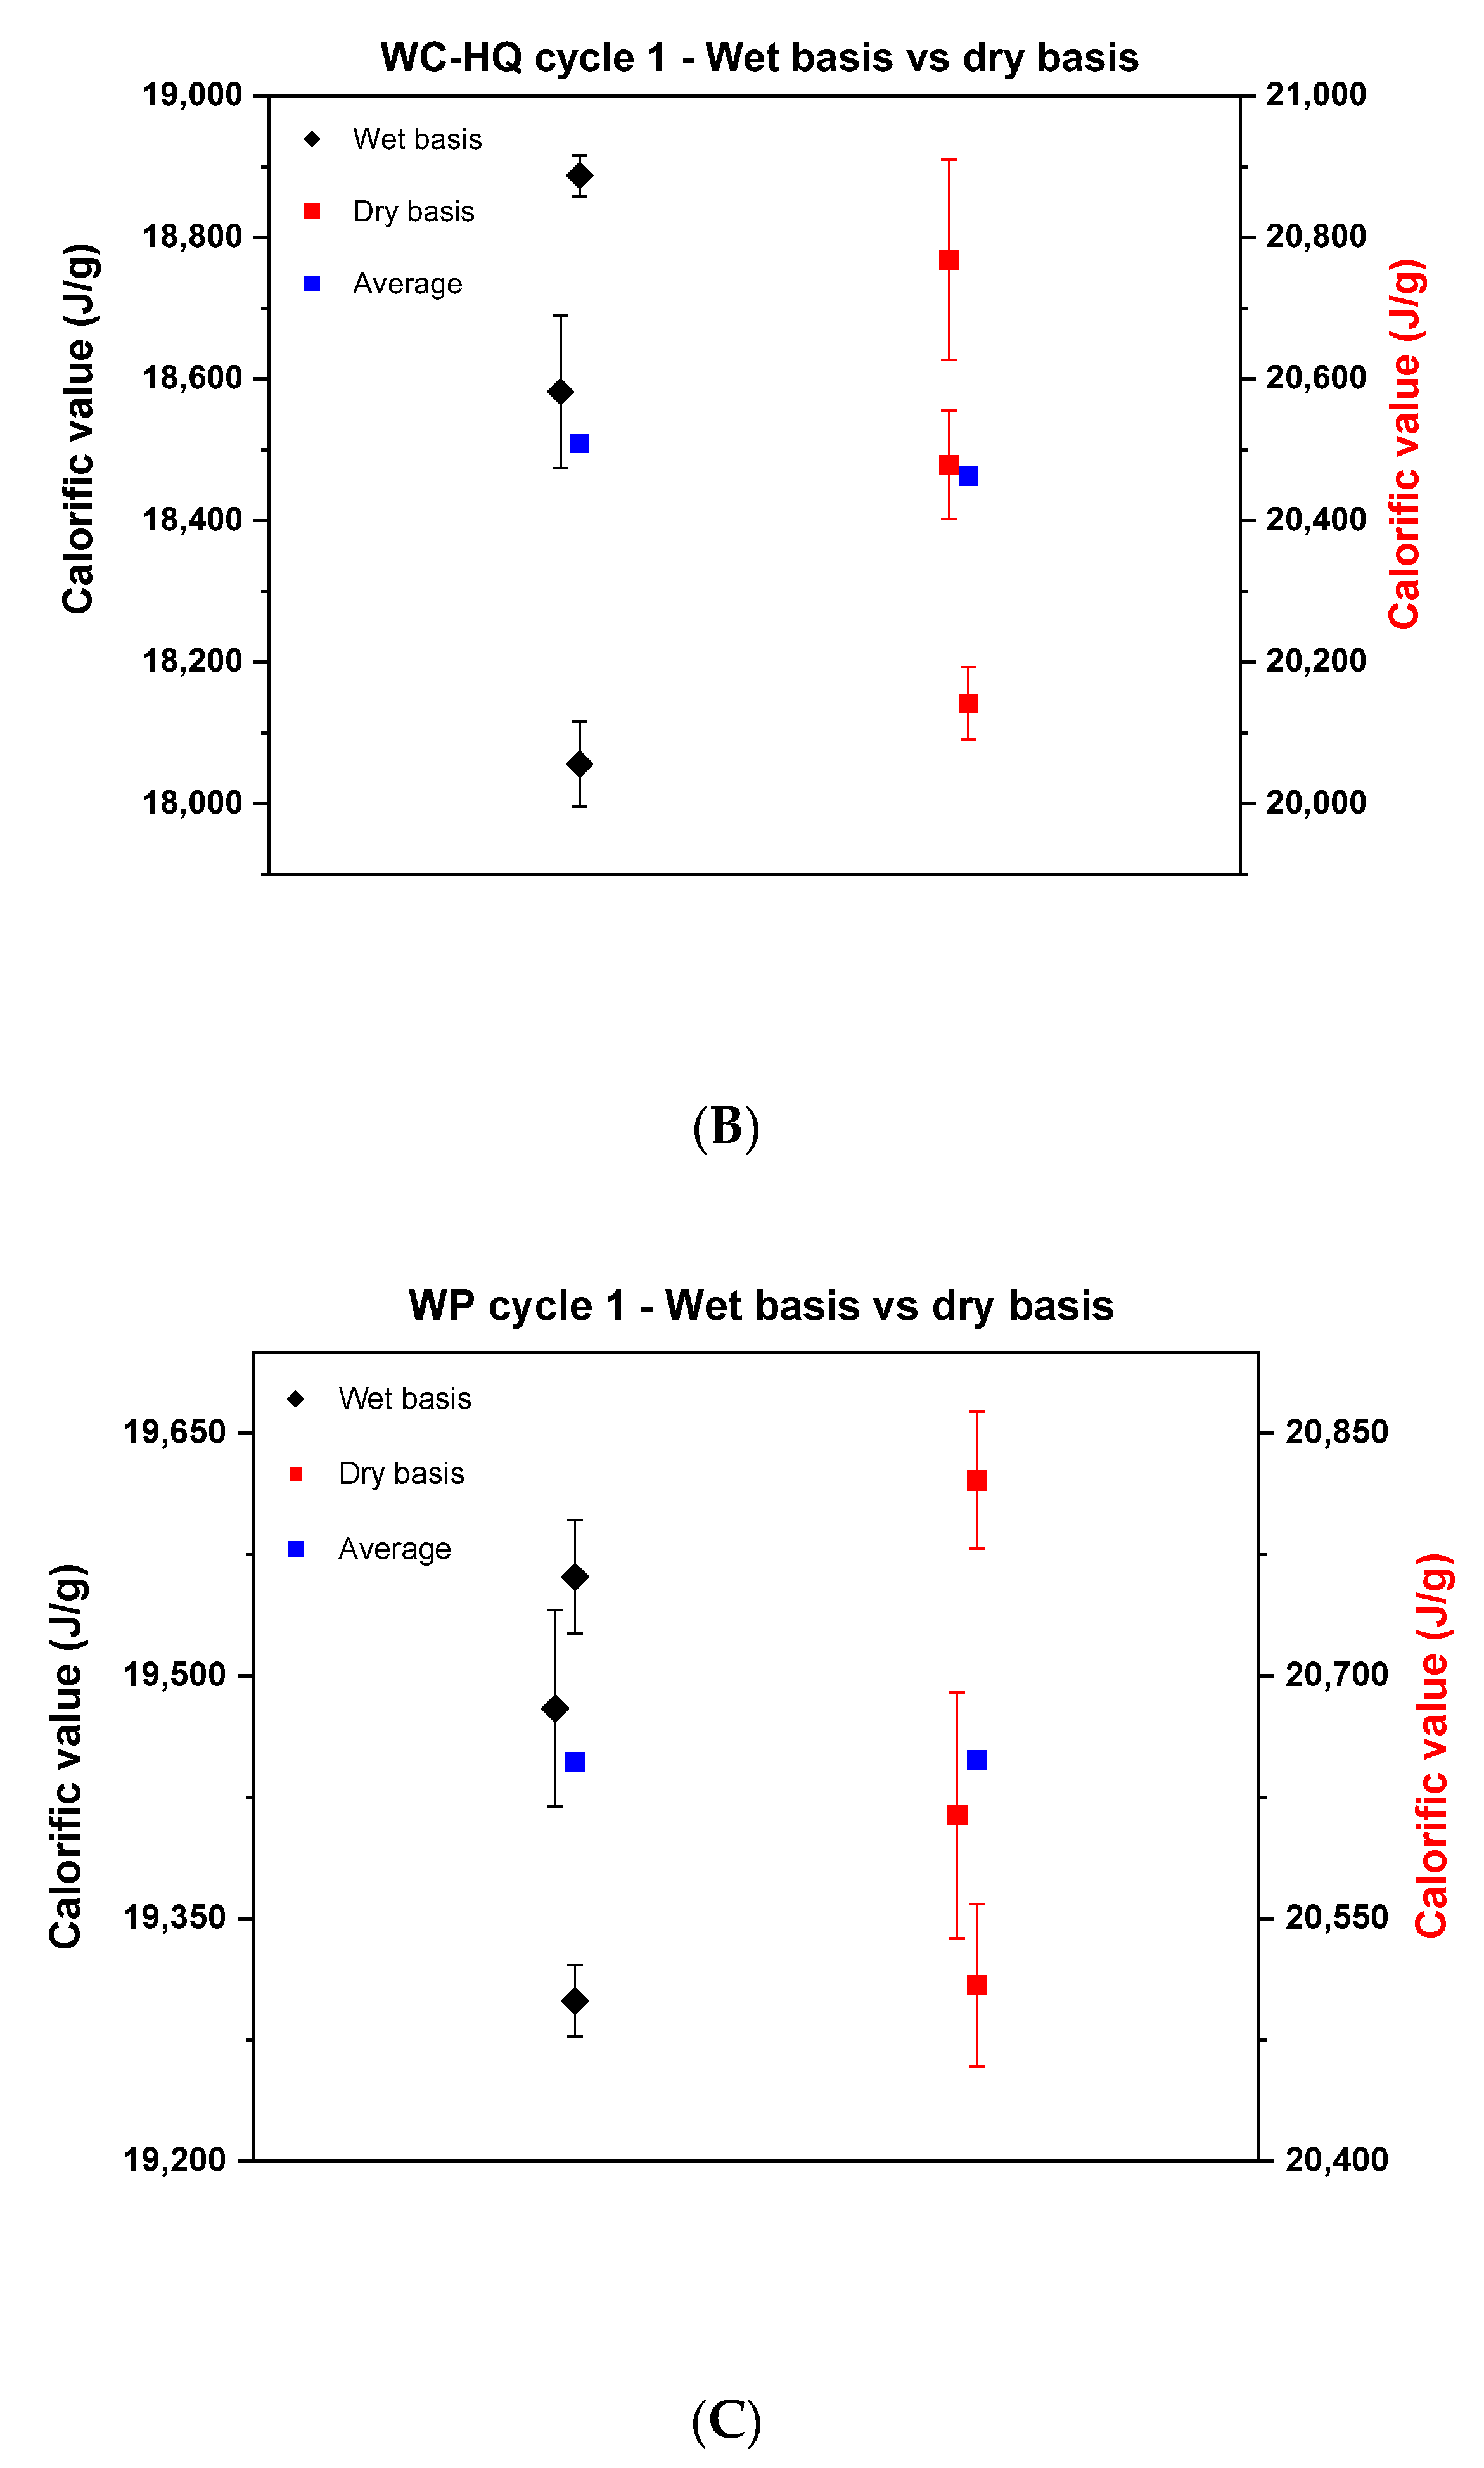
In the first cycle, samples of wood chips of high quality, industrial quality and wood pellets were tested on a wet basis and analyzed in the respective bomb calorimeters according to the ISO 18125:2017. After determining the calorific value on a wet basis, the values were recalculated after correcting for the moisture content of each sample. The result of the comparison can be seen in Figure 1.
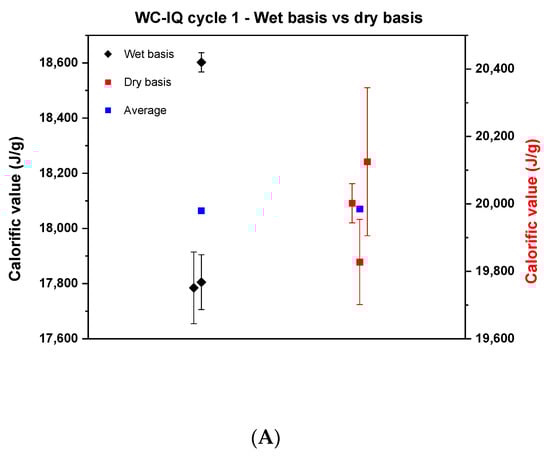
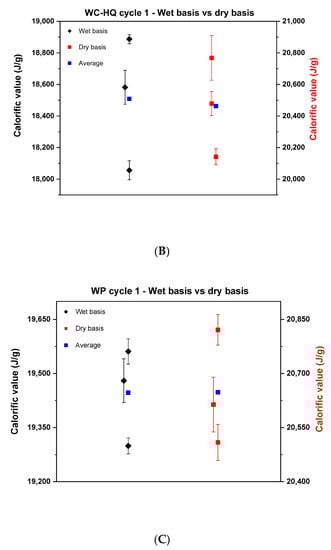
Figure 1.
Comparison of the calorific values between the wet basis and dry basis in cycle 1. (A) describes the wood chips—industrial quality, (B) the wood chips—high quality, (C) the wood pellets.
Each point in Figure 1 represents the average of the results of each institute. Wide scattering is visible in all samples where the reproducibility difference on a wet basis was 800, 800 and 300 J for wood chips of industrial quality, wood chips of high quality and wood pellets, respectively. Based on the literature, it is known that wood chips are heterogeneous and with that it is difficult to reproduce results in the laboratory [22]. The significant difference concerning the reproducibility between the wood chips and the wood pellets may come from the fact that the wood pellets are produced in a compacted pellet form and mixed with oils or starch to provide the sample with moisture stability [23]. Therefore, it barely reacts to any change that happens in the surrounding environment. That being said, the probability of reproducing the results for wood pellets is high. By comparing the dry basis side by side with the wet basis, it can be concluded that the results of the wood chips improved, and the reproducibility difference decreased. Yet, the values still deviate by around 300, 600 and 312 J for WC-IQ, WC-HQ and WP, respectively. According to the ISO standard, the maximum allowable limit of the reproducibility difference for wood chips and wood pellets is 400 J and 300 J, respectively. From this point of view, WC-HQ and WP would have been rejected for exceeding the ISO limit. To scientifically analyze the reasons for these discrepancies, a detailed root cause analysis took place to map all possible sources of error or deviation in the measurements.
3.2. General Root Cause Analysis—Cycle 1
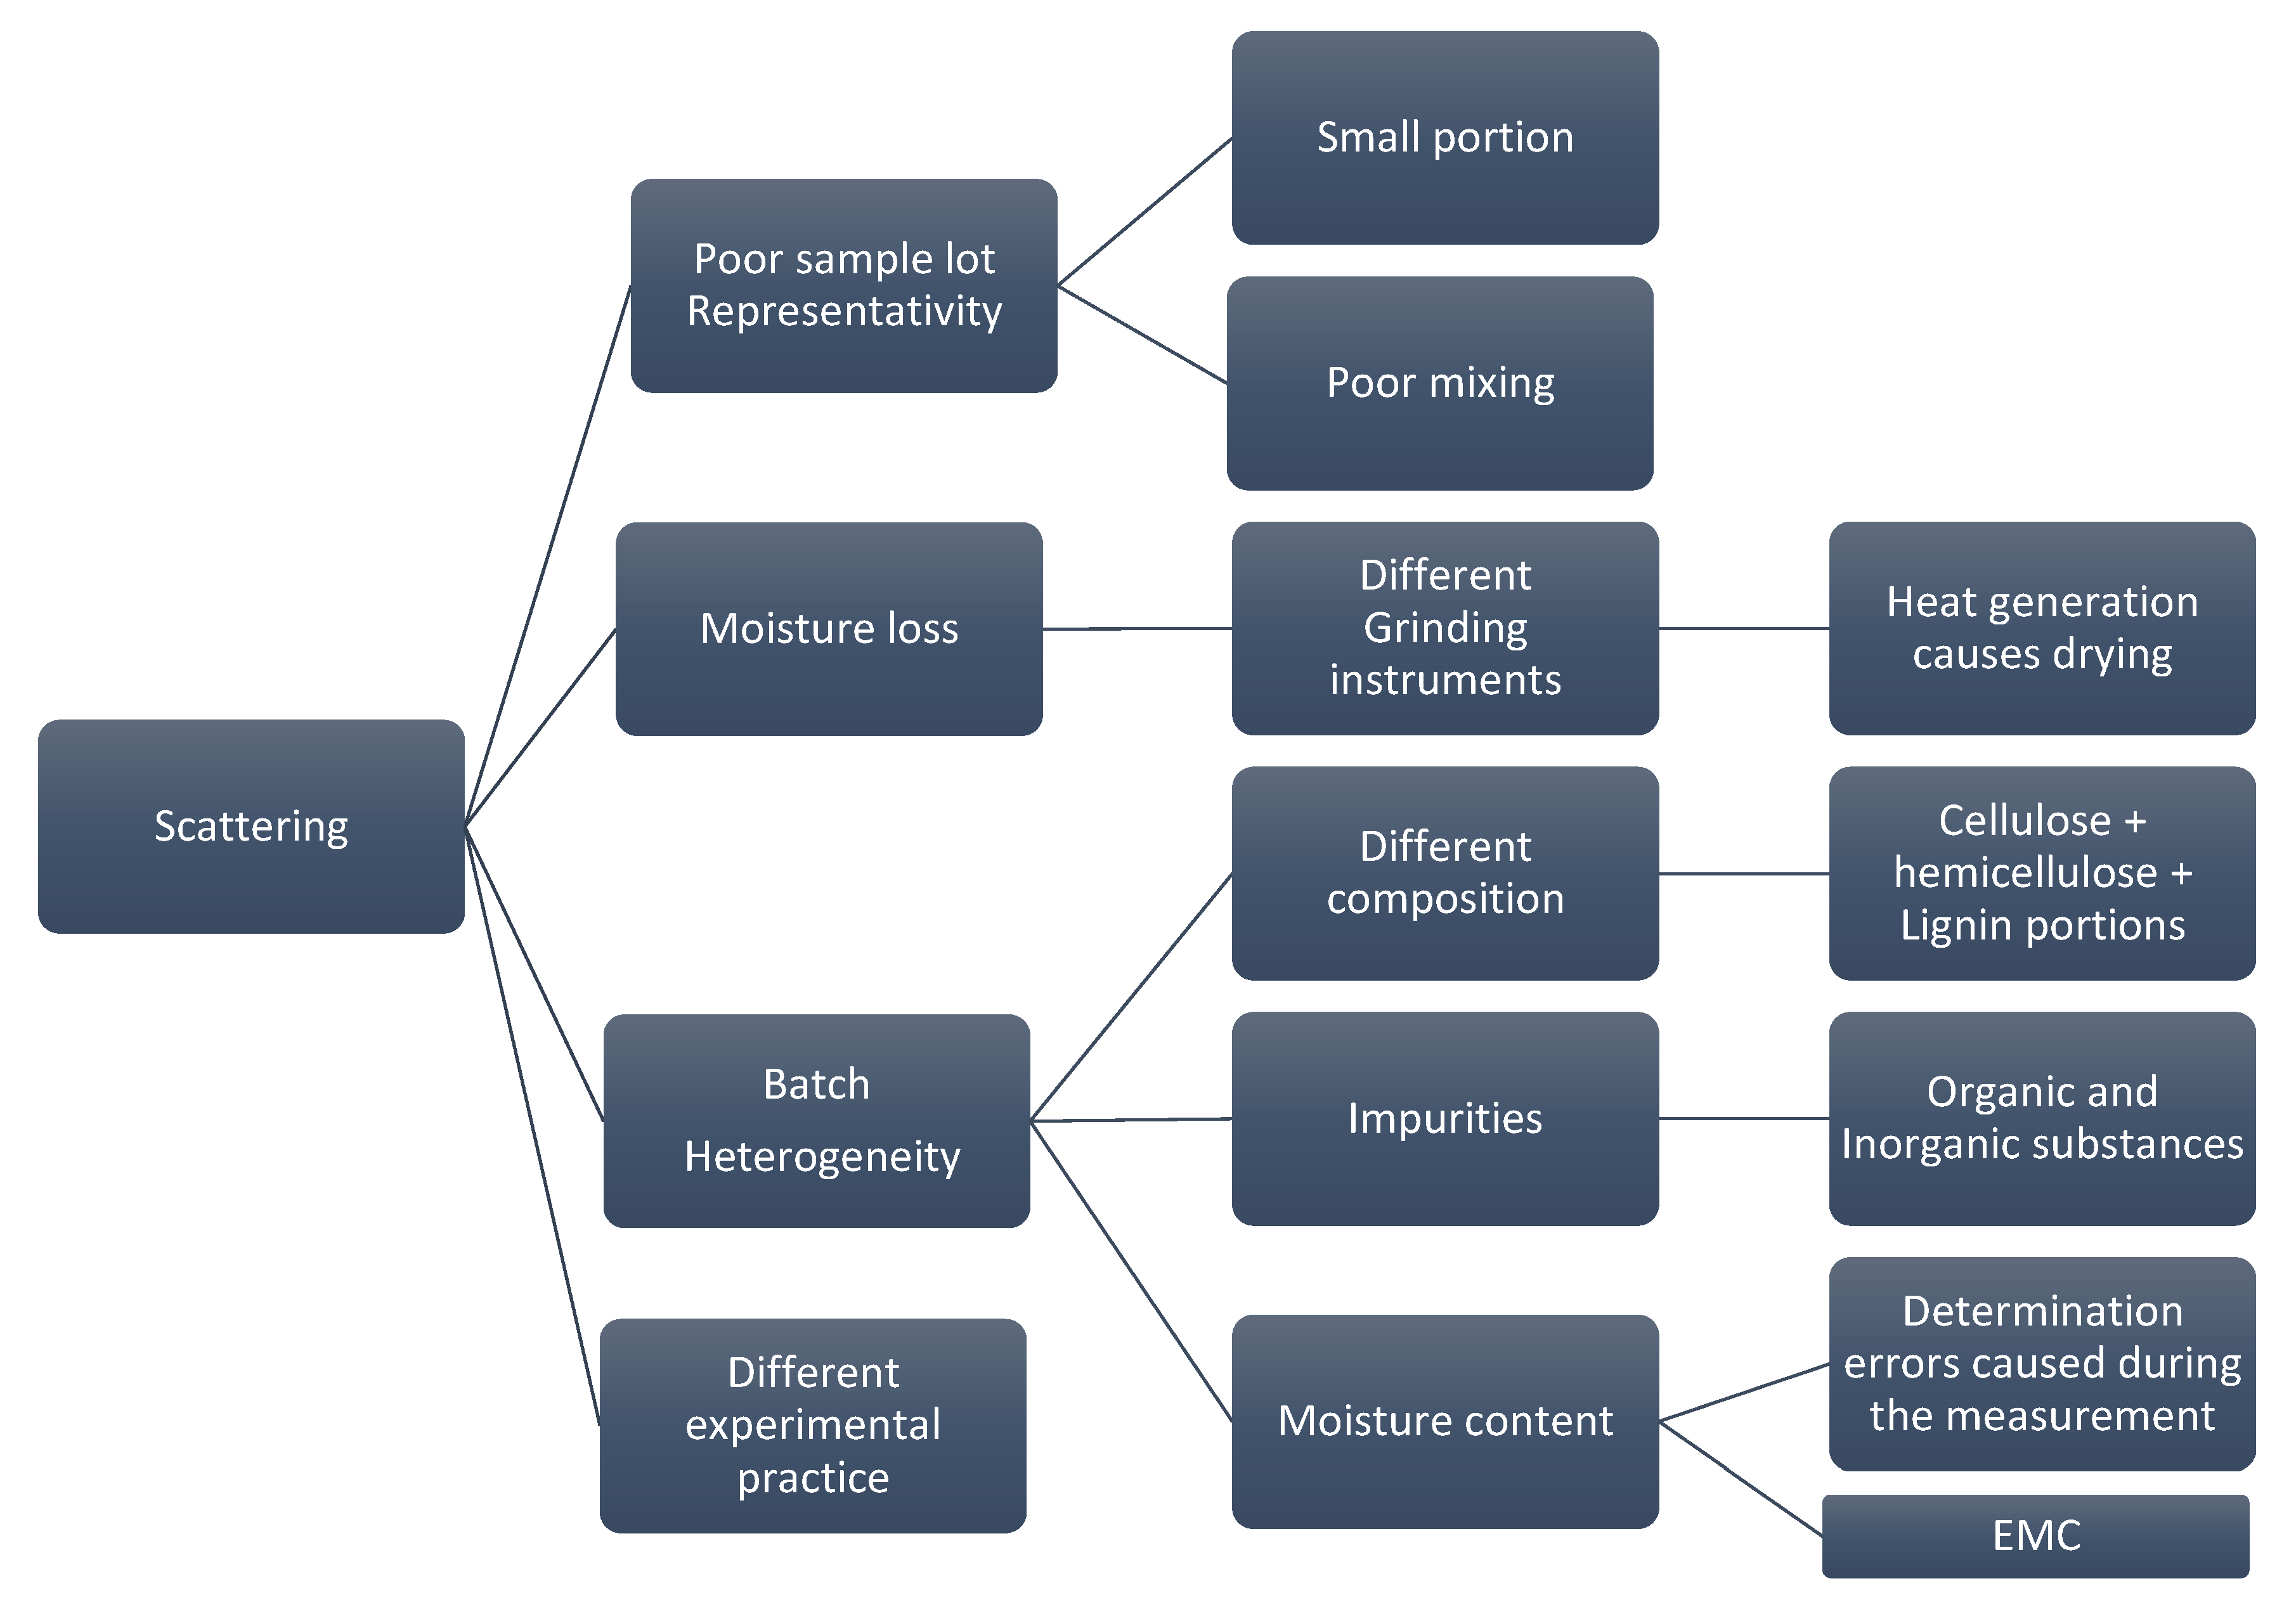
Figure 2 depicts the root cause analysis of cycle 1 where it highlights the factors that cause deviations in the measurements. Each of these factors is later investigated to provide recommendations to limit the influence of each factor on the final calorific value.
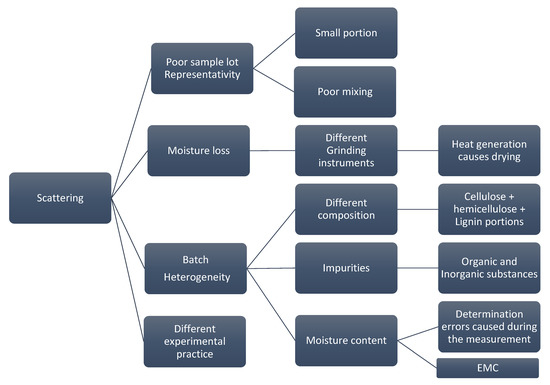
Figure 2.
Root cause analysis of possible reasons behind the data scattering.
There are many reasons for the data scattering starting from the poor representativity of the sample lot due to poor mixing or selecting a small portion out of a larger batch. Moreover, factors such as moisture loss caused by using different grinding instruments, batch natural heterogeneity and the executed experimental practice play an important role in causing data scattering. To improve the quality of the results, studying the contribution of each factor on the calorific value and learning how to avoid it is crucial. Hence, any improvement in the experiment will eventually be reflected in the repeatability and the reproducibility. According to the BIOFMET survey, sample heterogeneity and the moisture variation have the largest impact on the accuracy of the results [8]. Therefore, to improve the results, several factors from the root analysis need to be neutralized such that quantifying each source individually becomes possible. This can be achieved by uniting the experimental practice and by testing one unified sample under specific conditions. For cycle 2, TUBITAK UME provided well ground, mixed and homogenized samples (see Section 2.2). These samples were shipped to the other institutes and were then tested. With that, possible deviations caused by any inconsistency in sample lots were eliminated. Moreover, these new samples avoid any deviation caused by using different grinding instruments since the moisture loss can vary in case of different instruments [24]. That leaves two possibilities for deviation that might influence the results in the new samples, they are batch heterogeneity or different experimental practice. Quantifying two sources at the same time is difficult due to possible interference. Therefore, the experimental practice was discussed with the partners. Several variations were observed in the handling procedure, even though the partners hae used the same ISO standard. These variations were due to the fact that the standard is general and does not provide detailed criteria for each aspect of the experiment. Different biofuels need different approaches to provide the best repeatability and reproducibility. Therefore, a modified practice is proposed to minimize any deviation that might occur by using different sample mass, applied pressure for pelletizing the samples and handling procedures.
3.3. Investigation for Improved Technical Criteria—Cycle 1
The root cause analysis paved the way to further analyze the experimental practice and the technical parameters to drive optimized criteria which then were tested and verified in cycle 2.
3.3.1. Pellet Mass
The ISO standard recommends a sample mass of 0.8–1.2 g, where it has been found that with such masses, it is difficult to ensure complete combustion. In this study, PTB and TUBITAK could not obtain complete combustion for the chosen solid biofuels when following the recommendations from the ISO standard. Therefore, a different set of masses were tested to determine the best mass range for the wood chips and the wood pellets.
The experiments showed that a mass of 0.3 to 0.7 g was suitable to achieve complete combustion at each institute. Furthermore, by standardizing the mass used for combustion at each institute, it guaranteed that the ash formation at the end of the experiment was relatively similar. This range of masses was only suitable when using a well-mixed, homogenized woody biomass which was hard to burn, and no complete combustion with larger masses could be achieved. Generally, a larger mass of the sample would be better for combustion to avoid error in the measurements.
The new recommended range of mass takes into consideration the different calorimetric bomb designs and crucible material type and thickness. The most common crucibles in the market vary in weight from 10 to 14 g and are made of fused silica or stainless steel. With such a heavy crucible the heat transfer to the sample was slower and the sample did not burn fully. While in the case of testing in a crucible made of platinum that weighed 5 g, parts of the sample heated up so rapidly that it was unable to cope with such a sudden temperature rise. Eventually the sample exploded or produced soot as parts would break down and not burn. Yet, it was not the only cause behind the incomplete combustion in the case of using 1 g of the sample, e.g., the applied pellet pressure played an important role in assuring complete combustion. Furthermore, it’s recommended to have a balance with a resolution of 0.01 or 0.001 mg to ensure the accuracy and the stability of the sample mass.
3.3.2. Applied Pellet Pressure
Since BRML was the only the institute that obtained an acceptable complete combustion when using 1 g of the sample, it was necessary to understand the reasons. Therefore, PTB performed several tests using different oxygen pressures, different bombs with different sizes and heads, crucibles and ignition aids. However, over 90% of the cases showed incomplete combustion when using 1 g of the sample, (for the details of these tests see the Supplementary Material). The applied pressure to form the sample pellet remained the only uninvestigated cause. In the ISO standard, there is no information regarding the applied pressure used for the production of the sample pellet or the pelletizer’s characteristics. The standard states that the pelletizer should be able to perform pressure up to 10 tons. However, it remains unclear whether to apply 10 tons or to perform trial and error up to this value to obtain a well-defined pellet. In a systematic approach by PTB and TUBITAK, different set of pellets with a mass of 1 g were produced by applying 0.5, 2, 5 and 10 tons of pressure to test for complete combustion. All other experimental conditions were kept constant, including the bomb used, the crucible and the fuse setup. Each set was tested three times. The bomb calorimeter was then used to visually observe the completeness of the combustion as presented in Figure 3.
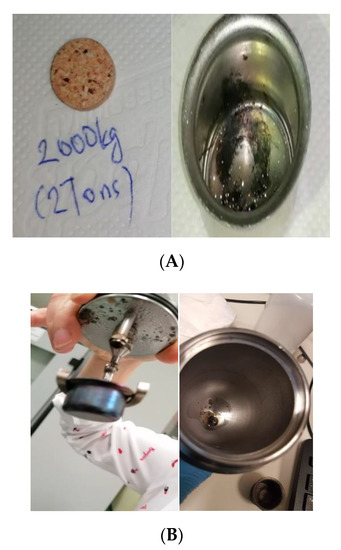
Figure 3.
Impact of the applied pellet pressure on achieving complete combustion, (A) shows the pellet under 2 ton (B) shows the pellet under 10 tons, as mentioned in the standard.
Figure 3A shows a sample pellet after applying 2 tons of pressure on it (left photo) and the solid residuals after its combustion. It tended to form soot even if a smaller mass of the sample was used. Figure 3B refers to the tests when applying 5–10 tons to form the pellet. The sample exploded inside the bomb and scattered all over the bomb head and vessel. These observations demonstrate that the pellet pressure is a sensitive matter when dealing with finely powdered biofuel samples. Despite 10 tons being applied, marks of breaking points or segmentations in the pellet were still observed, which indicated the possibility of forming loose powder during combustion. When loose powder exists simultaneously while turbulent gases inside the bomb are being formed due to combustion, the whole sample might blow out of the sample crucible. Hence, if the bomb walls are cool, the sample will be extinguished before it can burn completely [25]. Therefore, a properly pelletized sample has a better chance of undergoing complete combustion. When applying 0.5 ton on 1 g of the sample, a complete combustion for almost all cases was observed for both the wood chips and the wood pellets. This observation confirmed that the most suitable pressure to form the pellet was 0.5 ton to ensure complete combustion. Yet still, 1 g of the sample would only be recommended if the sample is easy to burn or if there are doubts about the efficiency of the sample division, mixing process or the batch representativity, because a larger sample would be a better representation of the sample batch.
3.3.3. Thermochemical Corrections
The thermochemical corrections (QN and QS) are often overlooked sources of error when measuring the calorific value. Most of the industrial laboratories tend to use the fixed corrections that are given in the appendix of the standards which are based on default values of C, H, N and S composition of the wood samples or by using the given values proposed by the calorimeter providers. It should be noted that the fixed corrections do not take into consideration the amount of air trapped when using different bomb volumes or if the operator has flushed with oxygen, or not, the bomb vessel before the experiment in order to replace the air inside. These factors would change the calorific value, since that trapped air is the main source of nitrogen and the QN is based on the amount of NO3 inside the bomb. Therefore, if the amount of air inside the bomb is not correctly estimated, this will affect the QN. Incorrect estimation of QN and QS can lead to offsets by 50–80 J in the final calorific value. Therefore, the recommended approach to determine the corrections is by using IC or titration. After analyzing the liquid residual of several samples after combustion by IC and titration, it was found that if the bomb vessel is flushed, the nitrogen correction would have an average of 2–8 J while if the bomb vessel is not flushed, the correction will be around 20–40 J.
3.4. Results of Cycle 2
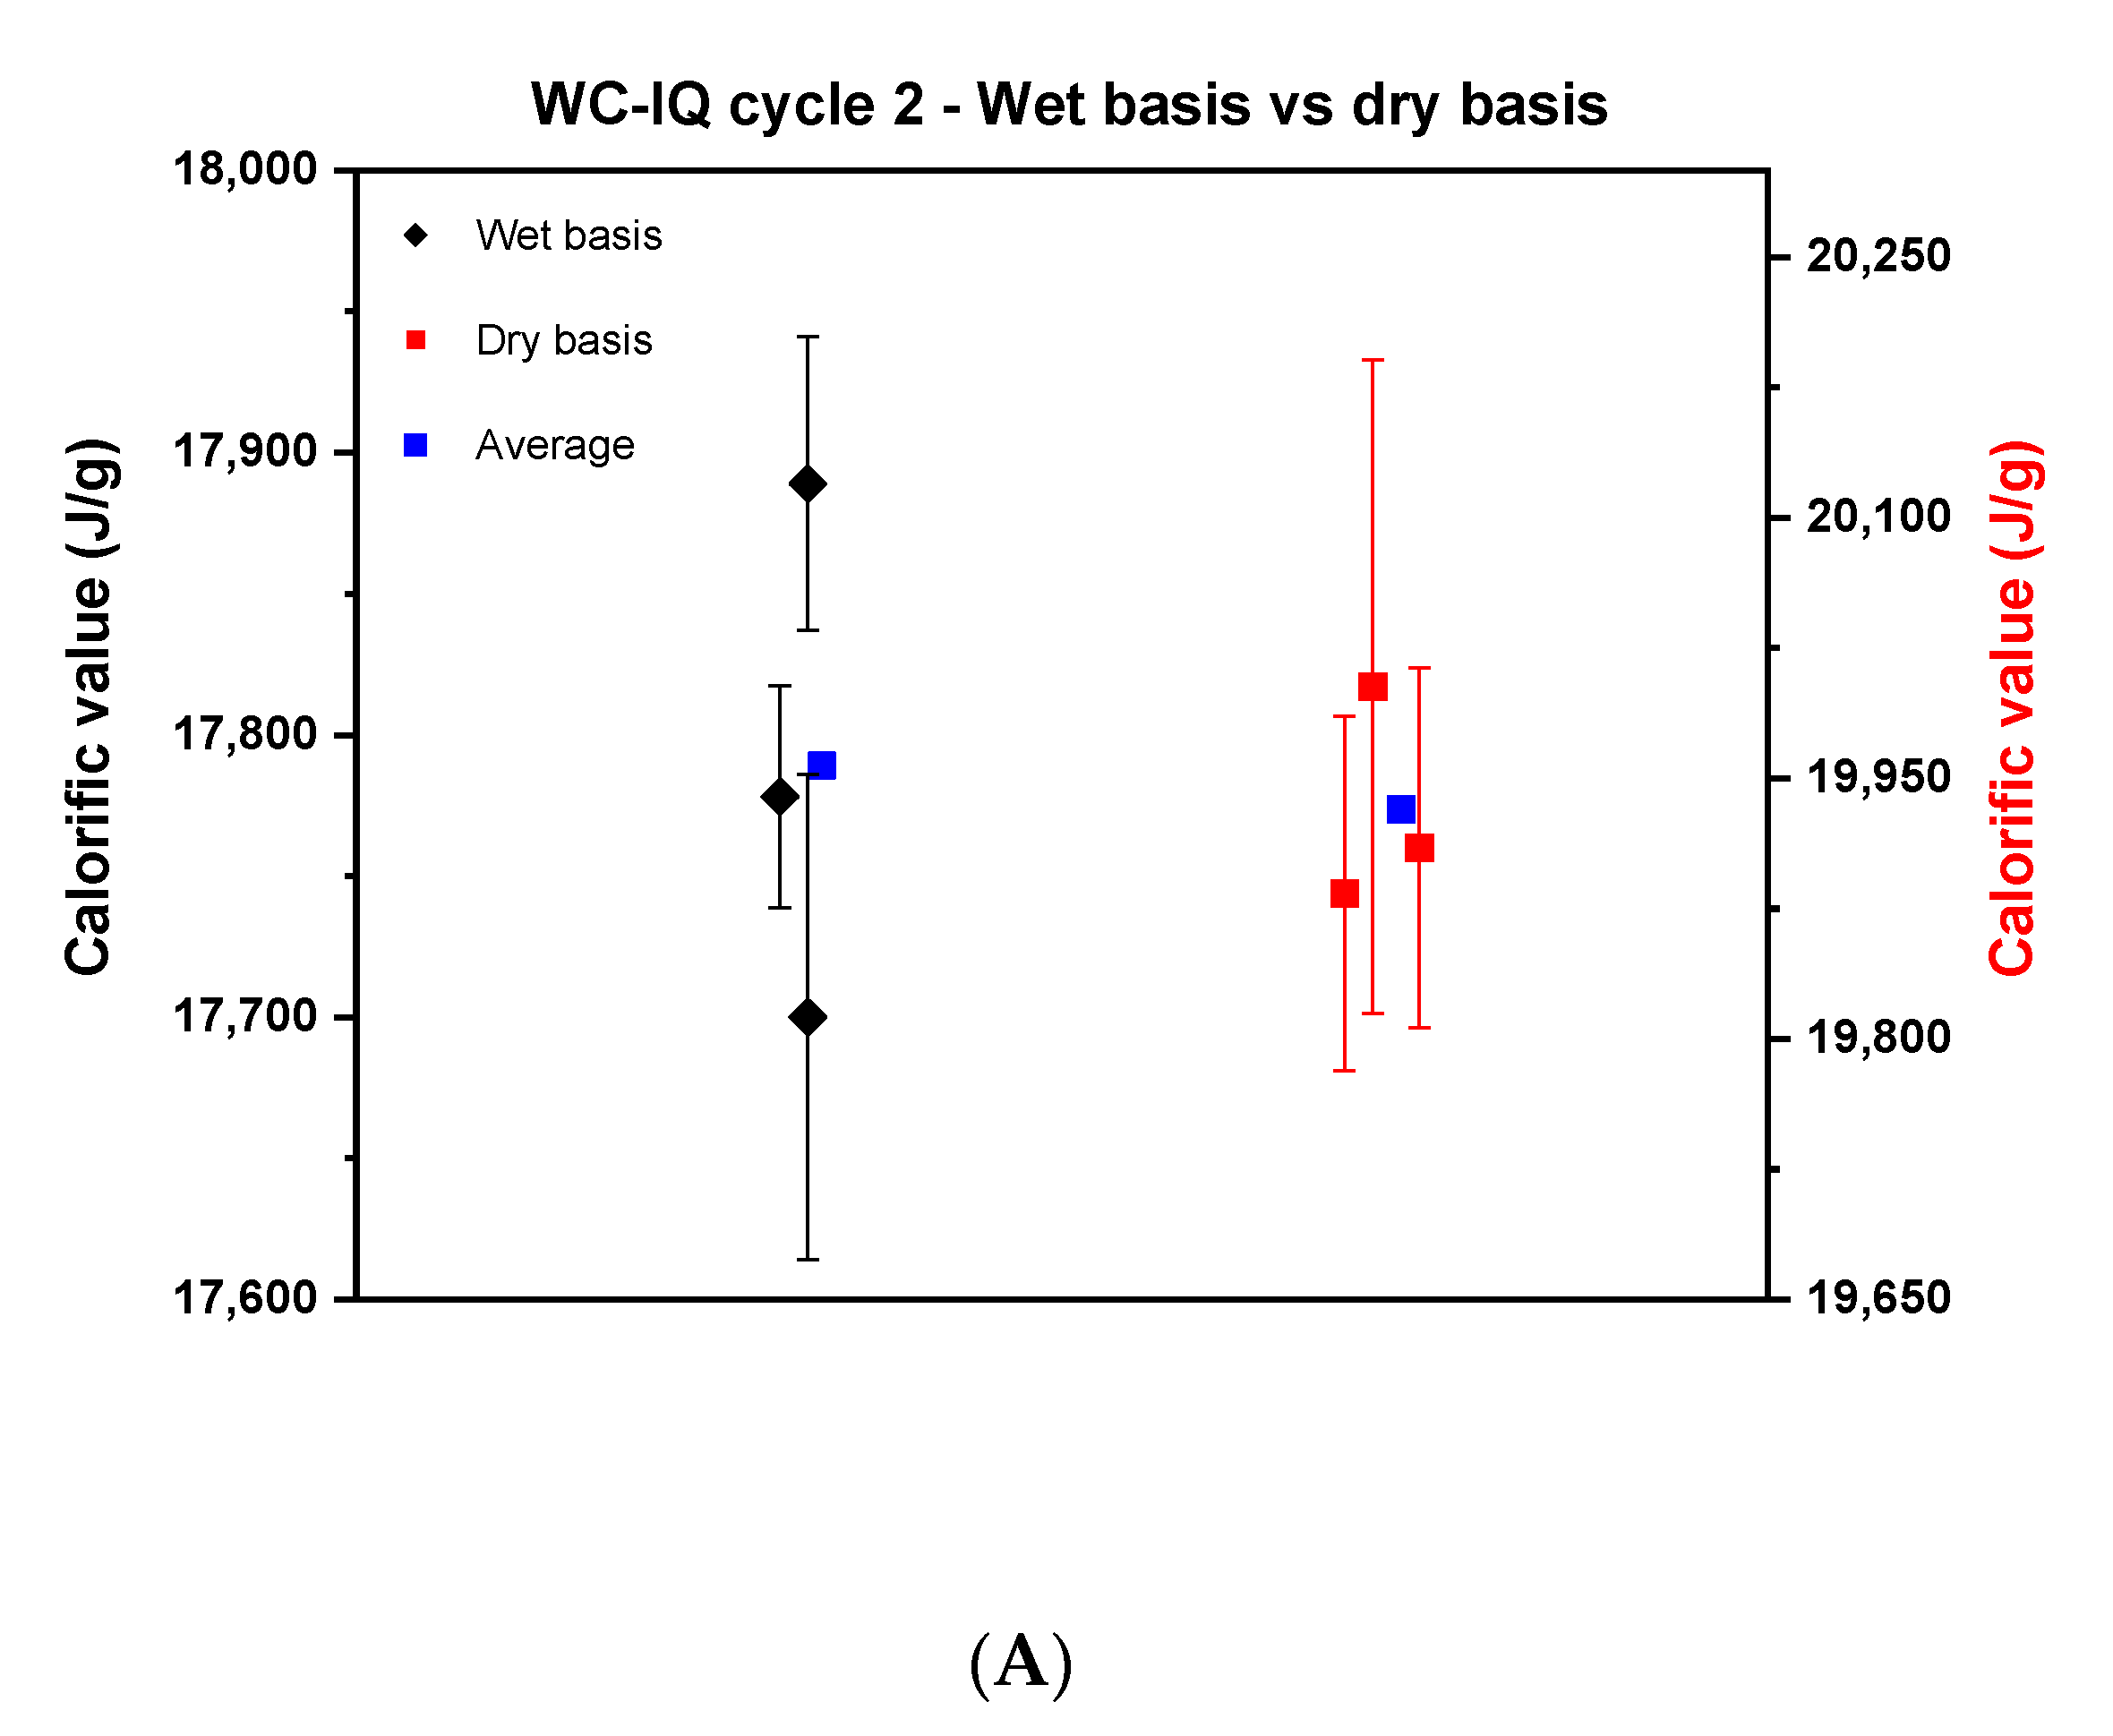
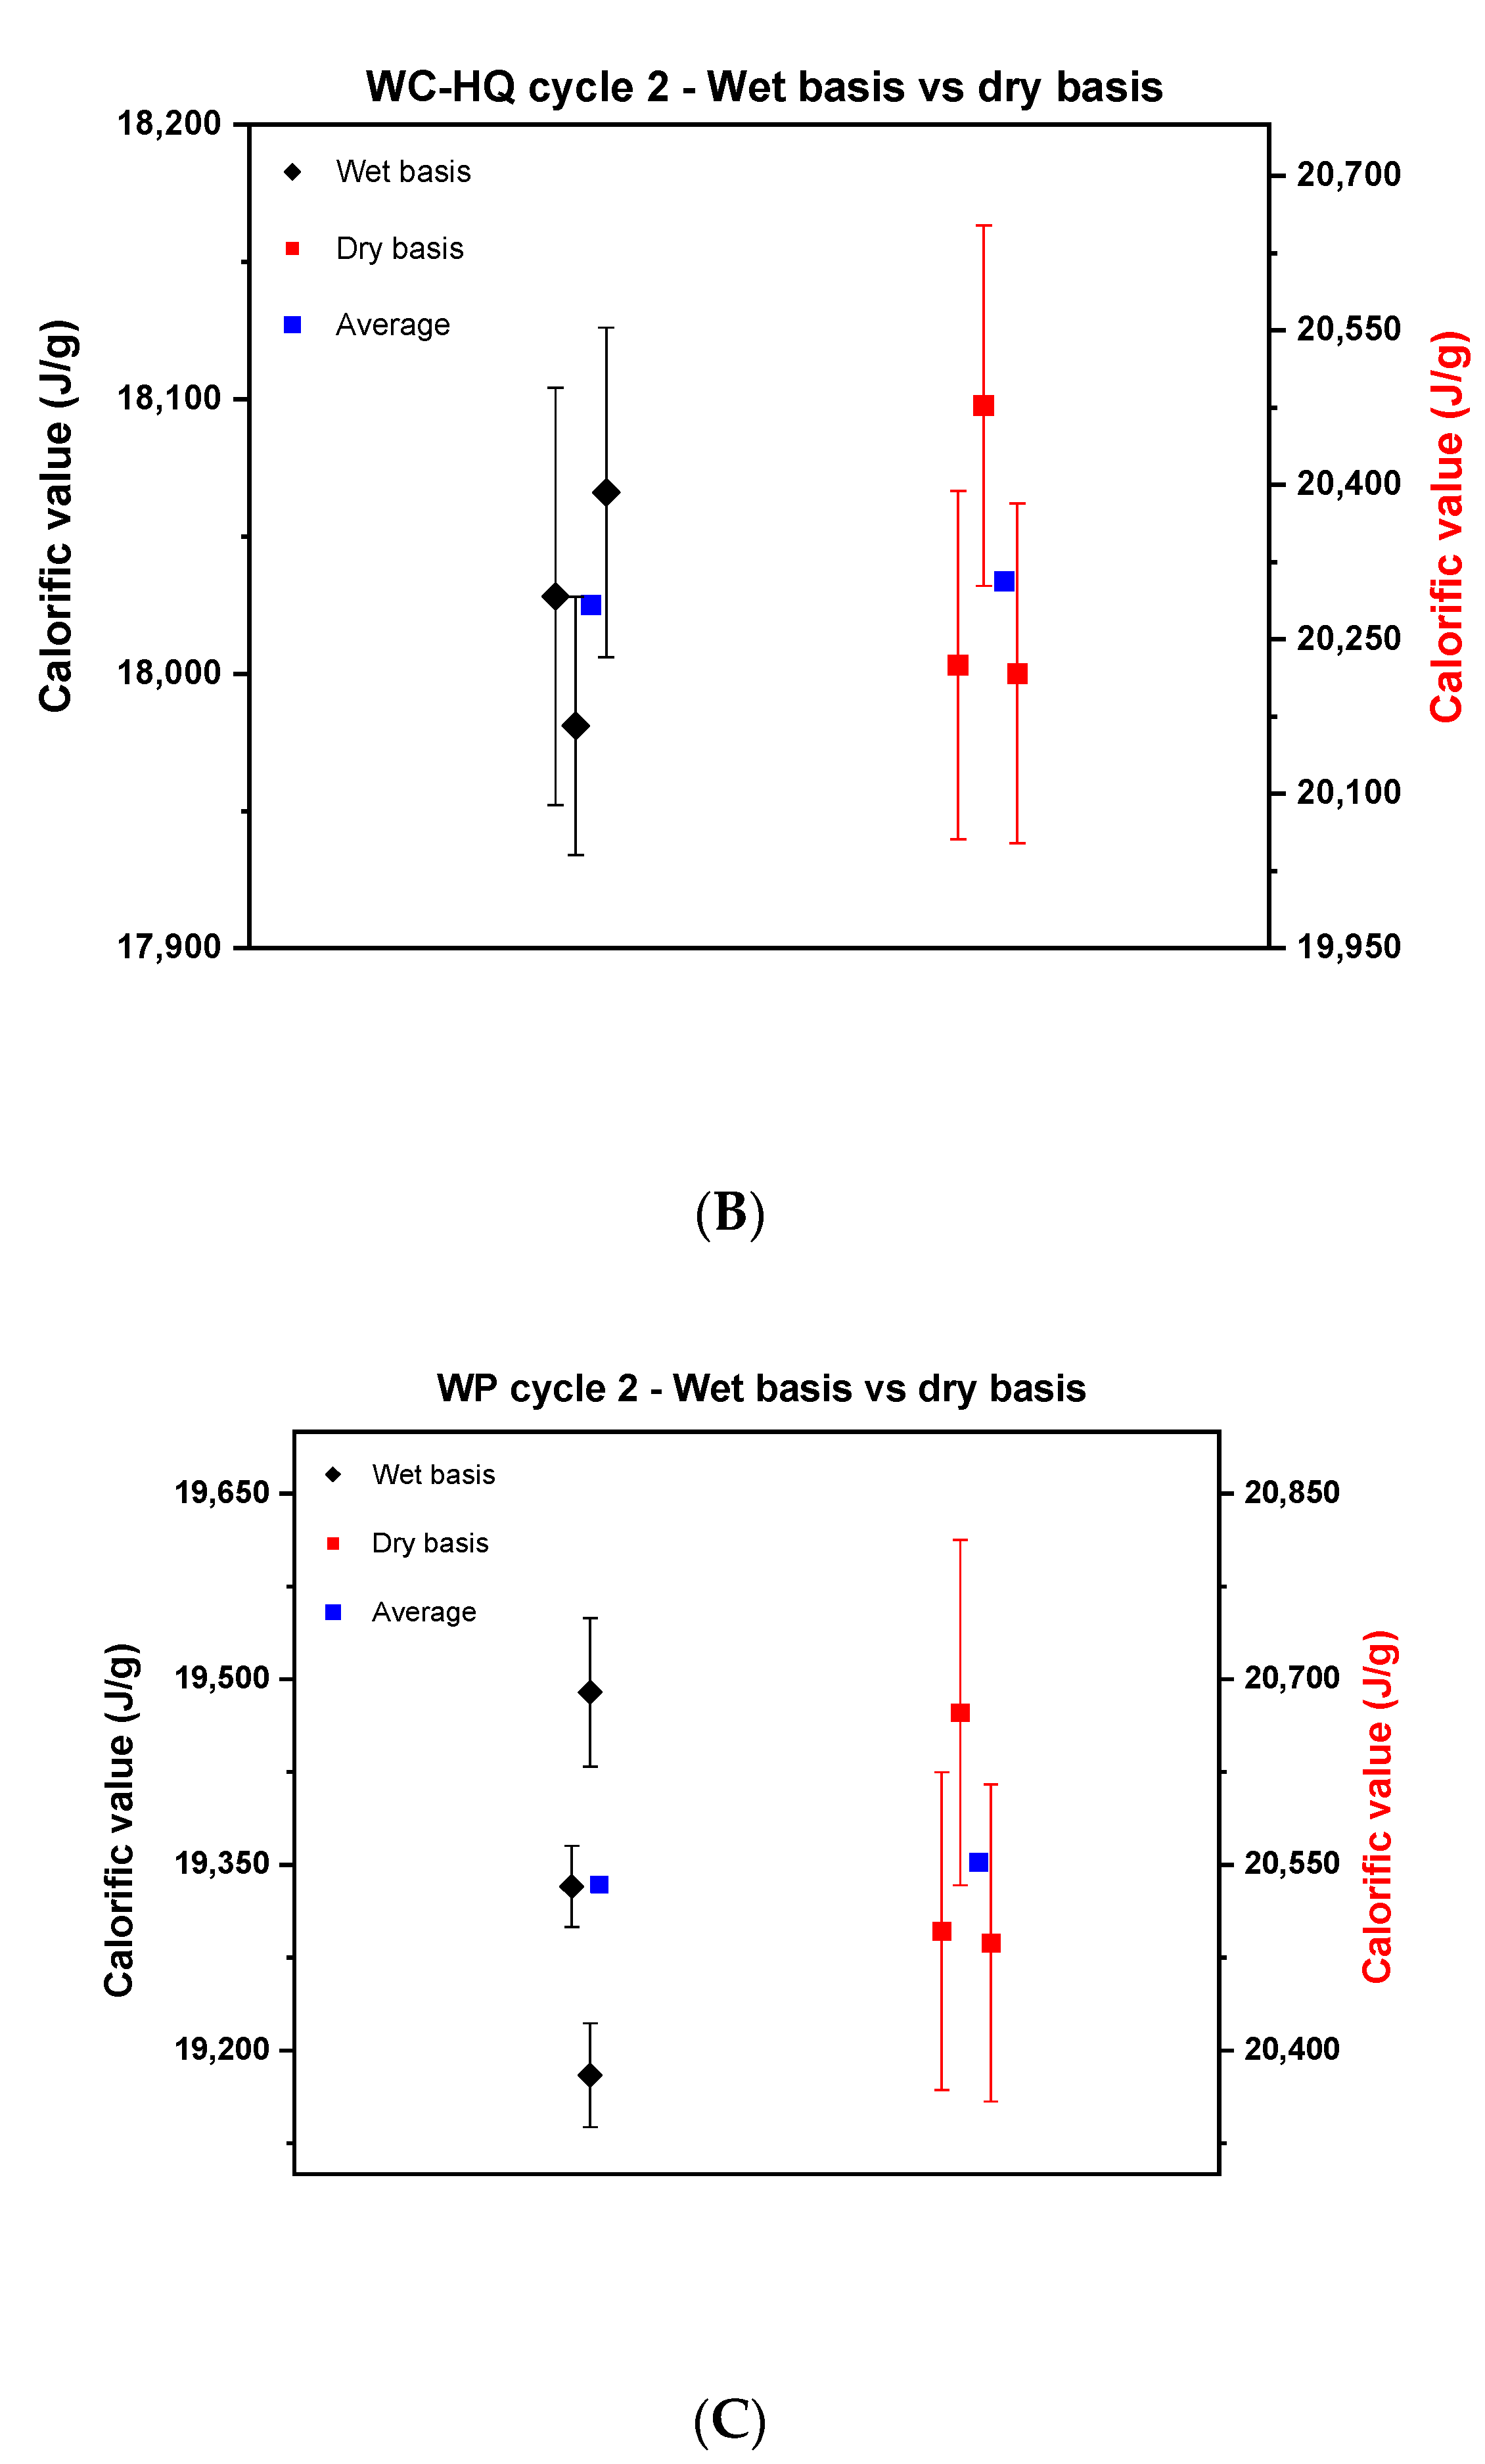
Based on the above findings, the experimental strategy was optimized and a united protocol was used for the measurements. Newly produced samples by TUBITAK were used in this cycle. Similar to cycle 1, the samples of wood chips of high quality, industrial quality and the wood pellets were measured on a wet and dry basis as shown in Figure 4.
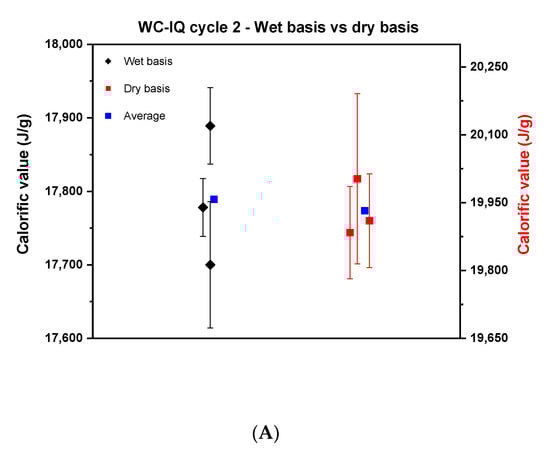

Figure 4.
Comparison between the calorific value on a wet basis and dry basis in cycle 2. (A) describes wood chips—industrial quality, (B), wood chips—high quality, and (C) the wood pellets.
Figure 4 reveals a noticeable reduction in the scattering of the results of the wet basis of cycle 2 compared to cycle 1 for the wood chips. The reproducibility difference for WC-IQ and WC-HQ in cycle 1 went from 800 J to 189 and 85 J in cycle 2, respectively. These values reflect the improvement that was achieved by using well-homogenized samples for wood chips. The scatter for wood pellets, however, remained nearly constant; cycle 1 was 300 J compared to 309 J in cycle 2. For the dry basis, the reproducibility difference for WC-IQ, WC-HQ and WP went from 300, 600, 312 J in cycle 1 to 120, 260, 186 J in cycle 2, respectively.
By comparing the dry and wet basis of cycle 2, the reproducibility difference on a dry basis decreased compared to the wet basis in both samples of WC-IQ and WP from 189 to 120 J and 309 to 186 J, respectively. For WC-HQ there was an increase in the reproducibility difference from 85 J on a wet basis to 260 J on a dry basis. This contradicts the common understanding where the difference should decrease after recalculating on a dry basis. This deviation reflects the presence of another error source in the experimental procedure which needs to be specified.
3.5. General Root Cause Analysis—Cycle 2
As was shown in the last section, the reproducibility for the WC-HQ measurements increases when calculating the calorific value on the dry basis instead of on the wet basis. The first prediction is an error caused during the moisture determination which strongly influences the accuracy of the calorific value. Figure 5 shows the difference in the moisture content for the determined WC-HQ samples by the three institutes. The moisture content for the rest of the samples is given in Table S2 in the Supplementary Material.
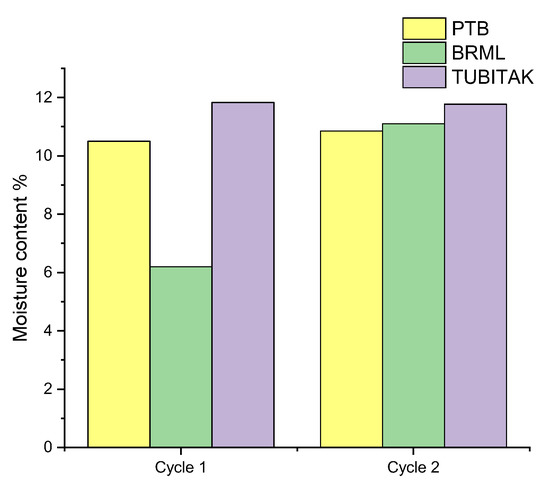
Figure 5.
Moisture content of the WC-HQ in the institutes for cycle 1 and cycle 2.
Figure 5 reveals that there is a large difference in the moisture value of cycle 1 between the institutes, especially between BRML and TUBITAK with around 6% difference. In cycle 2 the values were relatively consistent yet not exact with a difference between the values of around 0.6%. This was due to the fact that the samples used in cycle 2 stem from the same batch and were identically prepared as previously mentioned. Different factors possibly caused such variation in the moisture content of WC-HQ between the institutes.
Firstly, due to errors caused during the moisture determination. Such errors depend on the type of the oven used, the heat distribution and the place of the sample inside the oven. Moreover, the sample tray and whether it provides enough surface area for drying the sample properly or not. According to the final report of the METefnet project, a detailed investigation to evaluate the technical procedure for moisture determination is crucial to specify the sources of error and their uncertainties [26]. Such detailed investigation is, however, beyond the scope of this work.
Secondly, another source of error is that each institute has different environmental conditions in their laboratories such as relative humidity (RH) and temperature, which affects the biofuel samples. This is defined as the equilibrium moisture content (EMC), where the sample reacts with its surroundings by gaining or losing moisture. As an indicator for sample stability in any environmental condition, the sample mass can be evaluated [27].
3.6. Investigation for Improved Technical Criteria—Cycle 2
3.6.1. Equilibrium Moisture Content (EMC)
If the sample mass remains stable during the weighing process, it indicates that the sample has reached equilibrium with its surrounding. If the relative humidity is high, the wood samples mostly gain moisture, and vice versa if the humidity is low. It relies mainly on the initial moisture content of the wood. Therefore, the time to reach EMC plays an important role. The standard ISO 14780, which deals with the biofuel sample preparation, states that the sample can be left after grinding to reach equilibrium with the temperature and moisture for 4 h [16]. However, the standard does not mention the importance of the EMC or the obligation to do so. This criterion has proved to be lacking because the temperature and relative humidity changes frequently and the samples need to readapt when any variation occurs in the room conditions. Therefore, PTB performed a test in a laboratory with 32% RH and a temperature of 21.5 °C to estimate the EMC. The test used a freshly ground sample to sit on the balance until it reached a constant mass. The sample kept losing moisture to the atmosphere which is shown in Table 2 as a loss of mass. After 24 h the sample mass was stable up to five digits. This time is relative and depends on the surrounding conditions and the sample nature.
Table 2.
Sample mass stability as a function of time and EMC.
Based on the results shown in Table 2, the sample does not necessarily reach the EMC after 4 h. Therefore, it is advised to leave the samples after grinding for 4 h to reach equilibrium and then again before determining the calorific value for another 4 h. Otherwise, the sample can be left for 16 h straight as a minimum if the determination of the calorific value will directly follow.
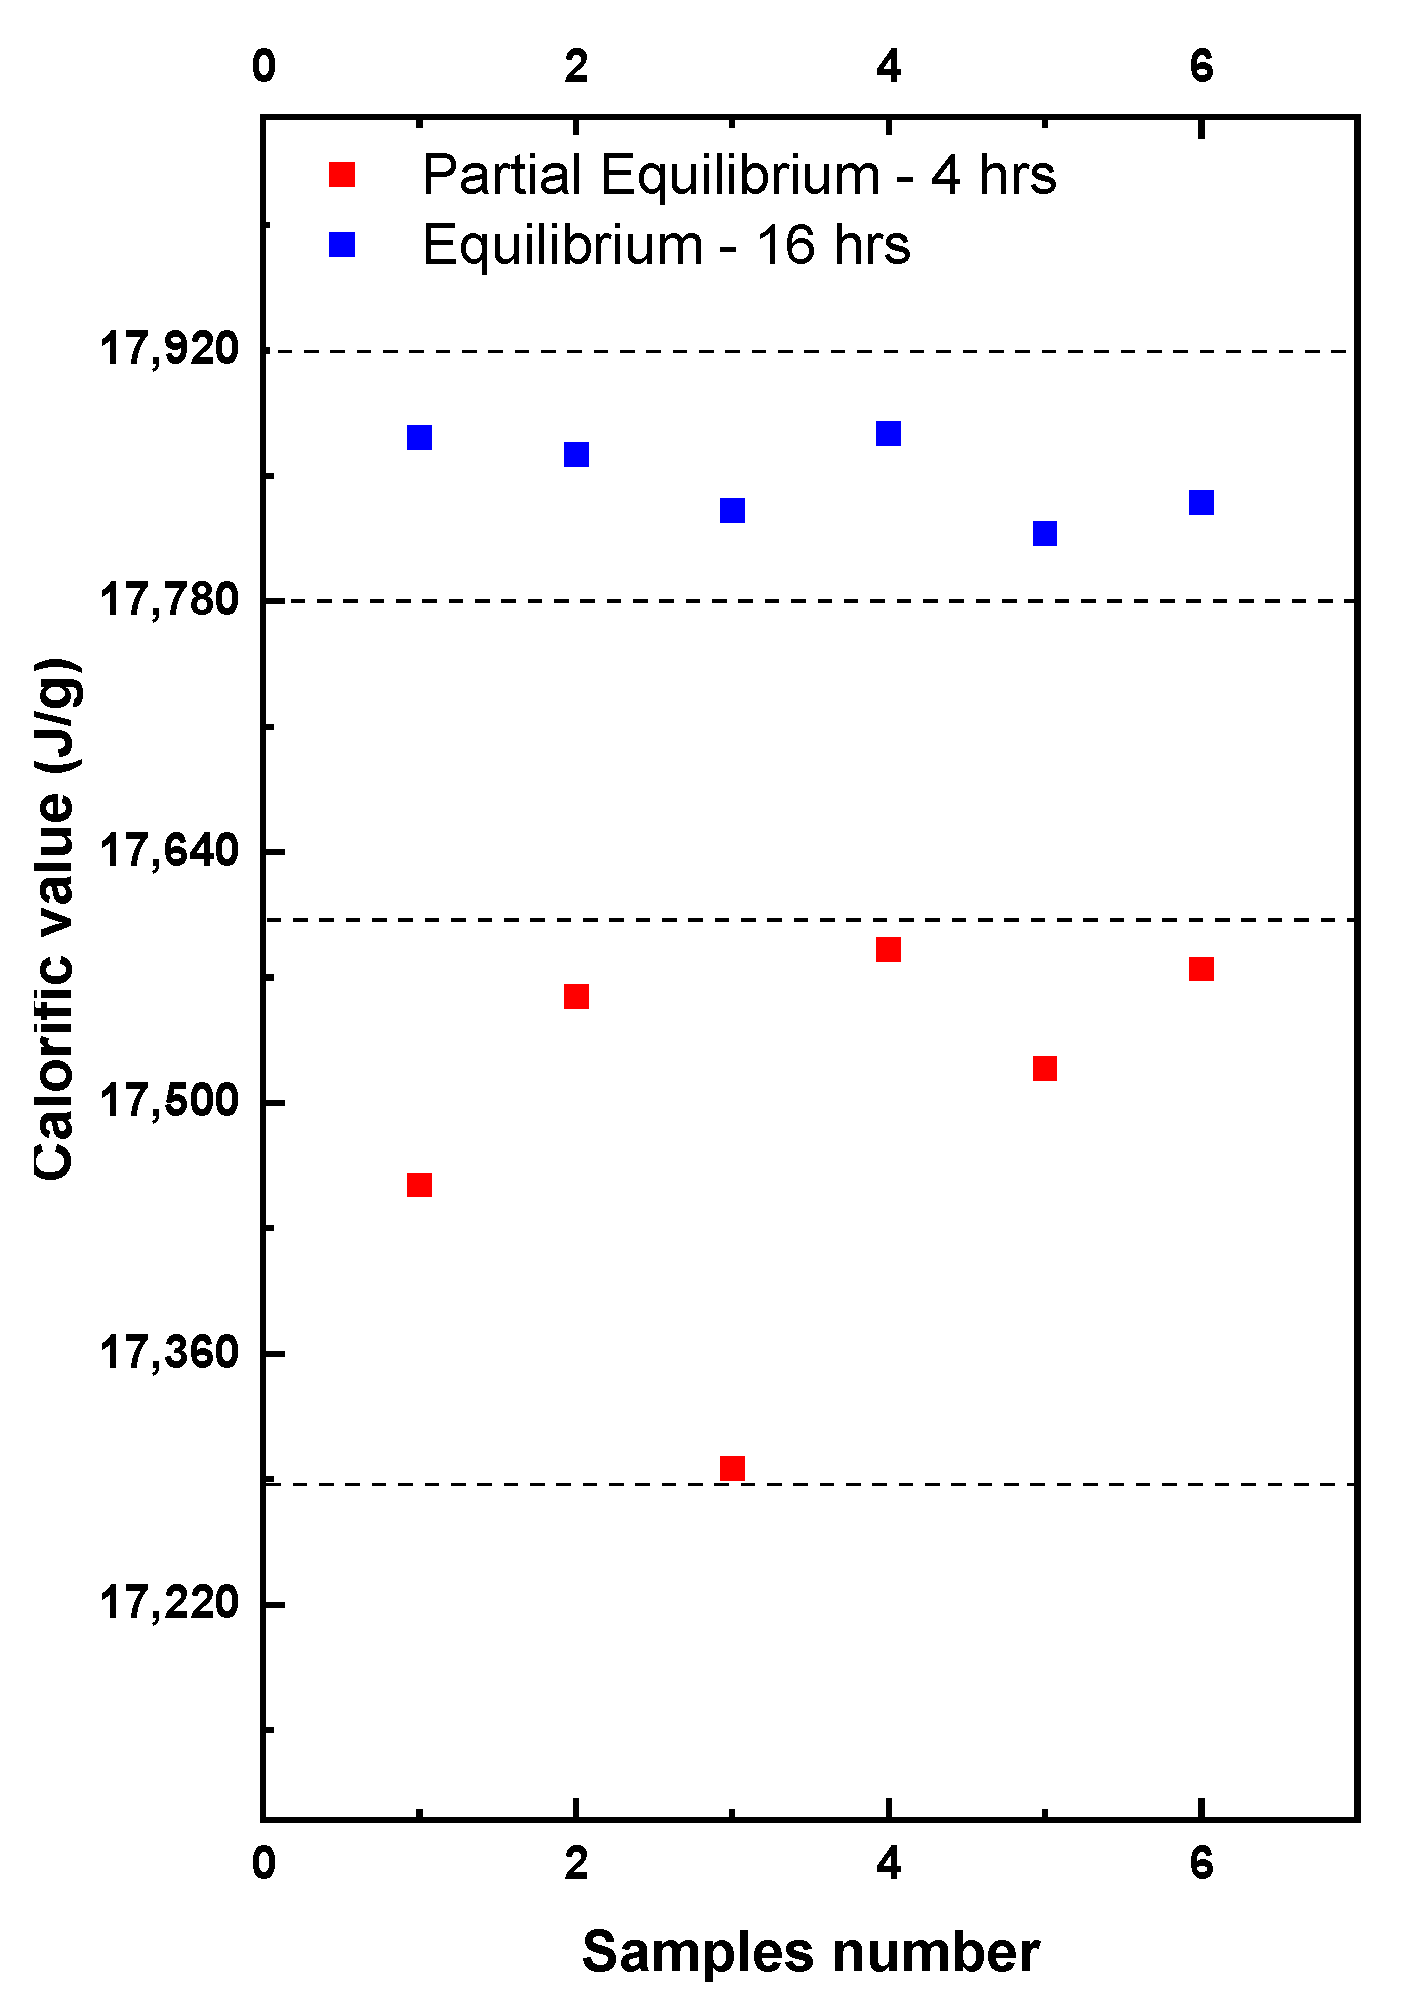
To study the impact of the different levels of the EMC on the calorific value, 12 samples were tested from a freshly ground batch of WC-IQ. The samples were tested at two different time intervals as shown in Figure 6.
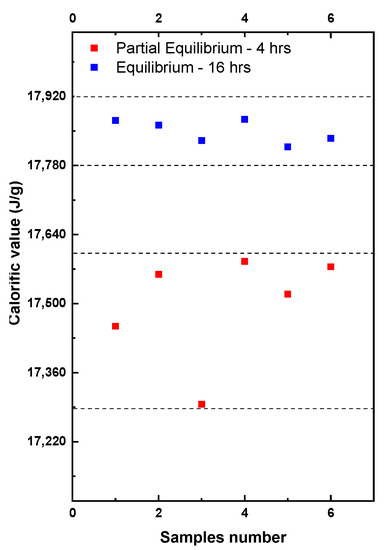
Figure 6.
EMC effect on the wet basis calorific value and the sample repeatability.
Partial equilibrium refers to the tests performed in the bomb calorimeter after grinding that lasted around 4–6 h. These tests showed high fluctuation in the determined calorific values (red symbols). After 16 h the samples were retested again and shown in the figure as equilibrium (blue symbols). If the equilibrium was reached, the repeatability significantly improved and the deviation between the samples became less than 60 J compared to 280 J in partial equilibrium. This was due to the stability of the sample mass because of the more stable moisture content. The EMC effects upon the calorific value repeatability depended significantly on the laboratory conditions. A repeatability improvement by up to 50–80% was achieved, which consequently contributed to minimizing the reproducibility difference. Repeatability played a large role in the final expanded uncertainty [28]. Based on the uncertainty calculations given in Section 4 where a fixed set of the uncertainty sources are proposed, it is estimated that a 50–80% improvement in repeatability could lower the uncertainty by 15–30%. This value might widely vary depending on the calorimetric setup and the uncertainty sources considered in the calculations of the final uncertainty. In ISO 18125:2017 there is no information about the uncertainty sources or their respective values. Therefore, Section 4 will discuss the uncertainty sources and their calculations in detail.
3.6.2. Operator
The operator is one of the other factors that causes data scattering during the measurements of the calorific value and the moisture content. Each operator might have different operating approaches and handling techniques. A value of around 20 J is expected due to different operators measuring the biomass samples. This value was estimated by testing stable and easy to burn materials, i.e., liquid biofuels. It is depicted in Figure S1 in the Supplementary Material. Therefore, it is recommended to have the same operator performing the repeatability measurements to avoid this factor. However, this factor is always present and cannot be fully excluded when performing an interlaboratory comparison between different institutes or between the biomass supplier and the end-user.
4. Uncertainty Sources
The following uncertainty consideration can help to unify the procedure of determining the uncertainty of a calorific value measured by bomb calorimetry. With this a better estimate about the accuracy of calorific values is accessible. The term uncertainty is defined as a margin of error or dispersions attributed to any measured quantity [29]. To estimate the total uncertainty of the calorific value, all the variables that are part of Equations (1)–(3) (see Section 2.4) must be highlighted and investigated for their individual uncertainty. Therefore, each uncertainty source was defined and its contribution was calculated in this work. Each of these sources may have an impact on the final calorific value. Figure 7 provides an Ishikawa diagram that shows different uncertainty sources associated with the overall uncertainty of the final calorific value.
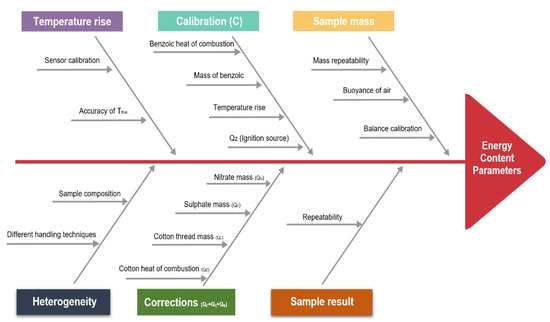
Figure 7.
Uncertainty sources associated with the determination of the calorific value.
4.1. Sample Mass
The uncertainty of the mass is a function of the mass repeatability, the uncertainty of the balance and the buoyancy of air as given in Equations (4) and (5a,b).
where U(H) represents the uncertainty of the mass as a function of the calorific value, U(m) is the mass uncertainty and P is the sensitivity coefficient. The uncertainty of the air buoyancy can be calculated according to the formulas provided by Hashad [30]. The uncertainty of the balance can be found in the calibration certificate. If the certificate is not available, the balance would need to be calibrated manually by using standard masses.
4.2. Temperature Rise
The accuracy of the temperature depends on the calibration of the sensor used to record the temperature rise caused by the sample combustion. Usually, this value would be provided by the manufacturer of the calorimeter or it can be calibrated independently. Most of the laboratories tend to use the values of the final calorific value and the temperature rise from the instrument. However, for manual calculations based on the raw log data of the temperature from the instrument, the temperature values, Ta, Tfinal and Te must be accurately selected. These temperature values are being recorded at specific times and thesymbols refer to the beginning of the combustion, the end of the combustion and the end of the experiment, respectively. The selection of Tfinal is the most crucial since the first two are known. The time where Tfinal is selected should be fixed in all experiments. If the timing is fixed, any error in the selection of the Tfinal during the calibration will eventually be the same error in each case of sample determination, therefore the error would cancel out.
4.3. Sample Result
This is the uncertainty caused by the repeatability of the performed measurements in the same laboratory and by the same operator.
where U(Hrep) is the uncertainty of the repeatability, √N is the number of measurements and is the standard deviation of the total measurements.
4.4. Calibration
The uncertainty of the calorimeter calibration or rather the heat capacity of the system (C) is calculated in the same way as for the fuel samples. Similar error sources are considered in the uncertainty including the mass of the benzoic acid used, results repeatability, the thermochemical corrections and the temperature rise. The only extra factor that needs to be added to the uncertainty is the heat of combustion of the reference material benzoic acid, which is usually provided in the calibration certificate which ensures traceability to the SI unit.
4.5. Corrections (QN + QS + QZ)
The acid corrections QN and QS are calculated according to the equations provided by the ISO standard for ion chromatography, see Table 3. Ion chromatography is the recommended approach to be followed to calculate the thermochemical corrections [31]. Based on these equations, their uncertainties are derived. It is assumed that the values of QN and Qs follow rectangular distributions, where the calorific value might exist within any point of the uncertainty. QZ is calculated based on the mass of the cotton multiplied by the cotton’s calorific value. However, the fuse wire contribution in the uncertainty is neglected as it does not burn during the combustion process. If the thermochemical corrections are analyzed by titration, similar uncertainty is expected.
Table 3.
The uncertainty equations due to the thermochemical and ignition corrections.
Here, is the standard deviation of the determined nitrate mass, standard deviation of sulphate mass, mcotton is the mass of cotton and Hcotton is the heat of combustion from the cotton.
4.6. Sample Heterogenity or Reproducibility
This factor is introduced to take into consideration the uncertainty caused by the reproducibility in the case of comparison. Despite the fact that this factor slightly expands the uncertainty, it ensures that the uncertainty covers the whole range of calorific values measured by the other institutes. Moreover, it combines the uncertainties from the other institutes to develop a single overlapping uncertainty between the values. This factor assumes a rectangular distribution.
4.7. Total Final Uncertainty
The total uncertainties of the calorific value on a wet and dry basis are derived respectively from Equations (2) and (3) which are given in Section 2.4. The uncertainty on the wet basis is derived as following:
The total uncertainty on the dry basis:
where Uc(Hw) is the uncertainty of the heat capacity as a function of calorific value, UdT(H) is the uncertainty of temperature rise, UQz(Hw) is the uncertainty of ignition, UQN(Hw) is the uncertainty of nitric correction, UQs(Hw) is the uncertainty of sulphate correction and Um(Hw) is the uncertainty of mass. In Equation (9), Uwet(Hd) is the uncertainty of the calorific value on a wet basis, URep(Hd) is the uncertainty caused by the repeatability of the calorific value, UR(Hd) is the uncertainty of reproducibility in case of comparison and UM(Hd) is the uncertainty of the moisture content. Table 4 shows the uncertainties obtained during the laboratory comparison by the participating institutes.
Table 4.
Final expanded uncertainty (k = 2) of each institute in cycle 2.
The final uncertainties of the calorific value on a dry basis Udry are almost identical in each institute, except for WC-IQ measured by TUBITAK. The latter is due to the fact that their repeatability was much higher than that achieved by PTB and BRML with around 0.46% compared to less than 0.16%, respectively. Therefore, it caused a noticeable increase in the final uncertainty. Normally, this would have been an issue because the results of the institutes would not overlap in a single point. However, by looking to the uncertainties U incl. U(R) it was observed that the final relative uncertainty became significantly extended with maximum of around ± 1% for all samples. This is also demonstrated in the previous results, shown in Figure 1 and Figure 4 on a dry basis, where the uncertainty/error bar is widely extended compared to cycle 1, where this factor was not implemented. The results are now clearly overlapping in a specific range, for more information see Figure S2 in the Supplementary Material. This overlap could only be obtained after calculating the heterogeneity/reproducibility uncertainty according to Equation (7) as shown in Section 4.6. Nevertheless, the final relative expanded uncertainty of ± 1% is still significantly better than the range of 2–5% which is commonly cited in the industry or in the literature. It is therefore recommended to consider detailed uncertainty calculations to guarantee a precise determination of the calorific value. In some cases, uncertainty sources cannot be easily determined or do not make a significant contribution in the final uncertainty. However, based on the finding in this work, the authors can conclude that the uncertainty of the calorific value repeatability, the moisture, the sample mass and the heat capacity of the system are the most crucial uncertainty sources and should always be considered.
5. Conclusions
This study provides a detailed explanation of the possible sources of error which affect the accuracy of the determination of solid biofuels’ calorific value. These sources are quantified to provide the laboratories, producers and end-users with sufficient information of how to avoid causes of deviation. Recommended criteria are introduced and advised to be followed to minimize uncertainty. Minimizing uncertainty would help achieve fair biomass pricing if it is purchased based on its calorific value. Moreover, it enhances the precision of the calculations of the thermal efficiencies of the CHP and the biorefinery plants.
- In the case of a woody biomass which is hard to burn, a sample mass of around 0.3–0.7 g is recommended to ensure complete combustion. It is advised to fix the sample mass in each experiment as far as possible to guarantee similar ash formation.
- It is preferable to have a balance with a resolution of 0.01 mg or 0.001 mg to guarantee the accuracy of weighting the samples.
- The applied pressure to form the pellet is crucial to ensure complete combustion, a pressure of 0.5 to 3 ton is recommended. Higher pressures could cause segmentations in the pellet and causes the pellet to break down during combustion.
- The bucket temperature should be around 22–24 °C and fixed in all experiments to avoid any deviation caused by a different rate of heat transfer in each experiment.
- Performing the thermochemical corrections by using titration methods or ion chromatography is recommended to guarantee realistic and more accurate values.
- Ensuring enough time for the sample to reach the equilibrium moisture content where the sample mass becomes stable. This is recommended to be 16 h in case of direct determination afterwards. Otherwise, 4 h after grinding and another 4 h before the determination of the calorific value.
- Detailed uncertainty sources have been provided and are highly recommended to be followed by any user measuring the calorific value by a bomb calorimeter. The maximum relative expanded uncertainty is around ±1%. Any increase beyond this value needs to be investigated.
By following the recommended practice and allowing enough time for the sample to reach the equilibrium moisture content before determining the calorific value can improve the repeatability by around 50–80%. Consequently, the final relative expanded uncertainty will improve by 10–30%.
Supplementary Materials
The following supporting information can be downloaded at: https://www.mdpi.com/article/10.3390/en15082771/s1, and contains the experiments performed by testing different oxygen pressure, crucibles and bombs; and the detailed moisture values of each institute and the calorimetric parameters used during the measurements. Figure S1: comparison between the calorific value of biodiesel between TUBITAK and PTB; Figure S2: Sample heterogeneity parameter to develop an overlapping uncertainty, Table S1: general calorimetric parameters; Table S2: additional factors for each institute cycle 1 and cycle 2.
Author Contributions
Conceptualization, M.S.; methodology, M.S., C.S., A.B., and K.O.; data creation, M.S., C.S., A.B. and K.O.; investigation, M.S.; resources, K.M. and A.I.; writing—original draft preparation, M.S.; writing—review and editing, K.M. and E.Z.; visualization, M.S. and A.I.; supervision, K.M. and E.Z.; project administration, K.M.; All authors have read and agreed to the published version of the manuscript.
Funding
This research was performed within the 19ENG09 BIOFMET project and has received funding from the EMPIR programme (European Metrology Programme for Innovation and Research) co-financed by the Participating States and from the European Union’s Horizon 2020 research and innovation programme.
Data Availability Statement
The data that support the findings of this study are available on request from the author, Moaaz Shehab.
Acknowledgments
The authors would like to thank Stefan Sarge for the fruitful discussions, Feyzanur Senturk for preparing the samples at TUBITAK UME and DTI for providing the samples to the partners.
Conflicts of Interest
The authors declare no conflict of interest.
References
- García-Maroto, I.; Muñoz-Leiva, F. Adoption of Biomass Heating Systems. In Cases on Academic Program Redesign for Greater Racial and Social Justice; Li, E., Cain-Sanschagrin, E., Filback, R.A., Crawford, J., Eds.; IGI Global: Hershey, PA, USA, 2022; pp. 177–206. ISBN 9781466682627. [Google Scholar]
- Pedišius, N.; Praspaliauskas, M.; Pedišius, J.; Dzenajavičienė, E.F. Analysis of Wood Chip Characteristics for Energy Production in Lithuania. Energies 2021, 14, 3931. [Google Scholar] [CrossRef]
- Jewiarz, M.; Wróbel, M.; Mudryk, K.; Szufa, S. Impact of the Drying Temperature and Grinding Technique on Biomass Grindability. Energies 2020, 13, 3392. [Google Scholar] [CrossRef]
- Cavalaglio, G.; Cotana, F.; Nicolini, A.; Coccia, V.; Petrozzi, A.; Formica, A.; Bertini, A. Characterization of Various Biomass Feedstock Suitable for Small-Scale Energy Plants as Preliminary Activity of Biocheaper Project. Sustainability 2020, 12, 6678. [Google Scholar] [CrossRef]
- Lind, F.; Heyne, S.; Johnsson, F. What Is the Efficiency of a Biorefinery? 2012. Available online: https://publications.lib.chalmers.se/records/fulltext/local_162671.pdf (accessed on 14 January 2022).
- Atkins, M.J.; Walmsley, T.G.; Ong, B.H.Y.; Walmsley, M.R.W.; Neale, J.R. Application of p-graph techniques for efficient use of wood processing residues in biorefineries. Chem. Eng. Trans. 2016, 52, 499–504. [Google Scholar] [CrossRef]
- Meschel, S.V. A brief history of heat measurements by calorimetry with emphasis on the thermochemistry of metallic and metal-nonmetal compounds. Calphad 2020, 68, 101714. [Google Scholar] [CrossRef]
- 19ENG09 BIOFMET. D1: Report on Required Parameters and Metrological Methodologies for Measuring Calorific Value of Biofuels and Qualifying Impurities, Moisture, and Ash Content: BIOFMET-D1. Available online: http://www.biofmet.eu/documents/ (accessed on 14 January 2022).
- Anerud, E.; Bergström, D.; Routa, J.; Eliasson, L. Fuel quality and dry matter losses of stored wood chips—Influence of cover material. Biomass Bioenergy 2021, 150, 106109. [Google Scholar] [CrossRef]
- He, H.; Dyck, M.F.; Horton, R.; Li, M.; Jin, H.; Si, B. Chapter Five—Distributed Temperature Sensing for Soil Physical Measurements and Its Similarity to Heat Pulse Method. In Advances in Agronomy; Sparks, D.L., Ed.; Academic Press: Cambridge, MA, USA, 2018; pp. 173–230. [Google Scholar]
- Muehleisen, R.T. Understanding the concepts of uncertainty, reproducibility, and repeatability and the application to acoustic testing. J. Acoust. Soc. Am. 2015, 137, 2215. [Google Scholar] [CrossRef]
- Williams, J.H. Guide to the Expression of Uncertainty in Measurement (the GUM). In Quantifying Measurement; Morgan & Claypool Publishers: San Rafael, CA, USA, 2016; pp. 4–10. ISBN 978-1-6817-4433-9. [Google Scholar]
- Lister, A.S. 7 Validation of HPLC methods in pharmaceutical analysis. In Handbook of Pharmaceutical Analysis by HPLC; Elsevier: Amsterdam, The Netherlands, 2005; pp. 191–217. ISBN 9780120885473. [Google Scholar]
- ISO 18125:2017; Solid Biofuels—Determination of Calorific Value. British Standards Institution: London, UK, 2017. Available online: www.iso.org/standard/61517.html (accessed on 25 January 2022).
- Lukas, K.; Tomas, J.; Martin, D.; Mehmet, A. The Effect of Moisture on the Particle Size Characteristics of Knife-milled Beech Chips. Chem. Eng. Trans. 2021, 88, 739–744. [Google Scholar] [CrossRef]
- ISO 14780:2017; Solid Biofuels—Sample Preparation. BSI Standards Publication: London, UK, 2017. Available online: www.iso.org/standard/66480.html (accessed on 25 January 2022).
- ISO 18134-3:2015; Solid Biofuels—Determination of Moisture Content—Oven Dry Method: Moisture in General Analysis Sample. BSI Standards Publication: London, UK, 2015. Available online: https://www.iso.org/standard/61637.html (accessed on 25 January 2022).
- Feidt, M. From Thermostatics to Non-equilibrium Thermodynamics. In Finite Physical Dimensions Optimal Thermodynamics 1; Elsevier: Amsterdam, The Netherlands, 2017; pp. 1–41. ISBN 9781785482328. [Google Scholar]
- Basu, P. Analytical Techniques. In Biomass Gasification, Pyrolysis and Torrefaction; Elsevier: Amsterdam, The Netherlands, 2018; pp. 479–495. ISBN 9780128129920. [Google Scholar]
- Ralph, S. Jessup. Precise Measurement of Heat of Combustion with a Bomb Calorimeter. In Recent Advancements in Biofuels and Bioenergy Utilization; Sarangi, P.K., Nanda, S., Mohanty, P., Eds.; Springer: Singapore, 2018; ISBN 978-981-13-1307-3. [Google Scholar]
- Teodorescu, I.; Erbaşu, R.; Branco, J.M.; Tăpuşi, D. Study in the changes of the moisture content in wood. IOP Conf. Ser. Earth Environ. Sci. 2021, 664, 12017. [Google Scholar] [CrossRef]
- Kuptz, D.; Schreiber, K.; Schulmeyer, F.; Lesche, S.; Zeng, T.; Ahrens, F.; Zelinski, V.; Schön, C.; Pollex, A.; Borchert, H.; et al. Evaluation of combined screening and drying steps for the improvement of the fuel quality of forest residue wood chips—Results from six case studies. Biomass Conv. Bioref. 2019, 9, 83–98. [Google Scholar] [CrossRef]
- Craven, J.M.; Swithenbank, J.; Sharifi, V.N.; Peralta-Solorio, D.; Kelsall, G.; Sage, P. Hydrophobic coatings for moisture stable wood pellets. Biomass Bioenergy 2015, 80, 278–285. [Google Scholar] [CrossRef] [Green Version]
- Tumuluru, J.S.; Heikkila, D.J. Biomass Grinding Process Optimization Using Response Surface Methodology and a Hybrid Genetic Algorithm. Bioengineering 2019, 6, 12. [Google Scholar] [CrossRef] [PubMed] [Green Version]
- Parr Instrument Company. Maunal of Pellet Press: 2811; Parr Instrument Company: Moline, IL, USA, 2018. [Google Scholar]
- EURAMET. Report in Metrology for Moisture in Materials; METefnet Project, 31 May 2016; EURAMET: Braunschweig, Germany, 2016. [Google Scholar]
- Hoffmeyer, P.; Engelund, E.T.; Thygesen, L.G. Equilibrium moisture content (EMC) in Norway spruce during the first and second desorptions. Holzforschung 2011, 65, 875–882. [Google Scholar] [CrossRef]
- Meyer, V.R. Measurement uncertainty. J. Chromatogr. A 2007, 1158, 15–24. [Google Scholar] [CrossRef] [PubMed]
- Kabir, H.M.D.; Khosravi, A.; Hosen, M.A.; Nahavandi, S. Neural Network-Based Uncertainty Quantification: A Survey of Methodologies and Applications. IEEE Access 2018, 6, 36218–36234. [Google Scholar] [CrossRef]
- Hashad, A. Investigation of Non-Rotating Piston Gauges as Primary and Secondary Standards for the Intermediate Vaccum Pressure Range from 0 to 15 Kpa. Ph.D. Thesis, Technical University of Braunschweig, Braunschweig, Germany, 2021. [Google Scholar]
- Llorente, M.F.; García, J.C. Suitability of thermo-chemical corrections for determining gross calorific value in biomass. Thermochim. Acta 2008, 468, 101–107. [Google Scholar] [CrossRef]


Publisher’s Note: MDPI stays neutral with regard to jurisdictional claims in published maps and institutional affiliations. |
© 2022 by the authors. Licensee MDPI, Basel, Switzerland. This article is an open access article distributed under the terms and conditions of the Creative Commons Attribution (CC BY) license (https://creativecommons.org/licenses/by/4.0/).