Article

Colloid Migration as a Reason for Porous Sandstone Permeability Degradation during Coreflooding

by
Evgenii V. Kozhevnikov
1,*,
Mikhail S. Turbakov
1,
Evgenii A. Gladkikh
1,
Evgenii P. Riabokon
1,
Vladimir V. Poplygin
1,
Mikhail A. Guzev
2,
Chengzhi Qi
3 and
Artem A. Kunitskikh
1
1
Department of Oil and Gas Technologies, Perm National Research Polytechnic University, 614990 Perm, Russia
2
Institute of Applied Mathematics, Far Eastern Branch of the Russian Academy of Sciences, 690950 Vladivostok, Russia
3
Civil and Transportation School, Beijing University of Civil Engineering and Architecture, Beijing 100124, China
*
Author to whom correspondence should be addressed.
Energies 2022, 15(8), 2845; https://doi.org/10.3390/en15082845
Submission received: 9 March 2022 / Revised: 8 April 2022 / Accepted: 12 April 2022 / Published: 13 April 2022

Abstract

:
During coreflooding under stationary conditions, permeability is determined by the Darcy formula; thus, the apparent permeability is determined, which characterizes the average hydraulic conductivity of the core, but does not take into account the processes occurring at the microlevel. Transient processes during fluid injection regime change are important for understanding the evolution of permeability and underlie such phenomena as permeability degradation and its hysteresis. Our paper presents the coreflooding methodology and the results showing that during changes in injection conditions, the permeability of samples can significantly decrease due to the migration of colloids. In the developed methodology, coreflooding conditions exclude the influence of other factors on permeability, such as creep, the chemical reactions of rocks and fluids, and chemical mobilization of colloids. It has been established that the decrease in permeability occurs only when fluid is injected through the core, which is indirect evidence of pore blockage by colloids. The article also attempts to evaluate the effect of pore pressure on the sensitivity of the porous medium permeability to the amount of injected fluid. A decrease in pore pressure leads to a more intense decrease in permeability during injection, which most likely indicates additional mobilization of colloids, while the narrowing of pore channels does not affect permeability. Analysis of coreflooding results showed that porous media with lower permeability are more sensitive to colloid migration and pore pressure changes. It has also been found that the sensitivity of porous media to colloid migration is greatly affected by the pore pressure gradient, while media with higher permeability are less sensitive to colloid migration.

1. Introduction

The permeability of rocks is an important property and affects many processes of human life and determines the costs in the extraction of oil, gas and water, and in the disposal of wastewater. Determination of rock permeability takes place in special installations, in which reservoir fluids are injected through a rock sample under ideal reservoir conditions, excluding the influence of various factors that can affect phase permeability (pure single-phase fluids are used that are chemically inert to rock minerals) and pore sizes (pore and all-round pressure are equal to natural). However, as the experience of coreflooding shows, the permeability of rocks is not constant and can irreversibly decrease during fluid injection, even under “ideal” coreflooding conditions [1]. Further, the permeability hysteresis appears when the pore and effective pressures change [2].
The main reason for the decrease in permeability is a decrease in the size of the pore channels and an increase in the hydraulic resistance to the fluid flow. There are many reasons why pores narrow and, by nature, they can be attributed to chemical, physical, mechanical factors, etc. The influence of chemical and physical mechanisms is due to a change in the reservoir thermobaric conditions, gas release from oil, water breakthrough, chemical reactions between reservoir fluids and fluids used during injection or well interventions. The mechanical ones include elastic and plastic rock deformations of porous rocks and pore narrowing, with a change in effective pressure during reservoir depletion [2,3,4,5,6,7,8,9,10,11,12,13,14,15,16,17,18,19,20,21,22,23]. Furthermore, during geological processes (burial of layers) and reservoir depletion, a large number of free particles of colloidal size, from several nanometers to 1 micron, are formed inside the porous media [24,25,26,27,28,29]. Fluid filtration with colloids leads to permeability degradation of both porous [24,25,30,31,32,33,34] and fractured media [35,36,37,38].
Of all the above causes of permeability degradation, only the migration of natural colloids cannot be controlled in laboratory conditions during coreflooding. The presence of natural colloids is not considered in routine tests, and their effect on permeability is often simply ignored by many researchers and interpreted as a result of creep [6]. The literature review has shown that, basically, the permeability of porous and fractured media after the start of injection or change in conditions is determined when the pressure drop or injection rate stabilizes [6,39,40]. Before the injection is stabilized, the volume of injected fluid may exceed several tens or hundreds of sample pore volumes [41] and, in this time, colloids migrate within pores or fractures. This approach does not allow us to evaluate the contribution of colloid migration to the overall reduction in permeability after changing flooding conditions. When the effective pressure changes within the elastic deformation of the rock matrix [2,22,23], the release of colloids and their migration can also cause hysteresis of permeability.
In some studies, coreflooding and computed tomography of rock samples are carried out to determine the effect of colloids on permeability. During coreflooding, the dynamics of permeability are determined by the volume of the injected fluid together with the analysis of the concentration of colloids in the effluent [26,42,43,44]. This imposes certain difficulties; for the selection of effluent, it is necessary that the outlet line from the sample be as short as possible to avoid mixing and errors when measuring the concentration of colloids. Therefore, at all works where effluent is collected, the outlet pressure is equal to atmospheric pressure [26,31,45]. Effluent collection to determine the concentration of colloids in the presence of backpressure is currently not technically possible, so existing studies do not take into account the combined effect of changes in pore pressure and colloid migration. The use of filters at the outlet does not show the dynamics of the colloids concentration with a change in the injection rate, and it is rather difficult to estimate the amount of washed colloidal particles, especially if the size of the colloids is several tens of nanometers. Computed tomography, due to insufficient resolution, makes it possible to assess only a significant change in the structure of the pore volume and at a high concentration of colloids in the fluid. It is impossible to evaluate the migration of natural colloids in situ using computed tomography, since the maximum existing resolution of tomography exceeds the size of colloids by more than tens and hundreds of times [46], even at a relatively high resolution [42].
Thus, the effect of colloid migration on permeability under changing injection conditions and pore pressure can only be judged by indirect signs—by reducing permeability—but the influence of other factors, such as creep, chemical reactions, etc., should be excluded. Finally, we found only a few papers devoted to the combined effect of injection conditions and colloid migration on the hydraulic conductivity of fractured samples. In works [35,37,47,48,49], fractured samples were flooded at oscillated pore pressure and constant confining pressure; as a result, it was found that the hydraulic conductivity of fractures depends on the mobilization and movement of colloids along the fractures. Pressure oscillation leads to an increase in fracture hydraulic conductivity due to unclogging. The higher the pressure amplitude during oscillation, the more the permeability increases. A monotonous decrease in hydraulic conductivity at a constant injection rate occurs due to the fracture clogging by destroyed particles. Confining pressure oscillation leads to a decrease in the fracture hydraulic conductivity due to compaction [47].
The lack of studies on the complex effect of colloid migration on the permeability of porous media with a decrease in pore pressure determines the relevance of such studies. In this regard, the purpose of this work is to develop a methodology for assessing the impact of colloid migration on the permeability of porous rocks under non-stationary injection conditions. In the methodology, it is necessary to create conditions under which the mobilization and migration of natural colloids will occur, without the destruction of the rock matrix, chemical reactions and the creep effect. It is also necessary to compare the developed methodology with traditional stationary coreflooding and check whether other factors influence permeability degradation. The tasks are solved in the following sections.

2. Materials and Methods

2.1. Rock Samples

As samples, a core was used, obtained from oil wells of one of the fields in the Komi Republic, Russia. In total, 5 core samples were tested, obtained from a depth of 2700–2750 m from the Devonian deposit. The reservoir rocks are sandstone with a high content of quartz minerals—more than 98%. Under natural conditions, the pore pressure is 27.1 MPa and the rock pressure is 71.5 MPa. Samples have a cylindrical shape with a diameter of 3 cm and a length of 3 cm. The samples are assigned International Geo Sample Numbers (IGSN). Data on the properties of the samples and flooding conditions are presented in Table 1. Before testing, residual reservoir fluids were extracted from the samples, and the samples were dried to a constant weight.
The samples were tomographed before and after fluid injection in order to determine the presence of inhomogeneities, fractures and pore space change. The resolution of computed tomography (CT) for cylindrical specimens with dimensions of 3 × 3 cm was 20.8 μm; tomography was performed at a voltage of 130 kV and a current of 60 mA. Computed tomography showed that there were no cracks in the samples, but they had a slight layered heterogeneity parallel to the filtration axis, which generally allows us to neglect this factor.
In addition to CT, the samples were examined using a scanning electron microscope (SEM), and the results of the studies showed the presence of colloids on the mineral grains of the sample (Figure 1). The photo shows that colloids are represented by particles of various sizes and shapes. These colloids could be formed under various conditions, both as a result of geological processes—sedimentation and compaction during the burial of rocks—and in artificial ones during the manufacture of samples. On the right side of the photo (Figure 1b) the presence of clay mineral plates is shown, which can also be a source of colloids. The composition of colloids is usually similar to the composition of mineral grains and cement, which makes up the rock and is represented by various types of quartz and clay minerals [25].
From the analysis of SEM photographs obtained:
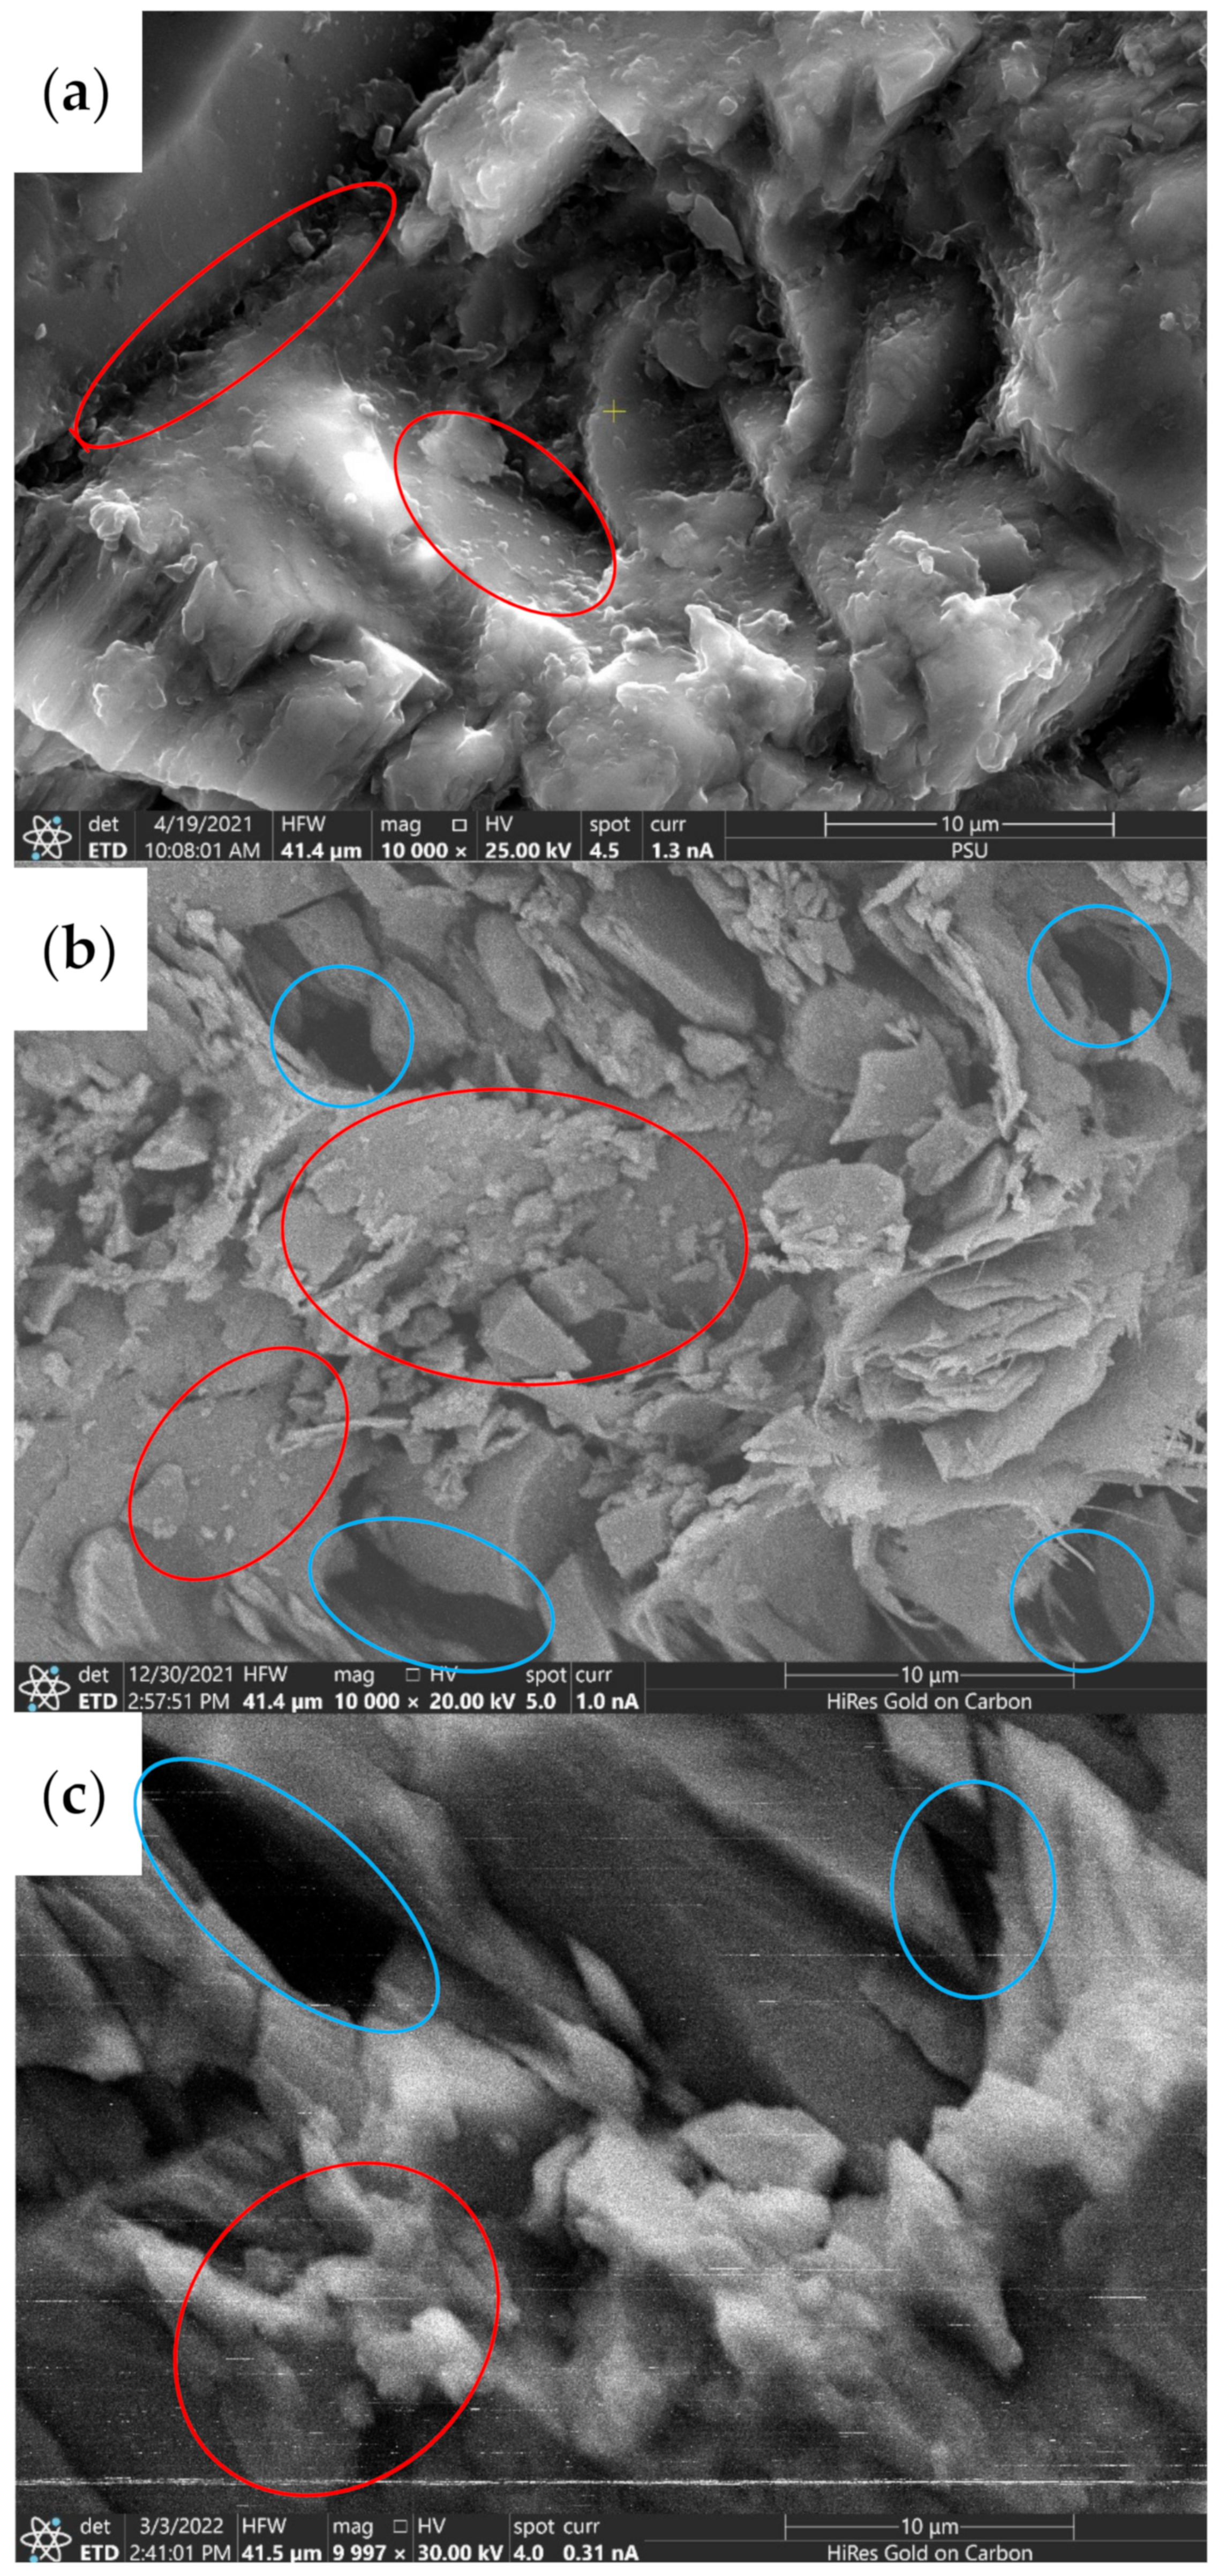
  • In the IEKEV2517 (Figure 1a) sample, which has the lowest permeability, there are no large visible pores and a large number of colloids is present;
  • Medium permeability sample IEKEV5602 (Figure 1b) has large visible pores and a large number of colloids of various sizes from large to small;
  • In high permeable sample IEKEV5601 (Figure 1c), there are large visible pores, no colloids are observed on the grains, but there are large grain fragments.

2.2. Coreflooding

Precursor studies show [3,24,25,26,27,28,29,30,31,32,33,34,35,36,37,38,45,50,51,52,53,54,55,56,57,58,59,60] that the mobilization and migration of colloids occurs only when coreflooding conditions change, which is reflected in the degradation of permeability. Permeability degradation during colloid migration is caused by various mechanisms: straining, bridging, retention, attachment and detachment. Since the porosity of rocks is a network of channels of a complex shape, it is not possible to identify any specific mechanism for the degradation of permeability. Further, permeability degradation depends on the number of colloids in the filtered medium [33,45,50,51], the physical and chemical properties of the injected fluid [24,25,30,52,53], the size and shape of the pores [54,55] and the fluid velocity [31,33,34,51,56,57,58,59,60]. Since we cannot control the amount and composition of natural colloids and pore medium, the type of injected fluid and fluid velocity were chosen as the adjustable factors of the injection program.
Deionized water and kerosene were used as the fluid. Before coreflooding, the samples were saturated with deionized water or kerosene under vacuum for 24 h, and the type of fluid and the direction of injection are shown in Table 1. The IEKEV5602 sample was first injected with deionized water, then dried and saturated with kerosene for reverse injection; other samples were injected with one type of fluid. Coreflooding was carried out parallel to the rock layers. The samples were placed in a core holder of a filtration unit at a temperature of 25 °C, a confining pressure of 45 MPa, and a pore pressure of 18 MPa. The selected pore and confining pressures are much lower than the actual bedding conditions of the selected rocks, based on the fact that we are considering the impact of colloid migration on permeability and need to minimize the effect of deformations and creep. Studies have shown [61,62] that rocks have stress memory, which means that repeated application of a lower load than the previous load reduces the likelihood of irreversible deformations and creep. Before injection, the samples were kept at the specified pore and confining pressures for 24 h to relax stresses and reduce the likelihood of creep.
To mobilize colloids and assess the effect of their migration on permeability, coreflooding was carried out continuously with a cyclic change in the injection rate at a constant confining pressure. The program of coreflooding (cycle) is shown in Figure 2. The injection rate was changed stepwise from 1 to 5 cm3/min, and at each rate the injection lasted about 5 min and the whole cycle lasted about 2–3 h. The pore pressure during injection was determined as the average pressure at the inlet and outlet, and could vary up to 0.35 MPa from the initial value with an increase in the injection rate. A step change in flow rate is necessary for colloids mobilization, so we use several mechanisms—with an increase in injection rate, colloids are mobilized and dispersed in a fluid [63], while at a low injection rate, colloids are combined into larger agglomerates and partially clog pores, and a further increase in injection rate destroys agglomerates and carries colloids further into the pore space [63].
A coreflood was also performed in three cycles to ensure that the reduction in permeability was not due to creep. After the first cycle, the sample was held for 24 h and then flooded under the same conditions; after the second cycle, the pore pressure was reduced from 18 to 13 MPa at constant confining pressure, the sample was kept for 24 h and the third cycle was performed. For coreflooding, an Auto Flood Reservoir Conditions Coreflooding System, AFS-300 production of Core Laboratories was used (Figure 3). The unit allows one to control the conditions of coreflooding with simultaneous measurement of injection rate and pressure at the inlet and outlet of the sample, creates a confining pressure that simulates rock pressure, and maintains a certain temperature. During fluid injection, data from pressure sensors at the inlet and outlet of the sample, as well as from fluid flow sensors, were recorded at a frequency of one measurement per 3 s. Based on the obtained data on the injection rate (q), the pressure drop at the inlet and outlet of the sample (ΔP), based on the viscosity of the fluid (μ), length (L) and area (S) of the sample, the instantaneous permeability (k) was determined by Darcy’s formula:
k = μ · q · L Δ P · S
The calculated instantaneous permeability values were filtered using the MATLAB software, based on the results plots and were plotted for changes in relative permeability (k/ko, where k is instantaneous permeability, ko is initial permeability) from the volume of injected fluid, expressed in the number of pore volumes (V/Vp, where V is the volume of the injected fluid in cm3, Vp is the pore volume of the core sample).
During injection, the fluid rate was as a control parameter, and since the samples have different porosity and permeability, for a comparative assessment, the average fluid velocity (ν) through the core samples was used, which was determined by the formula:
ν = q m · S
where (m) is porosity.
Another important parameter affecting the permeability sensitivity to colloid migration is the pressure gradient [42,50], which is defined as the ratio of the pressure drop across the sample to the sample length. In our case, all samples have the same length—30 mm. Therefore, the maximum pressure drop on the sample during the coreflood cycle can be used for comparison—ΔPmax.
Unfortunately, the effluent concentration was not determined due to the difficulty of accurate sampling of the leached fluid at the unit used; however, sampling and their analysis are necessary to clarify the amount of material removed, and this issue requires additional study and is the task of subsequent research.

3. Results and Discussion

3.1. Injection of Deionized Water

As numerous studies have shown [24,31,33,35,36,37,58], a change in the injection rate leads to the release of colloids, which can be located on the walls of the pores, strained at pore throats, bridge clogged, or lying in stagnant zones. The release of colloids is indicated by a change in the concentration of colloids in effluents washed out of the porous medium, a change in the geometry of the pore space, and a change in hydraulic conductivity—permeability. In our case, we judge the migration of colloids by the decrease in the permeability of the samples during the injection of a clean fluid.
At the first stage of research, samples IEKEV2517, IEKEV5602 and IEKEV7483 after vacuum saturation were flooded with deionized water for one cycle, as a result of which, the decrease in the permeability of the samples ranged from 14 to 50% (Figure 4). The decrease in the samples’ permeability occurred in different ways. In the samples IEKEV2517 and JEKEL 7483, the change in permeability occurred unevenly, while in the sample IEKEV5602, linearly.
The overall decrease in the permeability of the IEKEV2517 sample was about 14%, from 0.854 to 0.768 mD. The sample had a relatively low permeability and during injection, the maximum pressure drop across the sample was 6 MPa, which is a rather high value. The change in permeability at such a high pressure drop, in addition to the migration of colloids, could be influenced by the opening of micro- and macro-fractures, as evidenced by the clear dependence of permeability on changes in the injection rate (Figure 4a). A change in the structure of the pore space was also revealed during CT, the results of which are presented in Section 3.3.
During the flooding of samples IEKEV7483 and IEKEV5602, the pore pressure at the maximum injection rate increased by no more than 0.35 MPa relative to the initial value, while the effective pressure changed by less than 1.5%, which is an extremely low value, at which the effect of microfracture deformation on permeability is unlikely [35]. Local impulse changes in permeability on the graphs (Figure 4), coinciding with a change in the injection rate, are associated with transient conditions and do not reflect the overall change in permeability and can be neglected.
The IEKEV7483 sample is characterized by high permeability; therefore, a small pressure drop is observed—0.05 MPa. The total decrease in the permeability was about 25%, from 48 to 36 mD (Figure 4b). With a small pressure drop, the permeability becomes more sensitive to changes in fluid velocity, as can be seen in the permeability step change. The higher the fluid velocity, the smaller the permeability change step we observe. In this case, as the fluid velocity decreases, colloid retention mechanisms prevail over colloid entrainment, which may be the result of colloid attachment to the pore walls [45]. The step change in permeability can be explained by the cyclic change in fluid velocity, which leads to the cleaning of pores. In [37], it was found that the greater the amplitude of the fluid velocity change, the better the pores are cleaned and the permeability increases. Cleaning the pores leads to the colloids’ mobilization, and a decrease in the fluid velocity leads to the formation of agglomerates and clogging of pores [63].
For sample IEKEV5602, the largest decrease in permeability was observed—up to 50%, from 10 to 5 mD. Significant degradation of permeability occurs at the beginning of the injection cycle, then the change in permeability stabilizes and becomes almost linear (Figure 4c). The pressure drop through the sample was 0.35 MPa and no stepwise change in permeability was observed, and along with the change in fluid velocity, the slope of the permeability curve also changed. At high fluid velocities, the permeability decreases more slowly than at low velocities (Figure 5). This suggests that at high fluid velocities, mobilization and entrainment of colloids prevail over retention. It can also be argued that the decrease in permeability in sample IEKEV5602 is not a consequence of bridging, but is due to the attachment of colloids to the pore walls. The absence of a bridging mechanism can also be associated with a large pore size in relation to the size of colloids and their low concentration [64].
A similar change in permeability due to colloid migration, as in samples IEKEV7483 and IEKEV5602, is described in some works [26,45,59]. In [26], it is shown that when high-porosity sandstone samples are flooded with clean water, the decrease in permeability at a high fluid velocity occurs less intensively than at a lower velocity. It also noted that the main decrease in permeability occurs at the beginning of injection, while the concentration of colloids in the effluent is maximum. In [45], on a soil model, it was found that with a stepwise increase in fluid velocity, the permeability first decreases and then increases, which indicates the cleaning of pores and the removal of colloids. In [59], the flooding of Berea sandstone cores, 0.4 and 4.5 cm long, was carried out with fresh and slightly saline water. During injection, the permeability decreases. A change in fluid velocity leads to a decrease in permeability, but then stabilizes.
In addition, permeability degradation can occur due to creep. To assess the effect of creep on the change in permeability after the first injection cycle, the IEKEV5602 sample was left in the core holder for 60 h at a constant pore and confining pressure, and after exposure, more than 100 pore volumes were injected at rates of 1 and 2 cm3/min (Figure 4). It is seen that, at the beginning of injection, after a pause, the permeability has a slightly higher value than at the end of the previous injection cycle, which can most likely be explained by disturbances and the occurrence of counter flows inside the sample during exposure. A similar phenomenon was observed later on other samples during kerosene injection and is especially pronounced when the pore pressure changes. Figure 4c also shows that when injection is resumed, the decrease in permeability at the beginning occurs quite intensively, as in the first cycle, but tends to stabilize. When the flow rate was increased to 2 cm3/min, the permeability slightly increased and immediately stabilized. In this case, the mobilization and retention of colloids are equivalent to each other, or colloids migration has completely stopped [65].
The degradation of sample permeability during injection of deionized water can be caused by the following reasons: (1) Migration of natural colloids, including dispersed clay minerals. Analysis of SEM photographs (Figure 1) showed the presence of a sufficiently large number of colloids on the walls of the core sample, while the colloids are much smaller than the pore size. Further, the interaction of deionized water with clay particles can lead to their dispersion and migration. (2) During CT analysis, it was found that all samples contain a small amount of pyrite, which can interact with deionized water and form insoluble colloids of iron hydroxide. Due to the fact that we are only interested in the migration of natural colloids without chemical processes and the interaction of clay with water, we chose kerosene for further injection, since kerosene is inert to clay minerals and pyrite.

3.2. Injection of Kerosene

The results of kerosene injection are shown in Figure 6. Despite the fact that we used pure kerosene for injection, the decrease in permeability of the core samples ranged from 15% to 45%. In the IEKEV5600 sample (Figure 6a), after all injection cycles, the permeability decreased by approximately 46%, from 25.1 to 14.2 mD. The greatest decrease in permeability was observed in the second and third cycles. The maximum pressure drop across the sample increased from 0.14 MPa in the first cycle to 0.17 MPa in the third cycle. After the second cycle, a significant change in injection conditions occurred due to the emergency release of pore and confining pressures to 0 and 3 MPa, respectively. After the pore and confining pressures were raised to 13 and 45 MPa, respectively, the sample was held for another 24 h before the third injection cycle. This incident led to dramatic consequences, as a result of which, in the third injection cycle, the permeability curve became stepped, and the decrease in permeability was more intense than in previous injection cycles. The release of pressure could lead to several consequences—a change in the size of the pore channels due to plastic deformations and the release of colloids due to elastic and plastic deformations. However, no narrowing of the channels due to plastic deformations was noted. This conclusion was made based on the fact that the decrease in permeability occurred only when the fluid was injected during a cycle that lasts about 2–3 h. If the narrowing of the channels really occurred, then after 24 h pauses, the permeability at the beginning would be less than at the end of the previous cycle, but in our case, we observed the opposite. In addition to plastic, elastic deformations can also lead to the appearance of a large number of free colloids in a porous medium [28]. Most likely, the elastic deformation of the core led to the release of colloids and this was reflected in the change in permeability in the third injection cycle.
In the IEKEV5601 sample (Figure 6b), after all injection cycles, the permeability decreased by approximately 28%, from 25.1 to 18.2 mD. In the first injection cycle, the largest decrease in permeability occurred—about 20% in the first 20 pore volumes—then in the second and third cycles, the decrease in permeability occurred very slowly, in each case, about 5%. After the decrease in pore pressure, there were no significant changes in permeability in the third injection cycle, which allowed us to conclude that the pore space of the sample was not deformed, and the colloids were not mobilized. The slight decrease in permeability during injection is probably due to several factors: firstly, the fluid velocity is insufficient to mobilize colloids, which is also confirmed by the relatively small maximum pressure drop across the sample, which varied from 0.08 to 0.09 MPa; secondly, the sample has layered heterogeneity and contains highly permeable pore channels, which are not significantly affected by colloid migration [55,64].
After all injection cycles, the permeability of the IEKEV5602 sample decreased by approximately 13%, from 8.1 to 7.1 mD. The maximum pressure drop across the sample increased from 0.18 MPa in the first cycle to 0.23 MPa in the third cycle. The change in the permeability of the IEKEV5602 sample is quite interesting (Figure 6c). In the first injection cycle, the permeability first increased and then decreased. This is due to the fact that the IEKEV5602 sample was previously flooded with deionized water in one direction, then dried, saturated with kerosene and flooded in the reverse direction. The reverse fluid injection leads to erosion of the internal filter cake and mobilization of colloids and, as a result, the permeability first increases and then decreases [31]. In the first injection cycle, the proposed predominant permeability reduction mechanism is bridging. This conclusion can be drawn because several factors are observed: the presence of a large number of colloids and the high fluid velocity. At the beginning of the reverse injection, the internal filter cake is eroded and, thus, a large number of colloids is released into the sample, and the permeability increases during the first 20 injected pore volumes. Further, with a stepwise increase in fluid velocity, the instantaneous permeability decreases, and with a decrease in velocity, the permeability, on the contrary, increases. This corresponds to the conclusion that the efficiency of colloid retention by bridging increases with increasing fluid velocity [31,34,51]. Sample IEKEV5602 also showed the highest permeability degradation in the third injection cycle, after pore pressure reduction (Figure 6c). At the beginning of the third injection cycle, the permeability was relatively high, but rapidly decreased during the first 10 pore volumes. The permeability curve has a steeper slope, which is probably due to the additional colloid mobilization. Deformation of the pores also cannot be distinguished.
The core flood with kerosene allowed us to consider the following general observations for all samples:
(1)
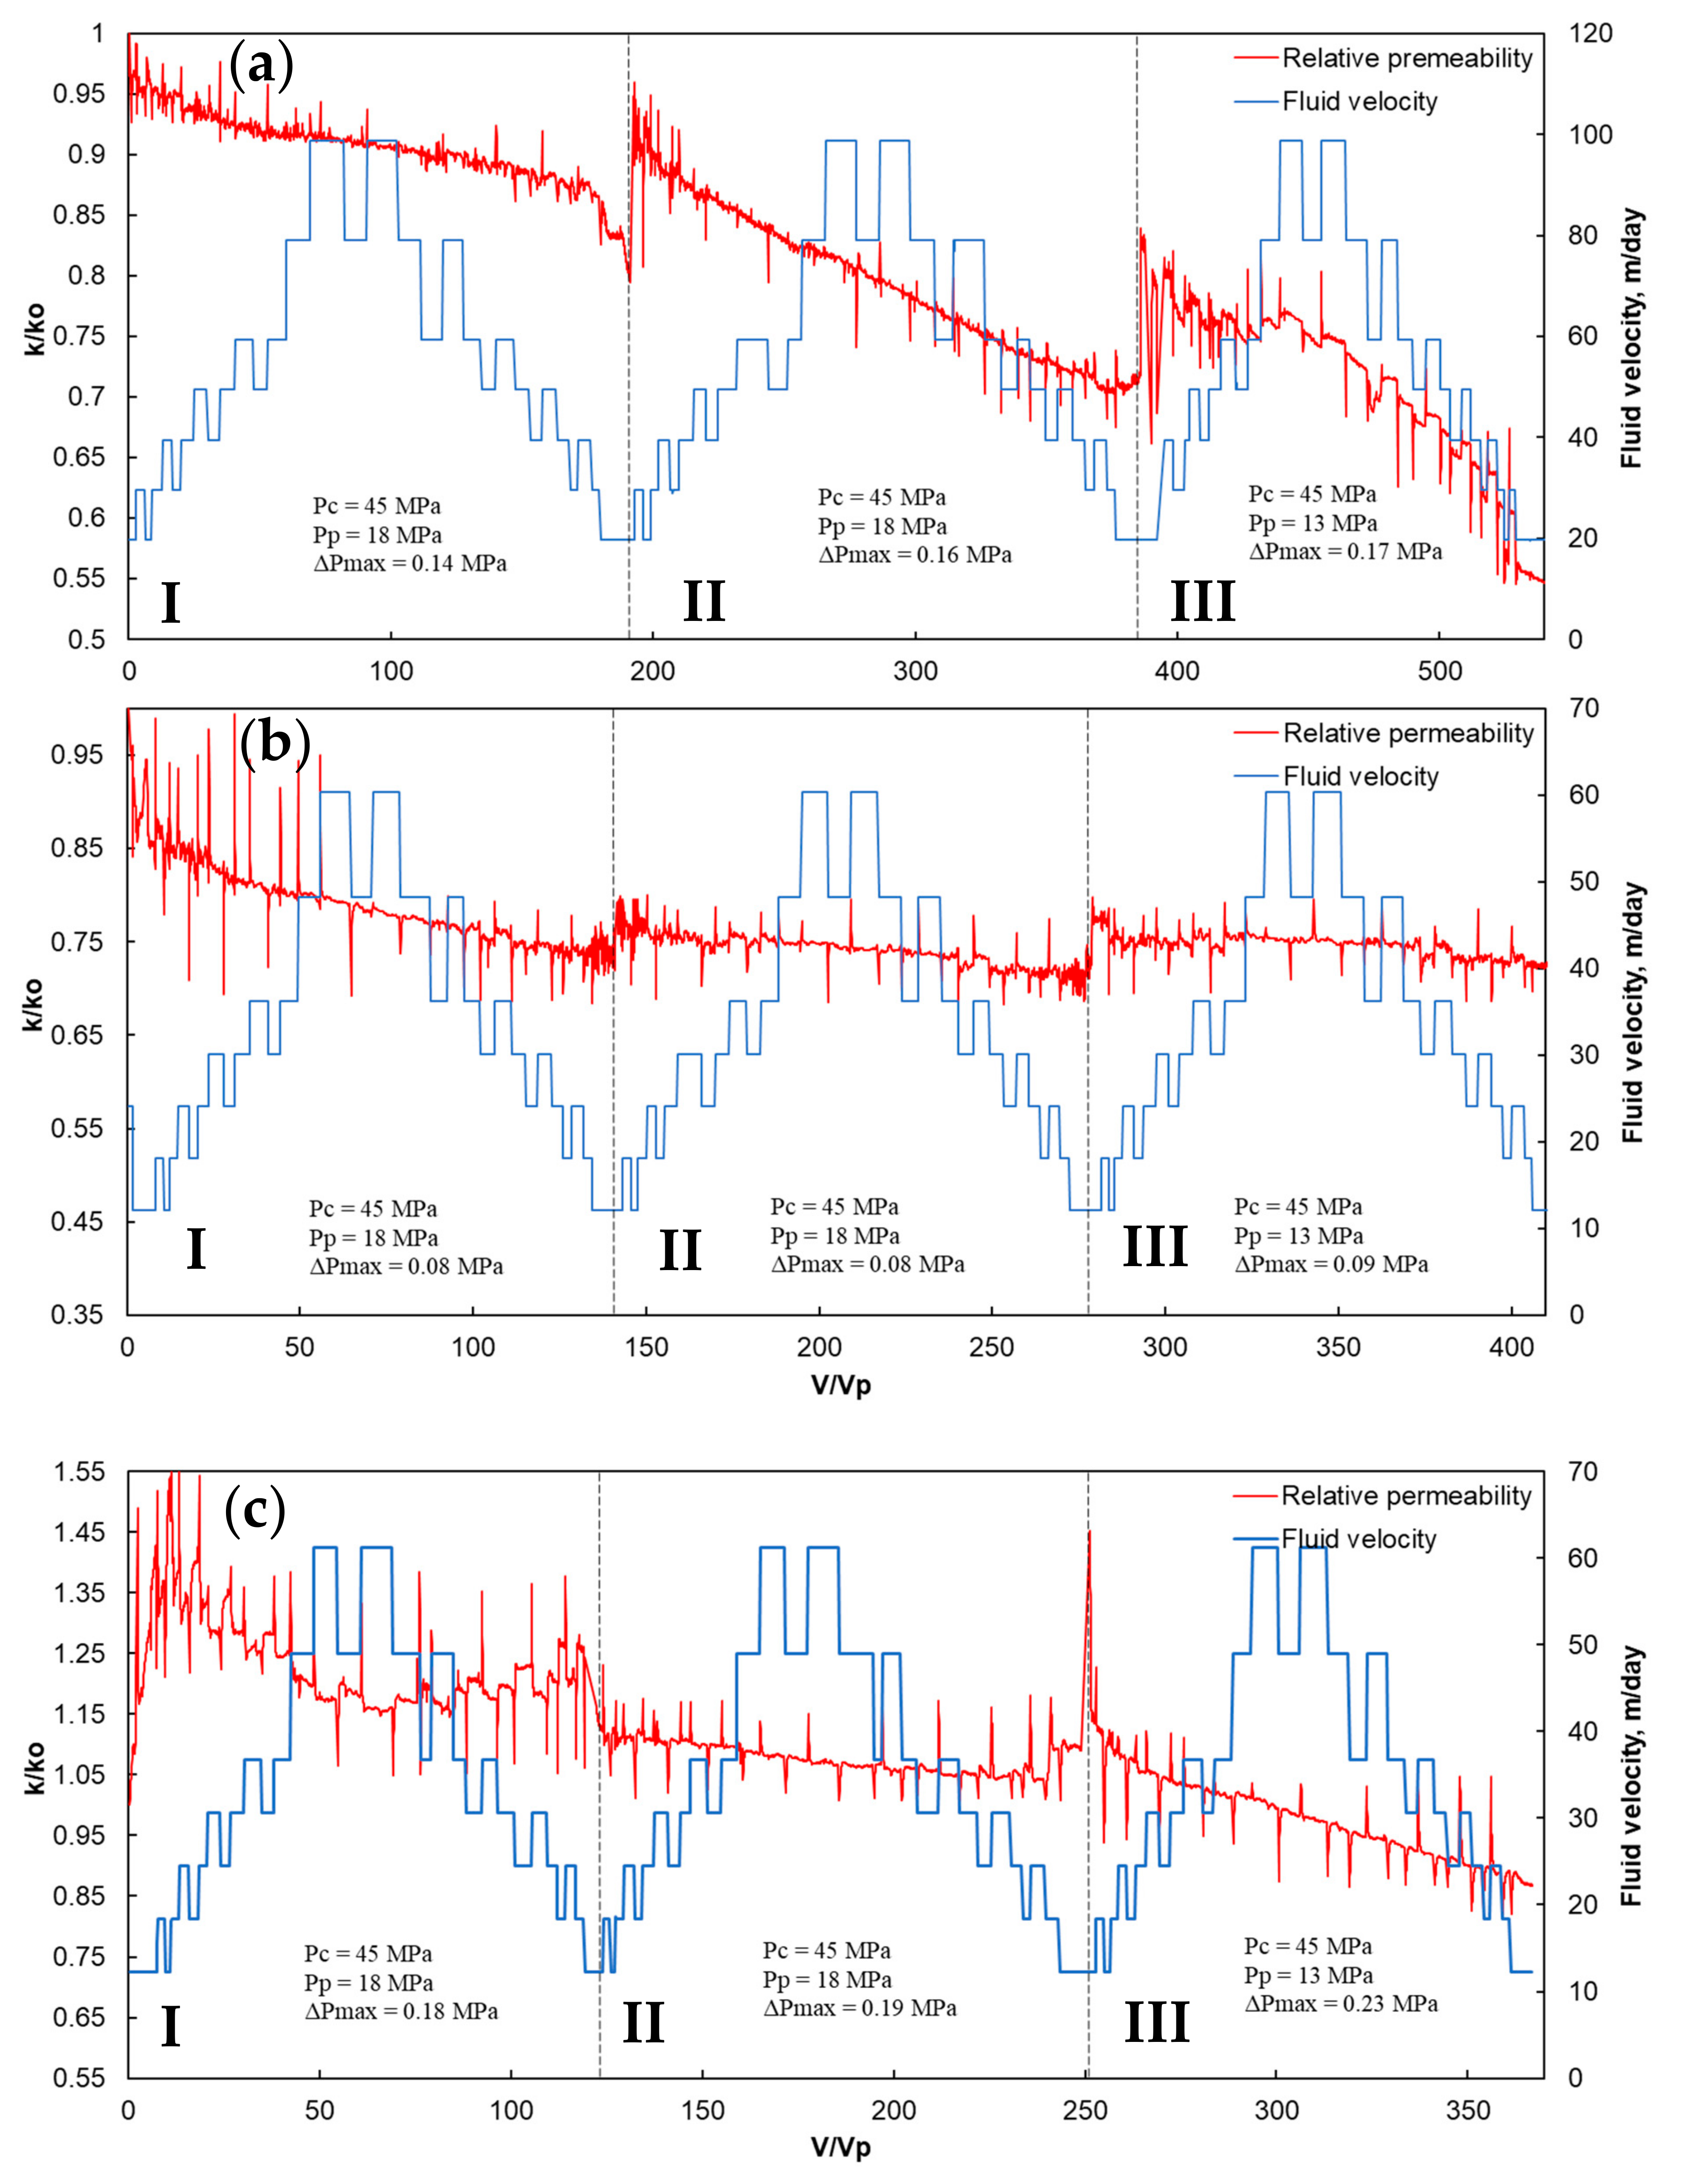
It has been established that, in general, the permeability of the core decreases only when fluid is injected through the samples, which is direct evidence that the fluid flow causes pore blockage, and this can only occur due to the presence of natural colloids located inside the rock and not because of plastic deformations or creep.
(2)
Injection of a large volume of fluid can also lead to pore unclogging and colloid removal from the rock. This would naturally lead to an increase in the permeability of the rock [50]. However, in our case, the permeability was constantly decreasing. The rate of washout depends on fluid velocity, colloid and pore size, core size, etc. In some cases, washout of colloids and increase in permeability can occur within a few hours, as in the example of [50], where a highly porous soil model was used. In low-porosity and low-permeability media, colloids can be washed out for quite a long time. Using the example of [58], it is shown that even with a small core size of 4 mm in length, the permeability decreased for more than 8 h of waterflooding. In our case, the decrease in permeability occurred constantly throughout all flooding cycles, which indicates a fairly large number of colloids and a low speed of their movement [57,58].
(3)
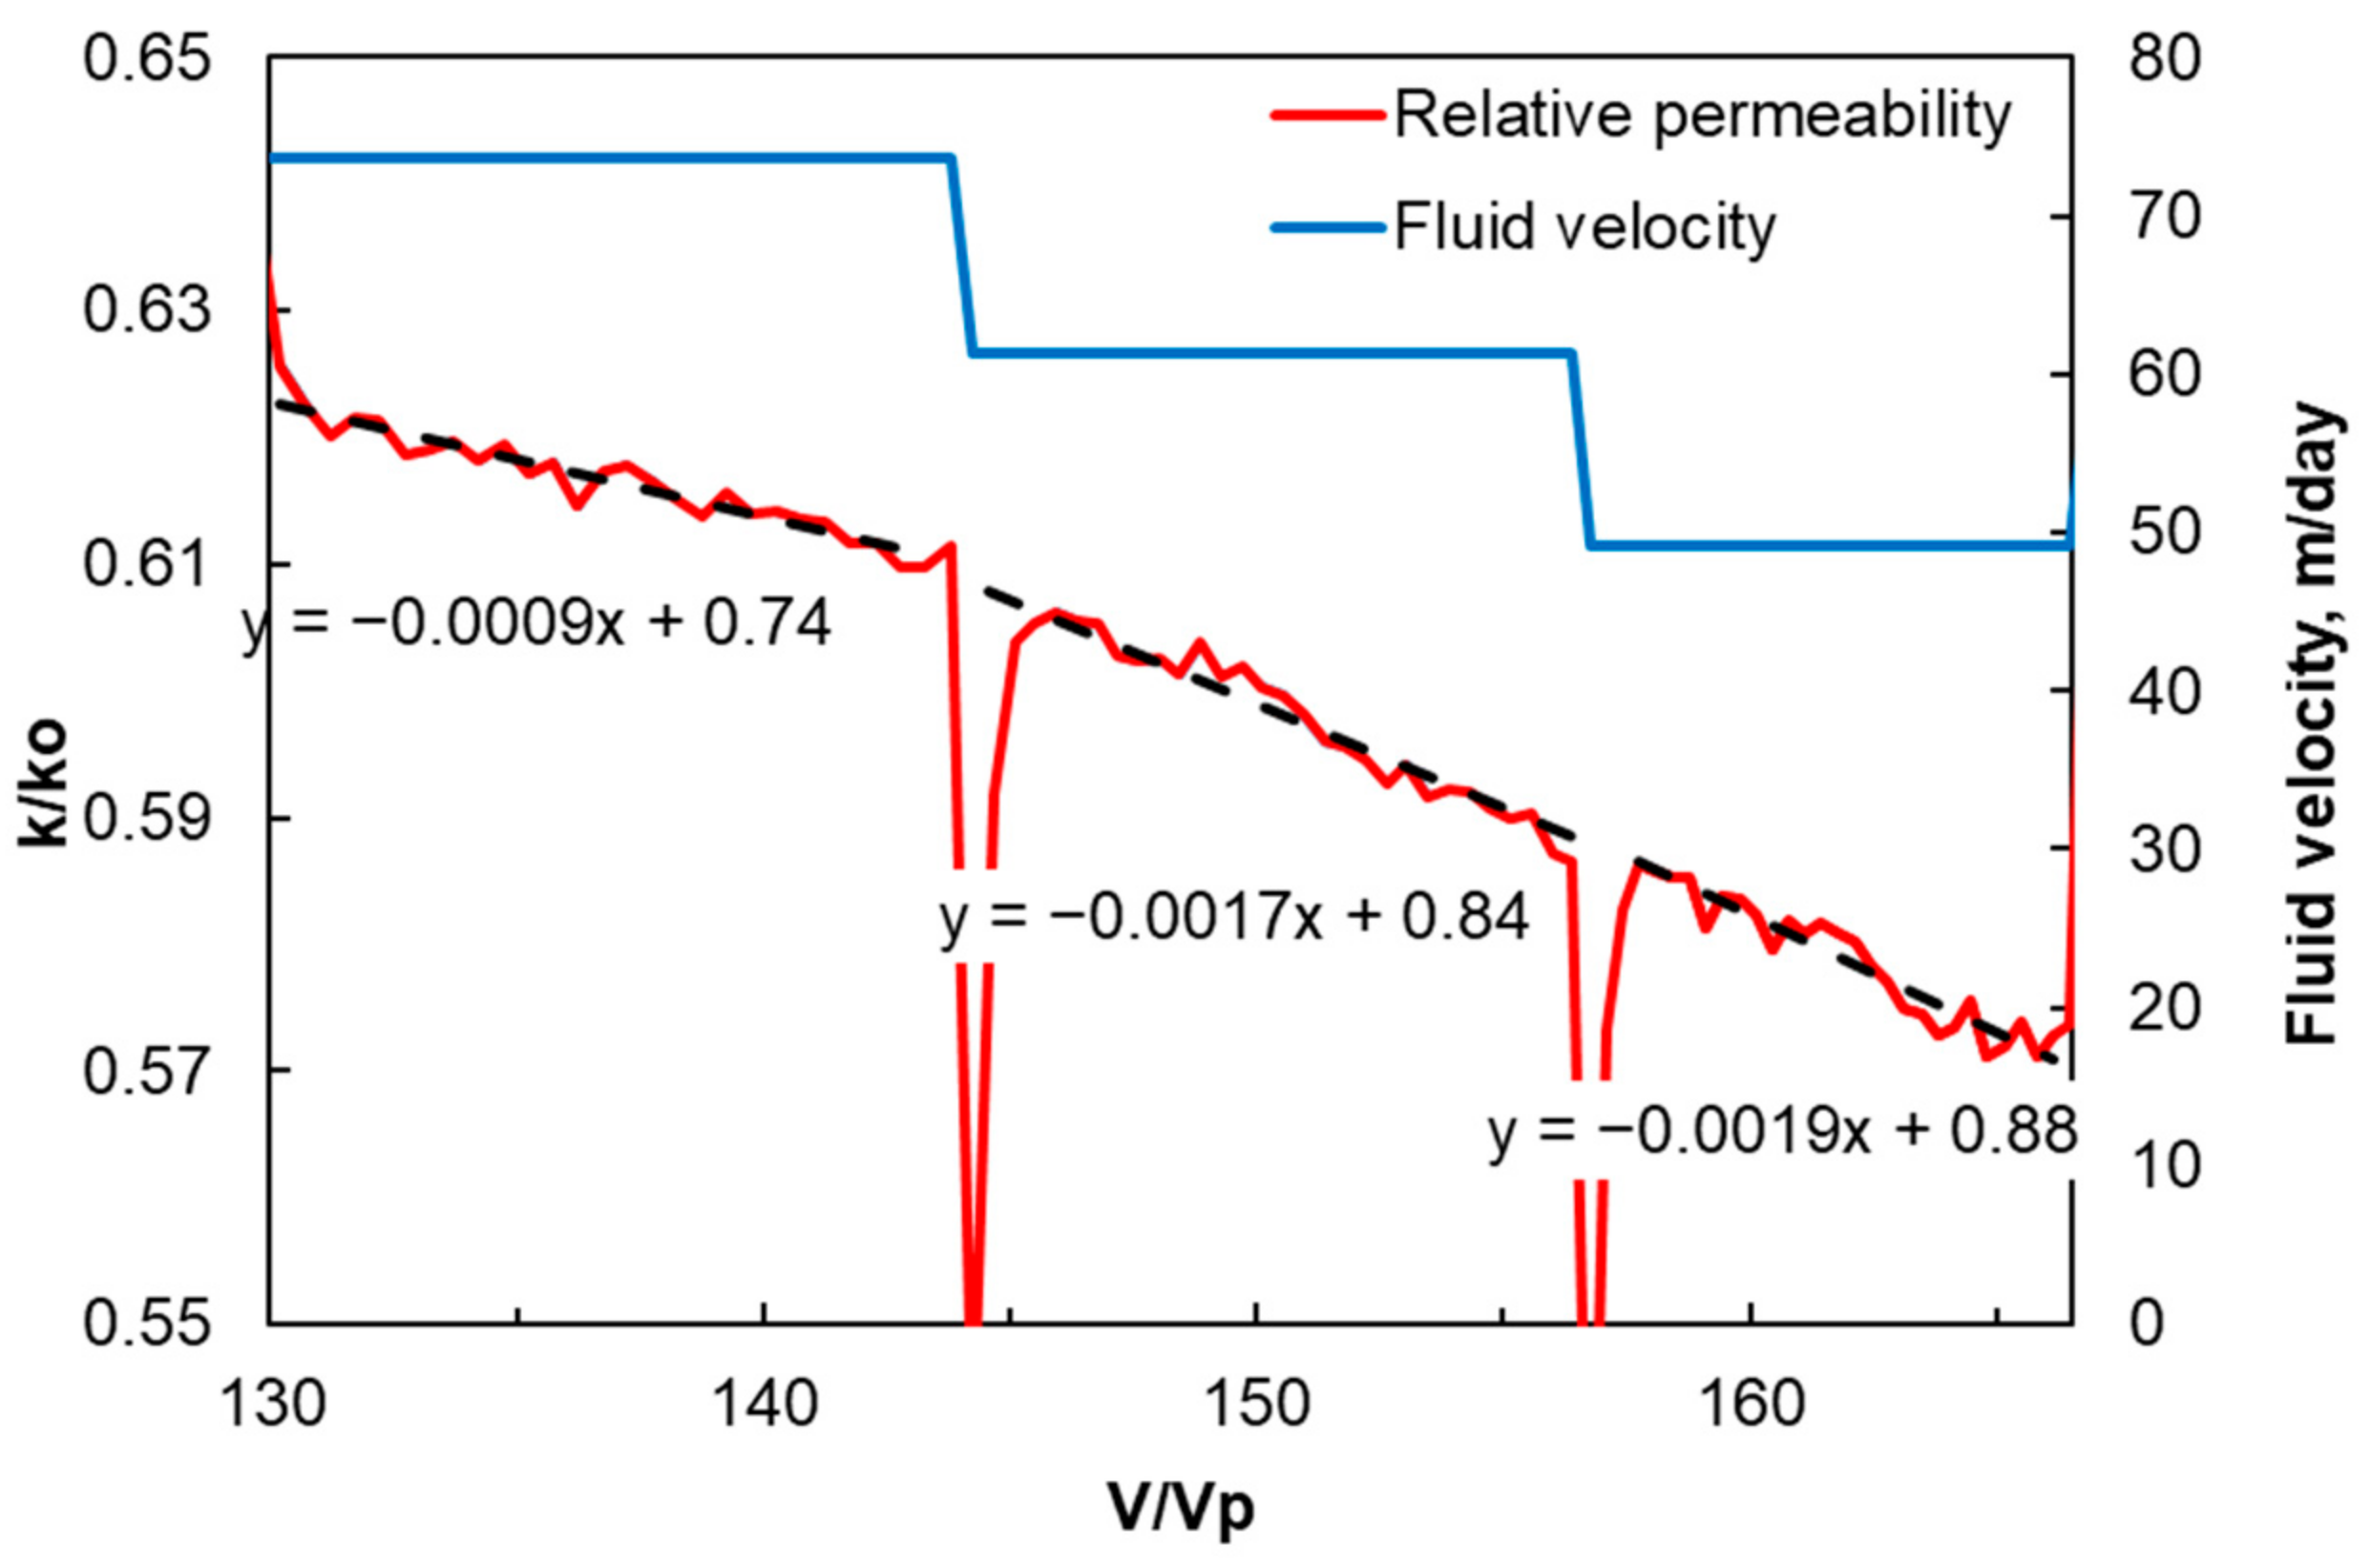
In all samples, at the beginning of a new injection cycle, increased permeability was observed, relative to the end of the previous injection cycle. This can most likely be explained by counter flows inside the sample when the sample is kept under pressure without injection. Counter flows occur due to temperature fluctuations (within 2–3 degrees) inside the laboratory and in the hydraulics of the filtration unit. The largest difference in permeability is observed between cycles 2 and 3. This can be explained by the possible reverse flow in the sample when the pore pressure is released both through the inlet and outlet lines. The reverse flow, even at a low flow rate and volume, can significantly change the permeability of a porous medium [31].
(4)
The decrease in pore pressure had the greatest effect on the change in the permeability of sample IEKEV5602, which had the lowest absolute permeability. Although samples IEKEV5601 and IEKEV5600 had approximately the same properties, their permeability decreased differently, caused by different fluid velocities. The decrease in pore pressure had the least significant effect on the permeability of sample IEKEV5601, which had a lower fluid velocity than sample IEKEV5600. In general, it can be concluded that a decrease in pore pressure can lead to a more intense decrease in permeability, but it is also obvious that this decrease depends on the fluid velocity in the sample.

3.3. CT Results

During CT of the samples, images of the void space (Figure 7a,b) and pore size distribution (Figure 7c) were obtained, and the qualitative change in the void space was determined after fluid injection. It was found that significant change in the pore space occurred only in the IEKEV2517 sample (Figure 7), in which, during fluid injection, the pressure drop between the inlet and outlet was about 6 MPa. An increase in the opening of pores, in the central part of the IEKEV2517 sample, and closure of pores closer to the sample’s surface, were also revealed. An analysis of the pore size distribution of the IEKEV2517 sample (Figure 7c) showed that the number of pores in the size ranges of 46–254 µm, 300–347 µm, 370–393 µm and 416–439 µm increased after coreflooding. At the same time, the number of pores in the size ranges of 23–46 µm, 254–300 µm, 347–370 µm, 393–416 µm, 439–531 µm decreased after coreflooding. Finally, in the sample IEKEV2517, the average pore openness increased by 5.76% after fluid injection. Figure 7b shows that there is a general smoothness in the big pores after flooding, while the large pores became less pronounced due to their partial clogging. In other samples, the change in the pore space after fluid injection was not observed, and the change in the average pore openness was within the measurement error.
The information about the pore medium structure obtained from SEM made it possible to draw a conclusion about the effect of colloid migration on the permeability during coreflooding. The dependences of permeability degradation on the pore size distribution obtained from CT were not estimated because of the following reasons: firstly, the samples have a high layered heterogeneity, parallel to fluid injection; secondly, the tools used (including CT and SEM) do not allow one to estimate the number and size of colloids that are in the pore medium in a free state; thirdly, the insufficient resolution of CT did not make it possible to detect pores smaller than 46 μm, although pores of this size are visible in SEM photographs (Figure 1b,c).

4. Conclusions

The literature review showed that, despite the huge number of works studied separately, the effect of colloids and effective pressure on permeability, and their combined effect on the permeability of porous media are not considered due to some difficulties in assessing the amount of washed-out colloids with a change in pore pressure. In this regard, we have developed a method for assessing the effect of colloid migration on the permeability of porous rocks under non-stationary injection conditions. The developed method was tested on the example of quartz sandstone samples, obtained from oil wells in one of the fields in the Komi Republic, Russia. The developed methodology was compared with traditional stationary coreflooding and it was found that the developed methodology excludes the influence on the permeability of such factors as destruction of the rock matrix, chemical reactions and the creep effect.
Coreflooding, according to the developed methodology, showed a significant degradation in the permeability of porous media due to the migration of colloids. With several injection cycles, it was found that the permeability of the samples decreases only as the fluid moves through them. This suggests that permeability degradation and its hysteresis are not always the result of creep. Therefore, researchers need to consider this phenomenon when determining the effect of effective pressure on permeability.
A decrease in pore pressure increases the sensitivity of the permeability to the volume of injected fluid, which most likely indicates additional mobilization of colloids, while the narrowing of the pore channels does not greatly affect the permeability, as evidenced by the fact that, after a decrease in pore pressure, the permeability of samples at the beginning of the cycle is slightly higher than at the end of the previous injection cycle.
Coreflooding also showed that the sensitivity of porous media to colloid migration is largely affected by the pore pressure gradient. Other things being equal, media with higher permeability are less sensitive to colloid migration, even with a change in pore pressure, but the sensitivity increases with an increase in the pore pressure gradient. This confirms the fact that with an increase in the fluid velocity, the mobilization and migration of colloids contribute to a more intense decrease in permeability [31,34].

Author Contributions

Conceptualization, E.V.K. and E.P.R.; methodology, E.V.K.; software, E.V.K.; validation, M.S.T., E.P.R. and M.A.G.; formal analysis, C.Q.; investigation, E.A.G.; resources, V.V.P.; data curation, E.A.G.; writing—original draft preparation, E.V.K.; writing—review and editing, E.V.K., E.P.R. and A.A.K.; visualization, V.V.P.; supervision, C.Q.; project administration, M.S.T. and M.A.G.; funding acquisition, V.V.P. All authors have read and agreed to the published version of the manuscript.

Funding

This research was funded by RUSSIAN SCIENCE FOUNDATION, grant number 19-79-10034.

Institutional Review Board Statement

Not applicable.

Informed Consent Statement

Not applicable.

Data Availability Statement

The data used in the study are available at Zenodo via https://zenodo.org/record/5901177#Yigt73pByUl (accessed on 8 March 2022). Samples used in the work were assigned International Geo Sample Numbers: IEKEV5600, IEKEV5601, IEKEV5602, IEKEV2517, IEKEV7483.

Conflicts of Interest

The authors declare no conflict of interest.

References

  1. Chhatre, S.S.; Sinha, S.; Braun, E.M.; Esch, W.L.; Determan, M.D.; Passey, Q.R.; Kudva, R.A. Effect of stress, creep, and fluid type on steady state permeability measurements in tight liquid unconventional reservoirs. In Proceedings of the 2nd Unconventional Resources Technology Conference, Denver, CO, USA, 25–27 August 2014. [Google Scholar] [CrossRef]
  2. Selvadurai, A.P.S.; Zhang, D.; Kang, Y. Permeability evolution in natural fractures and their potential influence on loss of productivity in ultra-deep gas reservoirs of the Tarim Basin, China. J. Nat. Gas Sci. Eng. 2018, 58, 162–177. [Google Scholar] [CrossRef]
  3. Siqueira, F.D.; Yang, Y.; Vaz, A.; You, Z.; Bedrikovetsky, P.G. Prediction of productivity decline in oil and gas wells due to fines migration: Laboratory and mathematical modelling. In Proceedings of the SPE Asia Pacific Oil & Gas Conference and Exhibition, Adelaide, Australia, 14–16 October 2014. [Google Scholar] [CrossRef]
  4. Terzaghi, K. Principles of soil mechanics. Eng. News-Rec. 1925, 95, 987–990. [Google Scholar]
  5. Bohnsack, D.; Potten, M.; Freitag, S.; Einsiedl, F.; Zosseder, K. Stress sensitivity of porosity and permeability under varying hydrostatic stress conditions for different carbonate rock types of the geothermal Malm reservoir in Southern Germany. Geotherm. Energy 2021, 9, 15. [Google Scholar] [CrossRef]
  6. Nolte, S.; Fink, R.; Krooss, B.M.; Littke, R. Simultaneous determination of the effective stress coefficients for permeability and volumetric strain on a tight sandstone. J. Nat. Gas Sci. Eng. 2021, 95, 104186. [Google Scholar] [CrossRef]
  7. Kozhevnikov, E.; Riabokon, E.; Turbakov, M. A model of reservoir permeability evolution during oil production. Energies 2021, 14, 2695. [Google Scholar] [CrossRef]
  8. Warpinski, N.R.; Teufel, L.W. Determination of the effective-stress law for permeability and deformation in low-permeability rocks. SPE Form. Eval. 1992, 7, 123–131. [Google Scholar] [CrossRef]
  9. Li, M.; Bernabé, Y.; Xiao, W.-I.; Chen, Z.-Y.; Liu, Z.-Q. Effective pressure law for permeability of E-bei sandstones. J. Geophys. Res. Space Phys. 2009, 114, B07205. [Google Scholar] [CrossRef] [Green Version]
  10. Ghabezloo, S.; Sulem, J.; Guédon, S.; Martineau, F. Effective stress law for the permeability of a limestone. Int. J. Rock Mech. Min. Sci. 2009, 46, 297–306. [Google Scholar] [CrossRef] [Green Version]
  11. Zhang, Q.; Liu, J.; Xu, H.; Zeng, Y.; Wang, C.; Wang, L. Experimental investigation on permeability evolution of limestone caprock under coupled THM processes. KSCE J. Civ. Eng. 2019, 23, 5090–5097. [Google Scholar] [CrossRef]
  12. Nur, A.; Byerlee, J.D. An exact effective stress law for elastic deformation of rock with fluids. J. Geophys. Res. Space Phys. 1971, 76, 6414–6419. [Google Scholar] [CrossRef]
  13. Shi, L.; Zeng, Z.; Fang, Z.; Li, X. Investigation of the effect of confining pressure on the mechanics-permeability behavior of mudstone under triaxial compression. Geofluids 2019, 2019, 1796380. [Google Scholar] [CrossRef] [Green Version]
  14. Bhandari, A.R.; Flemings, P.B.; Hofmann, R.; Polito, P.J. Stress-dependent in situ gas permeability in the eagle ford shale. Transp. Porous Media 2018, 123, 1–20. [Google Scholar] [CrossRef]
  15. Liu, W.; Li, Y.; Wang, B. Gas permeability of fractured sandstone/coal samples under variable confining pressure. Transp. Porous Media 2009, 83, 333–347. [Google Scholar] [CrossRef] [Green Version]
  16. Alam, A.B.; Niioka, M.; Fujii, Y.; Fukuda, D.; Kodama, J.-I. Effects of confining pressure on the permeability of three rock types under compression. Int. J. Rock Mech. Min. Sci. 2014, 65, 49–61. [Google Scholar] [CrossRef] [Green Version]
  17. Huo, D.; Benson, S.M. Experimental investigation of stress-dependency of relative permeability in rock fractures. Transp. Porous Media 2016, 113, 567–590. [Google Scholar] [CrossRef]
  18. Kozhevnikov, E.V.; Turbakov, M.S.; Riabokon, E.P.; Poplygin, V.V. Effect of effective pressure on the permeability of rocks based on well testing results. Energies 2021, 14, 2306. [Google Scholar] [CrossRef]
  19. Kwon, O.; Kronenberg, A.K.; Gangi, A.F.; Johnson, B. Permeability of Wilcox shale and its effective pressure law. J. Geophys. Res. Space Phys. 2001, 106, 19339–19353. [Google Scholar] [CrossRef]
  20. Witherspoon, P.A.; Gale, J.E. Mechanical and hydraulic properties of rocks related to induced seismicity. Eng. Geol. 1977, 11, 23–55. [Google Scholar] [CrossRef] [Green Version]
  21. Liu, H.-H.; Rutqvist, J.; Berryman, J.G. On the relationship between stress and elastic strain for porous and fractured rock. Int. J. Rock Mech. Min. Sci. 2009, 46, 289–296. [Google Scholar] [CrossRef] [Green Version]
  22. Zheng, J.; Zheng, L.; Liu, H.-H.; Ju, Y. Relationships between permeability, porosity and effective stress for low-permeability sedimentary rock. Int. J. Rock Mech. Min. Sci. 2015, 78, 304–318. [Google Scholar] [CrossRef] [Green Version]
  23. Hu, Z.; Klaver, J.; Schmatz, J.; Dewanckele, J.; Littke, R.; Krooss, B.M.; Amann-Hildenbrand, A. Stress sensitivity of porosity and permeability of Cobourg limestone. Eng. Geol. 2020, 273, 105632. [Google Scholar] [CrossRef]
  24. Muecke, T.W. Formation fines and factors controlling their movement in porous media. J. Pet. Technol. 1979, 31, 144–150. [Google Scholar] [CrossRef]
  25. Ryan, J.N.; Elimelech, M. Colloid mobilization and transport in groundwater. Colloids Surf. A Physicochem. Eng. Asp. 1996, 107, 1–56. [Google Scholar] [CrossRef]
  26. Torkzaban, S.; Bradford, S.A.; Vanderzalm, J.L.; Patterson, B.M.; Harris, B.; Prommer, H. Colloid release and clogging in porous media: Effects of solution ionic strength and flow velocity. J. Contam. Hydrol. 2015, 181, 161–171. [Google Scholar] [CrossRef] [PubMed] [Green Version]
  27. Elkhoury, J.E.; Brodsky, E.E.; Agnew, D.C. Seismic waves increase permeability. Nature 2006, 441, 1135–1138. [Google Scholar] [CrossRef] [PubMed]
  28. DeJong, J.T.; Christoph, G.G. Influence of particle properties and initial specimen state on one-dimensional compression and hydraulic conductivity. J. Geotech. Geoenviron. Eng. 2009, 135, 449–454. [Google Scholar] [CrossRef]
  29. Valdes, J.R.; Caban, B. Monitoring the hydraulic conductivity of crushing sands. Geotech. Test. J. 2006, 29, 322–329. [Google Scholar]
  30. Khilar, K.C.; Fogler, H.S. Colloidally induced fines migration in porous media. Rev. Chem. Eng. 1987, 4, 41–108. [Google Scholar] [CrossRef]
  31. Gruesbeck, C.; Collins, R.E. Entrainment and deposition of fine particles in porous media. Soc. Pet. Eng. J. 1982, 22, 847–856. [Google Scholar] [CrossRef]
  32. Chen, C.; Packman, A.I.; Gaillard, J.-F. Pore-scale analysis of permeability reduction resulting from colloid deposition. Geophys. Res. Lett. 2008, 35, L07404. [Google Scholar] [CrossRef]
  33. Sharma, M.M.; Yortsos, Y.C. Permeability impairment due to fines migration in sandstones. In Proceedings of the SPE Formation Damage Control Symposium, Lafayette, LA, USA, 26–27 February 1986. [Google Scholar] [CrossRef]
  34. Frey, J.M.; Schmitz, P.; Dufreche, J.; Gohr Pinheiro, I. Particle deposition in porous media: Analysis of hydrodynamic and weak inertial effects. Transp. Porous Media 1999, 37, 25–54. [Google Scholar] [CrossRef]
  35. Elkhoury, J.E.; Niemeijer, A.; Brodsky, E.E.; Marone, C. Laboratory observations of permeability enhancement by fluid pressure oscillation of in situ fractured rock. J. Geophys. Res. 2011, 116, B02311. [Google Scholar] [CrossRef] [Green Version]
  36. Manga, M.; Beresnev, I.; Brodsky, E.E.; Elkhoury, J.E.; Elsworth, D.; Ingebritsen, S.E.; Mays, D.C.; Wang, C.Y. Changes in permeability caused by transient stresses: Field observations, experiments, and mechanisms. Rev. Geophys. 2012, 50, RG2004. [Google Scholar] [CrossRef]
  37. Candela, T.; Brodsky, E.E.; Marone, C.; Elsworth, D. Laboratory evidence for particle mobilization as a mechanism for permeability enhancement via dynamic stressing. Earth Planet. Sci. Lett. 2014, 392, 279–291. [Google Scholar] [CrossRef] [Green Version]
  38. Kluge, C.; Blöcher, G.; Barnhoorn, A.; Schmittbuhl, J.; Bruhn, D. Permeability evolution during shear zone initiation in low-porosity rocks. Rock Mech. Rock Eng. 2021, 54, 5221–5244. [Google Scholar] [CrossRef]
  39. Hu, C.; Agostini, F.; Skoczylas, F.; Jeannin, L.; Egermann, P.; Jia, Y. Transport property evolution during hydrostatic and triaxial compression of a high porosity sandstone. Eur. J. Environ. Civ. Eng. 2020. [Google Scholar] [CrossRef]
  40. Dautriat, J.; Gland, N.F.; Youssef, S.; Rosenberg, E.; Bekri, S.; Vizika-kavvadias, O. Stress-dependent directional permeabilities of two analog reservoir rocks: A prospective study on contribution of µ-tomography and pore network models. SPE Reserv. Eval. Eng. 2009, 12, 297–310. [Google Scholar] [CrossRef]
  41. Dautriat, J.; Gland, N.F.; Rosenberg, E.; Bekri, S. Stress-dependent permeabilities of sandstones and carbonates: Compression experiments and pore network modelings. In Proceedings of the SPE Annual Technical Conference and Exhibition, Anaheim, CA, USA, 11–14 November 2007. [Google Scholar] [CrossRef]
  42. Gaillard, J.-F.; Chen, C.; Stonedahl, S.H.; Lau BL, T.; Keane, D.T.; Packman, A.I. Imaging of colloidal deposits in granular porous media by X-ray difference micro-tomography. Geophys. Res. Lett. 2007, 34, L18404. [Google Scholar] [CrossRef]
  43. Huang, F.; Kang, Y.; You, Z.; You, L.; Xu, C. Critical conditions for massive fines detachment induced by single-phase flow in coalbed methane reservoirs: Modeling and experiments. Energy Fuels 2017, 31, 6782–6793. [Google Scholar] [CrossRef]
  44. Qiu, K.; Gherryo, Y.; Shatwan, M.; Fuller, J.; Martin, W. Fines migration evaluation in a mature field in Libya. In Proceedings of the SPE Asia Pacific Oil and Gas Conference and Exhibition, Perth, Australia, 20–22 October 2008. [Google Scholar] [CrossRef]
  45. Yang, J.; Yin, Z.-Y.; Laouafa, F.; Hicher, P.-Y. Analysis of suffusion in cohesionless soils with randomly distributed porosity and fines content. Comput. Geotech. 2019, 111, 157–171. [Google Scholar] [CrossRef]
  46. Kranz, R.L.; Saltzman, J.S.; Blacic, J.D. Hydraulic diffusivity measurements on laboratory rock samples using an oscillating pore pressure method. Int. J. Rock Mech. Min. Sci. Geomech. Abstr. 1990, 27, 345–352. [Google Scholar] [CrossRef]
  47. Wang, C.; Wang, R.; Huo, Z.; Xie, E.; Dahlke, H.E. Colloid transport through soil and other porous media under transient flow conditions—A review. Wiley Interdiscip. Rev. Water 2020, 7, e1439. [Google Scholar] [CrossRef]
  48. Candela, T.; Brodsky, E.E.; Marone, C.; Elsworth, D. Flow rate dictates permeability enhancement during fluid pressure oscillations in laboratory experiments. J. Geophys. Res. Solid Earth 2015, 120, 2037–2055. [Google Scholar] [CrossRef] [Green Version]
  49. Asahina, D.; Pan, P.Z.; Sato, M.; Takeda, M.; Takahashi, M. Hydraulic and mechanical responses of porous sandstone during pore pressure-induced reactivation of fracture planes: An experimental study. Rock Mech. Rock Eng. 2019, 52, 1645–1656. [Google Scholar] [CrossRef]
  50. Bjørlykke, K.; Høeg, K. Effects of burial diagenesis on stresses, compaction and fluid flow in sedimentary basins. Mar. Pet. Geol. 1997, 14, 267–276. [Google Scholar] [CrossRef]
  51. Klimenko, L.S.; Maryshev, B.S. Numerical simulation of microchannel blockage by the random walk method. Chem. Eng. J. 2020, 381, 122644. [Google Scholar] [CrossRef]
  52. Rahman, S.S.; Arshad, A.; Chen, H. Prediction of critical condition for fines migration in petroleum reservoirs. In Proceedings of the SPE Asia Pacific Oil and Gas Conference, Melbourne, Australia, 7–10 November 1994. [Google Scholar] [CrossRef]
  53. Borazjani, S.; Behr, A.; Genolet, L.; Van Der Net, A.; Bedrikovetsky, P. Effects of fines migration on low-salinity waterflooding: Analytical modelling. Transp. Porous. Med. 2017, 116, 213–249. [Google Scholar] [CrossRef]
  54. Civan, F. Non-isothermal permeability impairment by fines migration and deposition in porous media including dispersive transport. Transp. Porous. Med. 2010, 85, 233–258. [Google Scholar] [CrossRef]
  55. Parvan, A.; Jafari, S.; Rahnama, M.; Norouzi-Apourvari, S.; Raoof, A. Insight into particle detachment in clogging of porous media; a pore scale study using lattice Boltzmann method. Adv. Water Resour. 2021, 151, 103888. [Google Scholar] [CrossRef]
  56. Zamani, A.; Maini, B. Flow of dispersed particles through porous media—Deep bed filtration. J. Pet. Sci. Eng. 2009, 69, 71–88. [Google Scholar] [CrossRef]
  57. Bedrikovetsky, P.; Siqueira, F.D.; Furtado, C.A.; Souza AL, S. Modified particle detachment model for colloidal transport in porous media. Transp. Porous. Med. 2011, 86, 353–383. [Google Scholar] [CrossRef]
  58. Yang, Y.; You, Z.; Siqueira, F.D.; Vaz, A.; Bedrikovetsky, P. Modelling of slow fines migration and formation damage during rate alteration. In Proceedings of the SPE Asia Pacific Oil & Gas Conference and Exhibition, Perth, Australia, 25–27 October 2016. [Google Scholar] [CrossRef]
  59. Ochi, J.; Vernoux, J.-F. Permeability decrease in sandstone reservoirs by fluid injection. J. Hydrol. 1998, 208, 237–248. [Google Scholar] [CrossRef]
  60. Saiers, J.E.; Lenhart, J.J. Colloid mobilization and transport within unsaturated porous media under transient-flow conditions. Water Resour. Res. 2003, 39, 1019. [Google Scholar] [CrossRef] [Green Version]
  61. Im, K.; Elsworth, D.; Fang, Y. The influence of preslip sealing on the permeability evolution of fractures and faults. Geophys. Res. Lett. 2018, 45, 166–175. [Google Scholar] [CrossRef] [Green Version]
  62. Mayr, S.I.; Stanchits, S.; Langenbruch, C.; Dresen, G.; Shapiro, S.A. Acoustic emission induced by pore-pressure changes in sandstone samples. Geophysics 2011, 76, MA21–MA32. [Google Scholar] [CrossRef]
  63. Pestman, B.J.; Van Munster, J.G. An acoustic emission study of damage development and stress-memory effects in sandstone. Int. J. Rock Mech. Min. Sci. Geomech. Abstr. 1996, 33, 585–593. [Google Scholar] [CrossRef]
  64. Kermani, M.S.; Jafari, S.; Rahnama, M.; Raoof, A. Direct pore scale numerical simulation of colloid transport and retention. Part I: Fluid flow velocity, colloid size, and pore structure effects. Adv. Water Resour. 2020, 144, 103694. [Google Scholar] [CrossRef]
  65. Ramachandran, V.; Fogler, H.S. Plugging by hydrodynamic bridging during flow of stable colloidal particles within cylindrical pores. J. Fluid Mech. 1999, 385, 129–156. [Google Scholar] [CrossRef]
Figure 1. SEM of samples: (a) IEKEV2517, (b) IEKEV5602, (c) IEKEV5601. Red ovals show the places of colloids and small particles accumulation. Blue ovals show large visible pores.
Energies 15 02845 g001
Figure 2. Fluid injection program.
Energies 15 02845 g002
Figure 3. Photo (a) and schematic diagram (b) of the unit for coreflooding.
Energies 15 02845 g003
Figure 4. Change in relative permeability of samples IEKEV2517 (a), IEKEV7483 (b) and IEKEV5602 (c). The confining pressure is 45 MPa, the pore pressure is 18 MPa. (c) The dotted line shows the 60-h injection pause during which the sample was held at constant pore and confining pressures.
Energies 15 02845 g004aEnergies 15 02845 g004b
Figure 5. Change in relative permeability of sample IEKEV5602 during deionized water injection. Dashed black lines show linear approximations with equations. The slope of the permeability curve at high fluid velocity is less than at lower fluid velocities, this can be seen from the linear function coefficient, the greater the absolute value of the coefficient, the more intensively the permeability decreases.
Energies 15 02845 g005
Figure 6. Relative permeability dynamics of samples IEKEV5600 (a), IEKEV5601 (b), IEKEV5602 (c) during 3 kerosene injection cycles. Roman numerals indicate the number of injection cycles. Dashed black lines show the boundaries between injection cycles—24-h pauses, during which the sample was kept at constant temperature, pore and confining pressures without injection. Samples IEKEV5600 and IEKEV5601 were flooded in the forward direction, sample IEKEV5602 was flooded in the reverse direction from the first deionized water flood.
Energies 15 02845 g006
Figure 7. Voids in the IEKEV2517 sample, (a) before coreflooding; (b) after coreflooding. Red circles mark large voids that have undergone the greatest change after fluid injection. Shades of blue show cracks, matrix not shown; (c) pore opening distribution histogram before and after injection.
Energies 15 02845 g007
Table 1. Properties of core samples.
IGSNPorosity, %Absolute Permeability, mDFluid Type/Direction of Fluid FlowRock Type
IEKEV25177.850.98Deionized water/ForwardSlightly clayey siltstone
IEKEV560010.3147.27Kerosene/ForwardConsolidated slightly clayey sandstone (clay content less than 2%)
IEKEV56018.4552.12Kerosene/Forward
IEKEV56028.3327.97Deionized water/Forward
Kerosene/Reverse
IEKEV748310.1672.25Deionized water/Forward
Publisher’s Note: MDPI stays neutral with regard to jurisdictional claims in published maps and institutional affiliations.

