1. Introduction
The progressive reduction in fossil fuel consumption and greenhouse gas emissions is one of the main challenges of researchers and politicians within the energetic transition and, as regards the European Union, the recovery plan NextGenerationEu [
1].
Hydrogen can be considered both as an energy vector and as an alternative to battery-based energy storage within smart energy grids and distributed energy systems, despite the several issues related to its utilization [
2,
3]. Its use is mainly limited to gas turbines equipped with diffusion flame combustors, with the limits related to high nitric oxide emissions.
Indeed, the larger flammability limits and the lower ignition temperature typical for hydrogen make premixing a questionable practice.
As regards the issues related to high NO
x, dilution with steam or nitrogen can be a way to contain them, as highlighted by Chiesa et al., that studied in depth the adoption of hydrogen in gas turbine combustors, originally designed for natural gas [
4].
A redesign of industry-derived lean premixed burners can be a way to overcome these aspects: Cappelletti et al. designed a new swirler and a new fuel injection system, in order to try to balance the contrasting effects of premixing on NO
x formation and hydrogen combustion [
5].
On the other hand, the progressive introduction of hydrogen blended with methane could be a viable strategy to address a hydrogen-based economy in the low medium-term; in the meantime, technologies and infrastructures related to the adoption of hydrogen as an energy vector have to become mature.
What has been written above also applies to small scale systems, given the lower technological investments typical of this class of engines.
The introduction of hydrogen blended with methane is relevant for small-scale hybrid energy grids in which H
2 is used as an energy vector for energy storage. In this context, di Gaeta et al. proposed a smart grid consisting of solar photovoltaic panels, wind generators, a micro gas turbine, water electrolysers and a hydrogen tank. MGT was fueled by a mixture of hydrogen and methane. Results of simulations indicated that the combined use of micro gas turbines and water electrolysers with renewable sources allows one to compensate for unpredictable power fluctuations typical of un-programmable renewable sources and to reduce fossil fuel consumption, carbon dioxide and pollutant emissions [
6].
Given the high risk of damage to the MGT related to combustion anomalies, the potentialities and issues of adopting gaseous fuels with a not negligible hydrogen content are mainly studied in the literature through CFD analysis of the combustion process [
7].
Commercial MGT combustors or modified versions of the same are the main subjects of these analyses and the focus is mainly on the combustion anomalies and on the gaseous emission levels.
De Robbio studied the combustion process in a Capstone C30 RQL combustor, using two different partially premixed combustion models and comparing the results. For hydrogen–methane blends, flashback seems to occur also when hydrogen is injected into the pilot line [
8].
Regarding the can-type combustors, Meziane et al. studied an RQL type by CFD analysis for different hydrogen/methane mixture compositions [
9], while Shih et al. reported the variations on the combustion process when there is different hydrogen content mixed with methane. Their findings demonstrated acceptable performance of the combustion process at moderate hydrogen fractions, up to 50% [
10].
Tuccillo et al. analyzed the effects of different hydrogen/methane blends of two different commercial combustors: an RQL and a lean-premixed. They also highlighted the rise in combustion anomalies (i.e., flashback). The results of the CFD analysis showed that the risk of flashback is present for hydrogen concentrations greater than 10% by volume for lean premixed combustors, while RQL combustors seem to operate also at 20% by volume [
11].
Ansaldo Energia AE T100 [
12], formerly Turbec T100, is one of the most studied lean premixed micro gas turbines. Experimental data are available in the literature in the case of natural gas or methane fueling [
6,
13,
14,
15]. The use of low calorific fuels was also described, with and without modifications of the fuel feeding system [
16,
17,
18]. A micro humid air turbine, which was derived from a T100, was also experimentally investigated in the literature [
19].
The MGT behavior for hydrogen enriched fuels has been primarily analyzed by numerical analysis and few experimental data are available in the literature.
Reale et al. published experimental data regarding the response of a Turbec T100 in case of the adoption of three different hydrogen methane blends, with H
2 up to 10% by volume. They also compared emission levels with CFD numerical simulation results [
20].
As mentioned above, a combustor redesign can overcome the issues related to hydrogen addition. In this context, Cappelletti et al. proposed a new design for the Turbec T100 combustion chamber using CFD simulations. They modified the fuel injection system and the geometries in order to vary the main flows allowed to move in the flame position far from the walls. Their preliminary results did not ensure an adequately premixed flame [
21].
Devriese et al. developed a fully hydrogen 100 kW MGT combustion chamber through CFD analysis. They focused their attention on the micromix design [
22].
Alternatively, different injection strategies or steam/water addition can lead to significant improvements in terms of the risk of flashback and the increased nitric oxide emissions, without the need to redesign the combustors and the costs involved.
Indeed, Göke et al. [
23] carried out gas-fired experiments on the premixed combustion process of natural gas, hydrogen and their mixtures under different wet conditions. They also performed simulations with Cantera software. The authors noted that at wet conditions the flame speed is reduced, and the reaction rates are slower. Even though the effect of humidity is stronger for natural gas, it is possible to burn hydrogen under near-stoichiometric conditions without flashback for degree of humidity, defined as the ratio of steam to air mass flow, respectively, of 10%.
The results of their investigation highlighted that, in the presence of hydrogen, the risk of flashback was lower in the case of steam addition, even with 100% hydrogen in ultra-wet conditions. They also explained that an upper limit on the amount of steam is strictly related to the blowout limit and that it is also a function of the percentage of hydrogen and that NOx emissions are significantly reduced, while CO emissions do not seem to be noticeably affected by humidity.
Le Cong and Dagaut presented an experimental–numerical study in a fused silica jet-stirred reactor (JSR) of the oxidation of hydrogen–methane mixtures for a wide range of temperature, pressure and equivalence ratios and various mole fractions of water vapor. The presence of 10% of water in mole reduces the rate of oxidation of hydrogen and the burning velocities of hydrogen–air flames decrease with increasing water, for various equivalence ratios. In premixed flames, increased water concentration reduces flame speed, adiabatic temperature and NO
x formation. Kinetic analysis results showed that the nitric oxide reduction is due to various aspects, such as dilution, N
2 concentration reduction and thermal effects [
24,
25].
Water/steam addition can be considered as a means of increasing the admissible percentage of hydrogen also in small scale applications and, in particular, in the case of MGTs derived from Turbec T100.
Pappa et al. carried out a numerical study based on a Large Eddy Simulation (LES) of the combustion process in the case of micro humid air turbines (mHAT). Results of their simulations highlighted that water injection may contribute to increasing the allowable percentage of hydrogen, while CO and CO
2 emission levels remain similar to their baseline case, with no addition of hydrogen [
26].
In addition, Reale and Sannino analyzed the effects of a dual water and steam injection on the MGT performance and on the highest percentage of hydrogen allowed to be mixed with methane. They proposed a humidified-steam injected micro gas turbine (H-STIG) in which water was mainly injected just after the air compressor, while a small amount of water vapor was introduced directly into the combustion chamber via the fuel feeding system. With respect to the risk of hydrogen-related combustion anomalies, they proposed a diversified injection strategy. The results of the CFD simulations lead to the possibility of increasing the hydrogen percentage limit by up to 30% by volume compared to the starting point of 10% [
27].
In this work, the steam injection strategy, which was already presented in [
27], has been proposed for a simplified STIG configuration, with no water injection before the recuperator. The purpose is to investigate the effects of injection of a small amount of steam on the combustion process when steam is introduced into the fuel feeding system. The main focus is on the reduction in the risk of flashback, by identifying the maximum allowable percentage of hydrogen blended with methane for which there is no flashback. The effects of steam injection on NO
x and CO emissions have also been investigated.
The numerical approach involves both a zero-dimensional thermodynamic analysis of the MGT and a 3D CFD analysis of the combustor. The system layout and numerical modeling are outlined in
Section 2 and
Section 3, respectively, while the results of the 0D thermodynamic simulations of the energy system and the 3D CFD analysis of the combustion chamber are presented in
Section 4. Finally, the conclusions are presented in
Section 5.
2. System Layout
The reference micro gas turbine is the Turbec T100 (currently Ansaldo Energia AE T100) installed at the laboratories of STEMS-CNR (formerly Istituto Motori-CNR) of Naples, Italy.
As mentioned above, this MGT can operate with a low hydrogen content, since the maximum quantity of H
2 mixed with methane is close to 10% by volume, without any modification [
11,
20,
21].
The layout consists of a radial compressor and turbine, a recuperator, a combustion chamber, a generator, a fuel compressor and other auxiliaries.
Table 1 reports the technical data by the manufacturer [
12].
Turbec T100 has a reverse flow tubular combustor (
Figure 1). The air arrives at the inlet with an inclination of about 45°. The majority of fresh air is not directly involved in the combustion process, since about 60% of it goes through the dilution holes, the main purpose of which is to lower the temperature levels before it reaches the turbine blades. The remaining 40% of fresh air enters the liner and reaches three different swirler zones after a slight heating.
Fuel is fed through two lines: a pilot and a main. The first one ensures a steady and stable combustion, even during start up and transient conditions. Most of the fuel enters the combustion chamber through the main line: approximately 95% at full load conditions. This value is controlled in order to increase the fuel mass flow at the pilot line at part load from about 5% up to about 10% and 15% at 50% and 30% part load, respectively [
15]. The main line injectors are each located in any conduit of the first swirler.
The system layout is shown in
Figure 2. The difference between the commercial Turbec T100P and the proposed layout is solely related to the presence of steam injection in the combustor. The focus is on the effects of steam injection on the combustion process; so, the only difference between the original and the proposed layout regards this aspect, without any evaluation on how this small quantity of steam can be obtained.
The steam is injected directly into the main fuel feeding system, following the proposed modifications for the introduction of CO
2 in [
16,
17]. In these studies, in fact, Chiariello et al. presented experimental–numerical results of a T100 fed with biogas with a dual fuel approach. Following the same scheme as for CO
2, steam is injected directly into the main fuel injectors and so it enters into the main swirlers together with the fuel. No additional steam is to be added to the pilot line to ensure stable combustion under all conditions.
3. Numerical Modeling of Steam Injected Micro Gas Turbine
The numerical approach has two parts. First, a zero-dimensional thermodynamic model is used to determine the performance levels of the MGT and therefore the inlet and boundary conditions useful for the CFD analysis.
The thermodynamic model needs to consider the off-design behavior, because the introduction of steam may lead to a different behavior of each component and thus of the entire energy system.
The commercial software Thermoflex [
28], provided by Thermoflow Inc., is useful to this aim. A numerical model of Turbec T100 was validated with a set of experimental data in previous works and already used for similar applications [
27,
29], since it allows for the simulation of the off-design behavior. The compressor, turbine, heat exchanger and combustor are modeled in off-design conditions, with operating maps, equations or corrective factors. Thermoflex also allows for the consideration of the water or steam injection directly into the combustor [
28].
The introduction of rotating component operating maps (
Figure 3) is required to take into account the part load and off-design conditions, also in the case of addition of steam inside the combustion chamber. Small variations in the gas mass flows at the turbine inlet can lead to different turbine operating points and, consequently, to different matching conditions between the compressor and the turbine.
The maps are from the study [
14] and were used in previous articles [
6,
15,
27].
At the same time, the off-design behavior of the recuperator is also considered. The heat transfer is calculated using the thermal resistance scaling method [
28], which is capable of tracking changes in the heat exchanger efficiency with the load for the MGT analyzed [
27].
The main part of the numerical study concerns the CFD analysis of the combustion process by varying hydrogen content.
The combustor was discretized through a tetrahedral grid consisting of 4.7 million nodes and more than 17 million cells, as used in previous studies [
15,
17,
27]. The mesh includes the full domain considering also the asymmetry of the fresh air at the inlet. The conjugate heat transfer is included: the walls have been explicitly meshed also to consider that the air mass flow is heated by the exhaust when it passes into the liner.
The fluid domain consists in 2.94 million nodes (11.7 million cells) and the solid domain consists in 1.75 million nodes (5.64 million cells). The overall combustor volume is 0.00702 m3, owing to a length of 0.356 m and a diameter of 0.184 m, and consequently the cell mean volume is 4.04 × 10⁻¹⁰ m3 and the minimum value is equal to 1.68 × 10⁻¹⁴ m3.
A local refinement is provided in zones of specific interest as conduits, injectors, etc.
Figure 4 reports an axial bidimensional view of the computational grid.
The CFD analysis is carried out by the adoption of the commercial software ANSYS CFX v. 2021 R1 by ANSYS, Canonsburg, PA, USA [
30].
The turbulent flow is evaluated using the RANS bsl Reynolds Stress Model (RSM), which includes the effects of streamline curvature and results more appropriate with respect to other RANS models, especially in the presence of free shear flows with strong anisotropy, such as the strong swirl component, since it includes the effects of streamline curvature [
31,
32,
33].
The interaction between turbulence and chemistry is modelled by combined finite rate chemistry and eddy dissipation model [
30].
The kinetic mechanisms are a three-step oxidation mechanism for methane–air, where CO oxidation is also present, developed for lean premixed combustion in industrial gas turbine engines by Novosselov and Malte (Equations (1)–(3)) [
34].
In this mechanism, exponentials of the reaction rates are a function of the pressure.
In addition, the CFX embedded one-step hydrogen–air mechanism and water shift reactions are also considered. In particular, hydrogen–air considers a single-reaction step with the choice of the Eddy Dissipation combustion model, while for the water shift reactions CFX uses the corrected coefficient provided by Westbrook and Dryer [
30,
35].
A comparison with experimental data has been carried out in previous works using the same mesh, kinetics and turbulence model. The results of the numerical–experimental comparison showed that, in the case of adoption of pure methane or natural gas, this numerical approach allows for qualitative monitoring of the fluctuation of gaseous emissions with load decreasing, from 100% to 30% [
15]. Further studies have also been conducted in the case of mixtures of natural gas and CO
2 [
17].
These factors allow for the consideration of this numerical approach for investigating a combustion behavior not yet experimentally analyzed, in order to provide useful preliminary information to improve the operating domain of this type of combustor.
4. Results
The results of the 0D thermodynamic simulations account for two constraints, in addition to those imposed by operating maps: a turbine outlet temperature limit (close to 918 K), as provided by the T100 control system [
6,
27], and a limit on the maximum value of fuel mass flow allowed in the main injector.
The above-mentioned experimental campaigns carried out on low heating value fuels [
16,
17] highlighted that the Turbec T100 combustor can operate at a higher fuel mass flow than those of the design, also close to 12 g/s at 64,000 rpm, which is about 91% of nominal rotational speed. Once this value is known, it can be set as the upper limit of the fuel and steam mass flow, in order to take into account any constraints relating to the geometry of the injection ducts.
At 91% of nominal rotational speed, the fuel distribution between the main and pilot lines is set at 7% for the pilot, according to experimental data [
15].
The variable , defined as the ratio between the steam mass flow and the fuel mass flow, , is introduced in order to compare the differences within the behavior of the combustion process both with and without the addition of steam.
Simulations were carried out, for each fuel composition, by increasing to identify its value for which the temperature and emission profiles showed no flashback.
4.1. Boundary Conditions of CFD Analysis by Varying Hydrogen and Steam Content
Inlet and boundary conditions of the CFD analysis are results of the above-mentioned thermodynamic analysis.
Table 2 presents the fuel mass flow and composition, while the air mass flow, temperature and pressure and the main performance parameters of the MGT are shown in
Table 3.
In these tables the results of numerical simulations are reported, describing, for each fuel composition, the dry case (a), corresponding to , and a case with steam addition (b), which corresponds to the lower value of for which CFD simulations do not show flashback.
Cases “c” (3c and 4c, in italics in
Table 2 and
Table 3) are referred to a lower rotational speed, since the steam and fuel mass flow overcomes the above-mentioned constraints in cases 3b and 4b. Therefore, in these cases the mass flows, pressure and net power are smaller than the other eight.
Case 3c is at 88.6% of the nominal speed, corresponding to a net power of about 73 kW, while the latter case is at 85.7% of the nominal speed for a net power of 60.3 kW and a net electrical efficiency of 25.9%.
In addition,
Table 3 shows the net power, global efficiency
, defined as
, thermal input power and rotational speed.
The net electric power
Pnet considers also the presence of auxiliaries, as experimentally defined in [
6], and the power consumption of the fuel compressor.
4.2. Results of CFD Analysis: Temperature Profiles
Temperature profiles and indices can help to individuate the anomalies of combustion (i.e., flashback) occurring in the main swirler conduits.
Figure 5 and
Figure 6 show the temperature distribution within the combustion chamber through an isometric view, which is chosen to see both an axial-symmetrical view and a radial one in correspondence to the main conduits.
At , in the absence of steam injection, flashback occurs in the conduits of the primary swirler, just after the main injectors in all the cases analyzed. The addition of steam directly within the fuel feeding line allows one to partly overcome this anomaly of combustion and at a certain value of temperature levels do not critically rise. The minimum value of for which there is no flashback increases with the increase in hydrogen content.
At 20% of hydrogen mixed with methane, the minimum value of
is 0.75, while at 35% of hydrogen this value rises up to 1.75. As indicated above, the upper limit of the fuel and steam mass flow requires operating under lower load conditions, in the case of high levels of
, for a percentage of hydrogen equal to or above 30% by volume (cases 3c and 4c in
Table 2 and
Table 3). In these cases, a higher value of
does not correspond to a higher value of fuel and steam mass flow.
The different combustion behavior can be clearly displayed by showing the temperature distribution along an axial line of the combustion chamber, from one of the main swirler conduits.
Figure 7 reports the temperature profiles along the dashed lines in
Figure 5 and
Figure 6. Solid black lines represent the profiles without steam addition.
Comparing these figures shows that small amounts of hydrogen blended with methane lead to temperature levels in premixing ducts that are not comparable with the limits imposed by materials and that small quantities of steam, if introduced with the fuel, contribute to creating the conditions necessary to reduce the risk of flashback.
The analysis of the CFD simulation results also makes it possible to individualize an index, which can be considered a further flashback risk alert: .
is defined as the difference between the average temperature at the swirler inlet and the mean temperature and it is calculated in the swirler slice surface shown in
Figure 4 and
Figure 5.
Figure 8 shows the reduction in
with
for the four blends analyzed and gives an additional indication of the reduction in the risk of flashback.
4.3. Results of CFD Analysis: CO and NO Emissions
Figure 9 and
Figure 10 display CO mass fraction profiles. In the absence of steam injection, at
, the production of CO starts in the swirler conduits, revealing the occurrence of flashback. In the other cases, the CO mass fraction increases only in correspondence with the pilot flame and in the inner zone of the combustor, just after the swirler conduits.
Table 4 reports the emission levels at the outlet for the analyzed cases, in terms of nitric oxide and carbon monoxide parts per millions, normalized at 15% O
2.
NOx emissions decrease in the case of steam injection, because of the effects of dilution and the lower temperature levels. As expected, steam injection allows for the control of NO emissions despite the increase in hydrogen content blended with methane. With respect to CO emissions, in the first two comparisons the values are of the same order of magnitude, although CO increases with . This may be due not only to the effects of steam injection on the combustion process but also to small variations in the boundary conditions associated with the different operating points.
In the latter two cases (3c and 4c), the effects of the decrease in rotational speed and load, as well as the associated reduction in fuel and air mass flow and pressure levels, are predominant and the CO emissions increase as expected.
Figure 11 compares the results of the numerical simulations with the literature, for the same starting MGT (Turbec T100) under similar load conditions, in the case of natural gas feeding. CO emissions, in ppm, are evaluated at 15% of O
2. The solid red line represents what is shown in
Table 4, with respect to flashback-free operating conditions. The blue dashed line with square points shows the experimental values of CO emissions in the case of the natural gas fueled T100 [
15].
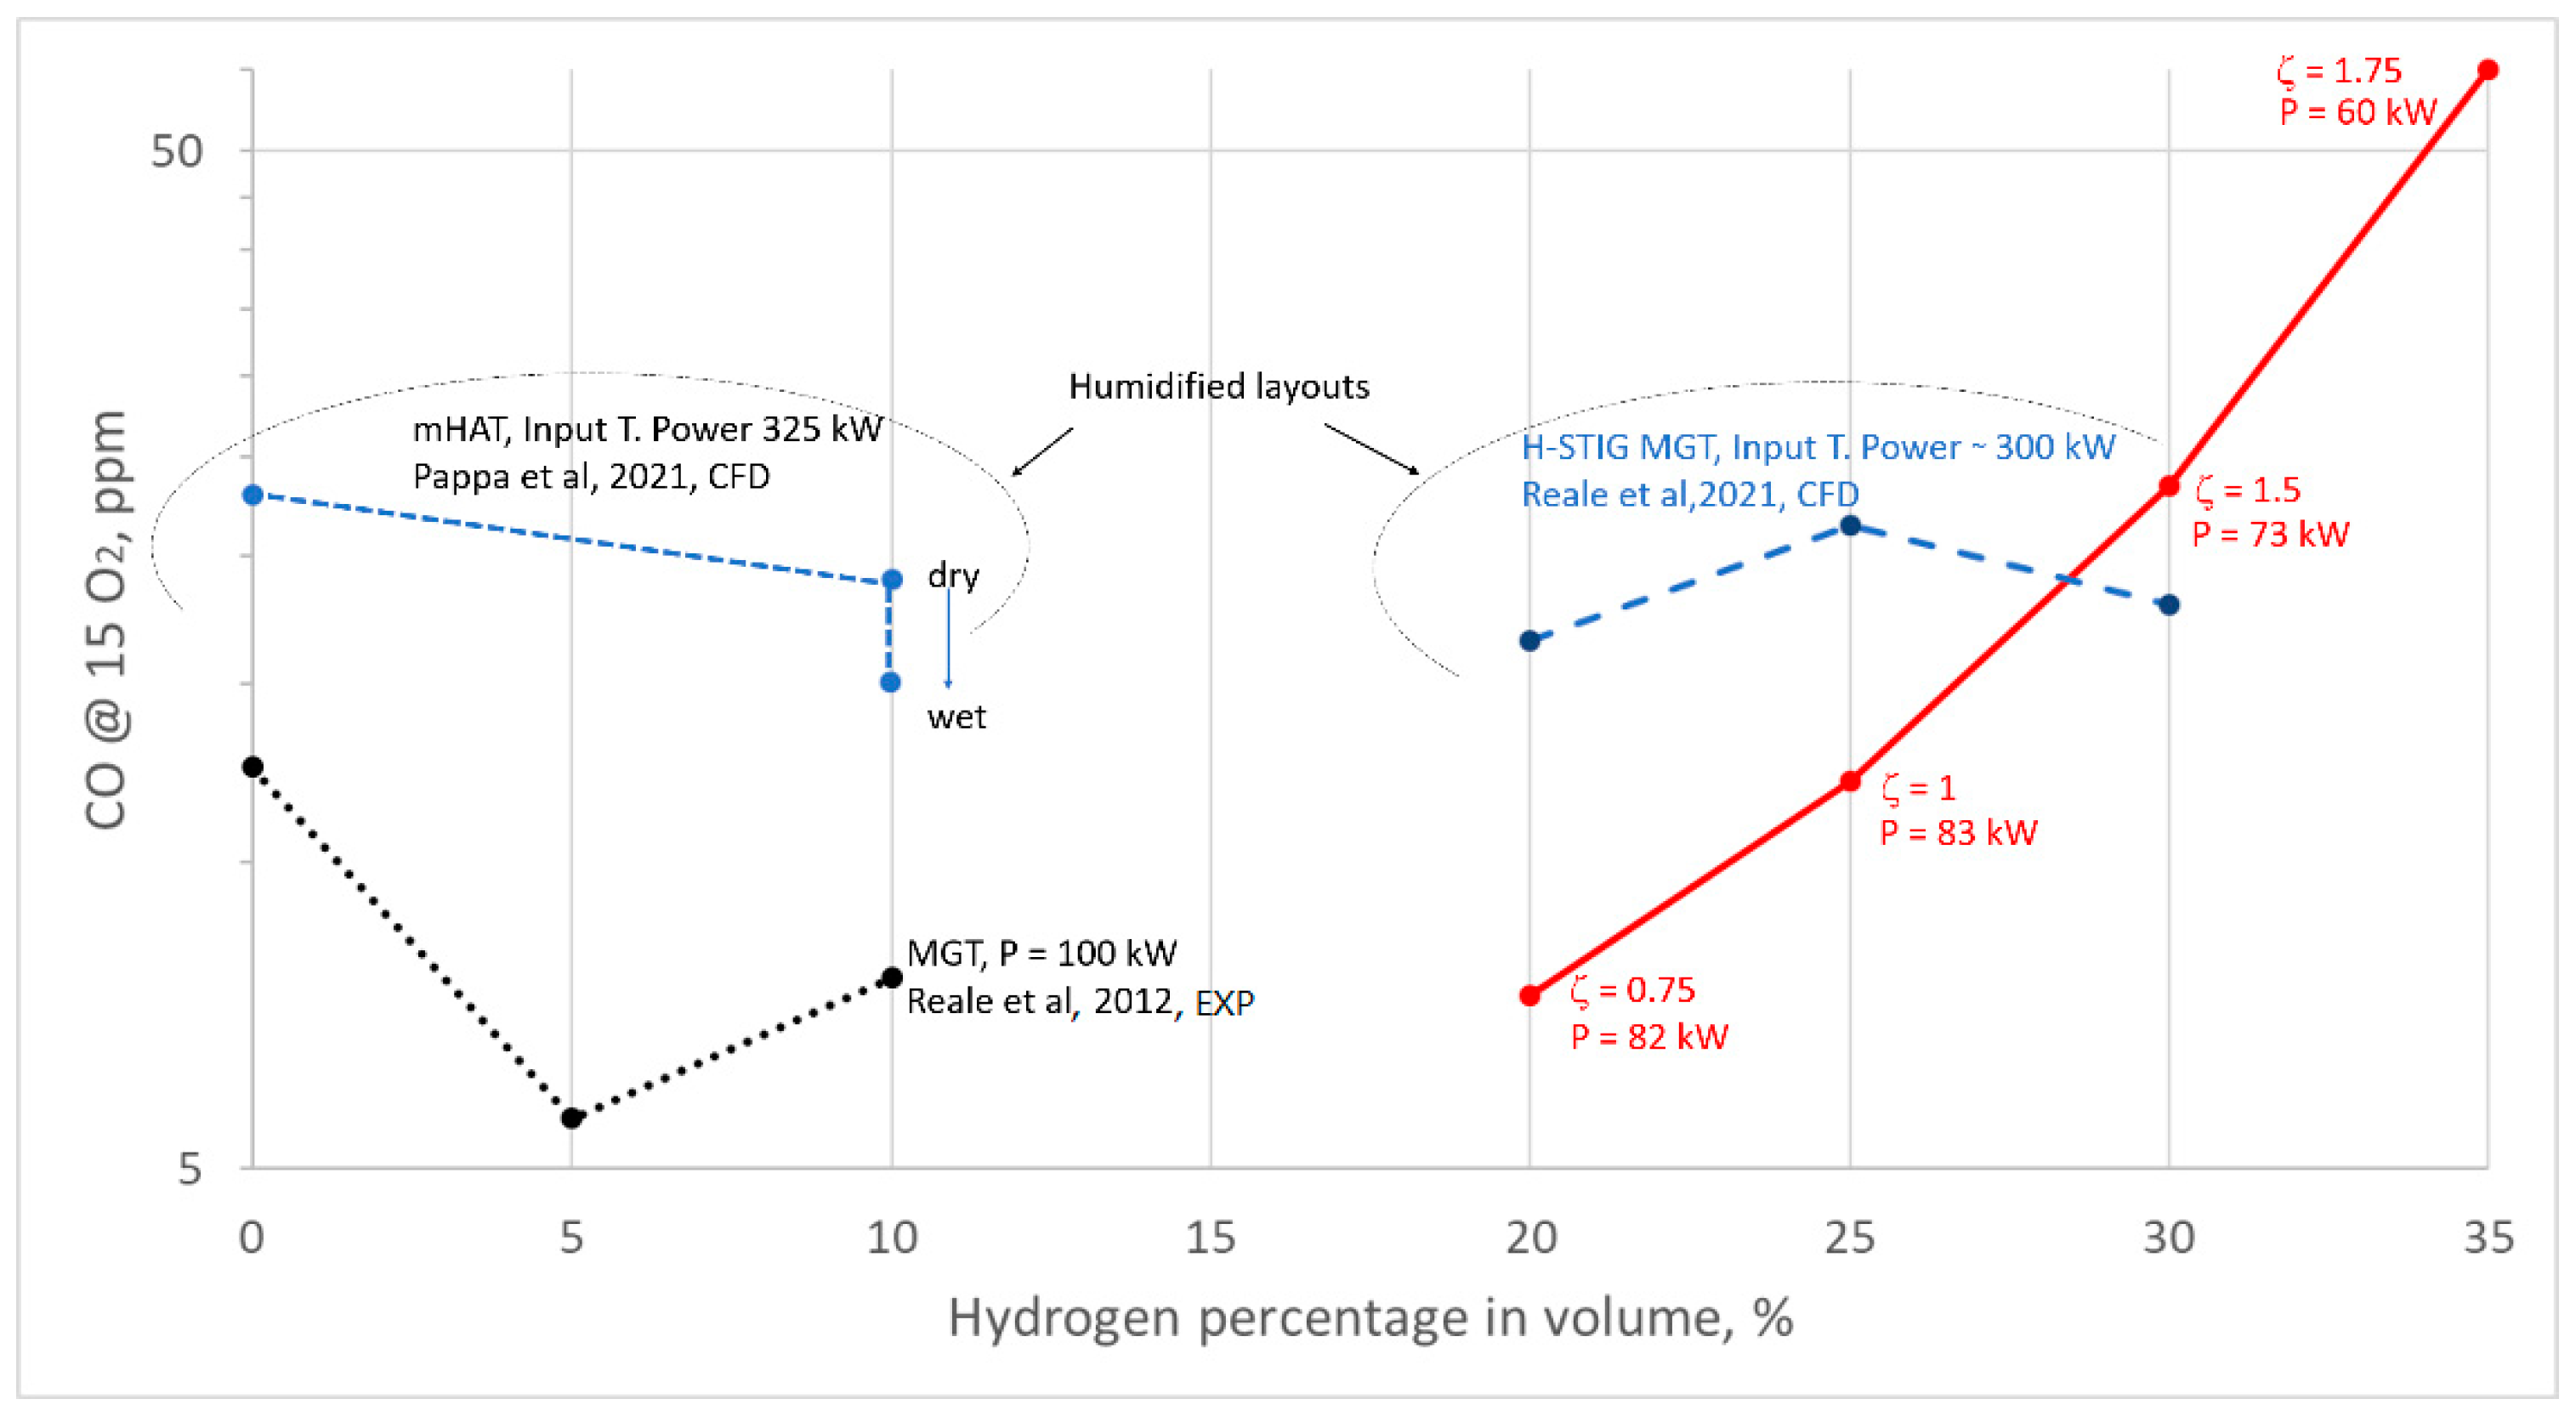
Figure 12 reports a comparison, in terms of CO emissions, of results of numerical simulations with results of CFD studies and experimental data for different methane–hydrogen blends. The blue dashed lines show the numerical results of two studies on humidified cycles, a HAT [
26] and a H-STIG [
27] under similar thermal input in power levels. The dashed black line shows experimental data for methane–hydrogen blends at full load (100 kW). These experiments were taken at different ambient temperatures [
20].
All the experimental data displayed were taken in the laboratories of STEMS-CNR of Naples, Italy [
15,
20].
This qualitative and simplified comparison seems to highlight that CO emissions are mainly influenced by the load conditions with respect to the variations in hydrogen or steam/water content, as regards the amounts considered in this work.


