Article

Condensation Flow and Heat Transfer Characteristics of R410A in Micro-Fin Tubes and Three-Dimensional Surface Enhanced Tubes

1
Department of Mechanical and Electrical Engineering, Qingdao University of Science and Technology, 99 Songling Road, Qingdao 266061, China
2
Department of Energy Engineering, Zhejiang University, 866 Yuhangtang Road, Hangzhou 310027, China
3
Department of Mechanical Engineering Technology, State University of New York College at Buffalo, 1300 Elmwood Avenue, Buffalo, NY 14222, USA
4
Vipertex Division, Rigidized Metals Corporation, 658 Ohio Street, Buffalo, NY 14203, USA
*
Author to whom correspondence should be addressed.
Energies 2022, 15(8), 2951; https://doi.org/10.3390/en15082951
Submission received: 21 February 2022 / Revised: 12 March 2022 / Accepted: 24 March 2022 / Published: 18 April 2022

Abstract

:
Condensation heat transfer characteristics (using R410A as the working fluid) were studied experimentally to evaluate the heat transfer performance in copper and stainless-steel heat transfer tubes (smooth and enhanced). Experiments were carried out for a mass flux that varied from 250 to 450 kg m−2 s−1, at a saturation temperature of 318 K. Single-phase heat balance verification found that the heat loss is less than 6%, and the deviation between single-phase experimental results and various prediction correlations is less than 15%. Additionally, tube side condensation flow patterns were observed and recorded. Experimental results found that the enhancement ratio of the condensation heat transfer coefficient (enhanced tube/smooth tube) of the three-dimensional surface (1EHT) tube is in the range of 1.15~1.90, while the ratio of the micro-fin (HX) tube is in the range of 1.18~1.80. Heat transfer performance is affected by material conductivity, with the thermal conductivity of the smooth tube slightly affecting the heat transfer performance; larger heat transfer enhancements are produced in the enhanced tubes. At a low mass flow rates and vapor qualities, the flow pattern is a stratified wavy flow, while at higher mass flow rates and vapor qualities, the flow pattern is an annular flow (with the area in the enhanced tube being larger than the area of a smooth tube). Flow patterns in the smooth tube are consistent with the predicted values shown in previously reported flow pattern maps. A flow pattern diagram for condensation heat transfer in enhanced tubes is presented as part of this study. The condensation heat transfer coefficient increases with an increase in mass flow. When the mass flow rate increases, the turbulence of the liquid flow increases and the liquid film becomes thinner; thermal resistance is reduced and the heat transfer coefficient increases. Heat transfer values at lower mass velocities increase slightly with increasing mass flux values; however, at higher mass flux rates the heat transfer increase is larger than that at low mass flux values. Finally, tubes produced from high thermal conductivity materials produce larger heat transfer performance gains than the gains found in smooth tubes; small diameter tubes produce larger gains than larger diameter tubes.

1. Introduction

Improving the heat transfer performance of a heat exchanger is an efficient way to achieve energy conservation, with surface enhancement being generally recognized as an important design method that can produce energy conservation. Enhanced surface design is an effective method that can be used to produce high performance petrochemical, air conditioning and refrigeration, and aerospace systems. Passive enhanced heat transfer technology with surface modification is an effective and reliable method to enhanced heat transfer. Experimental condensation heat transfer studies were performed to evaluate the thermal performance in smooth tubes and enhanced heat transfer tubes. Enhanced two-phase heat transfer is produced by increasing fluid turbulence, increasing surface area, reducing the thickness of the liquid film, and by boundary layer disruption.
Li et al. [1] discussed the condensation heat transfer performance of R410A in smooth, micro-fin, and three-dimensional (3D) tubes. In the condensation experiment, the three-dimensional 1EHT tubes showed good thermal performance; this demonstrated that the 1EHT surface structure enhances condensation heat transfer. Guo et al. [2] conducted phase change heat transfer experiments in smooth, micro-fin, and three-dimensional enhanced tubes. They reported that the micro-fin tubes produced the largest condensation heat transfer coefficient (HTC), and the three-dimensional EHT tubes provided the best evaporation heat transfer performance. Sun et al. [3] carried out two-phase heat transfer experiments using R410A in smooth and three-dimensional enhanced (EHT Series) tubes; they concluded that the 1EHTa (concave surface tube) produced the best heat transfer coefficient in condensation experiments, and the 1EHTb tube (surface protruding tube) demonstrated excellent evaporation heat transfer performance. Kukulka et al. [4] presented results for tubeside phase change heat transfer in copper (Cu) tubes at low mass flux values. The tubes considered in this evaluation included a smooth tube and a three-dimensional enhanced surface 1EHT tube. They found that the average heat transfer coefficient (HTC) of the 1EHT tubes exceeds that of smooth tubes. Kukulka et al. [5] found that 1EHT tubes produced an early transition to turbulent flow (Re near 750); this produced a single-phase heat transfer increase of more than 500%.
Sun et al. [6] found the condensation heat transfer coefficient (using R410A) in enhanced copper tubes (EHTa) to be 39–47% higher than that of an enhanced stainless-steel tube (EHTa); this indicates that that tubes manufactured using higher thermal conductivity materials produces larger heat transfer. Additionally, their findings also indicate that the heat transfer enhancement of a stainless steel EHT tube is 1.19 times that of a smooth tube. Zheng et al. [7] measured the condensation and evaporation heat transfer performance (using R410A) in various enhanced tubes; the results were compared with the performance found in smooth tubes and it was found that the heat transfer performance of enhanced tubes were improved by 40% to 73%. Chen et al. [8,9] performed studies on flow boiling and condensation heat transfer characteristics (using R410A) in three-dimensional (model 2EHT) enhanced tubes and compared those results to smooth tubes. They suggested correlation equations for boiling heat transfer and condensation heat transfer in the 2EHT tubes. Li et al. [10] studied experimentally the evaporation and condensation heat transfer performance of smooth and enhanced tubes; their results showed that the condensation heat transfer coefficient of enhanced tubes increased by 40–73%; hydrophobic finned tubes produced the best evaporation heat transfer performance. Gu et al. [11] performed an experimental heat transfer analysis of moist air outside three-dimensional finned tubes. They found that the HTC of a hydrophilic enhanced tube was 94% higher than that of smooth tube. Zhang et al. [12] studied the condensation heat transfer at different saturation temperatures using a micro-fin tube (heat transfer enhancement ratio from 1.28 to 1.65). Zhao et al. [13] performed condensation heat transfer experiments on two-dimensional and 3D tubes made of different materials (aluminum, brass, and cupronickel) in order to determine the influence of thermal conductivity and enhanced surface structure on the heat transfer coefficient. Ji et al. [14] experimentally studied how the thermal conductivity of the enhanced tube material affects the heat transfer; they studied how the fin heat transfer efficiency was related to the tube material thermal conductivity. Ali et al. [15] studied condensation in pin-fin tubes made of materials with different thermal conductivities. Tang et al. [16] studied the flow pattern during condensation (using R410A) in EHT tubes made of SS and Cu. They report that the transition from intermittent flow to annular flow occurs at lower vapor qualities for the enhanced tubes than what was found for smooth tubes. Li et al. [17] compared the condensation heat transfer performance of 5.00 mm and 9.52 mm smooth and enhanced tubes. Kukulka et al. [18] assessed the two-phase heat transfer performance in horizontal, copper tubes (using R410a, R22, and R32). They reported that the heat transfer coefficient enhancement of the 1EHT tube was approximately two times larger than that found in a smooth tube. In another study, Kukulka et al. [19] experimentally evaluated the heat transfer coefficient and frictional pressure drop found in smooth and 3D enhanced tubes. Li et al. [20] conducted condensation experiments using R410A in smooth, micro-fin, and three-dimensional enhanced tubes. A new evaluation factor was proposed to model the performance found in the enhanced tubes.
As can be seen, there are few studies that provide details regarding three-dimensional enhanced tubes (EHT). Therefore, additional experimental research is necessary in order to fill the information gaps that exist. On that basis, this research expands on the work of Li et al. [17] to further expand the available data for three-dimensional tubes. Details of the current condensation heat transfer study include the following: (i) an evaluation of smooth (ST), helix micro-fin (HX), and three-dimensional enhanced (1EHT) tubes; (ii) an appraisal of the use of different tube materials, allowing a performance evaluation of the effect of tube material thermal conductivity; (iii) an evaluation of the performance when using different tube diameters.
Previous studies evaluated the phase distribution of fluid in smooth tubes and further explored the relationship between flow pattern and heat transfer/pressure drop characteristics. Generally speaking, the change of flow pattern during condensation is mainly influenced by gravity and shear force. Alves [21] observed six typical condensation flow patterns. Collier and Thome [22] described flow patterns that are found in horizontal tubes: (i) Mist flow, (ii) Annular flow, (iii) Semi-annular flow, (iv) Plug flow, (v) Slug flow, (vi) Stratified-wavy flow, and (vii) Stratified flow. At low mass flow rates, the flow pattern of the refrigerant is influenced mainly by gravity, while at high mass flow rates it is mainly influenced by shear force. Taitel and Dukler [23] present a method to explicitly analyze and predict the transition between flow states based on the flow pattern transition. Steiner [24] presents a flow pattern model that varies with mass flux and vapor quality. Katten et al. [25,26,27] established a model for evaporative boiling in horizontal tubes based on the local flow pattern. Wojtan et al. [28] modified this and presented a new flow model. Hajal et al. [29] developed a flow pattern diagram specifically for condensation heat transfer; this model produces more accurate results. Cavallini et al. [30] established a new flow pattern prediction model based on the classification of flow patterns.
The above literature review shows that micro-fin tubes and three-dimensional enhanced (EHT) tubes can significantly improve the heat exchange performance of refrigerant in the two-phase heat transfer process. Therefore, it is of great significance to better understand the heat exchange mechanism. Previous studies detailed that the relationship between flow pattern and heat transfer in micro-fin tubes and three-dimensional enhanced tubes were not sufficient. Therefore, it is important to investigate the flow pattern during heat and mass transfer. Previous research has focused mainly on copper heat transfer tubes; however, stainless steel tubes are important because they can be used in applications where corrosion resistance is important (i.e., seawater desalination, chemical industry, oil exploitation, etc.). This study included tubes that are made of copper (Cu) and stainless steel (SS), producing a relevant comparison of results.
In this study, the flow pattern and condensation heat transfer performance (using refrigerant R410A) in horizontal smooth (ST), micro-fin (HX), and three-dimensional enhanced (1EHT) tubes were studied. This study provides a theoretical basis for improving the heat exchange performance of heat transfer tubes and enhancing industrial heat exchange applications, thus allowing the development of more compact heat exchange equipment with better performance.

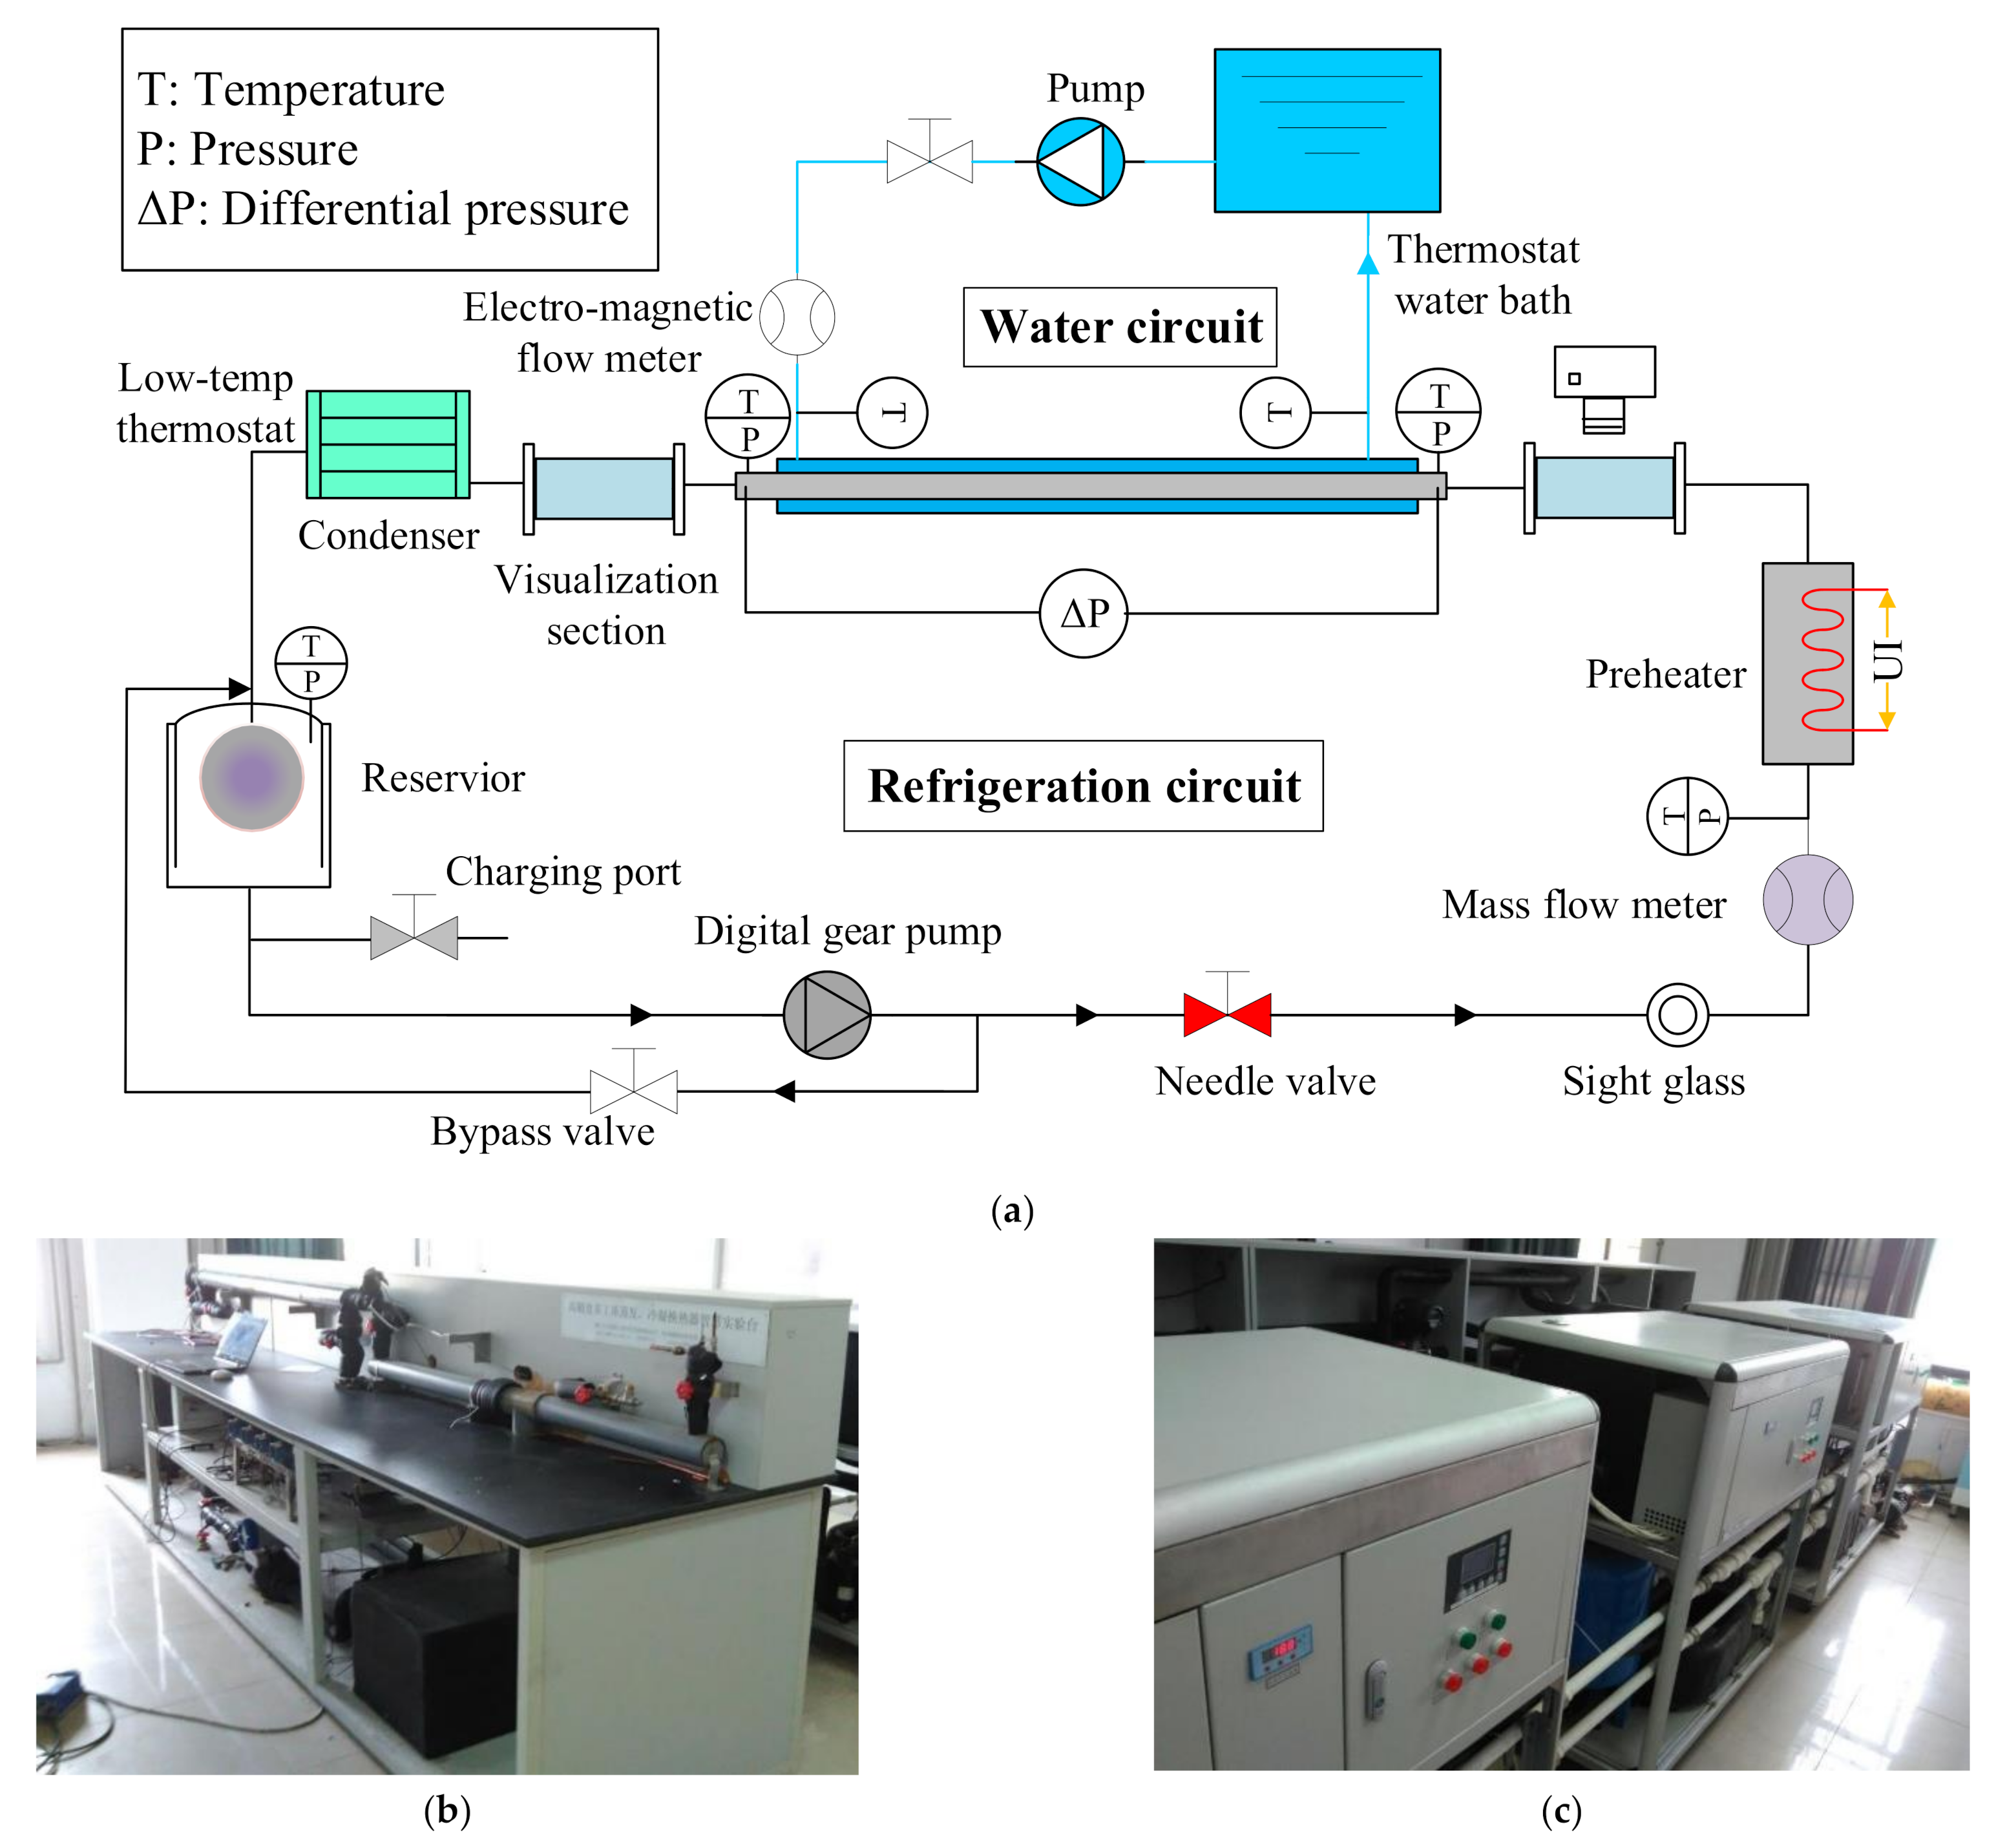
2. Experimental Details

Figure 1a shows the system diagram of the experimental equipment. The front view and rear view of the experimental setup are shown in Figure 1b,c. The experimental platform can produce accurate data monitoring and control of the refrigerant working conditions for condensation or evaporation testing. Four circulation loops make up the experiment apparatus: (i) Refrigerant circulation loop; (ii) Water circulation loop of the preheating section; (iii) Water circulation loop in the experimental section; (iv) Subcooled oil circuit. The refrigerant circulation loop is the main circulation loop of the experimental system.
The refrigerant flow process is as follows: refrigerant is pumped by the digital gear pump from the storage tank into the preheating section; it is then heated by the preheater so that the refrigerant can reach the inlet state required by the experiment. In the test section, the heat of the refrigerant is exchanged with the deionized water that is on the outside of the test tube; by adjusting the temperature of the water being circulated, the refrigerant at the outlet of the test tube reaches the desired experimental state. After leaving the outlet of the test section, the refrigerant flows into the cooling section where it is cooled using low-temperature oil at a super-cooled state. Finally, the refrigerant flows into the liquid storage tank and can start to recirculate again. The mass flow rate of the circulating refrigerant is regulated using a Coriolis Mass Flowmeter.
The water cycle plays an important role in regulating and maintaining the state parameters (i.e., temperature, pressure, and vapor quality) of the refrigerant, with the temperature of the circulating water being regulated by the PID temperature controller. Pressure sensors (accuracy +/− 0.1%) and temperature sensors (accuracy +/− 0.1 °C) are installed at the inlet of the preheater and at the inlet/outlet of the test section; this is necessary in order to monitor the state of the refrigerant. Additionally, temperature sensors are set at the inlet and outlet of the water circuit in order to monitor the water temperature. All pressures and temperatures are collected and analyzed by the Lab View program that is running on the data acquisition computer. A visualization port is included in the experimental setup, making it a very unique test apparatus. This includes a visual lens at the outlet of the tested tube that can be used to record the refrigerant pattern at the outlet; a high-speed camera is included in the visualization port in order to record the flow pattern. The lens in the observation port is made of quartz glass and can withstand high pressure. It is connected in the test circuit using a nylon gasket with a stainless-steel flange. Images are recorded using a high-speed camera; image acquisition frequency is 4000 fps with a resolution of 1280 x 1024 pixels.
Figure 2 shows the specific details of the test section; refrigerant flows inside the heat transfer tube and deionized water flows through the annular region between the casing tube/test tube (the blue region in Figure 2), with the flow direction of the deionized water being opposite to that of the refrigerant. The inner diameter, Di, of the outer casing tube is 17 mm. In order to achieve excellent heat insulation performance, polyurethane air sealing foam and a polyethylene plastic tube are used for additional heat insulation on the outside of the casing tube.
Figure 3 details the three-dimensional surface structure view of the 1EHT-enhanced heat transfer tube and the HX micro fin tube; Table 1 provides the geometric characteristics of those tubes. There are two kinds of material used in this evaluation of the heat transfer tubes: (i) copper (Cu) and (ii) stainless steel (SS). The outer diameters of the evaluated tubes are 9.52 mm and 12.7 mm; tube wall thickness is 0.61 mm, with a test length of 2 m. There are two kinds of dimples on the surface of the 1EHT-enhanced tube: (i) large dimples with a depth of 1.71 mm and a diameter of 1.34 mm and (ii) small background dimples with a depth of 0.19 mm and a diameter of 0.35 mm. The distance between large diameter dimples is 4 mm, with a helix angle of 60°. Compared with smooth tubes, the area enhancement ratio of the 1EHT-enhanced tubes is 1.34. The fin height on the surface of the HX micro fin tube is 0.25 mm, fin width is 0.31 mm, fin spacing is 0.8 mm; and helix angle is 21°. The effective heat transfer area of the micro-fin tube is 44% larger than that of the smooth tube.
The parameters investigated experimentally in order to evaluate their effect on the heat transfer coefficient include: mass flow rate, tube material (thermal conductivity coefficient), surface structure, and tube diameter. The relationship between the heat transfer coefficient and mass flow rate was investigated at the following conditions: saturation temperature (318.15 K), inlet vapor quality (0.8), outlet vapor quality (0.2), and average vapor quality (0.5). Mass flow rate ranged from 50 to 300 kg m−2 s−1. The tube material was examined in order to determine the effect of material on heat exchange performance. Additionally, the relationship between pressure drop and mass flow rate was also studied. The influence of mass flux and vapor quality on flow pattern was evaluated using a 9.52 mm copper tubes at various mass fluxes (250, 350, and 450 kg m−2 s−1) and various average vapor qualities (0.1–0.9). After the systems were in steady state, data were collected every 20 s. In order to ensure the accuracy of the experiment, the average value of 10 groups of data is calculated. The necessary fluid properties were taken from Lemmon et al. [31].

3. Theory

According to the conservation of energy, the heat exchange quantity, Qref,te, of the refrigerant in the test section is equal to the heat exchange quantity, Qw,te, calculated on the annular (water) side, and this is shown in Equation (1):
Q ref , te = Q w , te = c p , w , te m w , te T w , te , out T w , te , in
where cp,w,te is the specific heat capacity of water, mw,te is the water mass flux, tw,te,out is the temperature of the outlet water, and tw,te,in is the temperature of the inlet water. The heat flux of the refrigerant, Qref,te, is obtain using:
Q ref , te = m ref H v , in x in H v , out x out + 1 x in H l , in 1 x out H l , out
where mref is the refrigerant mass flux, Hv,in and Hl,in are the gaseous enthalpy and the liquid enthalpy of inlet refrigerant of test section, and Hv,out and Hl,out are the gaseous enthalpy and the liquid enthalpy of outlet refrigerant of test section. The inlet vapor quality of the refrigerant, xin, and outlet, xout, are computed from Equations (3) and (4):
x in = Q w , ph c p , ref m ref T sat T ref , ph , in m ref h lv
x out = x in Q w , te m ref h lv
where Qw,ph is the heat exchange of the water in the preheating section, cp,ref is the specific heat capacity of the condensed working fluid, Tsat is the saturation temperature of the condensing working fluid, Tref,ph,in is the inlet temperature of the condensation working fluid in the preheating section, and hlv is the latent heat of vaporization of the condensed working fluid.
According to Newton’s law of cooling, the condensation heat transfer coefficient, hi, from the condensed working fluid in the test tube can be represented as:
h i = 1 A i L M T D Q te 1 h o A o d o ln d o / d i 2 λ A o
where Ao is the heat exchange area at the annulus side of the test section, Ai is the heat exchange area in the test section tube, ho is the heat transfer coefficient of the annulus water side of the test section, do and di are the outer diameter and inner diameter of the tested heat exchange tube, respectively, λ is the thermal conductivity of the tube material, and LMTD is the logarithmic average temperature difference, which indicates the average temperature difference of the hot and cold fluids in the heat exchange process; this is given by the following formula:
L M T D = T w , te , in T ref , te , out T w , te , out T ref , te , in l n T w , te , in T ref , te , out / T w , te , out T ref , te , in
where Tref,te,in is the inlet temperature of the refrigerant in the test section, Tref,te,out is the outlet temperature of the refrigerant in the test section, and Tw,te,in and Tw,te,out are the temperatures of the inlet and outlet of the water (annular side). The fouling thermal resistance in the experiment can be neglected because of the purity of the fluids.
The heat transfer coefficient of the test tube water (annular side) is predicted by the Gnielinski correlation [32] for the following range: (0.5 ≤ Pr ≤ 2000, 3000 ≤ Rew ≤ 5 × 10⁶). In this experiment, the Rew range was from 5000 to 9000:
h o = f w / 2 Re w 1000 Pr w 1 + 12.7 f w / 2 1 / 2 Pr w 2 / 3 1 μ bulk μ w 0.14 k w d h
where fw is the fanning friction factor of the water side, μbulk is the bulk fluid viscosity, μw is the fluid viscosity, Kw is the thermal conductivity of water in the test section, and dh is the hydraulic diameter of the casing tube.
Calculation of the Fanning friction factor is given in Petukhov [33]:
f w = 1.58 ln R e w 3.28 2
As shown in Figure 4, the pressure drop of the refrigerant can be divided into four parts: (i) acceleration pressure drop, ΔPa, (ii) frictional pressure drop, ΔPf, (iii) sudden expansion pressure drop, ΔPsc, of the inlet cross section, and (iv) sudden contraction pressure drop, ΔPsl, of the outlet cross section.
Total pressure drop, ΔPto, can be calculated using Equation (9):
Δ P to = Δ P sc + Δ P sl + Δ P a + Δ P f
d P d z f = Δ P f L = Δ P to Δ P sc Δ P sl Δ P a L
Acceleration pressure drop, ΔPa, is produced from the change of density or velocity of the fluid during condensation and can be calculated according to Collier and Thome [22] by:
Δ P a = G ref 2 x 2 ρ v ε R A + 1 x 2 ρ l 1 ε R A out x 2 ρ v ε R A + 1 x 2 ρ l 1 ε R A in
where εR−A, is the void fraction and can be calculated according to Rouhani and Axelsson [34] by Equation (12).
ε R A = x ρ v 1 + 0.12 1 x x ρ v + 1 x ρ l + 1.18 1 x g σ ρ l ρ v 0.25 G ref ρ l 0.5 1
Here, ΔPsc and ΔPsl are calculated according to Richardson [35] and given in Equations (13) and (14).
Δ P sc = G ref 2 2 ρ l 1 + ρ l ρ v ρ v x
Δ P sl = G ref 2 σ 1 σ ρ l 1 + ρ l ρ v ρ v x
where Gref is the mass flow rate of the working fluid in the tube, ρg is the gas phase density of the condensed refrigerant, ρl is the liquid density, and σ is the surface tension of the condensed refrigerant at the saturated state.
In order to analyze the uncertainty, the procedure described in Moffat [36] is used and given in Equation (15).
r ( y ) = 1 y i = 1 n ( y x i ) σ 2 ( x i )
where r(y) is the estimated uncertainty of the desired variable, xi is the independent variable, σ2(xi) is the standard deviation of xi, and n is the number of variables. Accuracy values are detailed in Table 2 and Table 3.

4. Results

4.1. Verification of Experimental Reliability

In order to ensure the accuracy of the experimental results, a verification of the experimental equipment was performed using a single-phase heat balance. Conditions adopted for the single-phase experimental verification included the 12.7-mm-OD smooth tube at a saturation temperature of 311.15 K. Single-phase heat balance results are shown in Figure 5a. The accuracy verification part of the experiment included an evaluation of the difference of heat exchanged in the refrigerant, which was compared to the difference of heat exchanged in the water. During this evaluation, it was determined that the difference is slightly more than 5% for the worst case (low heat exchange), and the difference in the heat exchange amount becomes smaller for higher heat exchange values; this indicates that the system is well insulated and the design is verified.
Previous researchers have presented accurate correlations that predict the heat transfer in smooth tubes. Figure 5b presents a comparison of smooth tube heat transfer results from this study (using R410A and at a saturation temperature of 311.15 K) to the models of Gnielinski [32], Dittus and Boelter [37], and Petukhov and Popov [38]. This figure shows that the deviation between the current experimental results and the results using various smooth tube prediction correlations is within the error bands +/− 15%. Therefore, the current experimental results agree well with models that are commonly accepted smooth tube models; in addition, the results are in excellent agreement with the Gnielinski [32] model. Therefore, the experimental system setup and procedure can be considered reliable.
Figure 5. (a) Single-phase heat balance verification. (b) Comparison of current smooth tube experimental results with various predictions.
Energies 15 02951 g005

4.2. Heat Transfer Performance

The effect of tube thermal conductivity on the heat transfer coefficient (HTC) was studied experimentally. Figure 6 shows the relationship between condensation HTC and mass flow rate for copper/stainless-steel heat transfer tubes with an outer diameter of 12.7 mm. Results indicated that the HTC of a smooth copper tube was slightly larger than that of a stainless-steel smooth tube. However, the heat transfer coefficient of a copper enhanced tube is larger than that of the stainless-steel enhanced heat transfer tubes. The heat transfer coefficient of the enhanced tube is very sensitive to the tube wall thermal conductivity.
These experimental results indicate that the thermal conductivity of tubes affects the condensation HTC inside the enhanced tubes; this indicates that enhanced tube fin efficiency varies strongly with material thermal conductivity. Materials with higher thermal conductivity will produce a larger temperature difference between the heat transfer surface and the working fluid. For enhanced surfaces produced from materials with low thermal conductivity, it can be concluded that the higher the actual temperature of heat transfer surface, the lower the fin efficiency. Additionally, the area enhancement ratio (area of an enhanced tube/area of a smooth tube) of the 1EHT-enhanced tube is 1.34, and the area of the HX enhanced tube is 1.44. Therefore, it can be concluded that the HX heat transfer tubes are affected more by the tube material thermal conductivity than the 1EHT tube.
Figure 6 shows that the HTC in the smooth tube has a slight tendency to increase with increasing mass flow rate. However, for the enhanced tubes, when the mass flow rate of the refrigerant is greater than 110 kg m−2 s−1, larger increases in the HTC are seen (when compared to a smooth tube) with an increase of the mass flow rate. However, when the mass flow rate is less than 110 kg m−2 s−1, the HTC decreases with an increase of mass flow rate. It can be proposed that the main flow pattern in the heat transfer tube is a stratified flow at low mass flow rate; that is, the contact surfaces between the refrigerant and the tube wall can be divided into two areas: (i) liquid-wall surface and (ii) gas-wall surface. Here, the heat transfer between the gas phase and the wall has a higher HTC. In the heat transfer process of the liquid refrigerant, the heat transfer coefficient will decrease due to the thermal resistance of the liquid film. As mass flow rate increases, there are two considerations: (i) it will lead to an increase to the disorder of the refrigerant and enhance heat transfer; (ii) there will be an increase to the shear force and this will cause the liquid film to cover more of the inner wall of the tube, making it more evident in the enhanced tubes. Therefore, at the lower flow rate, the condensation HTC in the enhanced tubes decreases. However, when the mass flow rate continues to increase to a certain value, the liquid film thickness becomes thinner and the HTC begins to increase. This explains the variation in heat transfer that is demonstrated in the enhanced tubes.
The heat transfer coefficients of three-dimensional enhanced tubes, micro-fin tubes, and smooth tubes are compared. During the condensation process of vapor quality from 0.8 to 0.2, the three-dimensional enhanced tubes and micro-fin tubes maintain a high heat transfer coefficient, and the heat transfer performance is significantly improved. The mechanism of enhanced heat transfer in the three-dimensional enhanced tubes is explained in [4,6] as: (i) the surface structure increases the heat transfer area; (ii) the enhanced structure on the surface will disturb the fluid near the wall and increase the turbulence intensity, thus enhancing the mixing of the gas phase and liquid phase, causing the increase in heat transfer; (iii) the staggered protruding structures increase the axial velocity of the two-phase flow and radial acceleration in the flow field. For micro-fin tubes it is explained as: (i) the micro-fin structure causes the surface tension to play a more significant role, which can promote the thinning of the condensate liquid film and reduce the heat exchange resistance; (ii) the structure produces the fluid rotating at a certain angle. When the fluid flows through, the generated disturbance will destroy the boundary layer and enhance the heat transfer.
In Figure 7, the influence of the diameter of the heat transfer tubes on the HTC is shown by comparing the HTCs of the tubes with an outer diameter of 9.52 mm and 12.7 mm. The results show that, at the same mass flow rate, the heat transfer tubes with the smaller diameter will have a larger heat transfer coefficient. This is attributed to the fact that, in the heat transfer tubes with a small diameter, the effects of shear force and surface tension are more evident. Shear force and surface tension causes the stretching of the liquid film to take place; this produces a thinner liquid film and promotes annular flow. Additionally, the small diameter heat transfer tube promotes heat transfer by creating a larger ratio of heat exchange area to refrigerant volume. This further explains why smaller diameter heat transfer tubes produce higher heat transfer coefficients than larger tubes.

4.3. Pressure Drop Characteristics

Figure 8 shows the variation of frictional pressure drop inside smooth and enhanced 12.7-mm-OD tubes with mass flow rate during condensation (using R410A). The experimental results show that, with an increase of the refrigerant mass flow rate, the frictional pressure drop also increases. This is a result of an increase in the turbulence of the fluid for higher mass flow rates. At higher mass flow rates, small vortices are generated within the fluid; this produces a collision of particles, with some momentum being dissipated in the form of heat. As the mass flow rate increases, shear between the gas and the liquid increases, producing larger frictional losses at the gas–liquid interface.
The frictional pressure drop of smooth, enhanced three-dimensional, and HX micro-fin tubes were studied experimentally. When compared at the same mass flow rate, the 1EHT three-dimensional enhanced tube exhibits the largest frictional pressure drop and the smooth tube showed the smallest pressure drop. This can be explained by the surface structure of the 1EHT tube; the dimples on the 1EHT, three-dimensional enhanced tube are greater in height than the fins on the surface of the HX micro fins tube. The flow of the refrigerant across the three-dimensional surface structure produces a more intense disturbance when compared to the disturbance produced in the HX micro-fin tube; the HX flow patterns are more organized and in a single direction. As a result, the 1EHT-enhanced tubes have the largest frictional pressure drop.
Friction pressure drop was also compared experimentally for tubes that varied in material (copper and stainless steel). It is found that for the same conditions the frictional pressure drop of the copper smooth tube is similar to that of a stainless-steel smooth tube. In enhanced tubes, the friction pressure drop of the copper heat tubes is slightly higher than that of the stainless-steel tubes. This may be related to the thermal conductivity producing a different temperature difference at the inner wall of the heat transfer tube. In the process of condensation, the temperature of the inner wall of the copper tube (higher thermal conductivity) is lower; the viscosity of the liquid refrigerant near the wall being higher; therefore, the frictional pressure drop in the copper enhanced tube will be larger. Because of the special surface structure of the enhanced tubes, the thermal conductivity of materials has an influence on pressure drop. However, the enhanced influence of the high thermal conductivity tubes on the HTC is more significant; therefore, in the application of two-phase heat exchange, enhanced heat exchange tubes still provide an advantage and are still important to study.

4.4. Flow Pattern Analysis

Flow patterns during condensation, in heat transfer tubes, using R410A refrigerant were observed and recorded. The flow patterns observed here were compared to the flow patterns of Hajal et al. [29]. The flow pattern maps of Hajal et al. [29] include annular flow, intermittent flow, stratified wavy flow, stratified flow, and mist flow. In the present study, annular flow, intermittent flow, stratified wavy flow, and stratified flow were observed.
In Figure 9, the geometric parameters of the tube and various condensation two-phase flow variables are shown: di is the inner diameter of the heat exchange tube, hl is the height of condensed liquid, Av is the cross-sectional area of the refrigerant vapor in the heat exchange tube, Al is the cross-sectional area of the refrigerant liquid (assuming that the liquid phase area, Al, does not include the liquid condensed by the film on the upper part of the tube), θstrat is the stratification angle, pv is the circumference of the vapor at the top, and pl is the circumference of the liquid at the bottom. Hajal et al. [29] defines four dimensionless parameters:
h ld = h l d
P id = P i d
A ld = A l d 2
A vd = A v d 2
where Al and Av are calculated in Equations (20) and (21):
A l = A ( 1 ε )
A v = A ε
The liquid level height, hl, and the interface length, pi, can be calculated using Equations (22) and (23):
h ld = 0.5 ( 1 cos ( 2 π θ strat 2 ) )
P id = sin ( 2 π θ strat 2 )
where θstrat is calculated according to the model of two-phase stratified flow presented by Biberg [39] in Equation (24).
θ strat = 2 π 2 π ( 1 ε ) + 3 π 2 1 / 3 1 2 ( 1 ε ) + ( 1 ε ) 1 / 3 ε 1 / 3 1 200 ( 1 ε ) ε 1 2 ( 1 ε ) 1 + 4 1 ε 2 + ε 2
Zürcher et al. [40] presents a method to calculate Gwavy, which is given in Equation (25):
G wavy = 16 A vd 3 g d ρ l ρ v x 2 π 2 ( 1 ( 2 h ld 1 ) 2 ) 0.5 [ π 2 25 h ld 2 W e F r l 1.023 + 1 ] 0.5 + 50 75 e ( x 2 0.97 ) 2 / x ( 1 x )
where W e F r l is calculated using Equation (26):
W e F r l = g d 2 ρ l σ
The equation for Gstrat (the transition line from stratified wavy flow to stratified wavy flow) is also obtained by modifying the model of Zürcher et al. [40]:
G strat = ( 226.3 ) 2 A ld A vd 2 ρ v ( ρ l ρ v ) μ l g x 2 ( 1 x ) π 3 + 20 x
The transition line, xIA (showing intermittent flow to annular flow), is defined as a vertical line equation intersecting with Gwavy:
x IA = 0.2914 ρ v ρ l 1 / 1.75 μ l μ v 1 / 7 + 1 1
Figure 10 shows the flow patterns of condensation and h in smooth tubes as a function of quality for mass flow rates of 250 kg m−2 s−1, 350 kg m−2 s−1, and 450 kg m−2 s−1. The experimental flow patterns obtained in this study were compared with the flow pattern map of Hajal et al. [29]. (The flow pattern map from [29] does not indicate the semi-annular flow, which is classified as annular flow.) It can be seen that the flow patterns observed in this study are consistent with the predicted flow pattern map from [29]. At the mass flow rate of 250 kg m−2 s−1, there is a stratified wavy flow in the vapor quality range 0.1–0.6 and a semi-annular flow for the vapor qualities from 0.7 to 0.9. At a mass flow rate of 350 kg m−2 s−1, there is a stratified wavy flow in the range of 0.1–0.4, intermittent flow in the range of 0.5–0.6, and a semi-annular flow for the vapor quality range 0.7–0.9. At the mass flow rate of 450 kg m−2 s−1, a stratified wavy flow was observed at lower vapor quality, and semi-annular flow and annular flow were observed at higher vapor qualities.
From the observations of recorded flow patterns, it can be concluded that, with an increase of mass flow rate and vapor quality, there is an enhancement of turbulence in the two-phase flows in the heat transfer tube; the mixing at the junction of the gas phase and liquid phase becomes more intense. In the process of condensation, the refrigerant in the heat transfer tube is subjected to the combined action of gravity, shear force, and surface tension. At low mass flow rate and vapor quality, gravity plays a dominant role; the condensate is at the bottom of the heat transfer tube, with the gas phase and liquid phase being obviously stratified; the flow state is a stratified wavy flow. With the increase of mass flow rate and vapor quality, the effects of shear force and surface tension begins to be important. It leads to the intensification of mixing and disorder in the gas–liquid interfaces. Surface tension causes the refrigerant to be evenly distributed on the inner surface, thus forming an annular flow.
Figure 10 also illustrates the functional relationship between condensation HTC and vapor quality in smooth tubes at different mass flow rates. The results show that an increase in the mass flow rate causes an increase of HTC. At high mass flow rates, the disturbance of the refrigerant in the flow process is intensified; the condensate is discharged in time, promoting the heat transfer. The HTC increases with an increase of the vapor quality; this is a result of the higher void fraction in the tube and the larger velocity slip of the two-phase interface at higher vapor qualities. Shear stress effects dominate the liquid film distribution during condensation; the phenomenon of liquid wicking is evident, with the condensate film in the tube being evenly distributed on the inner wall of the tube by the surface tension. Compared with the thickness of condensate at low vapor qualities, the heat transfer resistance of the condensate film is smaller, resulting in a higher HTC. Relating HTC with flow pattern, it was found that a high heat transfer coefficient occurs in the semi-annular flow and annular flow regions. Therefore, expanding the area of annular flow may be a method to improve the performance of heat transfer.
Shown in Figure 11 are the flow patterns observed in the copper 1EHT tubes for condensation heat transfer at different mass flow rates (250, 350, and 450 kg m−2 s−1). When the mass flow rate is 250 kg m−2 s−1, it is a stratified wavy flow for the vapor quality range from 0.1 to 0.6; semi-annular/annular flow in the range of 0.7–0.9. When the mass flow rate is 350 kg m−2 s−1, it is a stratified wavy flow in the range of 0.1–0.3, intermittent flow in a vapor quality range of 0.4–0.5, and semi-annular flow or annular flow in a range from 0.6 to 0.9. When the mass flow rate is 450 kg m−2 s−1, it is a stratified wavy flow in the quality range from 0.1 to 0.2, intermittent flow in the range of 0.3–0.5, and semi-annular flow or annular flow in the range of 0.6–0.9.
In Figure 11, the various flow patterns in the enhanced tube and the smooth tube are compared. Compared with the smooth tube, the area of annular flow is enlarged, and the HTC is increased by 20–40%. This is a result of the dimple structure of the surface. For the same vapor quality and different flow rates, the liquid film thickness decreases with an increase of mass flow rate.
Figure 11. Flow patterns and HTC of the three-dimensional enhanced copper 1EHT heat transfer tube at different mass flow rates.
Energies 15 02951 g011
Figure 12 shows the flow patterns and the condensation HTC when using copper HX tubes for mass flow rates of 250, 350, and 450 kg m−2 s−1. When the mass flow rate is 250 kg m−2 s−1, it is a stratified wavy flow in the vapor quality range from 0.1 to 0.3, an intermittent flow in the range of 0.4–0.5, and a semi-annular flow and annular flow at larger vapor qualities. When the mass flow rate is 350 kg m−2 s−1, it is a stratified wavy flow for the vapor quality range from 0.1 to 0.2, an intermittent flow in the range of 0.3 to 0.5, and a semi-annular and annular flow in the range of 0.6 to 0.9. For the mass flow rate of 450 kg m−2 s−1, the flow patterns in the experiment are mainly intermittent flow, semi-annular flow, and annular flow. The black chain line is the flow pattern transition curve of the smooth tube, and the red line is the flow pattern transition curve of the Copper HX tube. Compared with the flow patterns map in the smooth tube, it was found that the area of stratified wavy flow in the copper HX tube is compressed; intermittent flow occurs at smaller vapor qualities, with the area of semi-annular flow and annular flow being expanded. This is the result of the micro-fin structure on the inner surface of the copper HX tube playing a guiding role in the expansion and extension of liquid film in the tube, promoting the occurrence of annular flow. Additionally, the HTC is also greatly improved. Compared with the HTC of a smooth tube, the heat transfer of the HX tube is enhanced by 40–80%.
Generally speaking, with an increase of vapor quality, the liquid film on the wall will become thinner, and the fluctuation of the liquid film will increase. Increasing vapor quality will also increase the gas phase velocity, which will lead to an increase in the shear force at the gas–liquid interface, leading to more liquid droplets being carried, producing a thinning of the liquid film. With an increase of the refrigerant mass flow rate, the liquid film on the inner wall of the test tube will also have more fluctuations. The influence of the mass flow rate on the flow pattern is a result of the greater shear force between the refrigerant gas at the top of the heat transfer tube and the liquid film at the bottom of the tube; the liquid film of the refrigerant will also be subjected to greater surface tension and larger fluctuations. Compared with the flow pattern in smooth tubes, the transformation from stratified wavy flow to intermittent flow and the transformation from intermittent flow to annular flow in enhanced heat transfer tubes all occur at a smaller vapor quality. This is consistent with the results from Mashouf et al. [41].

5. Conclusions

Tubeside experimental investigations on condensation heat transfer in horizontal smooth and enhanced tubes were conducted using R410A. Micro-finned tubes and three-dimensional enhanced tubes with dimpled protrusions and a secondary petal array were compared using 9.52 mm and 12.7 mm diameter copper and stainless steel tubes. Condensation HTC and frictional pressure drop (using R410A) in the heat transfer tubes were studied. Visualize flow patterns in the enhanced tubes were discussed, and the flow pattern diagrams for enhanced tubes were created. The following conclusions can be drawn as a result of this study:
  • It can also be concluded that tubes produced from higher thermal conductivity material or tubes of a smaller diameter will lead to better heat transfer performance. The improvement of heat transfer performance of smooth tubes by thermal conductivity is limited, and the influence of enhanced tubes is more significant.
  • Frictional pressure drop increases with the mass flow rate of the refrigerant. This is attributed to the higher mass flow rate producing more intense fluid turbulence. Three-dimensional 1EHT-enhanced tubes showed the highest frictional pressure drop during flow condensation at the same conditions; this is related to the dimples that make up the surface structure.
  • In the investigation of flow patterns, as the vapor quality increases, the flow patterns that are observed in turn include: stratified wavy flow, intermittent flow, semi-annular flow, and annular flow. In addition, the transition from stratified wavy flow to intermittent flow and intermittent flow to annular flow in enhanced tubes occurs at lower vapor qualities. This is mainly influenced by the surface enhancing structure that promotes the liquid to extend to the upper part of the tube.
Additional work on other structures is ongoing.

Author Contributions

Y.G.: conceptualization, methodology, investigation, writing—original draft; H.C.: conceptualization, methodology, investigation; W.L.: funding acquisition, supervision, writing—review and editing; D.J.K.: project administration, resources, writing—review and editing. R.S. project administration, resources, funding acquisition, supervision. All authors have read and agreed to the published version of the manuscript.

Funding

This research received no external funding or This research was funded by National Science Foundation of China grant number 52076187.

Institutional Review Board Statement

Not applicable.

Informed Consent Statement

Not applicable.

Data Availability Statement

Not applicable.

Conflicts of Interest

The authors declare no conflict of interest.

Nomenclature

Atest tube surface area, m2Greek symbols
Alliquid cross-sectional area, m2εvoid fraction
Aldliquid cross-sectional area, dimensionlessθstratstratified angle, rad
Avvapor cross-sectional area, m2λthermal conductivity, W/(m·K)
Avddimensionless vapor cross-sectional areaμdynamic viscosity, Pa·s
cpspecific heat, J/(kg·K)ρdensity, kg/m3
dtest tube diameter, mσsurface tension, N/m
dhhydraulic diameter, mSubscripts
fFanning friction factoraacceleration
FrFroude numberbulkBulk temperature
ggravitational acceleration, m/s2expexperimental
Gmass flux, kg/(m2 s)ffrictional
GstratStratified flow transition mass velocity, kg/(m2 s)iinner
GwavyWavy flow transition mass velocity, kg/(m2 s)ininlet
hheat transfer coefficient, W/(m2·K)lliquid phase
hlliquid height, moouter
hlddimensionless liquid heightoutoutlet
hlvlatent heat of vaporization, J/kgphpreheating section
kthermal conductivity, W/(m·K)refrefrigerant
Ltube length, msatsaturated
LMTDlogarithmic mean temperature, Kscsudden expansion
mmass flux, kg/sslsudden contraction
pPerimeter, mttotal
PPressure, kpatetest section
PrPrandtl numbertptwo-phase
Qheat transfer amount, Wtstest section
qheat flux, W/m2vvapor phase
ReReynolds numberwwater
T/ttemperature, K/°C
WeWeber number
xvapor quality
xIAintermittent to annular flow transition quality

References

  1. Li, W.; Tang, W.; Chen, J.; Zhu, H.; Kukulka, D.J.; He, Y.; Sun, Z.; Du, J.; Zhang, B. Convective condensation in three enhanced tubes with different surface modifications. Exp. Therm. Fluid Sci. 2018, 97, 79–88. [Google Scholar] [CrossRef] [Green Version]
  2. Guo, S.P.; Wu, Z.; Li, W.; Kukulka, D.J.; Sunden, B.; Zhou, X.P.; Wei, J.J.; Simon, T. Condensation and evaporation heat transfer characteristics in horizontal smooth, herringbone and enhanced surface EHT tubes. Int. J. Heat Mass Tran. 2015, 85, 281–291. [Google Scholar] [CrossRef]
  3. Sun, Z.C.; Li, W.; Ma, X.; Ma, L.X.; Yan, H. Two-phase heat transfer in horizontal dimpled/protruded surface tubes with petal-shaped background patterns. Int. J. Heat Mass Transf. 2019, 140, 837–851. [Google Scholar] [CrossRef]
  4. Kukulka, D.J.; Smith, R.; Li, W. Comparison of tubeside condensation and evaporation characteristics of smooth and enhanced heat transfer 1EHT tubes. Appl. Eng. 2015, 89, 1079–1086. [Google Scholar] [CrossRef]
  5. Kukulka, D.J.; Smith, R. Thermale-hydraulic performance of Vipertex 1EHT enhanced heat transfer tubes. Appl. Therm. Eng. 2013, 61, 60–66. [Google Scholar] [CrossRef]
  6. Sun, Z.C.; Li, W.; Guo, R.H.; He, Y.; Kukulka, D.J. Condensation heat transfer in horizontal three dimensional two-layer two-side enhanced tubes. Int. J. Heat Mass Transf. 2018, 127, 141–145. [Google Scholar] [CrossRef]
  7. Zheng, B.; Wang, J.; Guo, Y.; Kukulka, D.J.; Tang, W.Y.; Smith, R.; Sun, Z.C.; Li, W. An Experimental Study of In-Tube Condensation and Evaporation Using Enhanced Heat Transfer (EHT) Tubes. Energies 2021, 14, 867. [Google Scholar] [CrossRef]
  8. Chen, J.; Li, W. Local flow boiling heat transfer characteristics in three-dimensional enhanced tubes. Int. J. Heat Mass Transf. 2018, 121, 1021–1032. [Google Scholar] [CrossRef]
  9. Chen, J.; Li, W. Local convective condensation heat transfer in horizontal double-layer three-dimensional dimple-grooved tubes. Int. J. Heat Mass Transf. 2018, 127, 810–820. [Google Scholar] [CrossRef]
  10. Li, W.; Tang, W.Y.; Gu, Z.; Guo, Y.; Ma, X.; Minkowycz, W.J.; He, Y.; Kukulka, D.J. Analysis of condensation and evaporation heat transfer inside 3-D enhanced tubes. Numer. Heat Transf. Appl. 2020, 78, 525–540. [Google Scholar] [CrossRef]
  11. Gu, Y.; Ding, Y.; Liao, Q.; Fu, Q.; Zhu, X.; Wang, H. Condensation heat transfer characteristics of moist air outside 3-D finned tubes with different wettability. Energy 2020, 207, 118202. [Google Scholar] [CrossRef]
  12. Zhang, J.; Zhou, N.; Li, W.; Luo, Y.; Li, S. An experimental study of R410A condensation heat transfer and pressure drops characteristics in microfin and smooth tubes with 5mm OD. Int. J. Heat Mass Transf. 2018, 125, 1284–1295. [Google Scholar] [CrossRef]
  13. Zhao, C.; Ji, W.; Jin, P.; Zhong, Y.; Tao, W. The influence of surface structure and thermal conductivity of the tube on the condensation heat transfer of R134a and R404A over single horizontal enhanced tubes. Appl. Therm. Eng. 2017, 125, 1114–1122. [Google Scholar] [CrossRef]
  14. Ji, W.; Zhao, C.; Zhang, D.; Li, Z.; He, Y.; Tao, W. Condensation of R134a outside single horizontal titanium, cupronickel (B10 and B30), stainless steel and copper tubes. Int. J. Heat Mass Transf. 2014, 77, 194–201. [Google Scholar] [CrossRef]
  15. Ali, H.M.; Briggs, A. Condensation heat transfer on pin-fin tubes: Effect of thermal conductivity and pin height. Appl. Therm. Eng. 2013, 60, 465–471. [Google Scholar] [CrossRef]
  16. Tang, W.; Sun, Z.; Li, W. Visualization of flow patterns during condensation in dimpled surface tubes of different materials. Int. J. Heat Mass Transf. 2020, 161, 120251. [Google Scholar] [CrossRef]
  17. Li, G.; Huang, L.; Tao, L. Experimental investigation of refrigerant condensation heat transfer characteristics in the horizontal microfin tubes. Appl. Therm. Eng. 2017, 123, 1484–1493. [Google Scholar] [CrossRef]
  18. Kukulka, D.J.; Smith, R.; Li, W. Condensation and Evaporation Characteristics of Vipertex 1EHT Enhanced Heat Transfer Tubes. Chem. Eng. Tran. 2014, 39, 727–732. [Google Scholar]
  19. Kukulka, D.J.; Smith, R.; Li, W. Experimental Comparison of the Evaporation and Condensation Heat Transfer Coefficients on the Outside of Enhanced Surface Tubes with Different Outer Diameters. Chem. Eng. Tran. 2019, 76, 31–36. [Google Scholar]
  20. Li, W.; Wang, J.; Guo, Y.; Shi, Q.; He, Y.; Kukulka, D.J.; Luo, X.; Kabelac, S. R410Aflow condensation inside two dimensional micro-fin tubes and three dimensional dimple tubes. Int. J. Heat Mass Transf. 2022, 182, 121910. [Google Scholar] [CrossRef]
  21. Alves, G.E. Co-current liquid-gas flow in a pipeline contactor. Chem. Eng. Prog. 1954, 50, 449–456. [Google Scholar]
  22. Collier, J.G.; Thome, J.R. Convective Boiling and Condensation; Clarendon Press: Oxford, UK, 1994; p. 28. [Google Scholar]
  23. Taitel, Y.; Dukler, A.E. A model for predicting flow regime transitions in horizontal and near horizontal gas-liquid flow. AIChE J. 1976, 22, 47–55. [Google Scholar] [CrossRef]
  24. Steniner, D. Heat transfer to boiling saturated liquids. In VDI-War Meatlas (VDI Heat Atlas); Fullarton, J.W., Translator; VDI-Gessellschaft Verfahrenstechnik and Chemieingenicurwesen (GCV): Dusseldorf, Germany, 1993. [Google Scholar]
  25. Kattan, N.; Thome, J.R.; Favrat, D. Flow boiling in horizontal tubes: Part 1––Development of a diabatic two-phase flow pattern map. Heat Transf. 1998, 120, 140–147. [Google Scholar] [CrossRef]
  26. Kattan, N.; Thome, J.R.; Favrat, D. Flow boiling in horizontal tubes: Part 2––New heat transfer data for five refrigerants. Heat Transfer 1998, 120, 148–155. [Google Scholar] [CrossRef]
  27. Kattan, N.; Thome, J.R.; Favrat, D. Flow boiling in horizontal tubes: Part 3––Development of a new heat transfer model based on flow pattern. Heat Transf. 1998, 120, 156–165. [Google Scholar] [CrossRef]
  28. Wojtan, L.; Ursenbacher, T.; Thome, J.R. Investigation of flow boiling in horizontal tubes: Part I—A new diabatic two-phase flow pattern map. Int. J. Heat Mass Transf. 2005, 48, 2955–2969. [Google Scholar] [CrossRef]
  29. Hajal, J.E.; Thome, J.R.; Cavallini, A. Condensation in horizontal tubes, part 1: Two-phase flow pattern map. Int. J. Heat Mass Transf. 2003, 46, 3349–3363. [Google Scholar] [CrossRef]
  30. Cavallini, A.; Del Col, D.; Doretti, L.; Matkovic, M.; Rossetto, L.; Zilio, C.; Censi, G. Condensation in Horizontal Smooth Tubes: A New Heat Transfer Model for Heat Exchanger Design. Heat Transf. Eng. 2006, 27, 31–38. [Google Scholar] [CrossRef]
  31. Lemmon, E.W.; Huber, M.L.; Mclinden, M.O. NIST Standard Reference Database 23: Reference Fluid Thermodynamic and Transport Properties-REFPROP. 9.0; Standard Reference Data Program; National Institute of Standards and Technology: Gaithersburg, MD, USA, 2010.
  32. Gnielinski, V. New Equations for Heat and Mass Transfer in Turbulent Pipe and Channel Flow. Int. J. Chem. Eng. 1976, 16, 8–16. [Google Scholar]
  33. Petukhov, B.S. Heat Transfer and Friction in Turbulent Pipe Flow with Variable Physical Properties. Adv. Heat Transf. 1970, 6, 503–564. [Google Scholar]
  34. Rouhani, S.Z.; Axelsson, E. Calculation of void volume fraction in the subcooled and quality boiling regions. Int. J. Heat Mass Transf. 1970, 13, 383–393. [Google Scholar] [CrossRef]
  35. Richardson, B.E. Some Problems in Horizontal Two-phase Two-component Flow. Ph.D. Thesis, Purdue University, West Lafayette, IN, USA, 1959. [Google Scholar]
  36. Moffat, R.J. Describing the uncertainties in experimental results. Exp. Therm. Fluid Sci. 1988, 1, 3–17. [Google Scholar] [CrossRef] [Green Version]
  37. Dittus, F.W.; Boelter, L.M.K. Heat transfer in automobile radiator of the tubular type. Int. Commun. Heat Mass 1985, 12, 3–22. [Google Scholar] [CrossRef]
  38. Petukhov, B.S.; Popov, V.N. Theoretical calculation of heat exchange in turbulent flow in tubes of an incompressible fluid with variable physical properties. High. Temp. 1963, 1, 69–83. [Google Scholar]
  39. Biberg, D. An explicit approximation for the wetted angle in two-Phase stratified pipe flow. Can. J. Chem. Eng. 1999, 77, 1221–1224. [Google Scholar] [CrossRef]
  40. Zürcher, O.; Favrat, D.; Thome, J.R. Evaporation of Ammonia in a Smooth Horizontal Tube: Heat Transfer Measurements and Predictions. J. Heat Transf. ASME 1999, 121, 89–101. [Google Scholar] [CrossRef]
  41. Mashouf, H.; Shafaee, M.; Sarmadian, A.; Mohseni, S.G. Visual study of flow patterns during evaporation and condensation of R-600a inside horizontal smooth and helically dimpled tubes. Appl. Eng. 2017, 124, 1392–1400. [Google Scholar] [CrossRef] [Green Version]
Figure 1. (a) Schematic of the experimental setup. (b) Front view of the experimental setup. (c) Rear view of the experimental setup.
Energies 15 02951 g001
Figure 2. Schematic diagram of the test section of the experimental setup.
Energies 15 02951 g002
Figure 3. Images of the surface enhancement characters on the enhanced heat transfer surfaces: (a) 1EHT; (b) HX.
Energies 15 02951 g003
Figure 4. Schematic diagram of pressure drop.
Energies 15 02951 g004
Figure 6. Comparison of condensation heat transfer coefficients (h) for various mass flow rates (G).
Energies 15 02951 g006
Figure 7. Variation of condensation heat transfer coefficients (h) inside copper tubes (different outer diameters) with mass flow rate (G).
Energies 15 02951 g007
Figure 8. Variation of condensation pressure drop (ΔP) inside smooth and enhanced, 12.7-mm-OD tubes with mass flow rate (G).
Energies 15 02951 g008
Figure 9. Geometric parameters of two-phase flow in the heat exchange tube.
Energies 15 02951 g009
Figure 10. Flow patterns and HTC (h) in a smooth tube as a function of quality (x) for different mass flow rates (G).
Energies 15 02951 g010
Figure 12. Flow patterns and HTC of the Copper HX tube at different mass flow rates.
Energies 15 02951 g012
Table 1. Geometric parameters.
ParameterSmooth Tube1EHT TubeHX Tube
MaterialCu/SSCu/SSCu/SS
Outer diameter (mm)9.52/12.79.52/12.79.52/12.7
Thickness (mm)0.610.610.61
Length (m)222
Dimple (ridges)/fin height (mm)-0.19/1.710.25
Dimple (ridges)/fin width (mm)-0.35/1.340.31
Dimple (ridges)/fin pitch (mm)-40.8
Helix angle (°)-6021
Surface Area enhancement ratio11.341.44
Table 2. Accuracy of the primary parameters.
Measurement ParametersAccuracy
Di (mm)± 0.05
L (mm)± 0.2
T (K)± 0.05
P (range: 0–40 bar)± 0.08
ΔP (range: 0–100 kPa)± 0.05
mw (range: 0–12 L min−1)± 0.042
mref (range: 0–90 kg h−1)± 0.18
Table 3. Accuracy of the calculated parameters.
Calculation ParametersAccuracy
m (kg m−2 s−1)± 3.25%
Q (W m−2)± 4.71%
x± 6.30%
h (W m−2 k−1)± 11.32%
Publisher’s Note: MDPI stays neutral with regard to jurisdictional claims in published maps and institutional affiliations.

