Abstract
This article proposes a mixture of actions for the development of an effective and rational energy transition plan for all sectors and for all types of onshore final energy use in Crete. Energy transition is initiated with an appropriate capacity building campaign. The plan is based on the introduction of energy saving measures and the exploitation of all the locally available energy resources (wind, solar, geothermal potential, biomass), integrated in a cluster of centralized and decentralized power plants and smart grids to produce electricity and heat and for the transition to e-mobility. The core of the energy transition in Crete will be a set of 14 wind parks and Pumped Hydro Storage systems (PHS) for electricity generation and 12 Combined Heat and Power plants, properly designed and dispersed in the insular territory. Economic analysis is executed for the proposed essential power plants on the island. Biomass, solar and geothermal potential can cover the heating demand in Crete several times. Heat can be produced with a specific cost of 0.05 EUR/kWhth from cogeneration plants fired with solid biomass and biogas. The wind parks-PHS systems exhibit payback periods of approximately 10 years with a final electricity selling price at 0.12 EUR/kWhel. The article shows that 100% energy transition in Crete constitutes a feasible target.
1. Introduction
1.1. Energy Transition in Insular Systems
The term “energy transition” refers to the substitution of the fossil fuels consumed for various final energy uses based on Renewable Energy Sources (RES) via more effective energy generation processes, generally referred as the “Rational Use of Energy” (RUE). Energy transition attempts constitute on-going processes in most developed and developing countries implied by the necessity to move forward into a more sustainable future of energy generation and use and to minimize the consequences of climate change. In the European Region, it is officially applied to all member states as a direct obligation within dedicated directives promoting the use of energy from RES [1], as well as the energy efficiency and performance of buildings [2]. Particularly in insular energy systems, the implementation of energy transition practices has gained considerable attention by all involved stakeholders (academia, local and central authorities, private sector, local communities), due to the unique challenges that often appear and are connected with energy-related aspects such as the security of the energy supply, the stability of the electricity grid, the seasonality of the energy demands and most importantly an affordable energy supply cost.
The lack of any conventional energy resources in most insular territories and the concurrent high dependency on imported fossil fuels often result in insecurities in the energy supply. This is particularly important for non-interconnected insular power systems. Even in cases of interconnected insular systems with neighboring islands or with the mainland grid, several interconnection cable failures or malfunctions have been recorded during the last few years. Such incidences include the Aran Islands, Ireland (5 August 2016) [3], Menorca, Balearic Islands, Spain (23 May 2015 and October 2017) [4], Tilos (17 January 2016) and Kasos, Dodecanese Islands, Greece (25 July 2003), causing total power outages for periods ranging from 1 day in Tilos, 3 days in Aran Islands and 6 days in Kasos. During all these incidents, the power supply was initially restored with the aid of portable small size diesel oil power generators prior to the full restoration of the interconnection cable, which was after a period of around two weeks in all cases. The latter indicates the importance of the energy transition in insular areas in terms of the security and supply of energy needs.
In most islands around the world, the dependency on imported fossil fuels, apart from the energy security issues, causes a negative effect on the final energy production and supply costs for all final energy uses. The high recorded energy supply costs in insular systems are formulated by the high price of fossil fuels and transportation costs and, particularly regarding the power production, the typically low efficiencies of thermal power plants (30–35%) and the necessity to maintain a spinning reserve to ensure the system’s stability and dynamic security [5]. Indicatively, until summer 2021, the total electricity production cost in the Greek non-interconnected insular systems ranged from 0.20 EUR/kWh to higher than 1 EUR/kWh while, at the same time, it was lower than 0.07 EUR/kWh in the mainland [6]. Since winter 2021 and during the current energy crisis, the electricity production cost in the mainland grid is higher than 0.30 EUR/kWh.
On the other side, most islands in the world are characterized by a remarkably high RES potential. The most common renewable source for such areas is the wind and solar potential, while there are also cases of considerable potential for energy generation based on geothermal reservoirs, biomass and biomass residues. Especially in large size islands, such as Crete, Greece, where extensive agricultural and stock farming activities are flourishing, energy transition based on these types of RES is promising. The lack of required investments in infrastructure, the low awareness and indecisiveness of the islanders regarding the local power production and the restrictions on the direct RES penetration into the autonomous insular grids [7,8] means that in most cases the available RES potential remains unexploited.
In addition to the above discussed parameters, the unique natural environment and the outstanding landscapes can be seriously affected not only by the excessive use of fossil fuels but also the massive RES-related installations of large-scale energy production projects (wind parks, photovoltaics, geothermal, biomass and biomass residues power plants) [9,10]. Such approaches, proposed typically by prominent investors, very often provoke common sense and cause serious negative reactions against the installation of such RES projects [11].
Accounting for all these peculiarities, the European Commission has since 2018 taken over the “Clean Energy for E.U. Islands” Initiative, aiming to support and guide islanders to approach an effective and rational energy transition for their islands with their own active involvement in the implementation of the required actions and projects [12]. Within this initiative, an island network has been established with tens of European islands involved, aiming to exchange support and awareness between them and a team of experts on topics and issues related to energy transition (technical subjects, capacity building, funding, energy policy, etc.). Six of them have been selected as pilot islands and twenty more have been declared as pioneering islands, including islands from all the European regions and seas, from very small (Cape Clear, Ireland) to large size (Crete) [13]. These 26 EU islands in total are encouraged and supported by the Clean Energy Initiative to develop their Clean Energy Transition Agendas (CETA), which are anticipated to constitute pilot plans and stimulate islanders in the rest of the islands in the European continent to act.
Energy transition is a popular subject in the scientific literature. Several approaches and attempts towards the achievement of a high RES penetration and energy independency in insular energy systems have constituted the topics of a considerable number of articles during the last three decades. These articles can be categorized in two major groups:
- Formulation of technical concepts and proposals for the achievement of high RES penetration in insular systems.
These articles deal with alternative technical concepts aiming to increase the energy production share from RES on an annual basis. Power production is extensively studied mostly with the combination of RES production systems and storage technologies, formulating the so-called “hybrid power plants” [14]. For medium and large size islands, the combination of wind parks and Pumped Hydro Storage systems (PHS) has been proven to be the most feasible solution, both from a technical and economic point of view [15,16,17,18,19]. The provided large energy storage capacity and the seasonal fluctuation of power demand usually observed in insular systems offers the opportunity to exploit the power surplus created during the low power demand periods. This can be achieved by the introduction of additional power demand in the electrical grid due to the electrification of all sectors, e.g., transportation by e-vehicles, heating by heat pumps, etc. [16]. So far there are two wind parks—PHS systems constructed and operating in the islands of El Hiero (Canary Islands, Spain) [20] and Ikaria (Eastern Aegean Sea, Greece).
For smaller islands, several alternative integrations have been studied and proposed, consisting of combinations of different RES and storage technologies. The most popular layout is the wind turbines, photovoltaics and electrochemical batteries system [21,22,23]. The achieved storage capacity of these integrations is remarkably lower than in the layouts supported by PHS [24] due to the considerably higher procurement cost of the electrochemical storage devices and the requirements for replacement due to the short lifespan. For these reasons and to avoid high annual green electricity rejection, precisely due to low storage capacity, more sophisticated approaches and with additional production or storage components have been proposed for small and isolated energy systems. Among them, perhaps the most prominent technology is the combined energy storage with concurrent hydrogen production [25,26,27]. In other cases, the introduction of biomass residues-to-energy plants have been suggested [28], e.g., at Reunion Island, where it was estimated that biomass can cover more than 50% of the annual electricity needs [29,30]. Another option, rather rarely referred to in the scientific literature, is the electrical interconnection of small islands, which could contribute to the achievement of high and secure RES penetration, an option studied for the small islands of Pico and Faial in Azores [31].
In a more integrative approach, the introduction of smart grids has been studied, promoting the active participation of final consumers through Demand Side Management (DSM) strategies and the overall treatment of all final energy consumption sectors (commercial, residential, transportation, etc.) in the electrical smart grid [32,33,34]. The first insular smart grid in Europe has already been constructed and developed in the Greek island of Tilos, funded by the European Commission in the frame of the H2020 TILOS project [35]. It combines the operation of a small hybrid power plant, consisting of a wind turbine, a photovoltaic park and an electrochemical storage plant, with the introduction of essential DSM strategies in the local settlements [36,37].
- b.
- Developmental, social and environmental issues regarding energy transition and energy policy.
Several articles have been also published regarding the developmental, social and environmental extensions of energy transition in insular territories. In general, the objective of these articles is to outline the optimum strategies to facilitate and accelerate a smooth and effective energy transition with the minimum possible negative impacts on the natural environment. This also includes existing human activities, maximizing, at the same time, any potential expected benefits for the local communities (social, developmental, economic) [38]. The configuration of a positive public opinion is outlined as the most critical parameter for a successful and unhindered energy transition. Although 10–20 years ago RES-based projects had a wide public acceptance according to executed statistical surveys [39], the massive applications for new large size ones and the subsequent total occupation of the insular land has raised some serious negative reactions [11]. This unfavorable situation can only be changed with a cluster of measures and actions. First of all, appropriately designed capacity building campaigns [40] will help the local communities to learn about the social, environmental and economic perspectives of RES and RUE projects and understand how to eliminate any negative impacts and to claim potential funding for their own projects. Secondly, the design of clear and integrative spatial planning, with priorities regarding both the utilization of optimum technologies and the construction of specific RES projects [41,42] will enable an effective energy transition and the elimination of any potential impacts. The latter will also include as part of the consideration their appropriate placement [39,43], accounting for, apart from the availability of RES potential, any land use restrictions due to environmental and human activities issues. Nevertheless, above all, the active involvement of the local stakeholders in all stages of the energy transition process (design, sizing, placing, investing, operation and management) [44,45] seems to be the most effective way to ensure public acceptance and promote energy transition.
1.2. Objective of Research and Innovation
Crete Island, as one of the 20 pioneering islands of the “Clean Energy for E.U. Islands” Initiative [13], has undertaken the task of developing its CETA with the involvement of all local involved stakeholders from academia, local authorities, private firms and local communities. Such an agenda will also serve as the basis for islands around the globe with similar energy needs and climate conditions in the European continent and beyond.
This article presents a detailed and multidisciplinary energy transition plan for the island of Crete, Greece. Energy transition for all different energy sectors, types of energy and energy uses in the island are studied, covering the current power and heating use, hot water production and onshore transportation. The latest available and officially reported data regarding the energy consumption in all sectors and the availability of RES potential are analyzed. Specific actions and the implementation of projects are proposed for electricity generation, thoroughly placed and sized, following a computational simulation of their annual operation. Apart from the technical solutions suggested for the coverage of the energy needs of the specific island, this article also presents the currently configured distorted status on the RES project’s implementation in Crete and proposes actions and measures for its remedy, following the momentum and the framework of the relevant directives [1,2] of the European Commission.
2. The Status of the Current Energy Use in Crete Island, Greece
2.1. General Data
Crete is the biggest island in Greece (8336 km2) and the fifth in size in the Mediterranean basin, with a population of 634,930 inhabitants [46]. It is located between the geographical longitudes from 23°30′ E to 26°22′ E and latitudes from 34°53′ N to 35°42′ N. The island’s length from the eastern to the western coast is approximately 260 km, while its width from the northern to its southern coast ranges between 12 km and 60 km. The island’s coastline has a total length of approximately 1000 km. The location of Crete in relation to Greece is depicted in Figure 1.
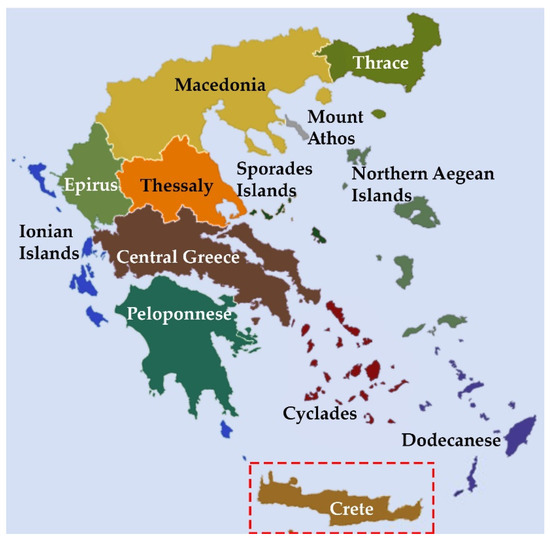
Figure 1.
Location of Crete in relation to Greece (adapted from https://www.touropia.com/regions-of-greece-map/, accessed on 6 March 2022).
According to the 2011 national census, the percentage of age groups within the entire population of Crete is shown in Figure 2 [47].
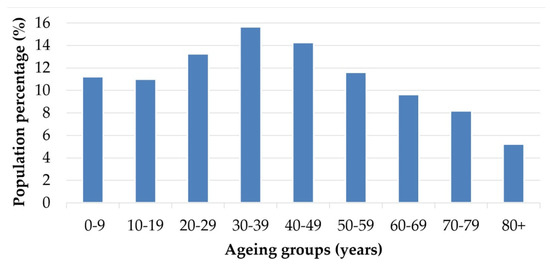
Figure 2.
Location of Crete in relation to Greece (adapted from https://www.touropia.com/regions-of-greece-map/, accessed on 6 March 2022).
From Figure 2 it is concluded that, unlike any other general trend in Europe and particularly for Greece which is known for its aging population, Crete exhibits quite an optimistic trend regarding the ageing of its population: 51% of the Cretan population is below 39 years old, with only 23% of people above 59 years old.
As it concerns the Cretan economic activity, tourism, commerce and agriculture–animal breeding constitutes an incredibly high percentage of 46% of the overall economic activity in the island. The evolution versus time of the per capita gross domestic product in Crete is illustrated in Figure 3, broken down as per the four prefectures of the island: Heraklion, Chania, Rethimno and Lasithi [48]. The effect of the economic crisis that has affected the Greek economy since 2008–2009 on the local economy of Crete is clearly depicted in Figure 3, although a promising upward trend has occurred since 2017.
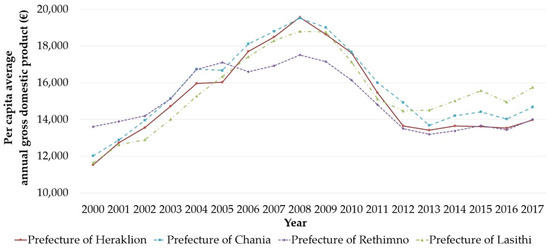
Figure 3.
Variation of per capita average annual gross domestic product versus time (2000–2017) in Crete, adapted from [48].
Finally, another interesting statistical feature is the evolution versus time of the unemployment percentage in Crete since 2014 (Figure 4) [49]. The clear trend towards a reduction in the unemployment percentage is clearly reflected in Figure 4 after 2015, owing to the gradual recovery from the economic crisis in Greece.
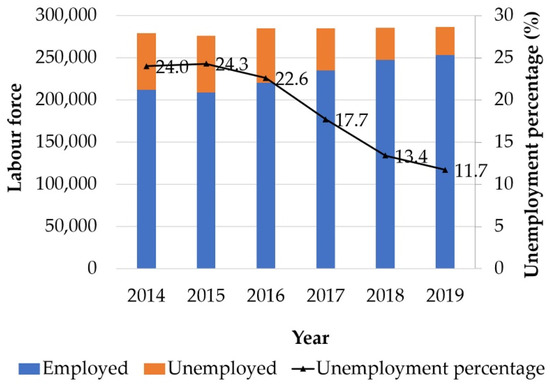
Figure 4.
Unemployment data in Crete since 2014 [49].
The most intensive activity in the island with regard to greenhouse gas emissions is the power production, which is heavily based on imported fossil fuels and the transportation from, to and on the island. More analysis and information on these emissive and energy consuming activities is included in the next section.
What is revealed from the above analysis is that Crete is a vivid island with a high percentage of young people in the population and, at the same time, a robust and still developing economy. It recovered from the recent economic recession quite quickly, mainly due to the large tourist sector. Among the disadvantages of the structure of the local economy in Crete is the heavy dependence on tourism and the lack of any activities related to the exploitation of the high RES potential.
2.2. Current Final Energy Uses in Crete
The final energy uses in Crete are covered by the following sources:
- Electricity, for indoor space conditioning (heating and cooling), lighting and other residential and non-residential uses;
- Diesel oil, gasoline and LPG for transportations on the island, heating and cooking;
- Heavy fuel oil, diesel oil and jet fuels for transportation from and to the island;
- RES, biomass and solar energy for indoor space heating and hot water production, respectively.
The annual final energy consumption in Crete, based on the aforementioned final uses in the island, is tabulated in Table 1. The illustrated data retrieved for the last available year of 2019, apart from the liquid fossil fuel consumption, which was only available specifically for Crete for the years of 2017 and 2018. In the same table, the corresponding annual CO2 emissions are also reported.

Table 1.
Final energy consumption analysis in Crete Island, Greece (2019).
It is worth noticing that the following databases were used for the extraction of the information presented in Table 1:
- The annual electricity consumption was provided by the local utility company (Hellenic Electricity Distributor Network Operator—HEDNO) [50]. The distribution of the electricity consumption per sector was found in the Hellenic Statistical Authority [51];
- The annual diesel oil, gasoline and heavy fuel oil consumptions were also provided by the Hellenic Statistical Authority for 2017 [52];
- The annual LPG consumption was provided by the local supplier in Crete;
- The annual jet fuel consumption was calculated given the specific fuel consumption for each airplane type traveling to and from all three airports (Heraklion, Chania, Sitia) in the island [53] and the number of flights per year from and to the island found in the annual air traffic statistics bulletin of 2018 of the Civil Aviation Authority [54];
- The annual heavy fuel oil and diesel oil consumption for maritime transportation was calculated on the basis of the specific fuel consumption per nautical mile for each type of different ship employed in Crete, given by the corresponding shipping companies and the departure and arrival datasets from and to the three (3) main Cretan ports: Heraklion, Chania and Sitia;
- The annual thermal energy production from the solar thermal systems was estimated by assuming that roughly 40% of the residential buildings in Crete (according to unofficial estimations) and all the hotels are equipped with solar systems for hot water production. Then, a typical daily hot water consumption of 40 L per user at 45 °C was assumed [55]. The water temperature in the water supply network was derived from the Greek Directive on Buildings Energy Performance (GDBEP) [55] for the region of Crete. Characteristic coverage percentages per month of the hot water demand from the solar systems were assumed based on empirical and statistical data [56]. Finally, the monthly hotel bookings were also considered given by Chamber of Commerce and Industry of Heraklion, Crete;
- Biomass and biomass residues, consumed exclusively on Crete Island are in the form of wood and woody residues exploited in traditional fireplaces mainly in small villages and as wood pellets in biomass burners. It was however practically impossible to acquire official data on the biomass use in Crete, as those data have not yet been reported. However, based on Giamalaki and Kolokotsa [57], as well as on personal experience and estimations, the annual energy use from biomass and biomass residues in Crete Island has been estimated to be 60,000 MWh.
Finally, the CO2 emissions were calculated based on the resource consumption of the annual energy carriers- and the corresponding factors for the specific CO2 emissions per unit of initial energy resource consumed defined in the Greek Directive on Buildings Energy Performance (GDBEP) [55].
Based on the estimation of the annual final energy use per sector, the percentage share of each one is shown in Figure 5. An important finding is that the transportation sector from and to the island exhibited the highest share of the annual final energy use of the region, with the transportation on the island being the second highest consumer of energy.
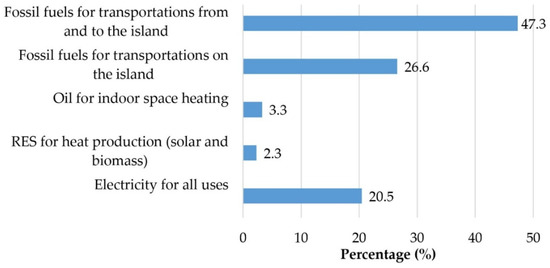
Figure 5.
Percentage share of annual energy use in Crete per energy source.
2.2.1. Electricity Consumption Features
Electricity demand in Crete exhibits very intensive seasonal fluctuations due primarily to the effect of tourism which causes a sharp population increase and an increase in the associated activities mainly during the core touristic period from April to October, corresponding to 58% of the year. Electricity consumption is mainly attributed to the buildings sector, as can be seen in Table 1 (residential and tertiary sector). The major final energy use in buildings in the European Union is related to the heating and cooling needs of indoor spaces [58], the latter being very important for the climatic conditions on the island. This fact is also clearly depicted in Figure 6, which presents the annual variation of the peak daily power demand in Crete for three recent consecutive years (2017–2019) [50].
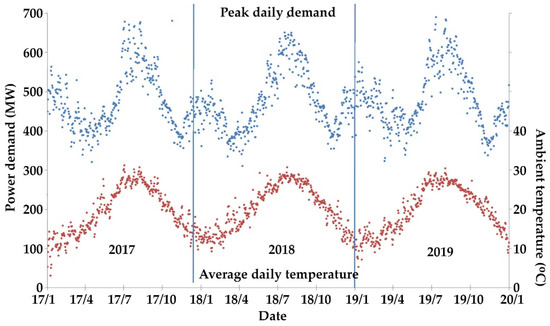
Figure 6.
Annual fluctuation in the daily peak demand in Crete for three consecutive years [50].
It is observed, as was expected, that the power demand in Crete is maximized during summertime, a noticeable boost which is obviously due to tourism and the need for cooling, while there is a slight increase too during winter time. This slight increase in the wintertime energy consumption is attributed to the gradual transfer of the heating needed to obtain full coverage from the conventional to the alternative heating technologies and specifically from oil-fired boilers to the heat pumps. The seasonal fluctuation in the power demand is also depicted in the annual power demand time series of 2019 (Figure 7).
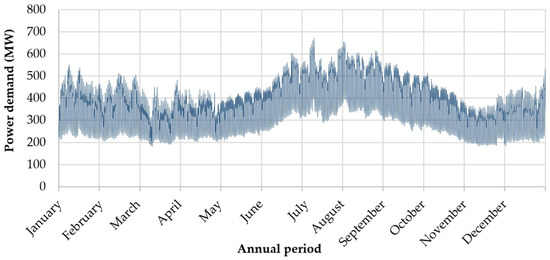
Figure 7.
Annual electricity demand fluctuation for the year 2019 as per hours [50].
Electricity production in Crete is based on three oil-fired thermal power plants, equipped with steam turbines and diesel oil generators running on heavy fuel oil, gas turbines and a combined cycle power plant, running on diesel oil. The power production system is integrated with wind and photovoltaic parks, installed either in the countryside or on the building’s roofs and a small hydro power plant. The total installed power capacity in Crete as per different technologies and the corresponding annual electricity production in 2019 are summarized in Table 2. The annual CO2 emissions from the thermal plants are also presented in this table.
Table 2.
Analysis of the electrical system and the annual electricity production in Crete in 2019.
From the analysis shown in Table 2 it is shown that the electricity production in Crete is mainly based on the use of imported heavy fuel oil and diesel oil and the exploitation of the available wind and solar energy that contributes to only 21% of the overall production. The evolution of the annual share of the energy resources on the electricity production in Crete since 1995 is depicted in Figure 8. From this figure it can be seen that the exploitation of RES in Crete began in 1998 with the simultaneous installation of the first wind parks. The installation of the first photovoltaic systems started more than ten years later and specifically in 2010. The achieved contribution percentage of the annual electricity production from RES should be considered satisfying given that the Crete Island was a non-interconnected system until June 2021, with important restrictions on the permissible installed RES power and the consequent electricity penetration from RES in the grid.
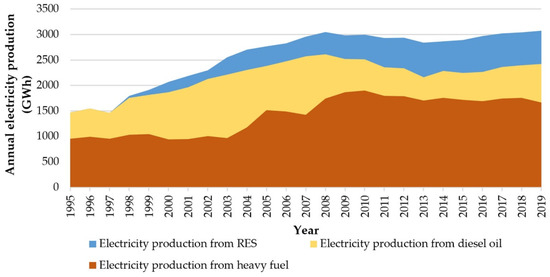
Figure 8.
Evolution of the annual electricity production in Crete from the involved energy resources (1995–2019) [50].
Another important element depicted in Figure 8 is the effect of the economic recession which led to the reverse of the constant increasing trend of the annual electricity production due to the decrease in the associated power demand between 2008 and 2013. This fact is also depicted in Figure 9, which presents the evolution of the annual peak power demand and the annual electricity consumption in Crete since 1964. It seems that since 2014 the electricity demand in the island has again started increasing monotonically. Yet, from 2020 a new decrease in the electricity consumption is expected due to the effect of the measures taken against the SARS-CoV-2 pandemic.
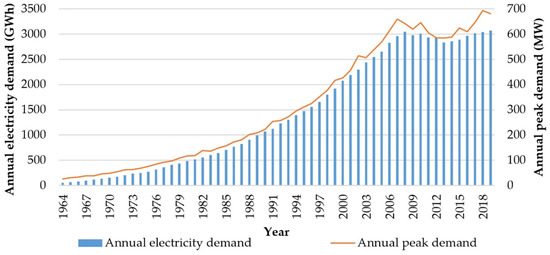
Figure 9.
Evolution of the annual peak demand and the annual electricity consumption in Crete since 1964 [50].
The electricity supply system in Crete, as a non-interconnected system until June 2021, was vulnerable with regard to faults or damages in the production plants, as well as in the transportation and distribution grid. The contingencies or events that led to total power production losses in 2019 in Crete are summarized in Table 3 [50]. The main reasons for these interruptions are analyzed as 35 generators’ tripping or disturbances, totaling 19 faults in both the transportation and distribution grid and in the substations. All these contingencies were treated successfully by the specialized staff of HEDNO. Given their long-term experience and high level of expertise, they considerably restricted the equivalent interruption time despite the relatively high number of contingencies. Yet, these facts highlight the sensitivity of the power system of Crete whilst it was an autonomous and non-interconnected grid, despite its large size.
Table 3.
Electricity production losses in Crete (2019).
It is worth mentioning that the levelized cost of the electricity production in Crete was calculated at 0.237 EUR/kWh in 2019, analyzed as 0.127 EUR/kWh of variable cost and 0.110 EUR/kWh of fixed cost [50]. Since December 2021, due to the dramatic increase in the international prices of fossil fuels, the specific cost of total electricity production in Crete must have become considerably higher than 0.30 EUR/kWh (official figures have not yet been officially announced).
2.2.2. Transportation and Energy Needs
The energy needs for onshore and offshore transportation in Crete are totally covered by imported fossil fuels (diesel oil, gasoline, LPG, heavy fuel oil and jet fuels). The transportation sector is very important for Crete, particularly due to the significant size of the island. This creates the need for extensive transportation on the island every day, as well as, due to the intensive commercial activities related to Crete running through the whole year the imposition of requirements for daily offshore connections between Crete and Greek mainland, the surrounding islands and abroad. Transportation from and to the island constitute the most energy-consuming activity in Crete, while transportation on the island comes next. The approach to energy transition in this sector, especially regarding the transportation from and to island, features as the most difficult and uncertain task regarding the overall energy transition in Crete.
2.2.3. Heating and Cooling for Residential and Commercial Use
After 1980, indoor space heating was covered mainly with the use of diesel oil in central heating systems in Crete. Diesel oil is still the dominant energy source for indoor space heating in the island, although it has been considerably restricted due to the introduction of a special tax in 2010, leading to a 35% increase in the price of diesel oil. Since 2010, the use of diesel oil for indoor space heating has been gradually substituted by electricity and biomass residues, mainly through the use of heat pumps and the installation of biomass heaters and hydronic fireplaces running with biomass in Cretan households. There is also a low number of indoor space conditioning systems with geothermal heat pumps, established mainly in tourist accommodation facilities and in a few residential buildings. So far there is no operating district heating or cooling system or any plans for future installations.
Finally, there is the case of “solar cooling”, a system based on an absorption chiller powered by a solar thermal system installed in a hotel. The extensive use of solar thermal systems in residential and tourist accommodation facilities is certainly remarkable. It was estimated that more than 60% of the residential buildings and 80% of tourist accommodation buildings in Crete are equipped with them, although this has not been officially measured. As a result, the solar thermal systems cover about 20% of the thermal energy needs in Crete; however, these installations are solely restricted to hot water production.
2.2.4. Rational Use of Energy—Energy Efficiency
In Crete, as well as in Greece, the rational use of energy and energy efficiency still remains a target that is difficult achieve. This is particularly important for the residential sector which is responsible for 22.6% of the total energy consumption in Crete or similarly for 43.1% when the energy consumption for the transportation from and to the island is excluded, as Figure 10 illustrates. Most residential buildings in Crete are classified as category D, according to the Energy Performance Certification (EPC) scheme, or even lower [59,60,61,62,63,64,65,66]. This fact is mainly due to the building envelopes’ inadequate insulation and the low-quality openings, as well as the use of aged and inefficient active heating and cooling systems, e.g., oil-fired boilers, aged technology of air-to-air heat pumps, etc.
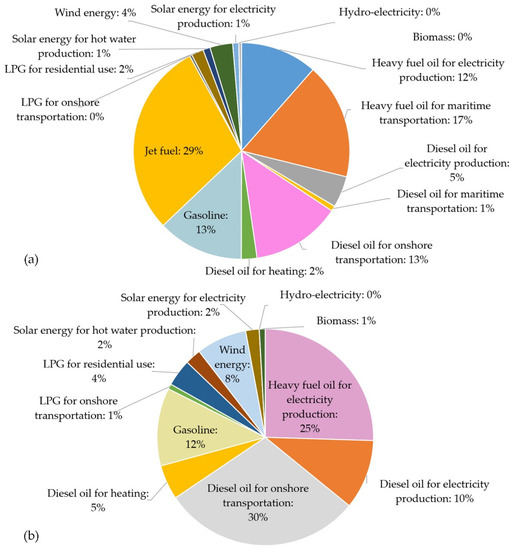
Figure 10.
Percentage contribution of energy sources for the final energy use in Crete (a) for the overall energy sectors, (b) only for the onshore energy sectors.
The successful implementation of energy performance upgrade measures in the building sector can lead to energy savings in the range of 40% to 60% (calculated versus the total energy consumption specifically in buildings), depending on the existing energy performance characteristics of the building stock [64,65,66]. These figures lead to the corresponding energy savings in relation to the overall energy consumption in Crete from 8% to 12%, respectively. Energy savings can significantly affect the power production system in the island and reduce not only the peak demand but also the daily electricity consumption during the whole year.
Conclusively, the main energy sources currently consumed or used in Crete are:
- Liquid fuels: heavy fuel oil, diesel oil, gasoline, jet fuels;
- Gaseous fuels: liquified petroleum gas (LPG);
- Solid fuels: biomass (wood, wood pellets, fruit stones, etc., agricultural and agro-industrial residues);
- Wind energy;
- Solar energy.
Given the gathered data, the exploitation of the RES in Crete is mainly restricted to the electricity production from wind parks, photovoltaics and to hot water production from solar thermal systems. In addition to that, biomass and shallow geothermal energy are also utilized in thermal energy production; however, the penetration of these specific technologies has remained limited until today. The contribution of the utilized energy sources based on the final energy use are summarized in Figure 10. More specifically, Figure 10a illustrates the overall distribution of the use of energy sources in Crete, including transportation from and to the island, while Figure 10b only depicts the onshore use of energy sources, respectively.
As seen in Figure 10b, the annual contribution of renewables on the onshore final energy consumption exceeds 12%. The same feature, calculated for the overall energy consumption was 5% based on the findings of Figure 10a. It is worth mentioning that the energy transition process in Crete aims to increase these percentages gradually to 100%, within a 50 year timeframe. In the following sections, potential paths and pillars towards this target for the onshore energy needs are analyzed.
2.3. The Electrical Interconnection of Crete
Currently there are three major plans for the interconnection of Crete with the mainland grid of Greece and neighborhood countries, with the one of them already implemented. Two of them are depicted in Figure 11 [67] and have been planned by the Independent Power Transmission Operator (IPTO), the mainland grid operator of Greece. The third one, the so-called “Euroasia Interconnector” [68], is an international project between Greece, Cyprus and Israel with their corresponding national grid utilities involved.
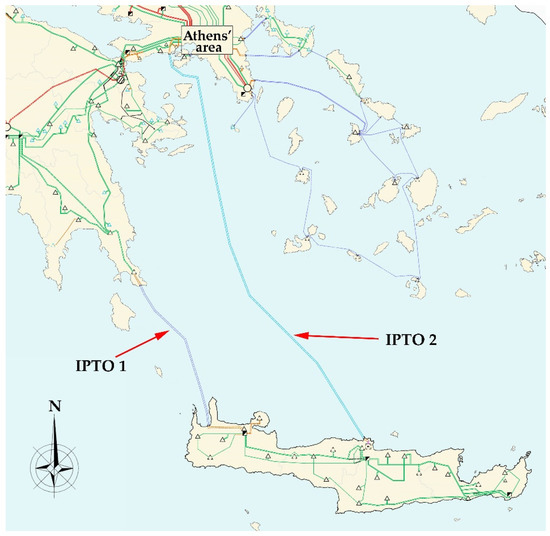
Figure 11.
The two routes (IPTO 1 and IPTO 2) of the national electrical interconnection of Crete with the mainland grid of Greece [67].
The fundamental technical characteristics of these interconnections are summarized in Table 4 [67,68]. From all three, the first IPTO interconnection was integrated in June 2021. The second IPTO is planned to be constructed between 2023 and 2025, while the third one is under negotiation with EU to receive financial support.
Table 4.
Technical characteristics of the planned electrical interconnections of Crete with the mainland grids of Greece (IPTO 1 and IPTO 2) and the international Euroasia with Cyprus and Israel.
The main objectives of the electrical interconnection in Crete are:
- Improvement of the power grid’s stability and the support of the dynamic security;
- Reduction in the currently high levelized cost for electricity production. The target is to approach the corresponding figure of the mainland grid, which is close to 0.065 EUR/kWh [69];
- The gradual total or partial shut-down of the existing thermal generators. These can be either the most polluting ones, namely the steam turbines and the diesel generators which operate with heavy fuel oil, or the most expensive ones, with regard to the specific cost of electricity production, namely the combined cycle and the gas turbines, which operate with diesel oil.
- The support for a more intensive and secure penetration of electricity produced by wind and photovoltaics parks. This target needs to be accompanied with the appropriate licensing and installation of more RES projects in the island.
The technical feasibility of the electrical interconnection in Crete is certain. However, the question arises as to whether the interconnection itself is adequate to ensure the aforementioned objectives. Obviously, the insular grid of Crete as an interconnected one will be more robust and will be more able to react after potential contingencies. Yet, experience has shown that the interconnection itself is not adequate to ensure the secure and uninterrupted power supply for insular grids, given the past incidences of Tilos, Kasos, Aran Island and Menorca, presented in the introductory section of this work. This fact practically imposes the necessity for the maintenance of a guaranteed power capacity on the island [70], further intensified by the expected increase in RES power penetration in Crete after its interconnection with the national and international mainland grids. If the required guaranteed power capacity is provided by maintaining in “cold” stand-by mode the existing thermal generators (or at least some of them), the fixed levelized electricity production cost (0.110 EUR/kWh in summer 2021) cannot be avoided. Accounting also for the electricity production cost of the mainland grid, (0.065 EUR/kWh in summer 2021 [69]), which will be transferred in the insular system increased by the transportation losses, a total final production cost in the island above 0.175 EUR/kWh should be expected. At the same time, onshore guaranteed power production will still be based on thermal generators and the imported fossil fuels. Conclusively, two out of the four essential objectives of the interconnection will not be met. Although the interconnection is technically feasible and functionally necessary, it is not adequate to fully support the effective energy transition in islands by itself. These inadequacies should be handled with proper actions related to the overall energy transition process, which are analyzed in detail in the following section.
3. Energy Transition Pillars and Routes
3.1. Scope
The energy transition, as a general process referring to an insular energy system, should aim at the following objectives:
- The achievement of total energy independency οn the island, in the sense that all final energy uses should be covered by a combination of energy saving actions and new installations of energy production technologies based on the locally available RES;
- The energy transition should be approached by the active involvement of local islanders in the design, implementation, management and operation of the required activities and projects, aiming at the establishment of the so-called “energy democracy”. This should be completed in the sense that all required projects within energy transition will be implemented and managed by the islanders;
- The supply of secure, abundant and affordable access for all islanders to clean and green energy, handling effectively and successfully once and for all the critical issue of energy poverty.
The steps, pillars and routes of the proposed energy transition in Crete analyzed in the next sections are aimed at fulfilling the aforementioned objectives.
3.2. Pillars and Routes towards Energy Transition in Crete Island, Greece
3.2.1. Pillar 1: Capacity Building
Greece has suffered considerably due to a distorted and anarchic approach followed so far in the development of power production projects from RES, enabled by an inadequate and unfair legislative framework [71,72]. This approach, in short, is characterized by the massive submission of applications for the licensing of large size projects (mainly wind parks) in the Greek islands by only a small number of prominent investing organizations. These projects have been sited and designed without the involvement or at least notification of the local stakeholders and communities. As a result, those have, in many cases, captured almost the overall insular territory, raising serious concerns about their potential impact on the natural environment and the existing human activities, as well as their actual value and contribution to the local development [11]. As a consequence of the above and since 2010 a serious and absolutely justified reaction movement against the majority of the RES projects has developed mainly in insular Greece. This however in many cases misinforms local communities and creates a negative status for the development of even small and rational RES projects.
The planning and realization of energy transition not only in Crete but for all Greek islands, should tackle this very serious and unfavorable reality as a priority. After all, a major ingredient for the successful integration of the overall effort is the massive and active participation of all citizens [73]. To this end, the beginning and the foundation of energy transition cannot be anything else but the valid and integrated education of the insular community through a properly designed capacity building campaign, which must cover the following aspects:
- What is energy transition;
- Objectives of the energy transition;
- Necessity of energy transition;
- Energy and environmental benefits of energy saving actions and energy production from RES projects;
- Economic and social development anticipated from energy transition;
- Other alternatives for the energy supply, if any, and what will happen if the energy transition is not achieved.
Crete is a large island with three universities, an independent research center, a specialized energy sector in the Region of Crete, Departments of the Technical Chamber of Greece, Commercial and Industrial Chambers, Energy Communities [74] and a large number of individual experts and specialized private companies. These stakeholders can undertake and fully support the task of capacity building. Actions should include either physical or distant learning educational events (seminars, info-days, webinars), while all modern virtual learning environments (VLE) and means can be also employed (online interactive courses, educational videos, social media, etc.).
In these educational events, all topics relevant to energy transition should be covered: energy saving, electricity and thermal energy production technologies from RES, smart grids, combined heat and power plants, e-mobility, energy poverty, energy policy, energy communities, etc. Those topics should focus on giving answers to the aforementioned questions and should be adapted to the islanders’ educational level, presenting the scientific findings in a simple way so they can be easily understood by the locals. Finally, targeted events should be configured and organized for different groups of citizens, depending on their age, educational status and their professional skills and expertise. For example, different educational activities can be designed for primary and secondary schools and university students, for the unemployed, for professionals in specific sectors (e.g., agriculture or tourism), for engineers, for recent graduates, for the elderly population and women as they are the traditional housekeepers in Crete, etc.
Capacity building is the essential basis of energy transition, which aims to persuade all islanders of the necessity of the energy transition and to stimulate them to be actively involved in the process.
Figure 12 presents the route of the first energy transition pillar, capacity building, from the initial to the final target.
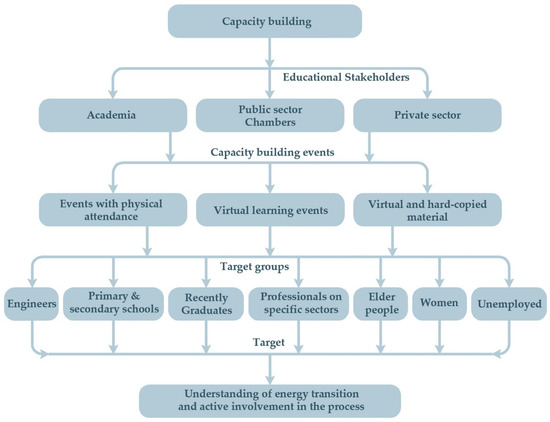
Figure 12.
Suggested roadmap for the successful and effective implementation of capacity building in rural areas such as Crete Island, Greece.
3.2.2. Pillar 2: Energy Saving—Rational Use of Energy
The technical actions of energy transition should be initiated with energy saving projects. As indicated in Section 2.2.4, the existing energy performance in Crete, as well as in the whole country of Greece, remains at a rather low level. As an indication, 84% of the existing residential building stock in Crete was evaluated according to the Energy Performance Certificate (EPC) scheme from D to G in 2016 [65], revealing the incredibly high waste of energy in the building sector, contributing to considerable energy loss.
Energy saving in Crete should focus on the following sectors:
- The residential sector;
- The tertiary sector, particularly those active in tourism (accommodation, food, commerce);
- The primary sector, particularly in agriculture and stock-farming, two of the main professional activities in the island;
- The secondary sector, particularly industry, wherever applicable (olive mills, wineries, etc.);
- The public and municipal facilities (buildings, water pump-stations and water networks, street lighting, sports facilities, etc.);
It has been shown that with the establishment of the appropriate passive and active measures, energy savings of more than 40% could be achieved in the residential buildings sector [63], schools [60], public buildings [61] as well as in sports facilities [63]. In the case of the swimming pools in particular, an energy saving of more than 80% could be expected due to their existing operation status (outdoor construction, heating based on oil) [75].
In short, energy saving can be achieved with the following measures:
- Introduction of energy saving passive measures in buildings, greenhouses, tourist facilities, industries (insulation, installation of high efficiency openings, the installation and effective use of dynamic shading devices, an enhancement of the bioclimatic/ passive design), aiming at the reduction in heating and cooling energy needs;
- Introduction of bioclimatic elements and constructions in outdoor urban spaces for the improvement of the local microclimate;
- Introduction of high-efficiency active systems for indoor space conditioning in buildings, greenhouses, industries, tourist facilities, etc., (e.g., geothermal heat pumps);
- Installation of low consumption electrical bulbs and floodlights for indoor and outdoor space lighting, together with smart centralized management systems for public lighting;
- Redesign of and amendments on the existing hydraulic public networks, in terms of the routes and diameters of the pipelines, along with the construction of water tanks, in order to reduce the network’s total head and to enable the operation of the pumps close to their nominal point;
- Introduction of electricity saving measures in large size inductive loads, such as the installation of variable speed drive systems in pump motors to enable their operation at partial loads;
- Coverage of all water heating needs (e.g., residential hot water production, swimming pool heating, low temperature industrial applications, etc.), with heat production from RES (e.g., solar thermal systems);
- Compensation of reactive power consumption from inductive loads.
Fundamental prerequisites for the implementation of the above indicative measures are the adequate and valid scientific, consulting and technical support and the availability of the required funding. The first can be supplied by the high-level academic and technical personnel available on the island who are experts on the relevant topics. The required funding resources can be retrieved by national and European funding calls, based on both public and private facilities. In fact, some efforts towards energy saving have been instigated since the early 2000s, funded initially by E.U. sources. Lately, several focused calls have been announced for schools, other public buildings, sports facilities and residential buildings and they have also been supported with a considerable contribution from national funds. It is evident then that, practically, the application of energy saving measures has already initiated in the island. However, this has resulted in a rather low number of final beneficiaries and the results are not robust to affect the whole picture. With the successful application of energy saving measures, a reduction of approximately 40% of energy consumption should be expected. This will enable the introduction of additional electrical loads in the system, such as e-mobility, without though exceeding the current level of power demand.
The main suggested route for the implementation of energy saving towards the final target of energy transition is depicted in Figure 13.
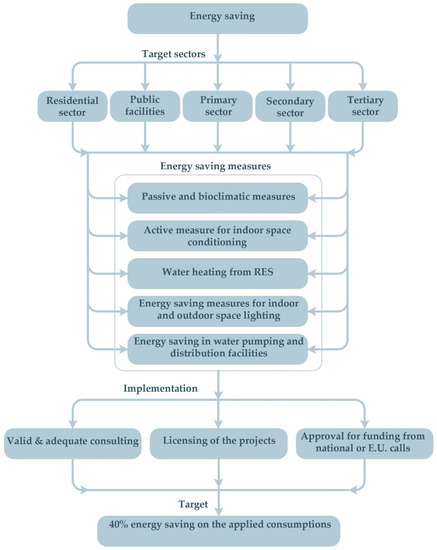
Figure 13.
Suggested roadmap for the successful and effective implementation of energy saving in all sectors in Crete.
3.2.3. Pillar 3: Heat Production from RES—District Heating and Cooling
Heat constitutes a major final energy use. On the island of Crete, heating needs can emerge from all sectors:
- Residential buildings, for indoor space conditioning and hot water production;
- Agriculture, for the conditioning of greenhouses, the heating of cultivation tanks and the drying of products;
- Tourist accommodation and sports facilities, for indoor space conditioning, hot water production and swimming pool heating;
- Specialized industrial uses.
For the above-mentioned end uses of heating and according to the current energy use and production data presented in Section 2, a considerable contribution of RES for heating production has been recorded taking into consideration only the hot water production from solar systems. Since no official data are available, it was estimated that 55–60% of the total final thermal energy required for hot water production in residential buildings is covered by solar technologies. For the tourism sector in Crete, this percentage is considerably higher and estimated to be more than 80%. The use of solar thermal systems for heat production is considered a mature technology with already established installations in the island at an excessive number. The local population is adequately aware of the energy and economic benefits of the use of solar systems for covering part of their energy needs. On average, the installation of at least 2 m2 for hot water production is considered to be definite for each residential building in Crete. In this section, no additional analysis will be presented for the aforementioned technology due to the extensive application in almost every residential building and tourist accommodation in the island.
However, apart from the exploitation of solar thermal systems for hot water production, all the other final heating needs are mainly covered by diesel oil and electricity. This cannot be justified for an island such as Crete, with a high potential availability for heat production from alternative RESs, apart from solar energy.
The agriculture and stock farming sectors account for the main professional activities in Crete, and the biomass and biomass residues constitute another important RES in the island. In Crete there are 27,000,000 olive trees [76]. If we assume that 20,000,000 of them are pruned every year, each tree produces about 20 kg of dry matter [77,78] and each kg of dry matter, excluding the leaves, produces 0.5 kg of wood pellets, then it was calculated that 200,000 tn of olive tree wood pellets could be produced only from the pruning of this traditional agricultural cultivation on the Crete Island. Assuming 5.2 kWh/kg [79] as the calorific value of the biomass pellets, a potential of 1,040,000 MWh is stored as chemical energy in this type of agricultural residue. Assuming a typical power and thermal efficiency of a compact, steam turbine cogeneration unit at 35% and 45%, respectively, 364,000 MWh of electricity and 468,000 MWh of thermal energy could be supplied by the exploitation of the olive tree wood pellets.
Furthermore, supplementary opportunities for energy production through the exploitation of the additional biomass resources are also available in the island. According to the Hellenic Statistical Authority, olive oil production in Crete, based on the last 5-years of available data, was calculated at 81,000 tn [80]. This olive oil production corresponds to the associated production of at least 61,000 tn of olive kernel wood on an annual basis, with 55% of water content on average, through a 3-phase olive oil mill [81]. It is worth noting that the olive kernel production fluctuates on an annual basis due to variations in the production cycle of the olive oil trees. However, the aforementioned figures are considered as secure and warrantable for further analysis regarding the olive kernel’s energy production potential in Crete. Considering 4.0 kWh/kg as the calorific value of olive kernel wood [82], the above amount corresponds to 244,000 MWh of embedded chemical energy content. Assuming the same power and thermal efficiency of a compact, steam turbine cogeneration unit calculated previously, 85,400 MWh of electricity and 109,800 MWh of thermal energy could be supplied by the exploitation of the olive kernel potential.
An additional important biomass residue comes from animal farming, another traditional activity of the island dating back centuries, accompanying olive tree cultivation. According to the Hellenic Statistical Authority, livestock in Crete amounted to 2,300,000 animals in 2016 (1,700,000 sheep with the rest being bovine, goats and pigs) [83]. Considering the following assumptions:
- A similar number of animal stock in Crete as in previous years;
- Manure production from sheep or goats 1.45 kg/day and animal (530 kg/a) [84];
- A total of 50% of the annual manure production can be collected;
- Biogas production from sheep manure 150 L/kg [85];
- Lower calorific value of biogas 5.5 kWh/Nm3 [86];
- Typical electrical and thermal efficiency of a biogas cogeneration unit at 43% and 46%, respectively;
a moderate and conservative estimation leads to the production of 91,425,000 Nm3 of biogas only from the available manure through the anaerobic digestion process. This biogas quantity once conditioned and supplied in Combined Heat and Power (CHP) (cogeneration) plants, could produce 216,200 MWh of electricity and 231,305 MWh of thermal energy annually, accordingly.
Finally, the annual organic waste fraction of the municipal solid waste emerging only from the 12 major cities and towns of the island was calculated at 60,112 tn/a, assuming the annual organic municipal waste production at 200 kg/capita [87]. This type of waste could produce 9,016,830 Nm3 of biogas, assuming again 150 L/kg specific biogas production from the organic fraction of municipal solid waste [88]. Keeping the aforementioned assumptions, this additional biogas amount could contribute 21,325 MWh of electricity and 22,813 MWh of thermal energy annually. The results from the above analysis are summarized in Table 5.
Table 5.
Annual power and thermal energy production potential based on the available biomass and biomass residues in Crete Island, Greece.
The total final thermal energy production surprisingly corresponds to 237.2% of the current annual useful thermal energy production emerging from diesel oil, according to the data presented in Table 1. It is evident from the above analysis that more than 680,000 MWh of electricity (22.4% of current annual consumption) and roughly 830,000 MWh of thermal energy could potentially be produced by the available biomass and biomass residues in Crete. Practically, olive tree agricultural (tree pruning), agro-industrial (olive kernels) and animal waste could fully undertake the coverage of all final thermal energy consumption in Crete, accompanied by the already existing solar collectors.
The exploitation of the above resources could be approached with:
- central heating burners running on pellets or briquettes for decentralized applications (small villages, remote settlements, agriculture applications etc.);
- a network of biogas-fired CHP plants, properly allocated versus the geographical topology of the biggest towns and cities in the island, accompanied with the development of the required district heating networks.
Indicatively, for the analytical purposes of this study, 12 biogas-fired CHP plants are proposed for the 12 cities and towns in Crete Island with populations of more than 3000 inhabitants, as depicted in Figure 14.
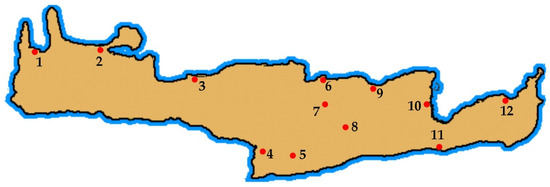
Figure 14.
The geographical location of the cities or towns of Crete Island with populations of more than 3000 inhabitants and the corresponding locations of the biogas-fired CHP plant’s installation.
The proposed biogas-fired CHP plants for each one of these areas are dimensioned according to the total heating needs of their residential total heating needs, estimated on the basis of former executed studies [63,64,65,66] at 60 kWh/m2 of the covered area, with an annual heating peak demand at 8.5 kW, assuming a constant—non-interrupted operation of the heating system. The results of this preliminary dimensioning stage are presented in Table 6.
Table 6.
Indicative dimensioning of biogas-fired CHP plants for the coverage of the residential heating needs of the 12 biggest cities and towns (population > 3000) of Crete Island, Greece.
Following the annual fluctuation in the heating needs of a typical residential building [63] and replicating it for the total number of residences presented in Table 6, an indicative annual time series for the total heating need in these particular residences can be taken (Figure 15). Assuming that the biogas-fired CHP plants presented in Table 6 will operate as bottoming systems [89], the operation point of each plant is determined by the heating demand. This means practically that the electrical power output simply follows the heating demand, which implies that:
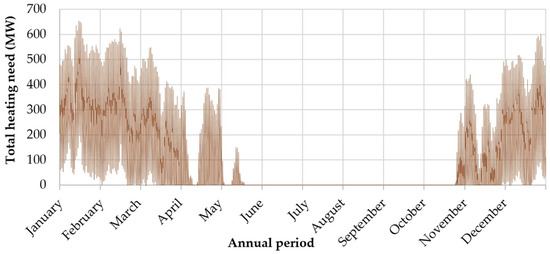
Figure 15.
Annual fluctuation in the total heating needs in the residential buildings of the 12 biggest cities and towns in Crete Island, Greece.
- In case the total electrical power output Pel, configured by the heating demand, is higher than the current power demand Pd, then the excess electrical power output Pel–Pd will be injected in the mainland grid, after the interconnection of the island. The CHP electrical power penetration of the insular grid will be estimated by Equation (1):
PCHP-p = Pd,
- If however the total electrical power output Pel is lower than the current power demand Pd, then all this power will penetrate covering the corresponding amount of the current power demand, namely the penetrating electrical power from the CHP plants will be based on Equation (2), shown below:
PCHP-p = Pel.
The remaining power demand, in any of the aforementioned cases, will be calculated based on the following equation (Equation (3)):
Pd-rem = Pd − PCHP-p.
With the above approach, the electrical power penetration from the biogas-fired CHP plants annual time series was estimated and presented in Figure 16, with a simple realization of the operation algorithm presented previously using MS excel.
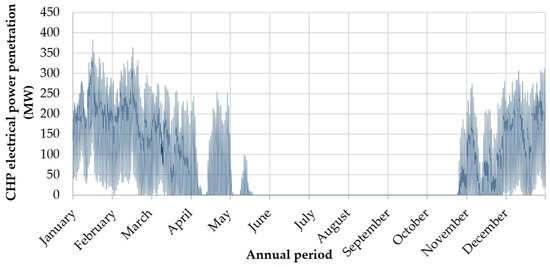
Figure 16.
Annual fluctuation in the electricity production from the biogas-fired CHP plants.
As expected, it can be seen that considerable electricity production is supplied during the winter period, and particularly when there is a need for heating supply. By integrating this time series, the annual electricity production from the biogas-fired CHP plants was calculated at 503,654 MWh, which corresponds to the 16.4% of the annual electricity consumption in Crete, in the year of 2019. The total annual electricity production potential from the CHP running on locally produced biogas and olive tree pellets was calculated at 525,043 MWh, which implies that 21,390 MWh of them are injected in the mainland grid (4.1%).
The total set-up cost of the required district heating networks for the aforementioned 12 cities and towns is roughly estimated at 675 MEUR by assuming the following:
- a total set-up specific cost of the heating network at 200 EUR/m [90];
- the total district heating network length calculated indicatively for some characteristic of the involved towns and cities and adapted versus the number of residences and the estimated population density for the rest;
- a set-up cost of EUR 2000–3000 € for the connection of each individual building to the network (pipelines, heat exchangers, valves, circulators etc.) [91].
The overall calculation analysis is presented in Table 7.
Table 7.
Analysis of the district heating network construction cost.
Additionally, with regard to the biogas production facility, a total set-up specific cost from 12 to 14 EUR/GJ of produced biogas chemical energy is adopted [92]. The total biogas production was calculated at 100,441,830 Nm3, which, given the aforementioned calorific value of 5.5 kWh/Nm3, corresponds to 552,430.06 MWh or 1,988,748.23 GJ of chemical energy. Given the adopted specific set-up cost of 14 EUR/GJ, the set-up cost of the required biogas production facilities was estimated at EUR 27,850,000.
For the estimation of the heat production specific cost, it is assumed that:
- The life period of the CHP units and the biogas production is 25 years and the life period of district heating networks is 50 years;
- A total of 48% of the total biogas and CHP units’ set-up cost corresponds to the electricity production and 52% to the heat production, given the final annual corresponding annual electricity and heat production from biogas (237,545 MWh and 254,118 MWh, respectively)
- The district heating networks’ total set-up cost refers to the heat production.
Given the above assumptions, the annual heat production specific cost was calculated at 0.0554 EUR/kWhth, revealing the high economic feasibility of the heat production aspect from biogas in Crete.
Finally, the heating and cooling needs can be also covered with the installation of shallow geothermal systems. This is easier especially for coastal settlements, where the option of open loop systems can be applied due to the availability of a seawater aquifer. Moreover, and taking into consideration their lower installation cost, compared to the closed loop ground heat exchangers, the open loop geothermal systems exhibit a higher economic feasibility [62]. Additionally, the narrow temperature fluctuation range through the year (lower than 10 °C, as shown in Figure 17 [93]) and the time lag between the lowest–highest seawater and ambient temperature introduce highly favorable working conditions for the geothermal heat pumps, leading to higher Coefficient of Performance (COP) and Energy Efficiency Ratio (EER) values (at the range of 6), and the corresponding limitation of the electricity consumption. Ideally, for these coastal settlements with extensive tourist activities during summer and consequently increased cooling needs, the development of district cooling networks based on open loop geothermal systems features as an extremely promising solution. Savings in the electricity consumption at the range of 40% can be anticipated, compared to the currently recorded ones for the competitive air-to-air heat pump systems [94,95].
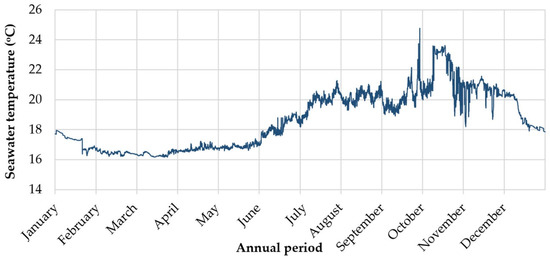
Figure 17.
Annual fluctuation in the seawater temperature at a 50 m depth, 50 miles north from Heraklion city, Crete [93].
Summarizing the aforementioned analysis, a carefully balanced combination of solar thermal systems, central heating systems and CHP plants fired by biomass and biomass residues along with ground source heat pump systems (ideally open-loop) can lead to 100% coverage of the heating and cooling needs in the island. The main barrier to this approach is the high set-up and operation costs of the required biogas production facilities from manure and urban organic wastes. Figure 18 shows the routes towards the accomplishment of this target.
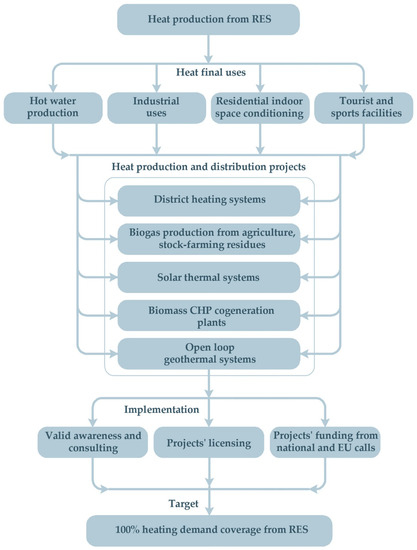
Figure 18.
Target and route for the 100% coverage of heating and cooling needs from Renewable Energy Sources (RES).
3.2.4. Pillar 4: Transportation on the Island
Given the currently available technological and economic data, the most feasible roadmap towards energy transition for the onshore transportation in Crete is the introduction of electrical vehicles, on the obvious condition that they will be powered by clean and green RES-based electricity. The electricity production from RES is separately investigated in the following section as a discrete energy transition pillar.
E-transportation is dominants today as the most promising technology towards the elimination of the consumption of conventional liquid fuels in onshore transportation. This reality could possibly change in the future, depending on the technological progress in relation to hydrogen production and its usage as a clean fuel in the transportation sector.
Energy transition in the transportation sector in Crete constitutes a major challenge given the large size of the island and the extensive onshore transportation. The existing e-transportation technology can cover the majority of onshore transportation, apart from the large size vehicles (trucks, buses, machinery). For these particular vehicles, energy transition can be approached with the use of biodiesel, produced by the abundant locally produced biomass residues and their potential, or with the use of hydrogen, possibly at a medium to long term timeframe. Unfortunately, no discrete data were available for the existing diesel oil consumption in large size vehicles in Crete specifically. For this reason, it was assumed that the total energy consumption for on-shore transportation will be totally transferred to e-mobility, approaching, in this way, an “on the safe side” calculation regarding the expected electricity consumption for the transportation sector on the island.
Given the final energy consumption for the transportation sector and assuming an average fuel consumption of 7.2 L/100 km for all categories of small and medium size vehicles [96], the expected electricity consumption for e-transportation in Crete was analyzed in Table 8, with the adoption of an average specific electricity consumption in e-vehicles of 20 kWh/100 km also [97].
Table 8.
Estimation of the expected annual electricity consumption in Crete for e-mobility.
The total expected annual electricity need for e-mobility, as shown in Table 8, corresponds to 38.5% of the annual electricity consumption in 2019 (3,071,926 MWh). Yet, this additional electricity consumption for e-mobility is expected to be compensated with the reduction in the existing electricity consumption due to energy saving measures in buildings and the electricity production from the abundant biomass residues resources (537,345 kWh), which corresponds to 45.5% of the annual estimated electricity consumption for onshore e-transportation.
The transition to e-mobility in Crete constitutes perhaps the most demanding energy transition pillar in the island since its implementation depends mostly on the funding ability of the Cretan citizens to procure e-vehicles. However, for an island the size of Crete and the high amount of the required onshore long transportation, the transition to e-mobility has a high economic feasibility, given the considerable reduction in the transportation costs. It is worth noting that the fossil fuel consumption of 7.2 L/100 km corresponds to an average transportation cost of 10.1 EUR/100 km (average gasoline price at 1.45 EUR/L). With e-vehicles, this cost will be reduced to 3.4 EUR/100 km, accounting for the current existing electricity pricing for the final consumers (roughly 0.17 EUR/kWh). This 66% reduction in the transportation cost creates a strong incentive for the transition to e-mobility, despite the currently high procurement cost of e-vehicles.
Aiming to configure an estimation for the annual fluctuation of the electrical power demand for e-vehicles charging in Crete, a daily loading profile was first adopted, based on facts and predictions in the relevant literature [99]. This profile incorporates e-vehicle charging at home, at work, at charging stations and at shopping malls and is presented in Figure 19.
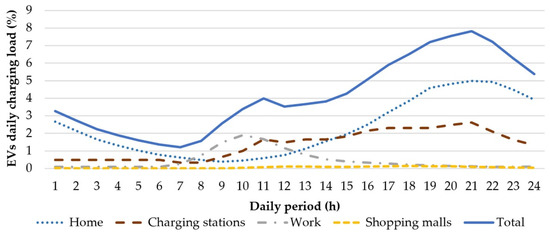
Figure 19.
Daily load charging profiles of e-vehicles.
The annual electrical demand time series was configured by replicating this daily charging profile for all days of the year, multiplied with a weight factor which varies from month to month, in order to take into account the annual population fluctuation on the island through the year, considering also the additional load due to tourism, as Crete is one of the most famous destinations for summer holidays in Europe.
The transition to e-mobility in Crete can be realized via the following essential steps:
- The first pilot phase could contain the installation of a rather small number of charging stations in strategically selected locations on the island (e.g., in the aforementioned 12 major urban centers);
- The second pilot phase could be integrated with the procurement of e-vehicle from public entities (municipalities, energy communities, etc.);
- The availability of an economic contribution from the Hellenic State to the e-vehicle procurement cost could also be crucial in the second stage, which will be the expansion of e-mobility first to a considerable number of private users.
- The third phase will start with extensive installations of public and private electrical charging stations.
- Finally, the reduction in e-vehicle procurement cost, following the expected drop on electrochemical storage device prices, will enable the massive transition to e-mobility.
The target and the routes towards the introduction of e-mobility for onshore transportation in Crete are presented in Figure 20.
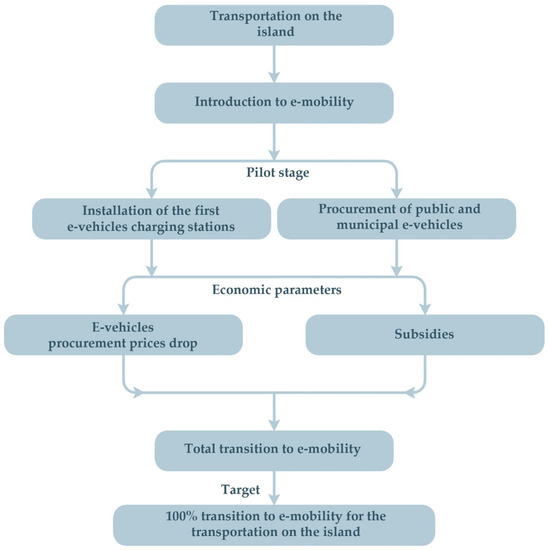
Figure 20.
Target and roadmap towards energy transition on onshore transportation.
3.2.5. Pillar 5: Electricity Production
Apart from CHP plants based on biomass and biomass waste, electricity can be produced in Crete by wind and photovoltaic parks. Crete, as well as the insular territory in Greece, are characterized by remarkably high wind blowing velocities and solar radiation potential. Plenty of sites can be found on the island with an average annual wind velocity above 8 m/s. In Figure 21, the annual average wind velocity is depicted in the wind potential map of Crete, developed by the Power Plant Synthesis Laboratory of the Hellenic Mediterranean University.
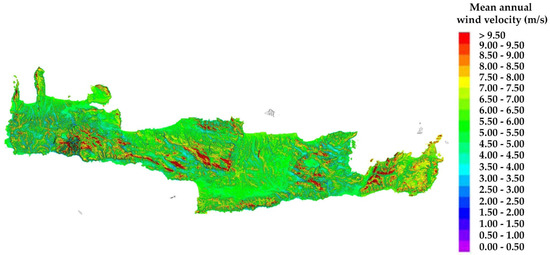
Figure 21.
Annual average wind velocity on Crete Island, Greece.
What is more interesting is that this annual average wind velocity is not configured by violent winds during winter and a long period of considerably reduced wind potential during summer, unlike what is noticed on the western coast of the European continent [16]. On the contrary, a high wind potential is available both during winter, obviously, and in the summer season, due to the so-called “meltemia”, the famous local winds blowing from the northwest during the daytime as a result of the hot air masses prevailing in Sahara in combination with the colder air streams above the Balkan Peninsula. This type of local wind is characterized by a constant blowing direction (northwest) mode with low turbulence and fluctuations, offering a quality energy source during the summer period, which in fact is the peak power demand season for Crete due to tourism. If one also accounts for the extraordinary availability of solar potential in Crete (annual global horizontal solar irradiation higher than 1900 kWh/m2—Figure 22 [100]), one can also conclude that Crete, and similarly the insular Greek territory, constitutes the richest RES geographical region on the world.
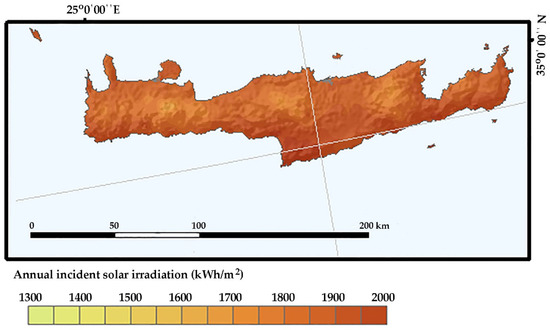
Figure 22.
Annual average of global horizontal solar irradiation fluctuation in Crete Island [100].
This abundant RES potential currently remains unexploited and, as justified in Section 2.3, it will still be inadequate to ensure a secure and stable power supply in the island, even after the interconnection of the island is achieved, due to its stochastic nature. If within the energy transition framework, a major target remains the substantial reduction in the use of fossil fuels, this can be only approached with the introduction of storage technologies such as electrical batteries and pumped-storage hydroelectric power plants. The latter approach would be helpful at least for as far as the hydrogen technologies remain not adequately mature in the future.
Electricity storage devices can be foreseen either via a decentralized approach, implemented in the frame of smart grid strategies which will be examined in the next section, or through large size centralized storage plants. For the scale of Crete and the available geomorphology, the optimum large scale storage technology, both from a technical and economic point of view, is Pumped Hydro Storage (PHS). PHS is the only technology which has a specific set-up cost as low as 30 EUR/kWh of storage capacity and which can provide an autonomous operation period for more than 10 days [44]. With the term “autonomy operation period” we refer to the time period for which the storage plant can fully undertake the power demand in an electrical system, starting at the fully charged level and without any intermediate charge during this period.
A comprehensive case study of a network of wind parks and PHS plants was implemented, aiming to prove the adequacy of these systems to fully undertake the electrical power demand in Crete. This case study was firstly presented in the 4th Hybrid Power Systems Workshop, held in Crete, on 18–19 May 2019, yet with different dimension, since that study did not take into consideration either the contribution of biomass wastes of Crete, or the electrical demand for e-mobility [101].
A network of 14 wind parks—PHS systems is presented (Figure 23), with each wind park operating, at a first approach, with a specific PHS plant, following a specific operation algorithm [101]. Once a first simulation of the annual operation of each wind park and PHS plant was accomplished, the annual electricity production surplus was calculated for each wind park separately, which could not be stored because the upper reservoir of the corresponding PHS plant was full. The main innovation of this study is that, at a second simulation step, this surplus was examined to see whether it could be stored in another PHS plant. All calculations were executed with algorithms and applications developed by the authors with either LabVIEW [101].
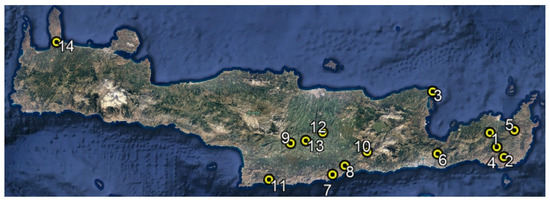
Figure 23.
Location of wind potential measurements sites on Crete.
The locations of the 14 wind parks installation sites and the corresponding annual average wind velocity are presented in Figure 23 and in Table 9, respectively. For all these sites, the annual wind potential certified measurements, according to ELOT EN ISO/IEC17025:2005 standard were captured during the last 15 years from the Power Plant Synthesis Laboratory, of the Department of Mechanical Engineering of Hellenic Mediterranean University in Crete, Greece.
Table 9.
Wind measurement sites and the annual average wind velocity.
In addition, and given the mountainous Cretan land terrain, it was not difficult to select the 14 sites with the most favorable land morphology for the installation of 14 PHS plants, as shown in Figure 24, while their main technical features are summarized in Table 10. Two of these sites (No 1: Anapodaris and No 11: Potamon) operate with potable water, while the rest 12, located next to the coastline, operate with seawater. As can be easily concluded from Figure 24, the 14 PHS plants are dispersed throughout the whole insular territory of the island, and have the ability to improve the topology of the electrical grid with the installation of guaranteed power production plants in strategically selected grid nodes.

Figure 24.
Location of the installation sites of the PHS plants on Crete.
Table 10.
Essential features of the selected sites for the installation of the PHS plants.
All the above sites were located in detail on digitized maps and the required volumetric calculations (e.g., for the reservoirs’ basins configuration, the excavation works etc.) were made based on computational tools. The total storage capacity was calculated at 26,327 MWh.
The new status regarding the electricity consumption in Crete was configured with the following data:
- A new annual power demand time series was developed for 2021 regarding the currently covered loads. The new annual electricity consumption was calculated at 3,216,704 MWh;
- The annual power demand time series for the electrical vehicles fleet charging was also introduced. The corresponding annual electricity consumption was calculated at 1,181,613 MWh (Section 3.2.4.).
The total annual power demand time series is given in Figure 25. The annual electricity consumption was 4,398,317 MWh. The annual peak demand was 891 MW and the daily average electricity consumption was calculated at 12,050 MWh. Given this daily average electricity consumption, the total storage capacity of the 14 hybrid power plants (26,327 MWh) implies an autonomy operation period of 2.2 days.
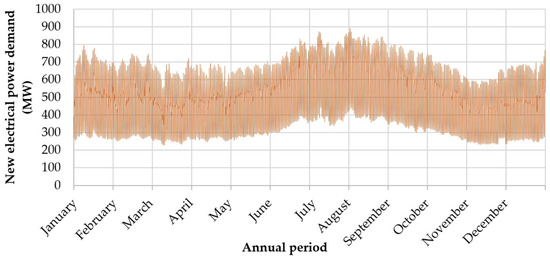
Figure 25.
New annual power demand time series in Crete.
Additionally, for the computational simulation of the annual operation of the 14 hybrid power plants, the following power production was also considered:
- The existing annual power production time series from the existing wind and photovoltaic parks in Crete were introduced. The corresponding annual electricity productions were calculated at 574,772 MWh for the wind parks and 123,431 MWh for the photovoltaic parks.
- The annual power production time series from the 12 newly introduced CHP plants. The corresponding annual production was calculated at 503,654 MWh.
The iterative execution of the computational simulation of the proposed operation algorithm [101] led to the optimum sizing of the 14 hybrid power plants presented in Table 11.
Table 11.
Essential features of the selected sites for the installation of the PHS plants.
The annual electricity production and storage from the 14 hybrid power plants are both presented in Table 12. It was clarified that the PHS plants’ efficiencies were calculated as the ratio of the produced electricity by the hydro turbines over the storage electricity from the pumps. The wind parks’ direct penetration refers to the electricity directly absorbed by the grid, namely, without being supplied to the pumps to be stored. The annual wind parks’ electricity production surplus corresponds to the electricity which could not be absorbed directly by the grid, due to the exceedance of the maximum permissible direct wind power penetration (set to 60% in this simulation) and concurrent the fully filled upper reservoirs of the PHS plants.
Table 12.
Annual electricity production and storage from the 14 wind parks—PHS plants.
Additionally, in Table 13, the annual electricity production from all the involved technologies is analyzed.
Table 13.
Annual electricity production analysis in Crete with the newly configured demand and production status.
As seen in Table 13, the annual electricity demand coverage from the RES plants is almost 89%. At the same time, the annual wind energy surplus is restricted at 7.6%, which occurred mainly during the winter period, due to the considerable power production from the CHP plants. This is also verified by the water stored volume fluctuation in two tanks (1 and 6) of the PHS plants, indicatively presented in Figure 26. As seen in this figure, both tanks are fully filled during the winter period, indicating a corresponding wind power surplus.
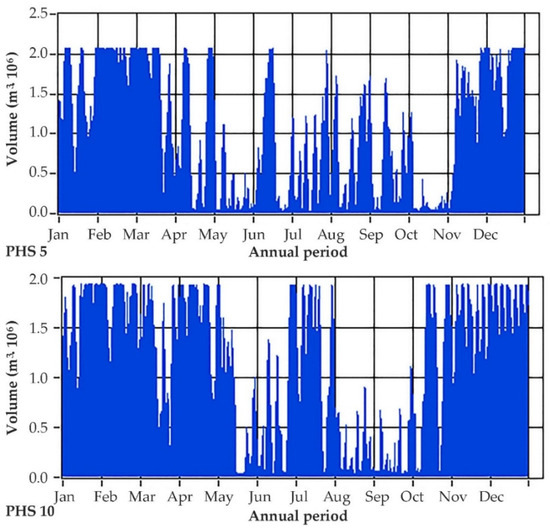
Figure 26.
Annual fluctuation in the water stored volume in the PHS systems’ 5 and 10 upper reservoirs.
In Figure 27, the annual power production synthesis is depicted, showing that the power production inadequacy from the proposed hybrid power plants is found exclusively during the summer period, when the CHP production is minimized and the power demand increases due to increasing tourist activities. A more detailed power production synthesis graph is presented in Figure 28, focused particularly on the first 10 days of March. In this figure the contribution of all involved generators is depicted more clearly. The decreasing production of the CHP plants, due to the corresponding decreasing heating load in Crete, is also clearly shown.
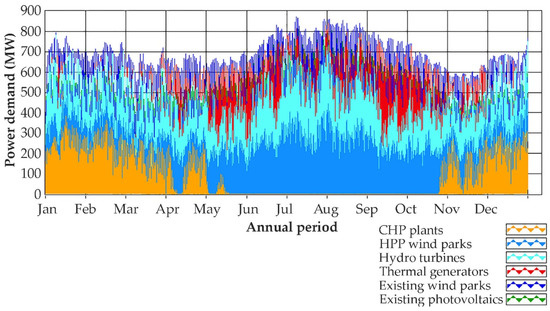
Figure 27.
Synthesis of the annual power production in Crete with all the investigated technologies.
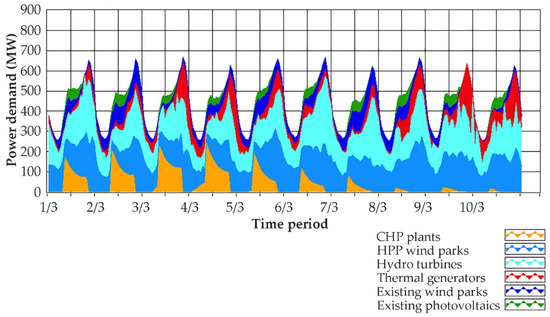
Figure 28.
Synthesis of the power production in Crete with all the investigated technologies from the 1st to the 10th of March.
Finally, the target and the routes towards the electricity production in Crete from renewables are presented in Figure 29.
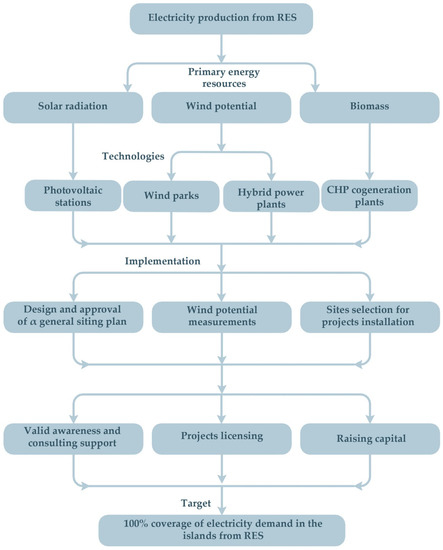
Figure 29.
Target and roadmap towards energy transition on electricity production from RES.
As seen in this figure, the crucial points towards the successful implementation of this pillar are:
- the exploitation of all the available RES potential in the island (wind, solar, biomass) with the involvement of the corresponding optimum technologies (wind and photovoltaic plants, hybrid power plants, CHP cogeneration plants);
- The design and the approval of a general siting plant, with the positive opinion of the local community, so as to avoid any potential negative reactions against the required projects in the future.
- The execution of certified wind potential measurements to enable the selection of the optimum sites for wind park installations.
- A valid awareness and a proper consultation are also important to maximize the produced electricity, to minimize the set-up and operation cost and to eliminate the potential impacts on the natural environmental and the human activities through the appropriate siting [9,10,11]. It has been shown that all the potential impacts of RES projects (visual impact, bird mortality, noise emissions, optical shading, etc.) can be minimized or even eliminated with the selection of a suitable installation site and the appropriate site of the projects;
- A flexible legislation framework can also facilitate and accelerate the licensing process, which often is the most time-consuming period during the development of RES projects;
- Finally, alternative funding mechanisms, such as crowd funding, can also play a crucial role for the effective development of the required projects, especially regarding the involvement of local energy communities or cooperatives in the overall process.
The target of course with this pillar is 100% electricity coverage from the involved RES technologies.
A fundamental economic evaluation of the proposed projects with a sensitivity analysis versus the produced electricity selling price was carried out and, the overall investment for these projects was estimated at EUR 2,890,600,000. Characteristic economic indices are presented in Table 14.
Table 14.
Economic indices of the overall wind parks—PHS plant investment versus the electricity selling price.
It is then clearly shown within this research study that with the proposed novel integrated energy producing projects:
- The electricity market price could be reduced at a quite satisfactory level, which is very difficult to be reach only with the electricity interconnection of the island;
- The energy supply safety is maximized and the dynamic security of the electrical grid is significantly strengthened.
3.2.6. Pillar 6: Smart Grids
The development of smart grids in Crete has great potential and feasibility, precisely due to the uniqueness of this Greek island based on its large size, the intensive land topography and the consequent variability of the existing economic activities (agriculture and animal breading, tourism, commerce). Its complex power system favors the applicability of a series of alternative smart grids operations and Demand Side Management (DSM) strategies. For example, load shifting from peak to low demand periods during the day can smooth the daily power demand profile, alleviating the necessity for a high installed power capacity. The direct load curtailment can have the same effect, applied from the operator to the final users, following relevant bilateral contracts.
Peak shaving can be also approached with decentralized storage, which can be achieved with the installation of decentralized storage technologies in all categories of final consumers (residents, industrial and commercial users, public and municipal buildings and facilities, agriculture and stock farming). Decentralized storage can be achieved with the exploitation of the currently rejected power from wind parks, which is expected to remain even with the interconnection of the insular grid due to the anticipated wind parks large scale installations. In 2019, the annual electricity production from the wind parks eventually rejected due to maximum penetration limitations was calculated at 52,558.32 MWh [50].
The overall concept is depicted in Figure 30. The excess electricity from the wind parks is absorbed by decentralized storage technologies which can be:
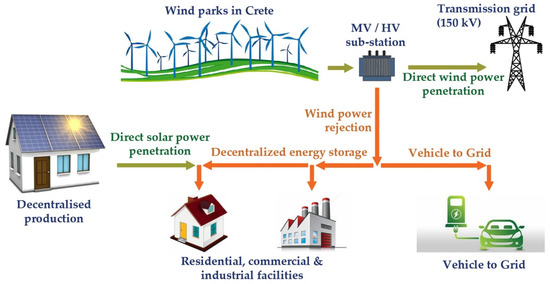
Figure 30.
Indicative layout of a first approach of a smart grid approach in Crete, Greece.
- electrochemical storage devices;
- electrical vehicles through the Vehicle-to-Grid process (V2G).
The initially rejected wind power is firstly stored, whenever it is rejected, in order to be injected back to the grid during peak demand periods. The prosumers will be reimbursed by the operator for the injection of the stored electricity in the grid at a price lower than the corresponding electricity production specific cost during peak demand periods. The prosumers, in turn, will reimburse the wind parks’ owners for absorbing their initially rejected power, yet at a price lower than the normal electricity market price from the wind parks and the price with which they are selling the stored electricity to the grid’s operator. In this way, a direct triple economic benefit is ensured for the wind parks’ owners, the prosumers and the grid’s operator.
Electricity storage can be also implemented by absorbing electricity from decentralized RES plants, such as photovoltaics, in order to be injected back in the grid at a different time period claiming a better pricing, as shown in Figure 30.
Smart grids will certainly integrate the energy transition by offering a range of services on increasing RES penetration, improving the grid’s dynamic security and stability, reducing electricity production and the procurement cost and handling, in this way, energy poverty and contributing to the economic feasibility of the overall energy transition. Smart grid development will doubtless be the furthest energy transition pillar, since significant progress steps are required to be achieved regarding the technological level of telecommunications and informatics, the network security and the legislation framework, which will enable the unhampered and secure execution of the management and the transactions over the liberalized electricity wholesale market. Apart from the required technological state of the art level, another critical parameter for the successful introduction of smart grids in Crete is certainly the training and the familiarization of the inhabitants with these emerging technologies and the offered opportunities. People should realize their new role as active prosumers instead of acting simply as passive consumers, which will be imposed by the new dynamic field of the liberalized electricity market.
Smart grids can be initially introduced as pilot projects in selected, focused groups of the inhabitants and, perhaps, with limited operations and strategies, such as the H2020 awarded project of TILOS [35]. A technical and economic feasibility study for a first smart grid implementation with the above essential operations is currently being undertaken within the framework of the NESOI H2020 program [102], following a relevant approved application of the Minoan Energy Community [103], the first energy community in Crete and the largest in insular Greece. The system is designed to involve at the first stage 2000 prosumers (consumers and producers) from the currently three (3) Municipalities members of the community, with the installation of a storage device with 10 kWh storage capacity and 10 kW charging-discharging capacity. Assuming a maximum discharge depth of 80%, this first smart grid in Crete will enable the absorption of 2000 × 8 kWh = 16 MWh of initially rejected wind energy on a daily basis; hence, 5840 MWh annually, which corresponds to 11% of the current annual electricity rejection from wind parks. This first pilot project is anticipated to be funded by relevant national or European funding calls. This grid can evolve versus time over the insular inhabitants, together with the attunement of the relevant legislation framework, introducing new operation facilities gradually. If, for example, the initial 2000 prosumers increase to 40,000, the annual electricity penetration from the wind parks through decentralized storage was calculated at 39,700 MWh, which will enable electricity production of 37,700 MWh, instead of thermal generators, accounting for a discharge efficiency of 98% for lithium ion batteries. This amount corresponds to 7.6% of the thermal generators’ annual production presented in Table 13 (493,786 MWh). With this contribution, the total RES share on the annual electricity production balance becomes 89.6%.
The development of smart grids in Crete will sensibly be the result of a long-term evolutionary process, which will be based on:
- The technological progress of the involved technologies;
- Raising awareness and the familiarization of the insular inhabitants;
- The funding of the required investments, at least at the first immature stages, from national and European calls;
- Finally, the drop of the procurement and investment cost of the required equipment and infrastructure, which will enable affordable access to these technologies for the whole population.
The roadmap and the target towards the introduction of smart grids in Crete are given graphically in Figure 31.
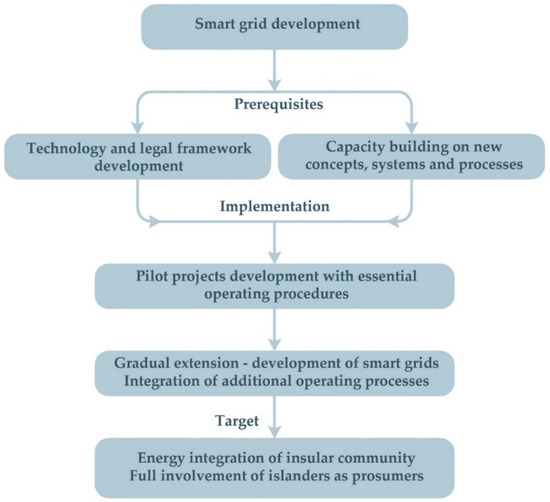
Figure 31.
Roadmap and target for the introduction of smart grid in Crete.
4. Social, Developmental and Economic Aspects
As analyzed in Section 3.2.1., the basis of energy transition, not only in Crete but in the whole of insular Greece, should be the appropriate and valid cultivation of local communities so they can obtain a clear picture of the necessity of energy transition and the anticipated benefits which can be claimed through their active involvement in this process. The latter can be essentially approached by the establishment of Energy Communities (ECs). So far in insular Greece there are only two energy cooperative schemes with the massive involvement of the citizens and the local municipalities in them: the Sifnos Energy Community (SEC) and the Minoan Energy Community (MEC) in Crete. SEC has more than 150 members, among which the Municipality of Sifnos is included as well. MEC has more than 400 members, the region of Crete and three municipalities so far. Sifnos, given the efforts of SEC, has been declared as one of the six pilot islands from the European Commission in the frame of the “Clean Energy for EU islands” initiative [104], while MEC has also a focused and at the same time integrated plan for energy transition in Crete, including the development of electricity production and storage projects, decentralized smart grid strategies, CHP plants, etc.
A solid upgrade of the European Union (EU) energy legislation aiming at achieving an internal energy market was introduced with the “Clean Energy for all Europeans Package” (CEP) consisting of eight legislative acts, the most relevant here being the recast Directive 2018/2001 (RED II), recast Directive 2019/944 (the Internal Electricity Market Directive, or IEMD) and recast Regulation 2019/943 (the Internal Electricity Market Regulation, or IEMR), which contain provisions that have established a supportive EU legal framework for community ownership. One of the main contributions of this package is the fact that it acknowledges the Citizen Energy Communities (CECs) and the Renewable Energy Communities (RECs) as separate market actors.
Under the regime of the RED II and the IEMD Directives, the member states ought to secure certain rights of ECs and establish enabling frameworks to ensure a level playing field and to promote their development. EU Member States must transpose RED II provisions into national legislation by 30 June 2021 and IEMD provisions by 31 December 2020 to ensure they are consistent with the new EU legislation.
In more detail, unjustified administrative and regulatory barriers should be removed, while also the energy communities should be subject to fair, proportionate and transparent procedures, including registration and licensing procedures (Article 22 (4) (a) and (d) of the RED II). Furthermore, member states should put tools in place to make sure that the ECs have access to finance and information (Article 22 (4) (g) of the RED II). In addition, according to article 16 (3) (a) of the IEMD, member states shall ensure that CECs are able to access all electricity markets in a non-discriminatory manner. Member states are also required to take the specificities of RECs into account when designing their renewable energy support schemes, in order to allow them to compete for support on an equal footing with other market participants (Article 22 (7) of the RED II). As a result, both directives recognize that the ECs are unique players in the energy market and that the Member States should identify concrete measures to make sure that they receive adequate support to be able to compete equally with the other market players without discrimination. Finally, it should be mentioned that in order to promote the production of renewable energy in islands, article 4 (7) of the RED II allows member states to adapt their support schemes for projects located in small islands, so as to “take into account the production costs associated with their specific conditions of isolation and external dependence”. As a result, it could be supported that RECs developed in Non-Interconnected Islands in the Aegean Sea could obtain special legislative treatment and support, so as to incentivize the exploitation of their renewable potential.
The transposition should be seen as an opportunity for member states to incorporate the new role of citizens and communities in their energy legislation and update their policy frameworks to support the empowerment of smaller and non-commercial market actors in the energy market.
The concept of the Energy Community was introduced in Greece with the Law 4513/2018, which was published on the 23 January 2018; thus, before the adoption of both the IEMD and the RED II. As a result, Greece became one of the first EU member states to have a comprehensive institutional framework for ECs. The concept of the Energy Community was introduced as a new type of civil cooperative of exclusive purpose, aiming to promote the “Social and Solidarity Economy” in the energy sector. Pursuant to the same law, the purpose of the EC is to enhance the innovation in the energy sector, tackle energy poverty and promote energy sustainability, production, storage, self-consumption, energy distribution and supply of energy, enhance energy self-sufficiency and security in island municipalities and improve energy efficiency in end use at the local and regional levels through the activity in the sectors of RES and CHP, the rational use of energy, energy efficiency, sustainable transport, demand and production management, distribution and energy supply. However, Greece still has to transpose the European provisions on ECs and introduce an enabling framework that will promote and facilitate their development.
Although the EU legislation places citizens at the heart of the energy transition and explicitly identifies the specific characteristics of ECs as well as their environmental, economic and social benefits, the ECs in Greece still face several problems that prevent their smooth development. To start with, costly and complicated administrative procedures for the development of community RES projects continue to be applied, despite the requirement of the directives for the introduction of simplified procedures. In addition, the legislative framework for ECs (this includes the legislation relevant to their establishment and the operation of an EC as a legal entity, but also the legislation that regulates the licensing procedures for the development of a RES project and so on) is complex and fragmented into many different laws and ministerial decisions, which intensifies the complexity of the process of developing RES projects by an EC and can be a disincentive for citizen participation in them.
In the same context, no tools have been made available to ECs to facilitate their access to finance and information as defined in Article 22 (4) (g) of the RED II. In more detail, ECs face difficulties in obtaining bank loans for their projects, as there is lack of understanding of the community energy movement. This misconception leads to lack of trust from the banks, which do not easily provide loans to finance community energy projects (REScoop.eu’s response to the consultation on the EEAG and GBER revision 12 https://www.rescoop.eu/news-and-events/news/rescoop-eus-response-to-the-consultation-on-the-eeag-and-gber-revision, accessed on 22 March 2021). The lack of financial support is particularly evident in the non-for-profit ECs and the ones active in virtual net metering schemes.
The gaps in the institutional framework, the bureaucracy, the lack of information of local communities and the lack of effective support and promotion of ECs in general has led to the following phenomenon in the Greek energy market: private investors who had the know-how and/or access to the required funds and hijacked the model of ECs to the detriment of genuine citizen initiatives by local communities. As a result, many of the ECs that have already been founded cover private investor initiatives. This does not mean that there are not any significant examples of authentic ECs in rural areas, as well as in urban and island areas. Unfortunately, though, they are the exception and not the rule.
As a response to this phenomenon, the Ministry of Energy decided to remove the existing incentives for all cases of ECs without exception. According to Article 160 of the Law 4759/2020, from the 1 January 2022, every EC will have to participate in competitive procedures together with private investors in order to ensure operational support for their RES projects. This development neither aligns with the spirit and provisions of the EU Directives and the principle of equality or with the provisions of the National Energy and Climate Plan, which includes specific references to the promotion and support of ECs (The National Energy and Climate Plan can be found here (in Greek): https://ypen.gov.gr/wp-content/uploads/2020/11/%CE%A6%CE%95%CE%9A-%CE%92-4893.2019.pdf accessed on 22 March 2021). In case the ECs will have to participate in auctions in order to develop a RES project, they will not be able to compete with larger market players and eventually there will be no incentive in Greece to develop an EC from 2022 onwards.
The problems that the ECs in Greece face under the current legislative regime reveal the need for key changes in the legislation. Therefore, the Greek institutional framework should be adapted to improve the integration of ECs into the energy market without discrimination, while contributing to the empowerment of citizens towards decarbonization in line with the CEP. After all, the citizens, who primarily finance the energy transition through their tariffs, their taxes and their savings should also be able to invest in the energy transition through ECs (REScoop.eu’s response to the consultation on the EEAG and GBER revision 25 https://www.rescoop.eu/news-and-events/news/rescoop-eus-response-to-the-consultation-on-the-eeag-and-gber-revision, accessed on 22 March 2021).
5. Conclusions
A recent tourist promotion spot used the phrase “Crete, a continent in an island” to highlight the variety of the ecosystems, the alteration of the landscape and, in general, the diversity by which Crete is characterized. This feature seems to have also emerged in this article by the wealth met regarding the available RES and the opportunities for energy transition in the island. It is shown that Crete has a surprising high wind, solar, biomass wastes and geothermal potential capable also of creating a surplus of energy to cover several times all the onshore energy needs on the island. Actually, only a low number of insular territories globally are in a position to fulfill and combine such high potential for all these types of RES.
So far, the available RES potential has been an object of a distorted approach adopted by big investors, characterized by large size projects submitted for licensing, following an incomplete and inadequate legislation framework and violating a series of restrictions with regard to environmental protection and cultural characteristic-related issues. Those attempts became the reason for serious negative reactions from the local community and the configuration of a strong opposed opinion against almost any type of RES project. Starting from this fact, a first critical pillar of energy transition is the adequate and valid capacity building of the local population, which should be organized by the central State authority, executed by public and commonly accepted academic institutes. The scope of this campaign should be the education and understanding of the local community on energy transition topics, focusing on the available tools for the alleviation of any potential negative impacts of RES projects to the society. Awareness of the local citizens on the anticipating positive impact and benefits, as well as the developmental opportunities which can be obtained through their active involvement in the RES energy transition process would be essential.
This capacity building campaign should be accompanied with the avoidance of implementation of licensing applications of large size projects, which, in total, have an aggregated nominal power higher than 5 GW in Crete. This avoidance will initially ensure the societal trust of the local community and will release spatial and energy space on the island for the implementation of new rationally and effectively designed energy transition projects in a sustainable way.
Having cultivated the ground of the local society to accept the main energy transition projects, a holistic approach of the implementation process of the energy transition in Crete should start with appropriately designed energy saving and the rational use of energy measures targeting all sectors of economy from primary to tertiary: from agriculture and stock farming to residential, commercial, industrial, public and municipal facilities to tourism and future expansion of e-services and mobility in the island. Previous studies have shown, for example, that energy saving percentages higher than 40% can be achieved in building stock and municipal and tourist facilities. This huge energy saving potential will relieve the currently ineffective energy resources consumption and, particularly regarding the electrical grid and will create the margin for the introduction of new electricity loads, such as e-mobility.
It was shown that biomass wastes constitute a sleeping waste-to-energy giant in the island, since it seems that it has not been realized that the locally generated and available biomass wastes for alternative energy use are capable to fully undertake the total indoor space heating demand in the island. The optimum approach for the exploitation of this extraordinary biomass waste–to-energy potential for the island is through decentralized Combined Heat and Power cogeneration plants, which can additionally cover 17.5% of the current electricity demand. The final heating production specific cost was estimated in the range of 0.08 EUR/kWh, yet with the biogas production cost not included. In combination with the already installed solar collectors’ plants, aiming at domestic and industrial hot water production and open loop geothermal systems especially for coastal settlements, the island’s heating and cooling demand can be fully covered through highly effective and economically feasible district systems. Towards the achievement of this target, the high set-up and operation cost of the biogas production facilities seems to be the main barrier.
Energy transition towards low carbon, sustainable solutions for onshore transportation can be mainly based on e-mobility, apart from the large size tracks and buses which can be well fueled with biodiesel. A daily charge profile for the e-vehicles fleet was adopted, based on previous research, and the corresponding annual electricity demand time series was constructed and introduced in the new, expected electricity demand in the island.
For the new annual electricity demand, 14 wind parks—pumped hydro storage (PHS) plants—were sited and dimensioned aiming for an annual penetration higher than 90%. It can be safely assumed that the remaining 10% will be covered both through the energy saving measures and the development of smart grids in the island. The electricity procurement price with the proposed wind-PHS systems can be as low as 0.12 EUR/kWh, ensuring high economic feasibility and secure RES penetration.
Lastly it should be pointed out that perhaps the most important issue of energy transition is that it should be implemented with the active involvement of local citizens through energy communities or cooperatives. In that way social acceptance, one of the main pillars of sustainability and the most difficult to achieve, can be well fulfilled. It should be realized by States that the energy transition approach through the active involvement of local citizens is the only way towards a rational, unobscured and effective energy transition, which will maximize the social and economic benefits for the local communities leading to their sustainable development. Particularly for the European Union (EU), the necessity to strengthen and support energy communities is highlighted in relevant directives and memorandums and the member states should harmonize their national legislations on the basis of the EU lines. The implementation of energy transition from local energy communities is a highly promising route for a sustainable society moving towards environmental protection and an economically feasible energy future for all, leading to the elimination of energy poverty and the creation of equal opportunities for a fairer, low carbon future.
Author Contributions
Conceptualization, D.A.K.; methodology, D.A.K., A.M. (Apostolos Michopoulos), V.S., A.M. (Aggeliki Maragkaki) and S.P.; software, D.A.K.; validation, A.M. (Apostolos Michopoulos), V.S. and A.M. (Aggeliki Maragkaki); formal analysis, D.A.K.; investigation, D.A.K., A.M. (Apostolos Michopoulos), V.S., E.D., A.M. (Aggeliki Maragkaki) and S.P.; resources, E.D., I.A., D.C. and C.C.; data curation, E.D. and I.A.; writing—review and editing, D.A.K., A.M. (Apostolos Michopoulos), V.S. and S.P.; visualization, D.A.K.; supervision, D.A.K.; project administration, D.A.K.; funding acquisition, D.A.K. All authors have read and agreed to the published version of the manuscript.
Funding
This research received no external funding.
Institutional Review Board Statement
Not applicable.
Informed Consent Statement
Not applicable.
Data Availability Statement
Not applicable.
Acknowledgments
For the implementation of this work we are grateful to the following contributors: the Hellenic Electricity Distribution Network Operator S.A. for the supplied data and information on the existing electricity consumption and electrical grid infrastructure in Crete. The Minoan Lines and ANEK Lines, for the submission of data relevant to the fuel consumption in maritime transportation. The PetroGas Energy for the data supplied on the LPG consumption in Crete. Peter Breahaus, Chief Scientist in NORCE Norwegian Research Centre AS for his contribution on the dimensioning and the set-up cost estimation of the CHP plants.
Conflicts of Interest
The authors declare no conflict of interest.
Abbreviations
| CETA: | Clean Energy Transition Agenda |
| CHP: | Combined Heat and Power |
| COP: | Coefficient of Performance |
| DSM: | Demand Side Management |
| EER: | Energy Efficiency Ratio |
| EPC: | Energy Performance Certification |
| EU: | European Union |
| EVs: | Electrical Vehicles |
| GDBEP: | Greek Directive on Buildings Energy Performance |
| HEDNO: | Hellenic Electricity Distribution Network Operator SA |
| HPP: | Hybrid Power Plant |
| IPTO: | Independent Power Transmission Operator |
| LPG: | Liquid Petroleum Gas |
| PHS: | Pumped Hydro Storage |
| RES: | Renewable Energy Sources |
| RUE: | Rational Use of Energy |
References
- Directive (EU) 2018/2001 of the European Parliament and of the Council of 11 December 2018 on the Promotion of the Use of Energy from Renewable Sources. Available online: https://eur-lex.europa.eu/legal-content/EN/TXT/?uri=CELEX%3A32018L2001 (accessed on 10 March 2022).
- Directive (EU) 2018/844 of the European Parliament and of the Council of 30 May 2018 Amending Directive 2010/31/EU on the Energy Performance of Buildings and DIRECTIVE 2012/27/EU on Energy Efficiency. Available online: https://eur-lex.europa.eu/legal-content/EN/TXT/?uri=uriserv%3AOJ.L_.2018.156.01.0075.01.ENG (accessed on 10 March 2022).
- Thejournal.ie: ESB Restores Power to the Aran Islands. Available online: https://www.thejournal.ie/aran-islands-power-2915463-Aug2016/ (accessed on 10 March 2022).
- NewEurope: Power Outage Plunges Entire Spanish Island of Menorca in Mediterranean into Darkness. Available online: https://www.neweurope.eu/wires/power-outage-plunges-entire-spanish-island-of-menorca-in-mediterranean-into-darkness/ (accessed on 10 March 2022).
- Parol, M.; Piotrowski, P.; Kapler, P.; Piotrowski, M. Forecasting of 10-Second Power Demand of Highly Variable Loads for Microgrid Operation Control. Energies 2021, 14, 1290. [Google Scholar] [CrossRef]
- Greek Official Governmental Gazette 1873B/10-7-2014. Available online: http://www.rae.gr/site/file/categories_new/about_rae/actions/decision/2014/2014_A0356?p=files&i=0 (accessed on 10 March 2022).
- Dialynas, E.N.; Hatziargyriou, N.D.; Koskolos, N.; Karapidakis, E. Effect of high wind power penetration on the reliability and security of isolated power systems. In Proceedings of the 37th Session, CIGRÉ, Paris, France, 30 August–5 September 1998; pp. 38–302. [Google Scholar]
- Hatziargyriou, N.; Papadopoulos, M. Consequences of high wind power penetration in large autonomous power systems. In Proceedings of the CIGRÉ Symposium, Neptum, Romania, 18–19 September 1998. [Google Scholar]
- Sokka, L.; Sinkko, T.; Holma, A.; Manninen, K.; Pasanen, K.; Rantala, M. Leskinen. Environmental impacts of the national renewable energy targets—A case study from Finland. Renew. Sustain. Energy Rev. 2016, 59, 1599–1610. [Google Scholar] [CrossRef]
- Tolli, M.; Recanatesi, F.; Piccinno, M.; Leone, A. The assessment of aesthetic and perceptual aspects within environmental impact assessment of renewable energy projects in Italy. Environ. Impact Assess. Rev. 2016, 57, 10–17. [Google Scholar] [CrossRef]
- Kaldellis, J.K.; Boulogiorgou, D. 2.19: Social Acceptability of Wind Power Projects. Compr. Renew. Energy 2022, 2, 628–643. [Google Scholar]
- Clean Energy for E.U. Islands Secretariat. Available online: https://euislands.eu/ (accessed on 10 March 2022).
- Clean Energy for E.U. Islands Secretariat: Community. Available online: https://clean-energy-islands.ec.europa.eu/islands (accessed on 10 March 2022).
- Ackermann, S.; Szabo, A.; Bamberger, J.; Steinke, F. Design and optimization of performance guarantees for hybrid power plants. Energy 2021, 239, 121742. [Google Scholar] [CrossRef]
- Katsaprakakis, D.A.; Christakis, D.G. A wind parks, pumped storage and diesel engines power system for the electric power production in Astypalaia. In Proceedings of the European Wind Energy Conference and Exhibition, Athens, Greece, 27 February–2 March 2006; Volume 1, pp. 621–636. [Google Scholar]
- Torres-Herrera, H.J.; Lozano-Medina, A. Methodological Proposal for the Assessment Potential of Pumped Hydropower Energy Storage: Case of Gran Canaria Island. Energies 2021, 14, 3553. [Google Scholar] [CrossRef]
- Katsaprakakis, D.A.; Christakis, D.G. Maximisation of RES penetration in Greek insular isolated power systems with the introduction of pumped storage systems. In Proceedings of the European Wind Energy Conference and Exhibition, Marseille, France, 16–19 March 2009; Volume 7, pp. 4918–4930. [Google Scholar]
- Kapsali, M.; Anagnostopoulos, J.S.; Kaldellis, J.K. Wind powered pumped-hydro storage systems for remote islands: A complete sensitivity analysis based on economic perspectives. Appl. Energy 2012, 99, 430–444. [Google Scholar] [CrossRef]
- Bueno, C.; Carta, J.A. Wind powered pumped hydro storage systems, a means of increasing the penetration of renewable energy in the Canary Islands. Renew. Sustain. Energy Rev. 2006, 10, 312–340. [Google Scholar] [CrossRef]
- Frydrychowicz-Jastrzębska, G. El Hierro Renewable Energy Hybrid System: A Tough Compromise. Energies 2018, 11, 2812. [Google Scholar] [CrossRef]
- Meschede, H.; Child, M.; Breyer, C. Assessment of sustainable energy system configuration for a small Canary island in 2030. Energy Convers. Manag. 2018, 165, 363–372. [Google Scholar] [CrossRef]
- Ma, T.; Javed, M.S. Integrated sizing of hybrid PV-wind-battery system for remote island considering the saturation of each renewable energy resource. Energy Convers. Manag. 2019, 182, 178–190. [Google Scholar] [CrossRef]
- Ma, T.; Yang, H.; Lu, L. A feasibility study of a stand-alone hybrid solar–wind–battery system for a remote island. Appl. Energy 2014, 121, 149–158. [Google Scholar] [CrossRef]
- Katsaprakakis, D.A.; Dakanali, I.; Condaxakis, C.; Christakis, D.G. Comparing electricity storage technologies for small insular grids. Appl. Energy 2019, 251, 113332. [Google Scholar] [CrossRef]
- Zhang, Y.; Wei, W. Model construction and energy management system of lithium battery, PV generator, hydrogen production unit and fuel cell in islanded AC microgrid. Int. J. Hydrog. Energy 2020, 45, 16381–16397. [Google Scholar] [CrossRef]
- Groppi, D.; Astiaso Garcia, D.; Lo Basso, G.; De Santoli, L. Synergy between smart energy systems simulation tools for greening small Mediterranean islands. Renew. Energy 2019, 135, 515–524. [Google Scholar] [CrossRef]
- Groppi, D.; Astiaso Garcia, D.; Lo Basso, G.; Cumo, F.; De Santoli, L. Analysing economic and environmental sustainability related to the use of battery and hydrogen energy storages for increasing the energy independence of small islands. Energy Convers. Manag. 2018, 177, 64–76. [Google Scholar] [CrossRef]
- Wang, Y.; Lou, S.; Wu, Y.; Miao, M.; Wang, S. Operation strategy of a hybrid solar and biomass power plant in the electricity markets. Electr. Power Syst. Res. 2019, 167, 183–191. [Google Scholar] [CrossRef]
- Selosse, S.; Garabedian, S.; Ricci, O.; Maïzi, N. The renewable energy revolution of Reunion Island. Renew. Sustain. Energy Rev. 2018, 89, 99–105. [Google Scholar] [CrossRef]
- Selosse, S.; Ricci, O.; Garabedian, S.; Maïzi, N. Exploring sustainable energy future in Reunion Island. Util. Policy 2018, 55, 158–166. [Google Scholar] [CrossRef]
- Alves, M.; Segurado, R.; Costa, M. On the road to 100% renewable energy systems in isolated islands. Energy 2020, 198, 117321. [Google Scholar] [CrossRef]
- Morales, D.X.; Besanger, Y.; Sami, S.; Alvarez Bel, C. Assessment of the impact of intelligent DSM methods in the Galapagos Islands toward a Smart Grid. Electr. Power Syst. Res. 2017, 146, 308–320. [Google Scholar] [CrossRef]
- Sigrist, L.; Lobato, E.; Rouco, L.; Gazzino, M.; Cantu, M. Economic assessment of smart grid initiatives for island power systems. Appl. Energy 2017, 189, 403–415. [Google Scholar] [CrossRef]
- Grobovoy, A.; Arestova, A.; Khmelik, M.; Shipilov, V.; Nikitin, Y. Smart Grid Technologies Simulation Experience at Russky Island. IFAC Proc. Vol. 2014, 47, 25–30. [Google Scholar] [CrossRef]
- Technology Innovation for the Local Scale Optimum Integration of Battery Energy Storage. Available online: https://www.tiloshorizon.eu/ (accessed on 10 March 2022).
- Kaldellis, J.K.; Zafirakis, D. Prospects and challenges for clean energy in European Islands. The TILOS paradigm. Renew. Energy 2020, 145, 2489–2502. [Google Scholar] [CrossRef]
- Boulogiorgou, D.; Ktenidis, P. TILOS local scale Technology Innovation enabling low carbon energy transition. Renew. Energy 2020, 146, 397–403. [Google Scholar] [CrossRef]
- Skjølsvold, T.M.; Ryghaug, M.; Throndsen, W. European island imaginaries: Examining the actors, innovations, and renewable energy transitions of 8 islands. Energy Res. Soc. Sci. 2020, 65, 101491. [Google Scholar] [CrossRef]
- Michalena, E.; Angeon, V. Local challenges in the promotion of renewable energy sources: The case of Crete. Energy Policy 2009, 37, 2018–2026. [Google Scholar] [CrossRef]
- Stephanides, P.; Chalvatzis, K.J.; Li, X.; Lettice, F.; Guan, D.; Ioannidis, A.; Zafirakis, D.; Papapostolou, C. The social perspective on island energy transitions: Evidence from the Aegean archipelago. Appl. Energy 2019, 255, 113725. [Google Scholar] [CrossRef]
- Lee, T.; Glick, M.B.; Lee, J.H. Island energy transition: Assessing Hawaii’s multi-level, policy-driven approach. Renew. Sustain. Energy Rev. 2020, 118, 109500. [Google Scholar] [CrossRef]
- Harrison, C.; Popke, J. Geographies of renewable energy transition in the Caribbean: Reshaping the island energy metabolism. Energy Res. Soc. Sci. 2018, 36, 165–174. [Google Scholar] [CrossRef]
- Kotzebue, J.R.; Weissenbacher, M. The EU’s Clean Energy strategy for islands: A policy perspective on Malta’s spatial governance in energy transition. Energy Policy 2020, 139, 111361. [Google Scholar] [CrossRef]
- Katsaprakakis, D.A.; Dakanali, E.; Dimopoulos, A.; Gyllis, Y. Energy Transition on Sifnos: An Approach to Economic and Social Transition and Development. Appl. Sci. 2022, 12, 2680. [Google Scholar] [CrossRef]
- Osti, G. The uncertain games of energy transition in the island of Sardinia (Italy). J. Clean. Prod. 2018, 205, 681–689. [Google Scholar] [CrossRef]
- Wikipedia: Crete. Available online: https://en.wikipedia.org/wiki/Crete (accessed on 10 March 2022).
- Hellenic Statistical Authority: Demographic Characteristics 2011. Available online: https://www.statistics.gr/en/statistics/-/publication/SAM03/- (accessed on 10 March 2022).
- Hellenic Statistical Authority: Gross Domestic Product Per Capita (NUTS I and NUTS II). 2017. Available online: https://www.statistics.gr/en/statistics/-/publication/SEL57/- (accessed on 10 March 2022).
- Hellenic Statistical Authority: Greece in Figures. Available online: https://www.statistics.gr/el/greece-in-figures (accessed on 10 March 2022).
- Gigantidou, A. Annual Technical Bulletin for the Exploitation of the Electrical System of Crete in 2019; Technical private report; Hellenic Electricity Distribution Network Operator S.A.: Heraklion, Greece, 2019; Not available online. [Google Scholar]
- Hellenic Statistical Authority: Electrical Power Consumption 2012. Available online: https://www.statistics.gr/el/statistics/-/publication/SIN03/2012 (accessed on 10 March 2022).
- Hellenic Statistical Authority: Consumption of Petroleum Products. 2017. Available online: https://www.statistics.gr/el/statistics/-/publication/SDE15/2017 (accessed on 10 March 2022).
- Wikipedia: Fuel Economy in Aircraft. Available online: https://en.wikipedia.org/wiki/Fuel_economy_in_aircraft (accessed on 10 March 2022).
- Civil Aviation Authority. Annual Air Traffic Statistics 2018. Available online: http://www.ypa.gr/userfiles/4659ed30-b59b-4111-9747-a3550129731a/%ce%a3%ce%a4%ce%91%ce%a4%ce%99%ce%a3%ce%a4%ce%99%ce%9a%ce%97%20%ce%91%ce%95%ce%a1%ce%9f%ce%a0%ce%9f%ce%a1%ce%99%ce%9a%ce%97%ce%a3%20%ce%9a%ce%99%ce%9d%ce%97%ce%a3%ce%97%ce%a3%202018_1.pdf (accessed on 10 March 2022).
- Directive on Buildings Energy Performance, Ministerial Decision178581. Official Governmental Gazette 2367Β/12-7-2017. Available online: https://ypen.gov.gr/wp-content/uploads/2020/11/KENAK_FEK_B2367_2017.pdf (accessed on 6 March 2022).
- Hazami, M.; Kooli, S.; Lazaar, M.; Farhat, A.; Belghith, A. Performance of a solar storage collector. In Proceedings of the Desalination and the Environment, European Desalination Society, Santa Margherita, Italy, 22–26 May 2005. [Google Scholar]
- Giamalaki, M.; Kolokotsa, D. Understanding the thermal experience of elderly people in their residences: Study on thermal comfort and adaptive behaviors of senior citizens in Crete, Greece. Energy Build. 2019, 185, 76–87. [Google Scholar] [CrossRef]
- Eurostat, Statistics Explained: Energy Consumption in Households. Available online: https://ec.europa.eu/eurostat/statistics-explained/index.php/Energy_consumption_in_households (accessed on 6 March 2022).
- Tsioliaridou, E.; Bakos, G.C. A new methodology for renewable and rational use of energy policy in building sector: Case study for the island of Crete. Energy Build. 2006, 38, 196–206. [Google Scholar] [CrossRef]
- Katsaprakakis, D.A.; Zidianakis, G. Upgrading Energy Efficiency For School Buildings In Greece. Procedia Environ. Sci. 2017, 38, 248–255. [Google Scholar] [CrossRef]
- Katsaprakakis, D.A.; Georgila, K.; Zidianakis, G.; Michopoulos, A.; Psarras, N.; Christakis, D.G.; Condaxakis, C.; Kanouras, S. Energy upgrading of buildings. A holistic approach for the Natural History Museum of Crete, Greece. Renew. Energy 2017, 114, 1306–1332. [Google Scholar] [CrossRef]
- Katsaprakakis, D.A.; Dakanali, I.; Zidianakis, G.; Yiannakoudakis, Y.; Psarras, N.; Kanouras, S. Potential on Energy Performance Upgrade of National Stadiums: A Case Study for the Pancretan Stadium, Crete, Greece. Appl. Sci. 2019, 9, 1544. [Google Scholar] [CrossRef]
- Katsaprakakis, D.A.; Zidianakis, G.; Yiannakoudakis, Y.; Manioudakis, E.; Dakanali, I.; Kanouras, S. Working on Buildings’ Energy Performance Upgrade in Mediterranean Climate. Energies 2020, 13, 2159. [Google Scholar] [CrossRef]
- Droutsa, K.G.; Kontoyiannidis, S.; Dascalaki, E.G.; Balaras, C.A. Benchmarking Energy Use of Existing Hellenic Non-residential Buildings. Procedia Environ. Sci. 2017, 38, 713–720. [Google Scholar] [CrossRef]
- Droutsa, K.G.; Kontoyiannidis, S.; Dascalaki, E.G.; Balaras, C.A. Mapping the energy performance of hellenic residential buildings from EPC (energy performance certificate) data. Energy 2016, 98, 284–295. [Google Scholar] [CrossRef]
- Balaras, C.A.; Dascalaki, E.G.; Droutsa, K.G.; Kontoyiannidis, S. Empirical assessment of calculated and actual heating energy use in Hellenic residential buildings. Appl. Energy 2016, 164, 115–132. [Google Scholar] [CrossRef]
- Independent Power Transmission Operator. Ten-Year Network Development Plan. Available online: https://www.admie.gr/en/grid/development/ten-year-development-plan (accessed on 6 March 2022).
- Euroasia Interconnector. Available online: https://euroasia-interconnector.com/ (accessed on 6 March 2022).
- Independent Power Transmission Operator. Weighted Average Market Price. Available online: https://www.admie.gr/en/market/reports/weighted-average-market-price (accessed on 6 March 2022).
- Papakonstantinou, A.; Psarros, G.N.; Papathanassiou, S.; Anagnostopoulos, J.; Boulaxis, N.G. Power adequacy solutions for Crete following its interconnection with the continental grid. In Proceedings of the 30th CIGRE Greece National Conference “e-Session 2020”, Athens, Greece, 26 November 2020. [Google Scholar]
- Kaldellis, J.K.; Kapsali, M.; Katsanou, E. Comparing recent views of public attitude on wind energy, photovoltaic and small hydro applications. Renew. Energy 2013, 52, 197–208. [Google Scholar] [CrossRef]
- Kaldellis, J.K.; Kapsali, M.; Katsanou, E. Renewable energy applications in Greece—What is the public attitude? Energy Policy 2012, 42, 37–48. [Google Scholar] [CrossRef]
- Vuichard, P.; Broughel, A.; Wüstenhagen, R.; Tabi, A.; Knauf, J. Keep it local and bird-friendly: Exploring the social acceptance of wind energy in Switzerland, Estonia, and Ukraine. Energy Res. Soc. Sci. 2022, 88, 102508. [Google Scholar] [CrossRef]
- European Federation of Citizen Energy Cooperatives. Available online: https://www.rescoop.eu/ (accessed on 2 April 2022).
- Calise, F.; Figaj, R.D.; Vanoli, L. Energy and Economic Analysis of Energy Savings Measures in a Swimming Pool Centre by Means of Dynamic Simulations. Energies 2018, 11, 2182. [Google Scholar] [CrossRef]
- Hellenic Statistical Authority. Crops Surveys. 2017. Available online: https://www.statistics.gr/en/statistics/-/publication/SPG63/- (accessed on 6 March 2022).
- Maragkaki, A.; Galliou, F.; Markakis, N.; Sabathianakis, G.; Tsompanidis, C.; Lolos, G.; Mavrogiannis, G.; Koukakis, G.; Lasaridi, K.; Manios, T. Initial Investigation of the Solar Drying Method for the Drying of Olive Oil By-Products. Waste Biomass Valorization 2015, 7, 819–830. [Google Scholar] [CrossRef]
- Acampora, A.; Civitarese, V.; Sperandio, G.; Rezaei, N. Qualitative Characterization of the Pellet Obtained from Hazelnut and Olive Tree Pruning. Energies 2021, 14, 4083. [Google Scholar] [CrossRef]
- EN 14961-1:2010; Solid Biofuels—Fuel Specifications and Classes—Part 1: General Requirements. iTeh Standards: Toronto, ON, Canada, 2010.
- Hellenic Statistical Authority: Annual Agricultural Statistical Survey. Available online: https://www.statistics.gr/en/statistics/-/publication/SPG06/- (accessed on 6 March 2022).
- Maragkaki, A.E.; Kotrotsios, T.; Samaras, P.; Manou, A.; Lasaridi, K.; Manios, T. Quantitative and Qualitative Analysis of Biomass from Agroindustrial Processes in the Central Macedonia Region, Greece. Waste Biomass Valorization 2015, 7, 385–395. [Google Scholar]
- Miranda, T.; Arranz, J.I.; Montero, I.; Román, S.; Rojas, C.V.; Nogales, S. Characterization and combustion of olive pomace and forest residue pellets. Fuel Processing Technol. 2012, 103, 91–96. [Google Scholar] [CrossRef]
- Hellenic Statistical Authority. Holdings and Number of Animals. 2016. Available online: https://www.statistics.gr/en/statistics/-/publication/SPK12/- (accessed on 6 March 2022).
- Melikoglu, M.; Menekse, Z.K. Forecasting Turkey’s cattle and sheep manure based biomethane potentials till 2026. Biomass Bioenergy 2020, 132, 105440. [Google Scholar] [CrossRef]
- Cestonaro, T.; Costa, M.S.; Costa, L.A.; Rozatti, M.A.; Pereira, D.C.; Lorin, H.E.; Carneiro, L.J. The anaerobic co-digestion of sheep bedding and ≥50% cattle manure increases biogas production and improves biofertilizer quality. Waste Manag. 2015, 46, 612–618. [Google Scholar] [CrossRef] [PubMed]
- Perez-Sanza, F.J.; Sargea, S.M.; Van der Veenb, A.; Culletonc, L.; Beaumontd, O.; Haloua, F. First experimental comparison of calorific value measurements of real biogas with reference and field calorimeters subjected to different standard methods. Int. J. Therm. Sci. 2019, 135, 72–82. [Google Scholar] [CrossRef]
- Eurostat. Statistics Explained. Municipal Waste Statistics. Available online: https://ec.europa.eu/eurostat/statistics-explained/index.php?title=Municipal_waste_statistics (accessed on 6 March 2022).
- Dasgupta, A.; Chandel, M.K. Enhancement of biogas production from organic fraction of municipal solid waste using hydrothermal pretreatment. Bioresour. Technol. Rep. 2019, 7, 100281. [Google Scholar] [CrossRef]
- Katsaprakakis, D.A. Power Plant Synthesis, 1st ed.; CRC Press: Boca Raton, FL, USA, 2020. [Google Scholar]
- Ricci, M.; Sdringola, P.; Tamburrino, S.; Puglisi, G.; Di Donato, E.; Ancona, M.A.; Melino, F. Efficient District Heating in a Decarbonisation Perspective: A Case Study in Italy. Energies 2022, 15, 948. [Google Scholar] [CrossRef]
- Brange, L.; Lauenburg, P.; Sernhed, K.; Thern, M. Bottlenecks in district heating networks and how to eliminate them—A simulation and cost study. Energy 2017, 137, 607–616. [Google Scholar] [CrossRef]
- Kampman, B.; Leguijt, C.; Scholten, T.; Tallat-Kelpsaite, J.; Brückmann, R.; Maroulis, G.; Lesschen, J.P.; Meesters, K.; Sikirica, N.; Elbersen, B. Optimal Use of Biogas from Waste Streams. An Assessment of the Potential of Biogas from Digestion in the EU Beyond 2020. European Commission. December 2016. Available online: https://ec.europa.eu/energy/sites/ener/files/documents/ce_delft_3g84_biogas_beyond_2020_final_report.pdf (accessed on 6 March 2022).
- Poseidon System. Monitoring, Forecasting and Information System for the Greek Seas. Available online: https://poseidon.hcmr.gr/ (accessed on 6 March 2022).
- Pinto, A.; Rodrigues, F.; Mota, A. Geothermal contribution on southern Europe climate for energy efficiency of university buildings. Winter season. Energy Procedia 2017, 134, 181–191. [Google Scholar] [CrossRef]
- Barbato, M.; Cirillo, L.; Menditto, L.; Moretti, R.; Nardini, S. Feasibility study of a geothermal energy system for indoor swimming pool in Campi Flegrei area. Therm. Sci. Eng. Prog. 2018, 6, 421–425. [Google Scholar] [CrossRef]
- International Energy Agency. Fuel Consumption of Cars and Vans. Available online: https://www.iea.org/reports/fuel-consumption-of-cars-and-vans (accessed on 6 March 2022).
- European Association Battery Electric Vehicles. Energy Consumption, CO2 Emissions and Other Considerations Related to Battery Electric Vehicles. Available online: https://ec.europa.eu/transport/sites/transport/files/themes/strategies/consultations/doc/2009_03_27_future_of_transport/20090408_eabev_%28scientific_study%29.pdf (accessed on 6 March 2022).
- The Engineering Toolbox. Fuels Higher and Lower Calorific Values. Available online: https://www.engineeringtoolbox.com/fuels-higher-calorific-values-d_169.html (accessed on 6 March 2022).
- Chen, T.H.; Liao, R. Analysis of Charging Demand of Electric Vehicles in Residential Area. In Proceedings of the International Conference on Remote Sensing, Environment and Transportation Engineering (RSETE 2013), Nanjing, China, 26–28 July 2013. [Google Scholar] [CrossRef]
- European Commission. Photovoltaic Geographical Information System. Country and Regional Maps. Available online: https://re.jrc.ec.europa.eu/pvg_download/map_index.html (accessed on 6 March 2022).
- Katsaprakakis, D.; Antonakakis, I.; Dakanali, I.; Christakis, D. Turning Crete into an energy independent island. In Proceedings of the 4th International Hybrid Power Systems Workshop, Agia Pelagia, Crete, Greece, 18–19 May 2019; Available online: https://hybridpowersystems.org/crete2019/downloads/ (accessed on 6 March 2022).
- NESOI|New Energy Solutions Optimized for Islands. Available online: www.nesoi.eu (accessed on 6 March 2022).
- Minoan Energy Community. Available online: https://minoanenergy.com/en/ (accessed on 6 March 2022).
- Clean Energy for E.U. Islands Secretariat. The Islands: Sifnos (Greece). Available online: https://clean-energy-islands.ec.europa.eu/countries/greece/sifnos (accessed on 6 March 2022).


Publisher’s Note: MDPI stays neutral with regard to jurisdictional claims in published maps and institutional affiliations. |
© 2022 by the authors. Licensee MDPI, Basel, Switzerland. This article is an open access article distributed under the terms and conditions of the Creative Commons Attribution (CC BY) license (https://creativecommons.org/licenses/by/4.0/).