Article

Mesoscale/Microscale and CFD Modeling for Wind Resource Assessment: Application to the Andaman Coast of Southern Thailand

by
Lattawan Niyomtham
1,
Charoenporn Lertsathittanakorn
2,
Jompob Waewsak
3,* and
Yves Gagnon
4
1
Sustainable Development Program, International College, Thaksin University, Songkhla 90110, Thailand
2
School of Energy, Environment and Materials, King Mongkut’s University of Technology Thonburi, Bangkok 10140, Thailand
3
Research Center in Energy and Environment, Thaksin University (Phatthalung Campus), Phatthalung 93110, Thailand
4
Department of Sciences, Université de Moncton, Edmundston Campus, Edmundston, NB E3V 2S8, Canada
*
Author to whom correspondence should be addressed.
Energies 2022, 15(9), 3025; https://doi.org/10.3390/en15093025
Submission received: 25 February 2022 / Revised: 30 March 2022 / Accepted: 7 April 2022 / Published: 21 April 2022

Abstract

:
Situated in the southern part and on the western coast of Thailand, the Andaman Coast covers the provinces of Ranong, Phangnga, Phuket, Krabi, Trang and Satun. Using a coupled mesoscale atmospheric model and a microscale wind flow model, along with computational fluid dynamics (CFD) modeling, this paper presents a detailed assessment of the wind energy potential for power generation along the Andaman Coast of Thailand. The climatic data are obtained from the Modern Era Retrospective analysis for Research and Applications (MERRA), along with a high-resolution topography database and Land Use Land Cover digital data. The results are compared to the equivalent wind speeds obtained with the Weather Research and Forecasting (WRF) atmospheric model. The results showed that, at 120 m above ground level (agl), the predicted wind speeds from the models proposed were 20% lower for the mesoscale model and 10% lower for the microscale model when compared to the equivalent wind speeds obtained from the WRF model. A CFD wind flow model was then used to investigate 3D wind fields at 120–125 m agl over five potential sites offering promising wind resources. The annual energy productions (AEP) and the capacity factors under three different wake loss models and for five wind turbine generator technologies were optimized for 10-MW wind power plants, as per Thailand’s energy policies. With capacity factors ranging from 20 to 40%, it was found that the AEPs of the best sites were in the range of 18–36 GWh/year, with a total AEP in the vicinity of 135 GWh/year when using a single wind turbine model for the five sites studied. The combined energy productions by these wind power plants, once operational, could avoid GHG emissions of more than 80 ktons of CO2eq/year.

1. Introduction

Highly dependent on fossil fuels, Thailand produced, in 2020, slightly over 70% of its electricity consumption from fossil fuels (natural gas, 54%; lignite, 9%; coal, 8% and oil, 0.3%), while renewable energy accounted for 10% and hydropower for 2%. The remainder of the power consumption (16%) was satisfied through electricity imports [1,2]. The natural gas consumed for electricity generation was mainly extracted from the Gulf of Thailand (approximately 70%), with the remaining 30% being imported [3]. In the perspective of energy security, Thailand has embarked on a path to further diversify its sources of power generation, notably by integrating more renewable energy sources for power generation and thus reduce its dependency on natural gas.
Despite its stochastic nature, notably for wind and solar energy, and important capital costs, renewable energy is increasingly considered as a reliable source for power generation in many jurisdictions. Utilities and private companies thus invest significant amounts of time and money in searching for which locations offer the best opportunities for renewable power plant installations [4,5]. Nonetheless, balancing the proportion between fossil-based energy and renewable energy will continue to be a challenge to achieve energy security in Thailand.
Wind energy has expanded rapidly in the last two decades, and it has become an important renewable energy source for power generation worldwide. In 2019, 60.4 GW of wind power was installed, reaching a global cumulative wind power capacity of 651 GW, an increase of 19% compared to 2018 [6]. While rapid growth is being experienced throughout the world, Asia Pacific has been the largest global market for industrial wind power, notably due to the large integration in China.
In Thailand, various studies have found that the annual average wind speeds are low to moderate, ranging from 3 to 5 m/s in most areas of the country. In contrast, in some specific areas of the country, the wind resource has sufficient potential to generate electricity at the utility-scale level (see, for example, the work of Thailand’s Department of Alternative Energy Development and Efficiency (DEDE) [7], World Bank [8], Manomaiphiboon et al. [9], Janjai et al. [10] and Waewsak et al. [11,12,13]).
Throughout the years, several met towers, with heights ranging from 40 to 120 m above ground level (agl), have been installed across the country, with anemometers and wind vanes at several elevations (20 m, 30 m, 40 m, 65 m, 80 m, 90 m, 100 m 110 m and 120 m agl). In 2012, the DEDE of Thailand installed 11 demonstration wind energy sites, with a total capacity of 3.9 MW. The largest wind turbine generator had a nominal capacity of 1.5 MW, and it was installed in the eastern coastal region of Huasai, in Nakhon Si Thammarat Province [14].
Although Thailand is characterized by a wind resource with relatively low wind speeds, wind power generation remains a national objective, with financial support under feed-in-tariff (FIT) programs. Through its 2018 Power Development Plan (PDP), Thailand has set a target of 3 GW for wind power generation for 2037 [15]. In 2019, Thailand installed 322 MW of wind power capacity, bringing the total wind power capacity to 1506 MW [16], representing half of the target. The 32 wind power plants, ranging from 0.05 MW to 103.5 MW [17], have been successfully integrated into the electricity grid of Thailand.
In order to perform wind resource assessments over large areas and at various elevations, mesoscale atmospheric models, along with long-term reanalysis climatic data, are necessary. The atmospheric reanalysis datasets, such as the National Center for Environmental Protection (NCEP) and the Modern Era Retrospective analysis for Research and Applications (MERRA), obtained from satellites, weather balloons, aircrafts, ships, buoys and land measurements, are used to initialize the numerical models with three-dimensional grids [18,19,20].
Generally, two main methods for wind resource assessments are used, i.e., numerical wind models and statistical methods [21,22], with the work in this paper focusing on numerical wind modeling. In wind resource assessments, three main scales of operations are considered, i.e., macroscale (resolutions typically more than 2000 km), mesoscale (resolutions of a few kilometers to 1000 km) and microscale (high resolutions of several meters) [21].
Numerical wind models can be divided into two main types by the level of sophistication, complexity and resolution. The first is Numerical Weather Prediction (NWP) atmospheric models that can run in mesoscale simulations. The second comprises numerical wind flow models that are simplified by a linear Jackson–Hunt wind flow model, coupled with advanced computational fluid dynamics (CFD) wind flow models [23,24]. Both linearized and CFD wind flow models can estimate wind characteristic at the microscale, with relatively high resolutions.
Although linear wind flow models can run with microscale resolutions, this type of model is not suitable for steep slopes or complex terrains. On the other hand, CFD wind flow models are particularly well-suited for wind resource assessments in turbulent conditions and complex terrains. Thus, the next level of sophistication includes methods with coupled mesoscale atmospheric models and microscale wind flow models to achieve a high spatial resolution [24].
Such coupled mesoscale/microscale methods are used to estimate wind energy potentials at high spatial resolutions. For example, Carvalho et al. [24] evaluated the wind resources over complex terrains in Portugal, using the coupled mesoscale Weather Research and Forecasting (WRF) atmospheric model and the Wind Atlas Analysis and Application Program (WAsP) microscale wind flow model. Waewsak et al. used a combined Mesoscale Compressible Community (MC2) atmospheric model and a microscale MsMicro wind flow model to create wind resource maps at 200-m resolution in both onshore (Nakhon Si Thammarat and Songkhla Provinces in Thailand) [11] and offshore (Gulf of Thailand) [25,26] applications. In the work of Gasset et al. [27], the accuracies of various coupled mesoscale atmospheric and microscale wind flow models were assessed by comparing the MC2 with both MsMicro and WAsP wind flow models and for different sources of topography and land use. The results showed that the coupled MC2 and WAsP modeling gave substantially better results than the coupled MC2 and MsMicro modeling. The mesoscale atmospheric models are not only coupled with linear wind flow models, but they can be applied in combination with CFD models to assess the wind power potential within small and large territories [12,28,29]. Recent applications for wind resource assessments using various methodologies include the work of Boopathi et al. [30] in Tamil Nadu in India, Potic et al. [31] in Serbia and Jameel et al. [32] in Pakistan. Finally, Chaichan et al. [33] extended the analysis approach to include a systematic decision-making approach to assess hybrid renewable energy applications with a technoeconomic optimization; their work was applied to a university campus in Thailand.
In this context, the objective of the work presented in this paper is to develop a microscale wind resource map at a spatial resolution of 200 m (200-m × 200-m grids) for low to moderate wind areas and at a spatial resolution of 50 m for the most promising areas of the western coast of Southern Thailand. The wind modeling is performed using a coupled mesoscale atmospheric model (MC2) and a microscale wind flow model (MsMicro), along with the Wind Energy Simulation Toolkit (WEST) [34]. In this work, aligned with the energy policies of Thailand [15], wind power plant designs are optimized for 10-MW VSPP (Very Small Power Producer) wind power plants in five potential windy sites under three different wake loss models. Using the park optimizer module of WindSim [35], the annual energy production is maximized for specific wind turbine generator technologies while minimizing wake losses. Greenhouse gas emission avoidances are also estimated for the potential wind power plants identified.
The approach used in this work contributes to the body of knowledge in wind resource assessment while documenting the technical power potential and the avoidance of greenhouse gas emissions in a jurisdiction (Thailand) that has identified wind energy as a potential source of energy to achieve energy security. This paper also completes the work done on the wind resource assessment of the offshore wind power assessment on the western coast of Thailand [36].

2. Materials and Methods

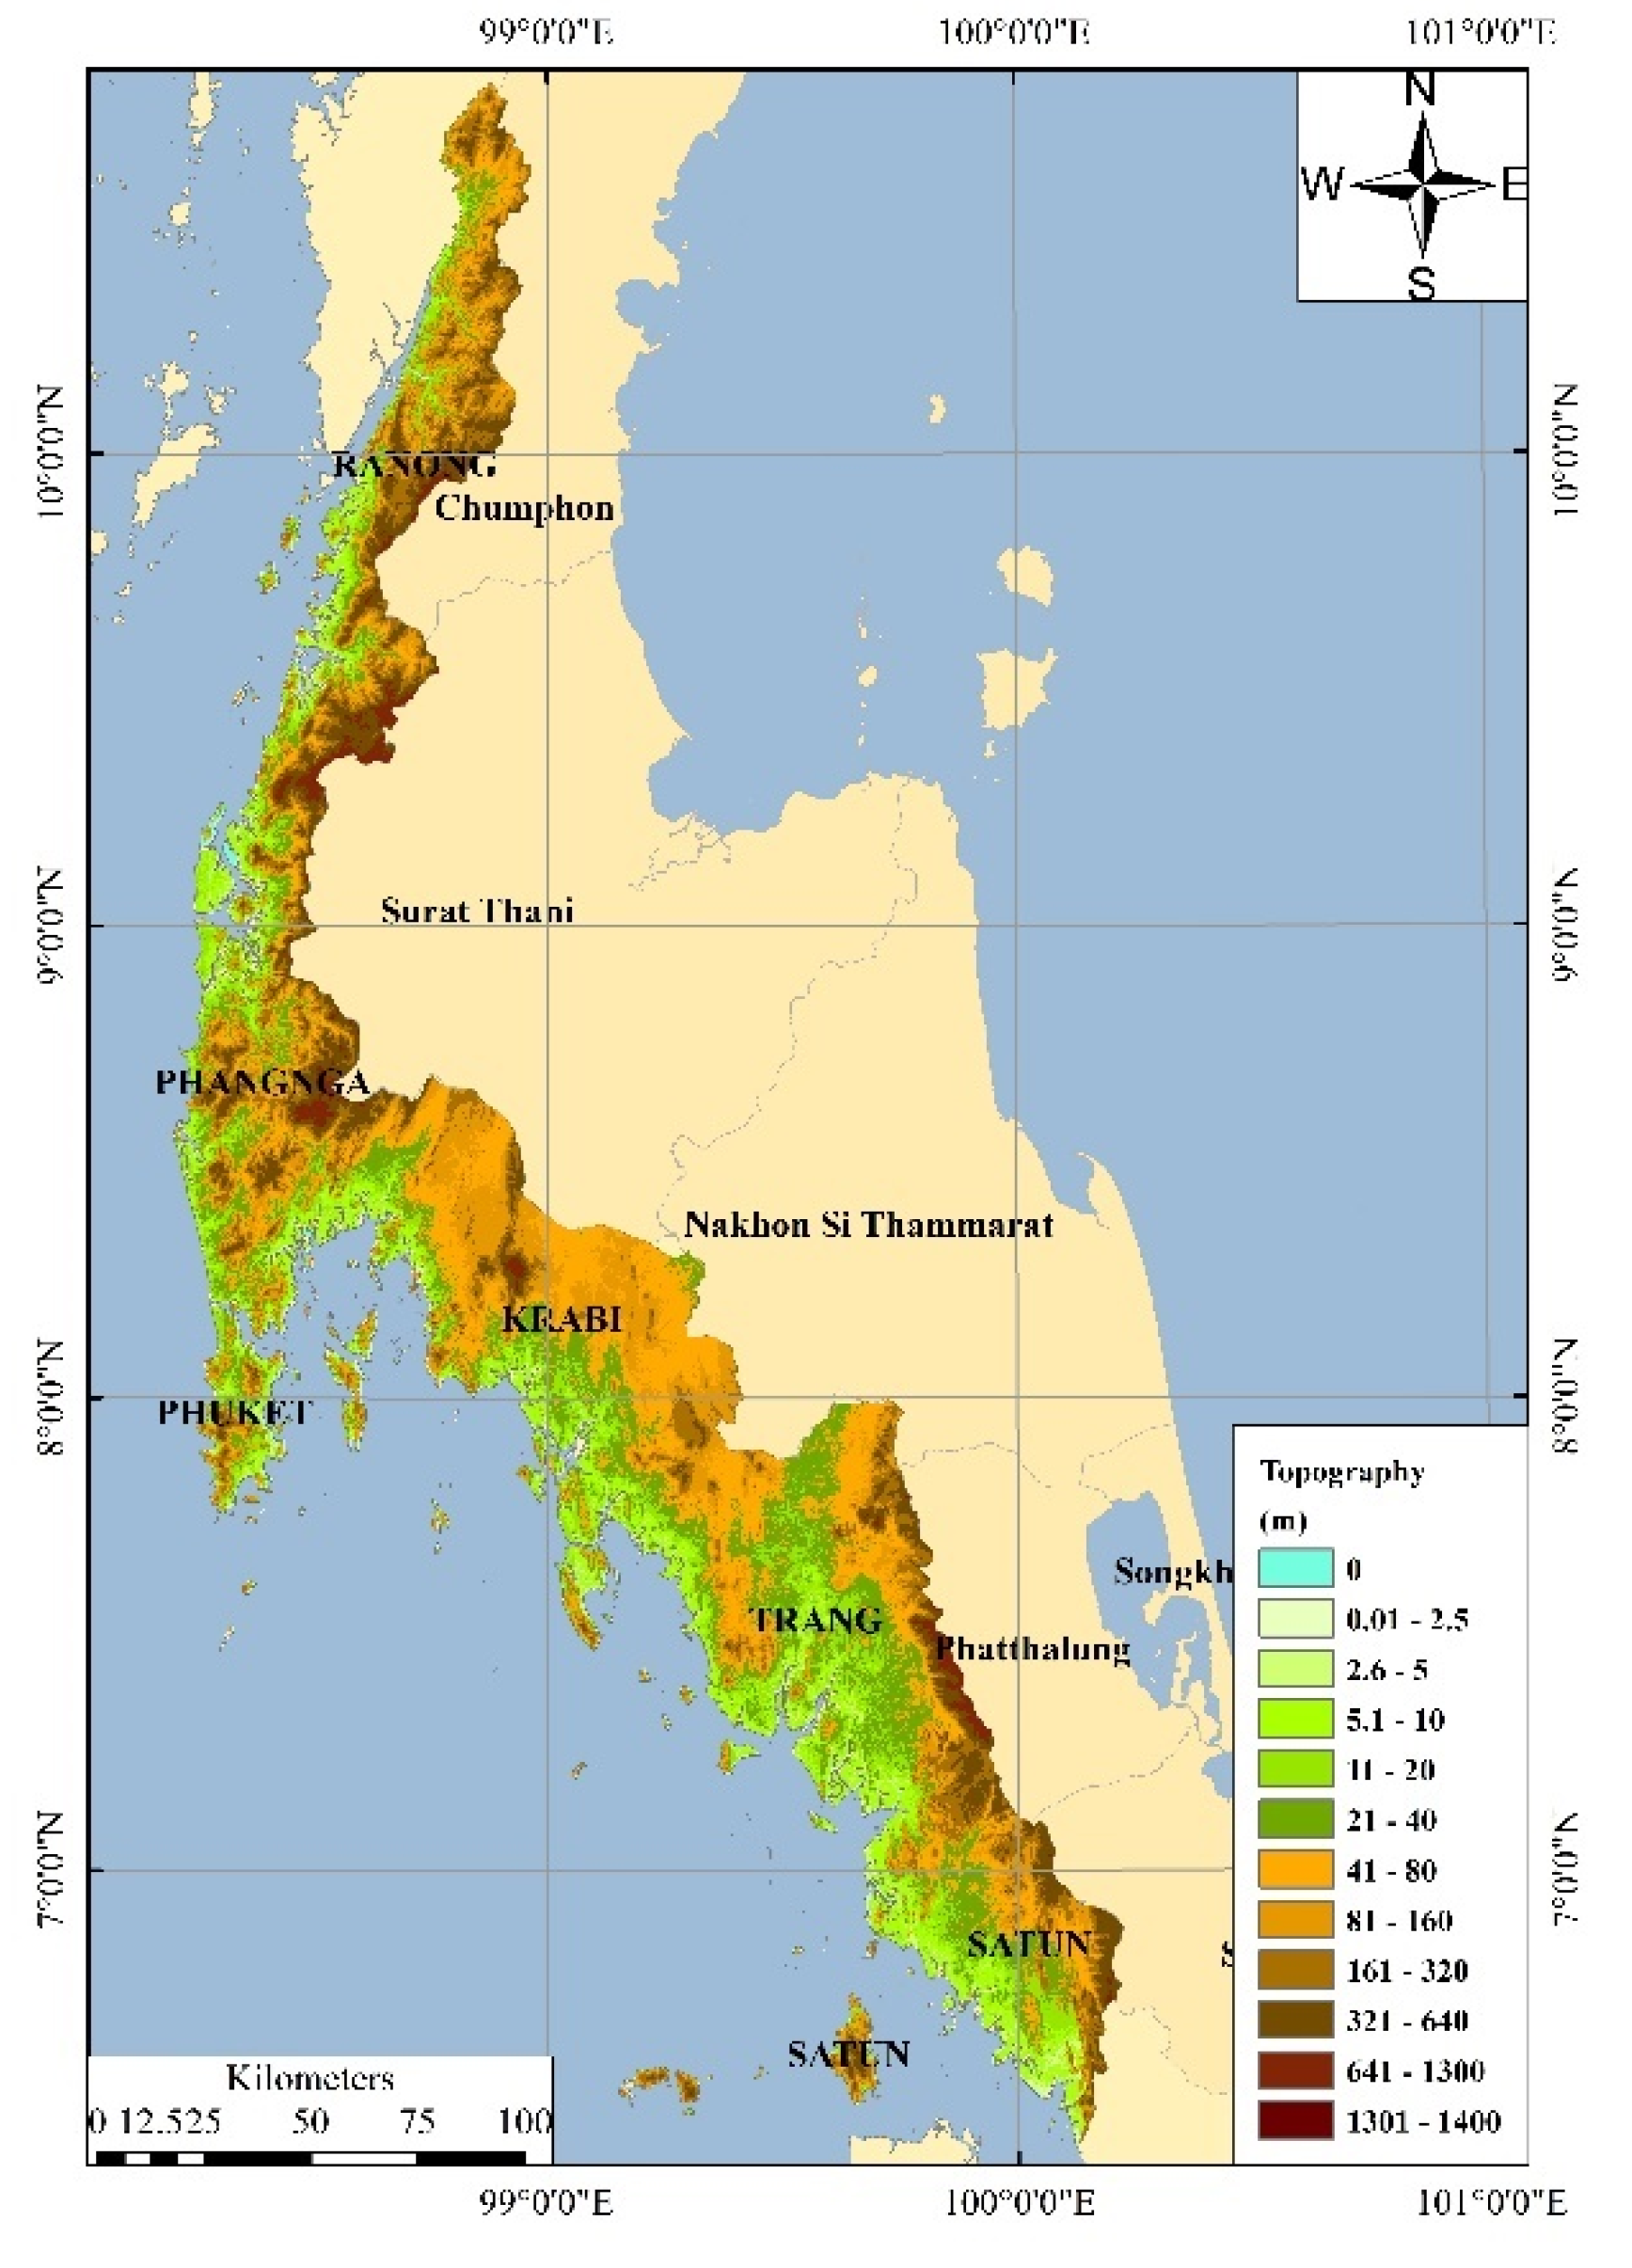
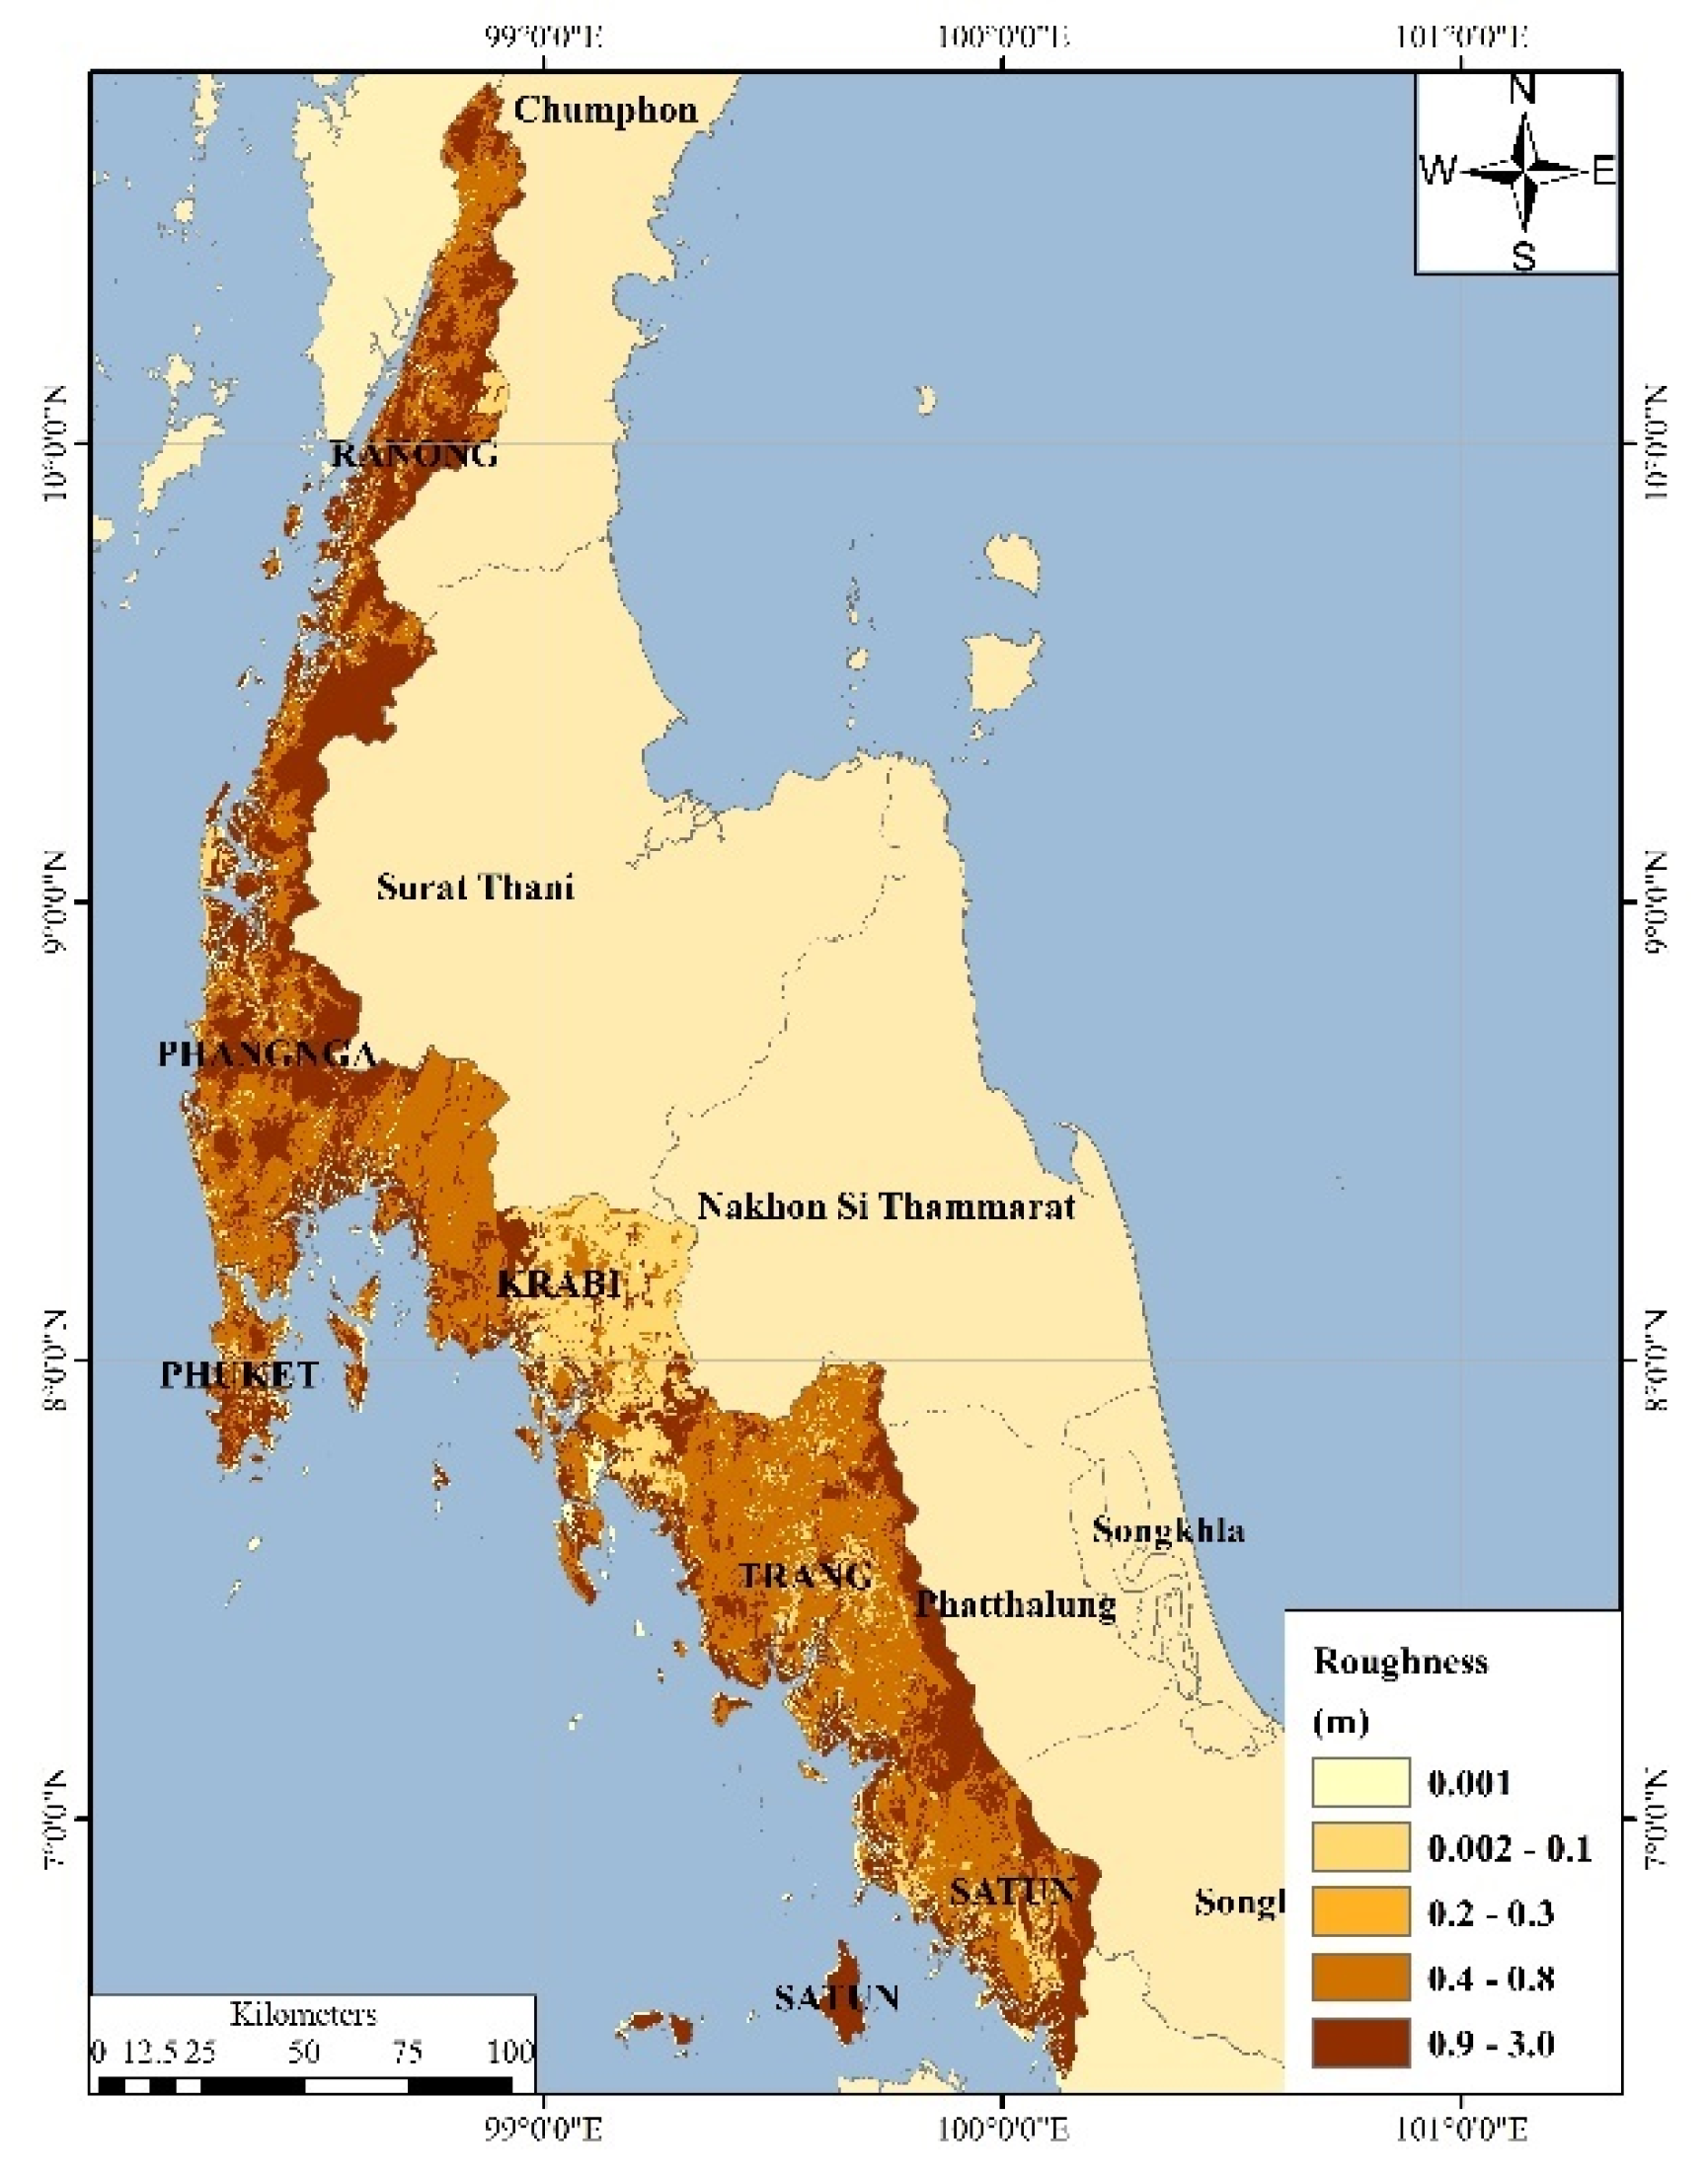
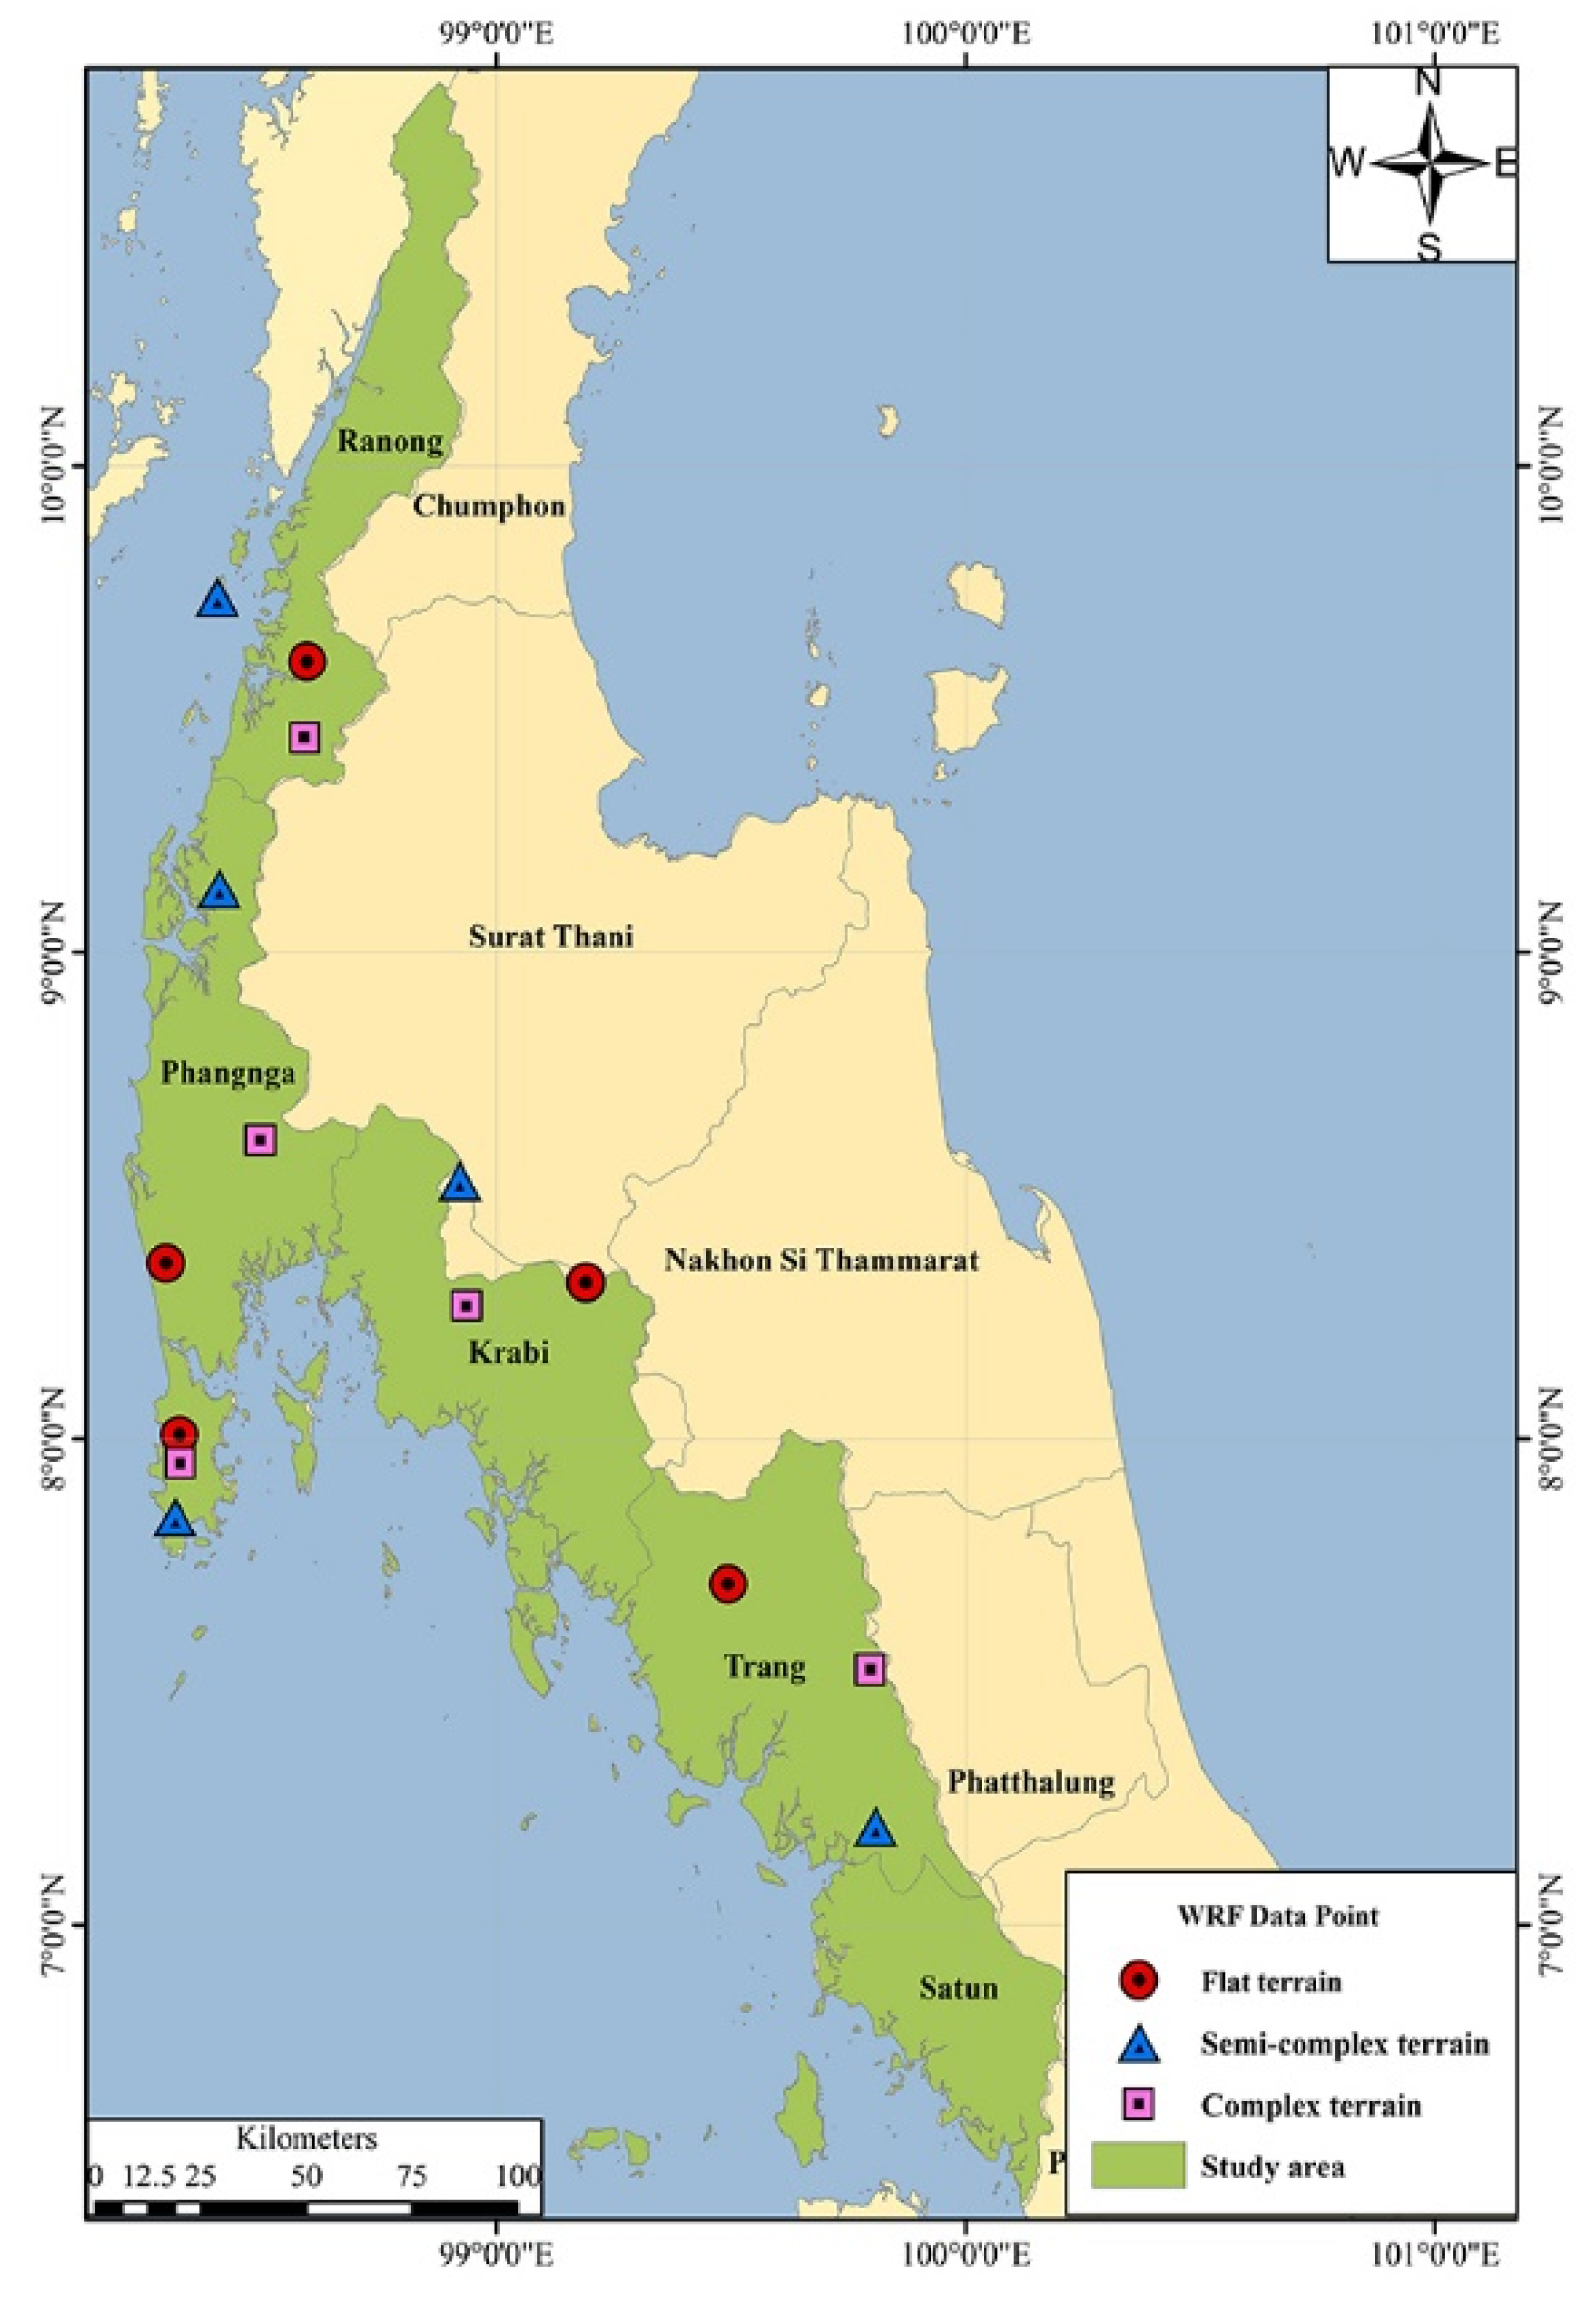
2.1. Characteristics of the Study Area

Figure 1 shows the study area, situated along the Andaman Sea on the western coast of Southern Thailand. Consisting of six provinces, namely Ranong, Phangnga, Phuket, Krabi, Trang and Satun, the area of the Andaman Coast studied in this work has a total area of 17,689 km2, representing 24% of the area of Southern Thailand. This area along the shoreline, experiencing a strong growth in its tourism industry, extends for nearly 900 km along the north–south axis of the Andaman Sea in the Indian Ocean. Coastal mountains on land and a near-shore area dotted with continental islands and barrier islands scattered along the Andaman Coast constitute the topography of the study area.

2.2. Input Data

The wind climatic data, obtained from MERRA, and the GenGeo topography constitute the input data to the model [19]. The MERRA database, a NASA-based atmospheric reanalysis climatic dataset obtained from satellite image interpretations, has used the Goddard Earth Observing System (GEOS) model, along with an Atmospheric Data Assimilation System, to analyze the hydrological cycle over the period of 1979 to the present.
Wind climate data, averaged every six hours from 2005 to 2015 and containing vertical wind speeds, horizontal wind speeds and ambient temperatures, are available at elevations of 0 m (ground level), 1500 m, 3000 m and 5500 m agl. The climate dataset is classified into climate states that drive the mesoscale model in 16 sectors, while each sector is divided into 15 speed classes (each class with 1-m/s interval bins). The vertical wind shear is also divided into two classes (positive and negative) in each climate state by wind speed differences between 1500 m and 0 m. For the mesoscale modeling, the GenGeo database is used for the geophysical fields required, while the topography for the microscale modeling is obtained from the Land Use Land Cover (LULC) of the high-resolution geophysical data obtained from the Land Development Department (LDD), Ministry of Natural Resources and Environment, Royal Thai Government [37]. Based on the World Geodetic System (WGS) 1984 reference datum with Digital Elevation Model (DEM), these LULC-based maps offer a high resolution of 30 m, which is more appropriate for the microscale modeling. The input data for the geophysical properties of the territory studied, formed by the topography map and the reclassified roughness height map from the LULC database, are shown on Figure 2 and Figure 3, respectively.

2.3. Wind Resource Modeling: Coupled Mesoscale and Microscale Modeling

The development of the high-resolution wind resource maps presented in this paper are based on WEST [34], which covers the full processes of performing complete wind resource maps from the mesoscale to the microscale level. WEST is founded on a statistical–dynamic downscaling approach. A statistical analysis determines the frequency of the basic climate states on long-term gridded global datasets. The mesoscale model is based on the Mesoscale Compressible Community (MC2) model with modifications in the model’s initialization, while the MsMicro model is used for microscale modeling to further refine the mesoscale results.

2.3.1. Mesoscale Modeling

The operational numerical wind prediction MC2 atmospheric model, a compressible nonhydrostatic limited area model, is used for the development of the mesoscale wind resource maps. The modeling procedures call upon a statistical–dynamical downscaling method, while the numerical model is based on a sophisticated semi-Lagrangian, semi-implicit scheme using relatively large time steps [38,39].
Two categories of input data are needed for the MC2 atmospheric model. In terms of geophysical properties of the area studied, the GenGeo database, the topography and the type of vegetation, which is an indication of roughness, are used. These geophysical properties affect the wind speeds and the wind directions over short time scales. On the other hand, the wind climatic data, obtained from the MERRA database, provide the classified climate states in the form of wind speeds, wind directions and geostrophic wind shears [40].
The MC2 simulation results are transformed as statistical data by the WEStats module. Weighted by the frequency of occurrences, this data includes the mean values of the wind speeds, the wind power and the different frequency distributions. The output data from the WEStats module constituted the input data for the microscale wind flow model. Notably, the mean wind speed distribution, classified by the direction and frequency distribution of the mean wind direction, are used to compute the microscale mean wind speeds. The bivariate frequency distribution of the mean wind speeds and the mean wind directions are key inputs for the microscale modeling [41].

2.3.2. Microscale Modeling

Based on the Meso/Microscale Coupler (MMC module), the microscale simulations use the MsMicro microscale wind flow model, with a grid resolution of less than 1 km, to compute the wind resource over small regions of the mesoscale grid. Based on CFD models [41] and the Jackson and Hunt theory [42], MsMicro is a steady-state wind flow model that can be applied over complex terrains, such as the region of the Andaman Coast in Southern Thailand.
This theory proposes a linearized model of the Navier–Stokes equations, describing two-dimensional turbulent air flow over low hills in the boundary layer. The governing momentum equations, solved by Finite Fourier Transforms, are linearized with the aid of scale analyses and assumptions of uniformly rough surfaces having small hill slopes. The model assumes a neutrally stratified atmosphere that is divided into an inner layer and an outer layer. The inner flow is under the balance of perturbation stresses, inertia stresses and pressure gradients, while the outer flow is characterized by a pressure gradient driven by irrotational and inviscid flows [43].
The model inputs consist of the bivariate frequency distributions, the mean wind speeds and the mean wind directions obtained from the mesoscale simulations, along with the high-resolution topography and LULC data from the LDD of Thailand, as presented earlier. The bivariate frequency distribution is chosen at a level higher than the microscale target level. The final results (mean wind speeds and wind power) are merged together with a space weight function.
In this work, the mesoscale model is computed at a 3-km × 3-km resolution over 600-km by 600-km domains. For its part, the microscale model is computed at a 200-m × 200-m resolution with 14 domains, each domain being 140 km by 140 km in order to completely cover the area studied. In the postprocessing, the analysis and the presentation of the results from the models are customized as wind resource maps using ArcGIS V.10.3, Redlands, CA, USA.

2.4. Wind Resource Modeling CFD and Wake Loss Modeling

Due to the random and chaotic nature of the atmospheric wind in three dimensions, linear wind flow models are not efficient to estimate wind characteristics over steep mountains or complex terrains, since sharp slopes cause large variations in turbulence. Therefore, CFD models have been developed for microscale wind resource assessments to describe turbulent wind flows over complex terrains [44,45].
The majority of CFD models solve the mass and momentum conservation components of the nonlinear Navier–Stokes equations with the k-epsilon (k-ε) turbulence model in a steady-state flow [46]. The equation set includes average and fluctuating variables of velocity, pressure, density, viscosity, etc. The k-ε model, used in wind flow modeling, is a good compromise of accuracy and computational efficiency for turbulent flow descriptions. The two principal variables are the generation of turbulent kinetic energy (k) and the dissipation rate of the turbulent kinetic energy (ε) [47,48].
Wind turbine wakes, downstream of the rotor, typically induce reduced wind speeds and increased turbulence, resulting in energy losses. The two main characteristics of wakes are a velocity (momentum) deficit and an increased turbulence level. The velocity deficit behind a wind turbine can cause power losses for the downstream turbines, whereas a higher turbulence causes additional loads on the downstream turbine’s structure, resulting in fatigue problems [49,50]. Thus, wake and turbulence effects are important factors for wind power plant layout designs and layouts in order to significantly decrease wake losses and turbulence effects.
The 3D WindSim CFD microscale wind flow model was used in this study to evaluate the wind resource and to optimize the wind power plant performances in the local high-spatial resolution wind fields [35]. The bivariate sector-wise mean wind speeds and mean wind speed directions for 16 sectors (22.5 degrees) at 120 m agl, extracted from the coupled mesoscale and microscale wind resource maps at five potential windy sites in this study, are considered as virtual met mast (VMM) wind datasets. The high-resolution DEM and LULC are the other main inputs for CFD microscale wind flow modeling. The spatial wind resource over 10-km × 10-km domains, with 50-m resolution, are then obtained, and the high-resolution wind resource maps, at specific hub heights of typical wind turbine generators (WTG), are manipulated using ArcGIS V.10.3, Redlands, CA, USA.
The wake loss effect is also quantified using the analytical wake models from Jensen, Larsen and Ishihara. First, the Jensen model is based on a momentum deficit theory that gives a simple linear wake expansion of the downstream distance from the turbine [51,52]. Second, the Larsen model is derived from Prandtl’s turbulent boundary layer equation [51,52]. The velocity deficit is a function of both the axial distance and the radial distance, while the velocity deficit in the Jensen model is only a function of the axial distance. Lastly, Ishihara and Qian [53] introduced a velocity deficit and added turbulence using a Gaussian distribution based on an axial symmetry and a self-similarity assumption of the ambient turbulence intensity and thrust coefficient effects on the wind flow.
In determining the wind power plant layouts, the WTG placements are optimized to maximize the energy production while minimizing the loads on the WTG [35]. Information regarding the wind conditions that should be considered to verify the structural integrity of the WTG, such as wind shear, turbulence and inflow angle, are included. Array efficiency based on an analytical wake model is also considered during the optimization process. In this work, according to the energy policies of Thailand, the WTG placement optimization is for 10-MW VSPP (Very Small Power Producer) wind power plants in five potential windy sites under three different wake loss models. Using the park optimizer module of WindSim [30], the annual energy production (AEP) is maximized while minimizing the wake losses [54,55].

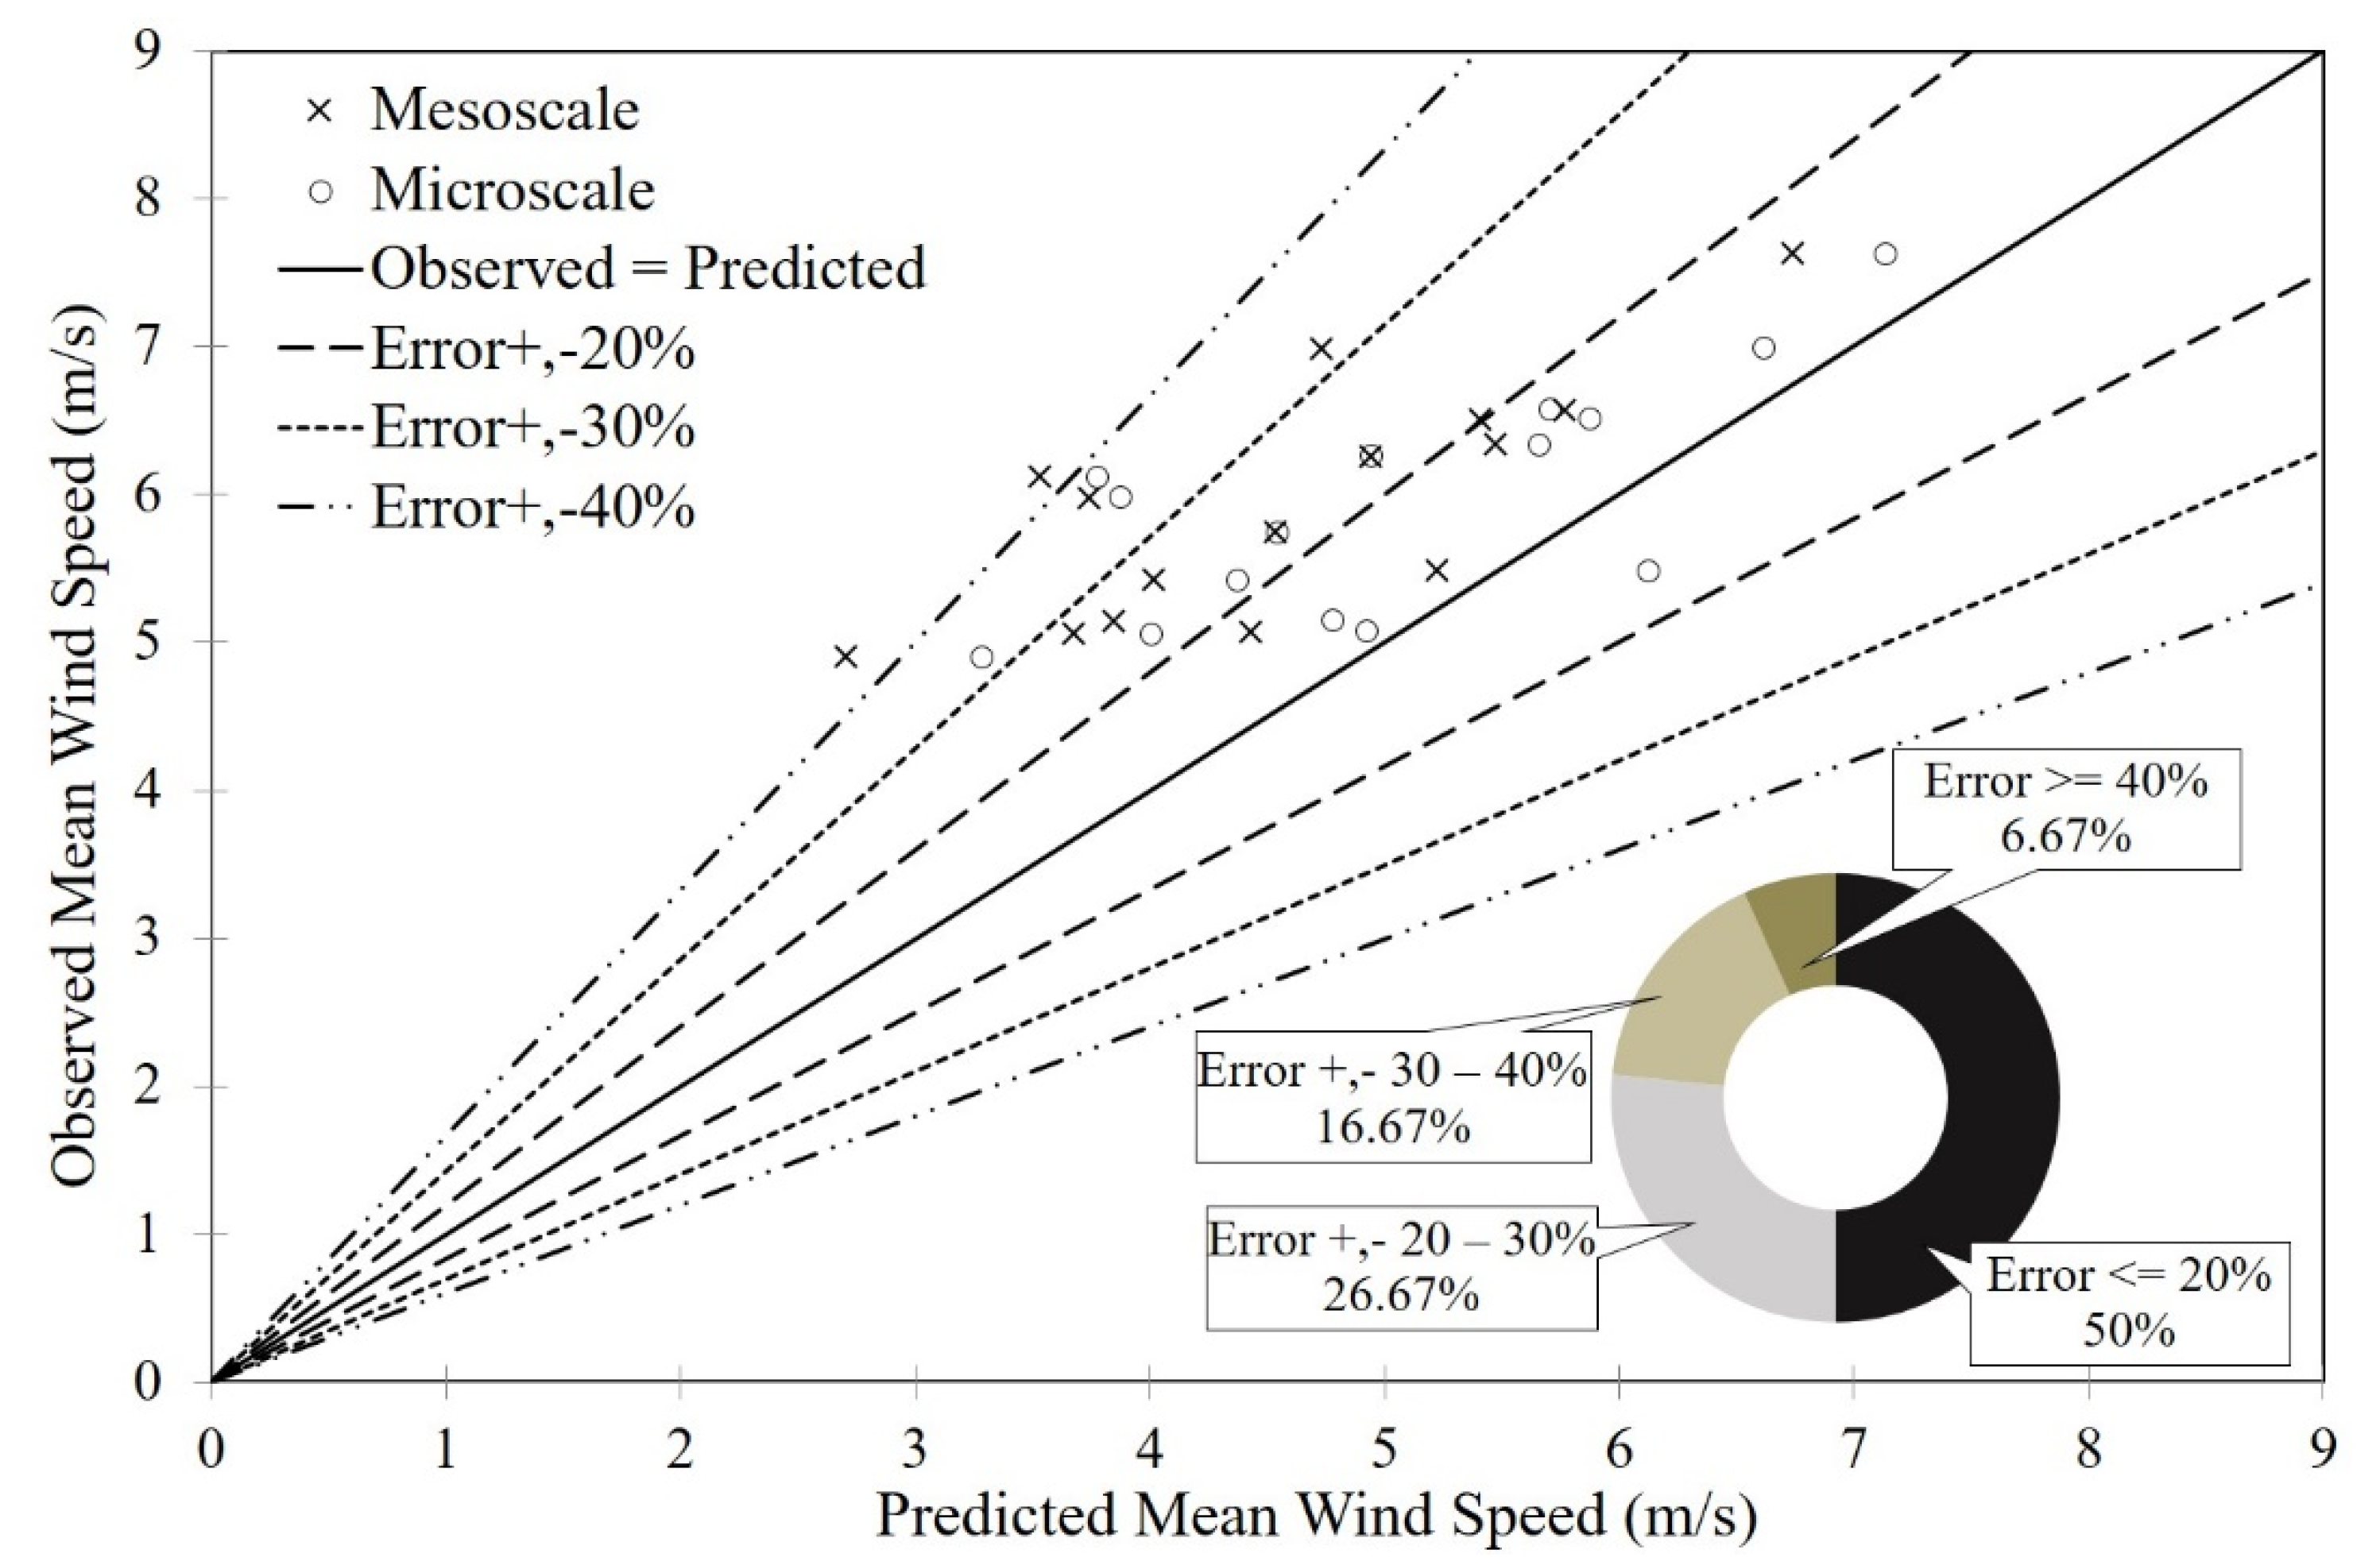
2.5. Wind Maps Validation

Due to the missing and discontinuous measured wind data from met towers in the study area, the wind speed results are validated by comparison with wind speeds from the Weather Research and Forecasting (WRF) atmospheric modeling obtained from previous studies [12]. The validation is done based on the Percent Mean Relative Error (PMER) at an elevation of 120 m agl. The validation is performed using 15 representative points distributed in five sites with three points for each site and classified into three terrain characteristics: flat, semi-complex and complex terrains. The locations of the data points for the validation are shown in Figure 4, while the details of each representative location are given in Table 1.

2.6. Annual Energy Production and Capacity Factors

The AEP generated by the various WTG are estimated with three wake loss models, along with the wind power plant capacity factors and the WTG placement optimization. Thus, the potential areas where the annual mean wind speeds are above 4.5 m/s are chosen as representative potential areas for an energy yield analysis based on the wind resource maps obtained from this work.
In general, CFD models require high-performance computing. Therefore, it is necessary to separate the areas into smaller domains (10 km × 10 km) in order to save run times and to decrease computer loads. The input data consisted of the digital terrain, the LULC data and the virtual met mast data. The digital terrain data were on a proper length scale, with combinations of contour lines and roughness.
The WTG models in this study have cut-in wind speeds of 3.0–3.5 m/s to start generating power, while the rated speeds for the maximum yields are between 10.5 and 12.5 m/s. In line with the Thai energy policies, wind power plants of 10 MW, falling under the Very Small Power Producers (VSPP) power plants [15], are assessed through various scenarios of wind turbines. Five models of WTG are considered, with the mechanical characteristics and power curve data of each WTG shown in Table 2.
The suitable wind turbine locations within the wind power plants were based on the placement optimization to achieve the maximum energy yields within Thailand’s Energy Regulatory Commission (ERC) criteria [56]. Thus, the suitable location of an individual WTG in a potential wind power plant was identified based on the notification of the ERC regarding wind power plant developments. Besides the limitation to VSPP wind power plants, this notice specifies that the spacing at the base of the WTG must not be less than 1.2 times the summation of the hub height and the radius of the rotor [56].
The AEP estimated under the energy losses and uncertainty conditions, and the capacity factors from all scenarios of 10-MW wind power plants, were computed. In this work, the energy losses and uncertainties to estimate the net annual energy productions are given in Table 3 [57,58,59]. For its part, the environmental uncertainties are based on estimations of losses due to environmental impacts that affect the power production of wind turbines, such as modifications of the aerodynamic profile of the blades incurred by dirt, insect accumulation and aging of the blade material [60].

3. Results and Discussion

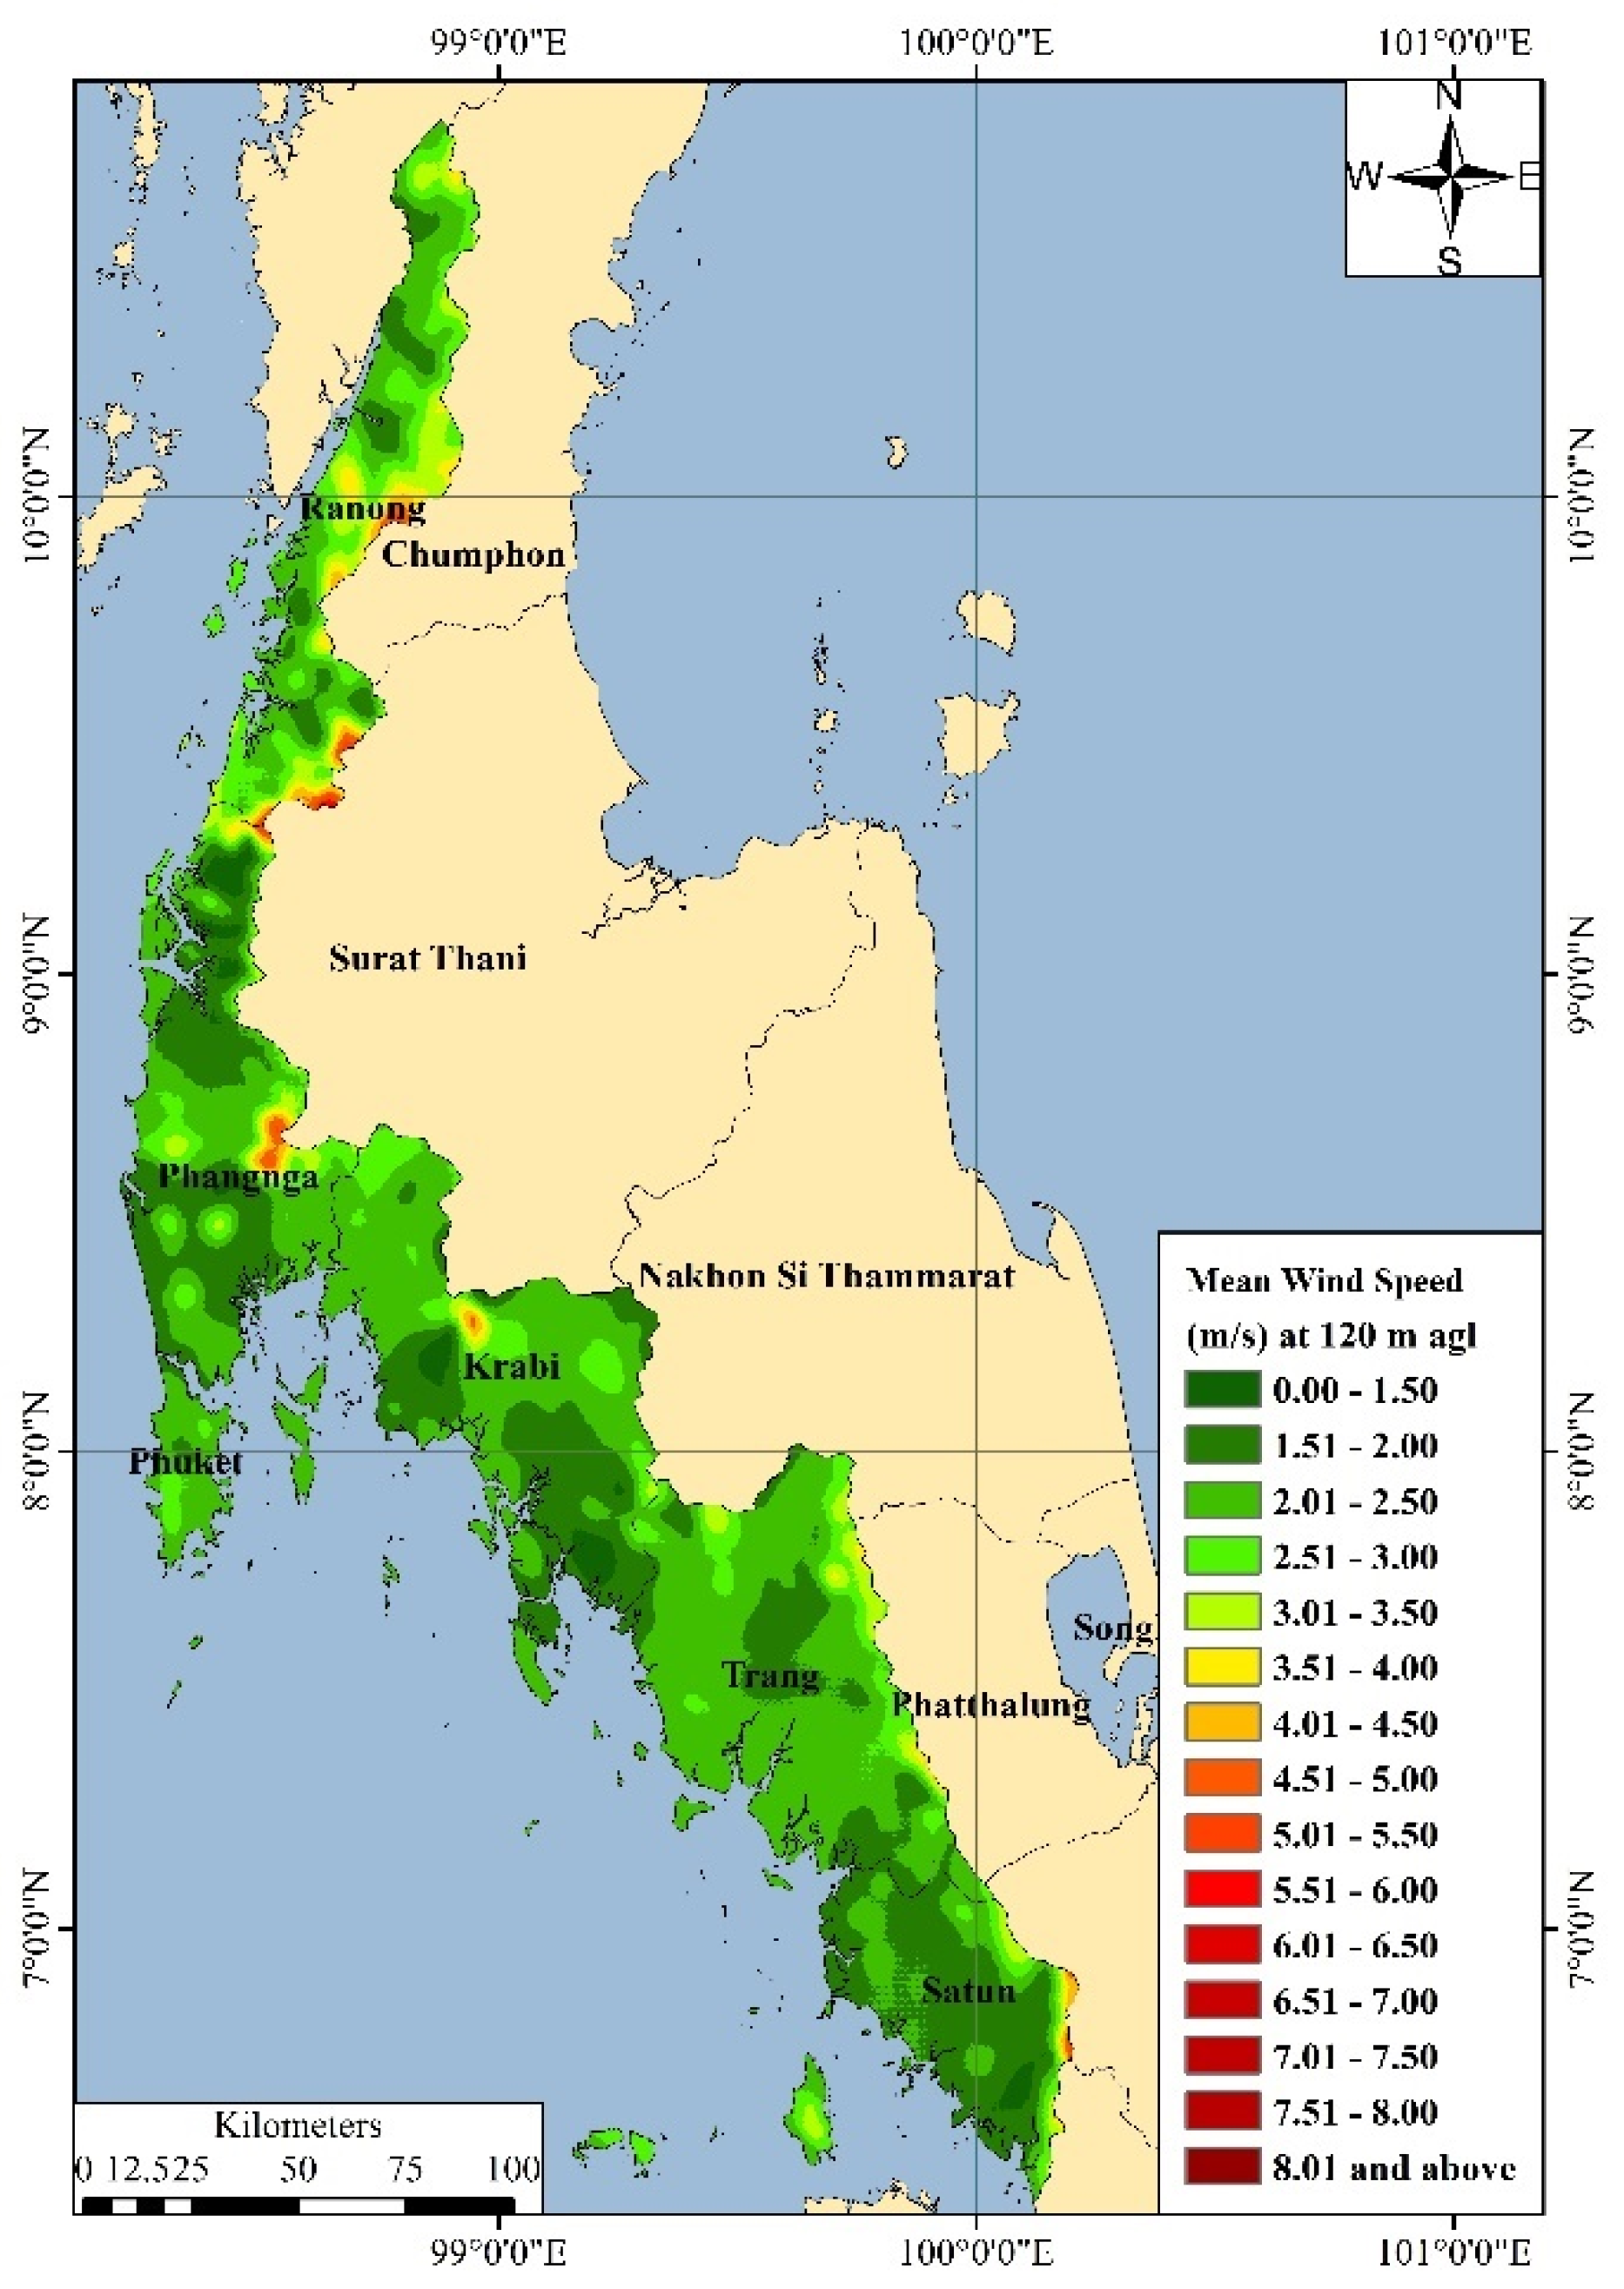
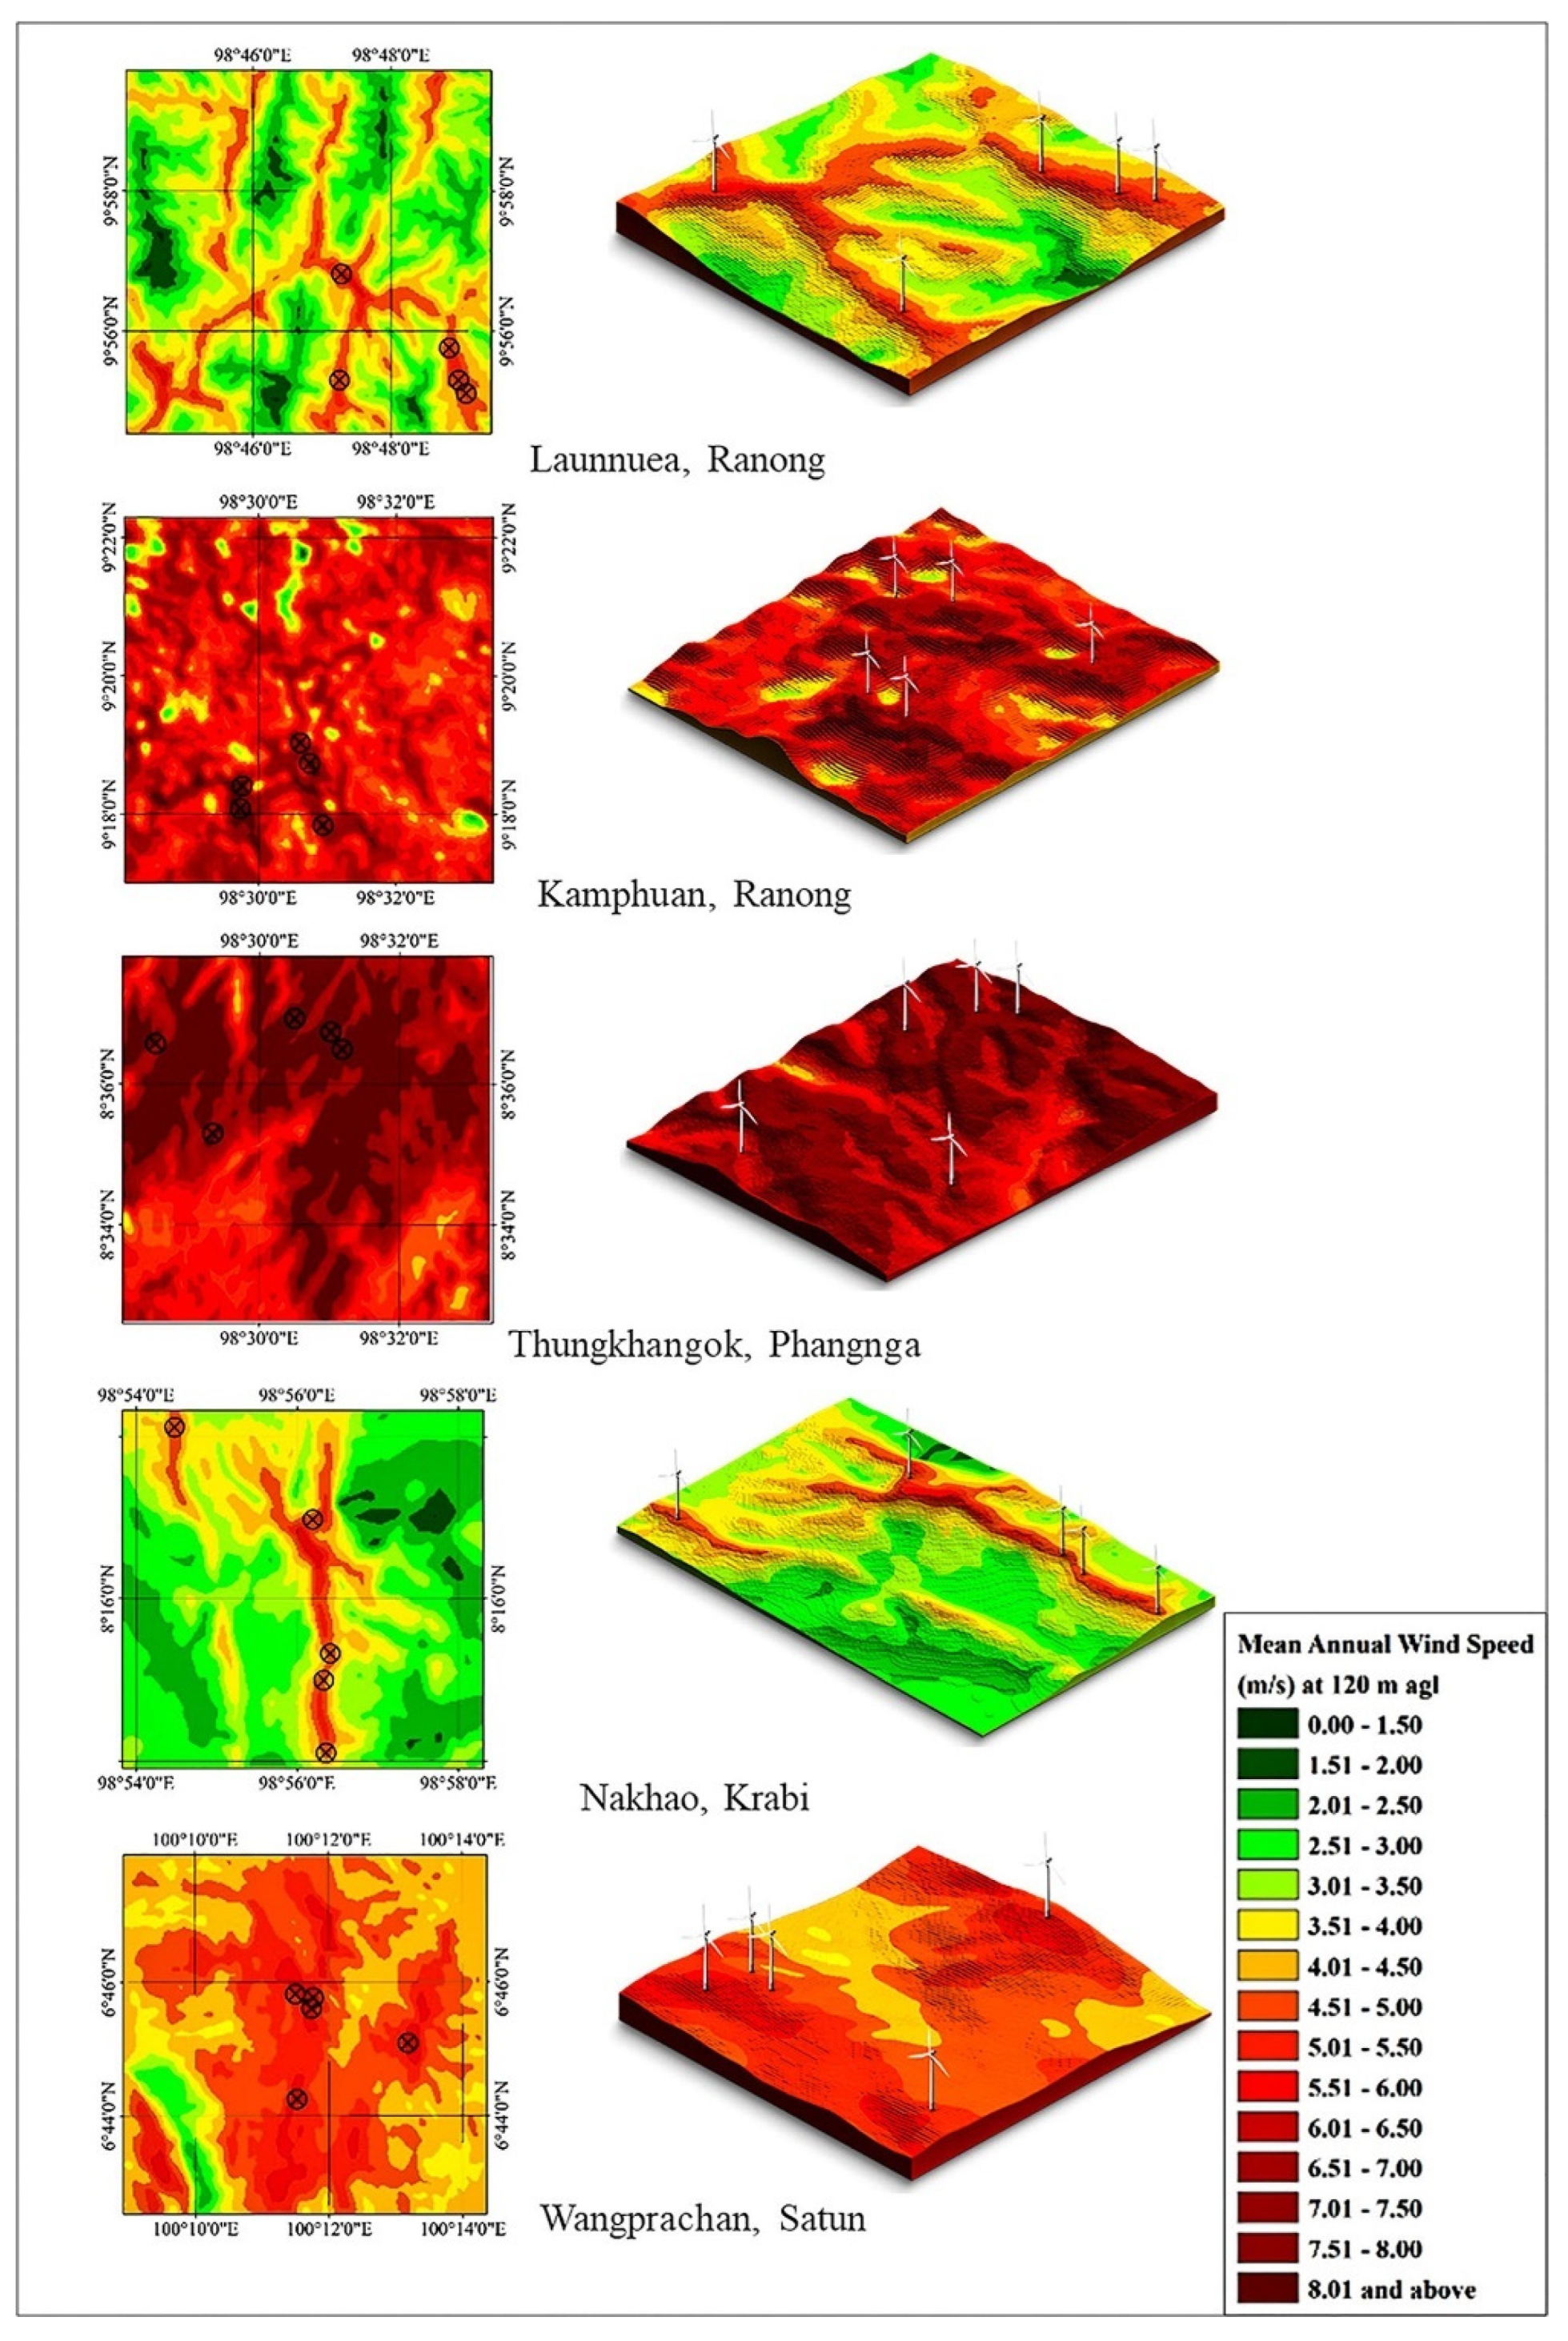
3.1. Wind Resource Maps

The microscale wind resource maps, at a resolution of 200 m and at elevations of 100 m, 120 m and 140 m agl, are illustrated in Figure 5, Figure 6 and Figure 7, respectively. It can be seen that most of the study area is characterized by low wind speeds. However, some specific areas in the mountainous areas have good wind speeds, indicating that they are potential suitable sites for wind power developments in the provinces of Ranong, Phangnga, Krabi and Satun, where the maximum mean annual wind speeds reach 6 m/s at localized areas.
Using the PMRE, the mean annual wind speeds predicted in this work are validated at an elevation of 120 m agl with the mean annual wind speeds obtained from the WRF model at 15 representative locations (presented in Figure 4) within the provinces of the western coast of Southern Thailand. Figure 8 illustrates the scatter plot between the predicted and the WRF mean annual wind speeds, where the WRF values are generally higher than the values predicted with the current model proposed. The results show that, at 120 m agl, the predicted wind speeds from the model proposed are 20% lower for the mesoscale model and 10% lower for the microscale model, in comparison to the equivalent wind speeds obtained from the WRF model. Thus, considering the quantified uncertainty in the predictions, the wind resource maps can be used to identify potential locations for the installation of wind power plants in the territory studied. Further studies, notably with physical wind and climatic measurements over a minimum of a full year, would be needed to confirm the wind resources at these locations.

3.2. Wind Power Potentail

Based on the computed wind resource maps, the majority of the study area is characterized by low wind speeds (below 3.0 m/s); however, some areas have sufficient potential for wind energy production. Five potential areas, in the mountainous regions, have been identified as potential sites for wind power development. The geographical coordinates of the potential sites for wind power plants, along with their mean annual wind speeds at elevations of 100 m, 120 m and 140 m agl, are listed in Table 4. For its part, Figure 9 presents blown-up maps of these most promising sites at 120 agl. It can be seen that the Kamphuan and Thungkhangok Districts have mean annual wind speeds higher than the other sites considered in Launnuea, Nakhao and Wangprachan Districts. In general, the most promising sites are on ridges situated between 700 and 1000-m elevation above the mean sea level.
The wind rose diagrams and the Weibull probability density functions, at 120 m agl, for the potential sites for wind power development are presented in Figure 10. The results show that most of the wind directions are in the east–west direction, notably due to the monsoon effects. It is worth noting that Thailand is normally affected by two monsoons, i.e., the southwest monsoon from mid-June to mid-October and the northeast monsoon from mid-October to mid-February.
Regarding the Launnuea site, the highest mean wind speeds are in the range of 5.7–6.3 m/s, flowing in the western direction for approximately 30% of the time. Likewise, the Kamphuan, Nakhao and Wangprachan sites have the highest mean wind speeds in the vicinity of 6.5 m/s (40% of the time), 5.4 m/s (37% of the time) and 6.5 m/s (37% of the time), respectively, all in the western direction. On the other hand, 36% of the highest mean wind speeds, flowing in the eastern direction, reach 6.7 m/s in Thungkhangok.

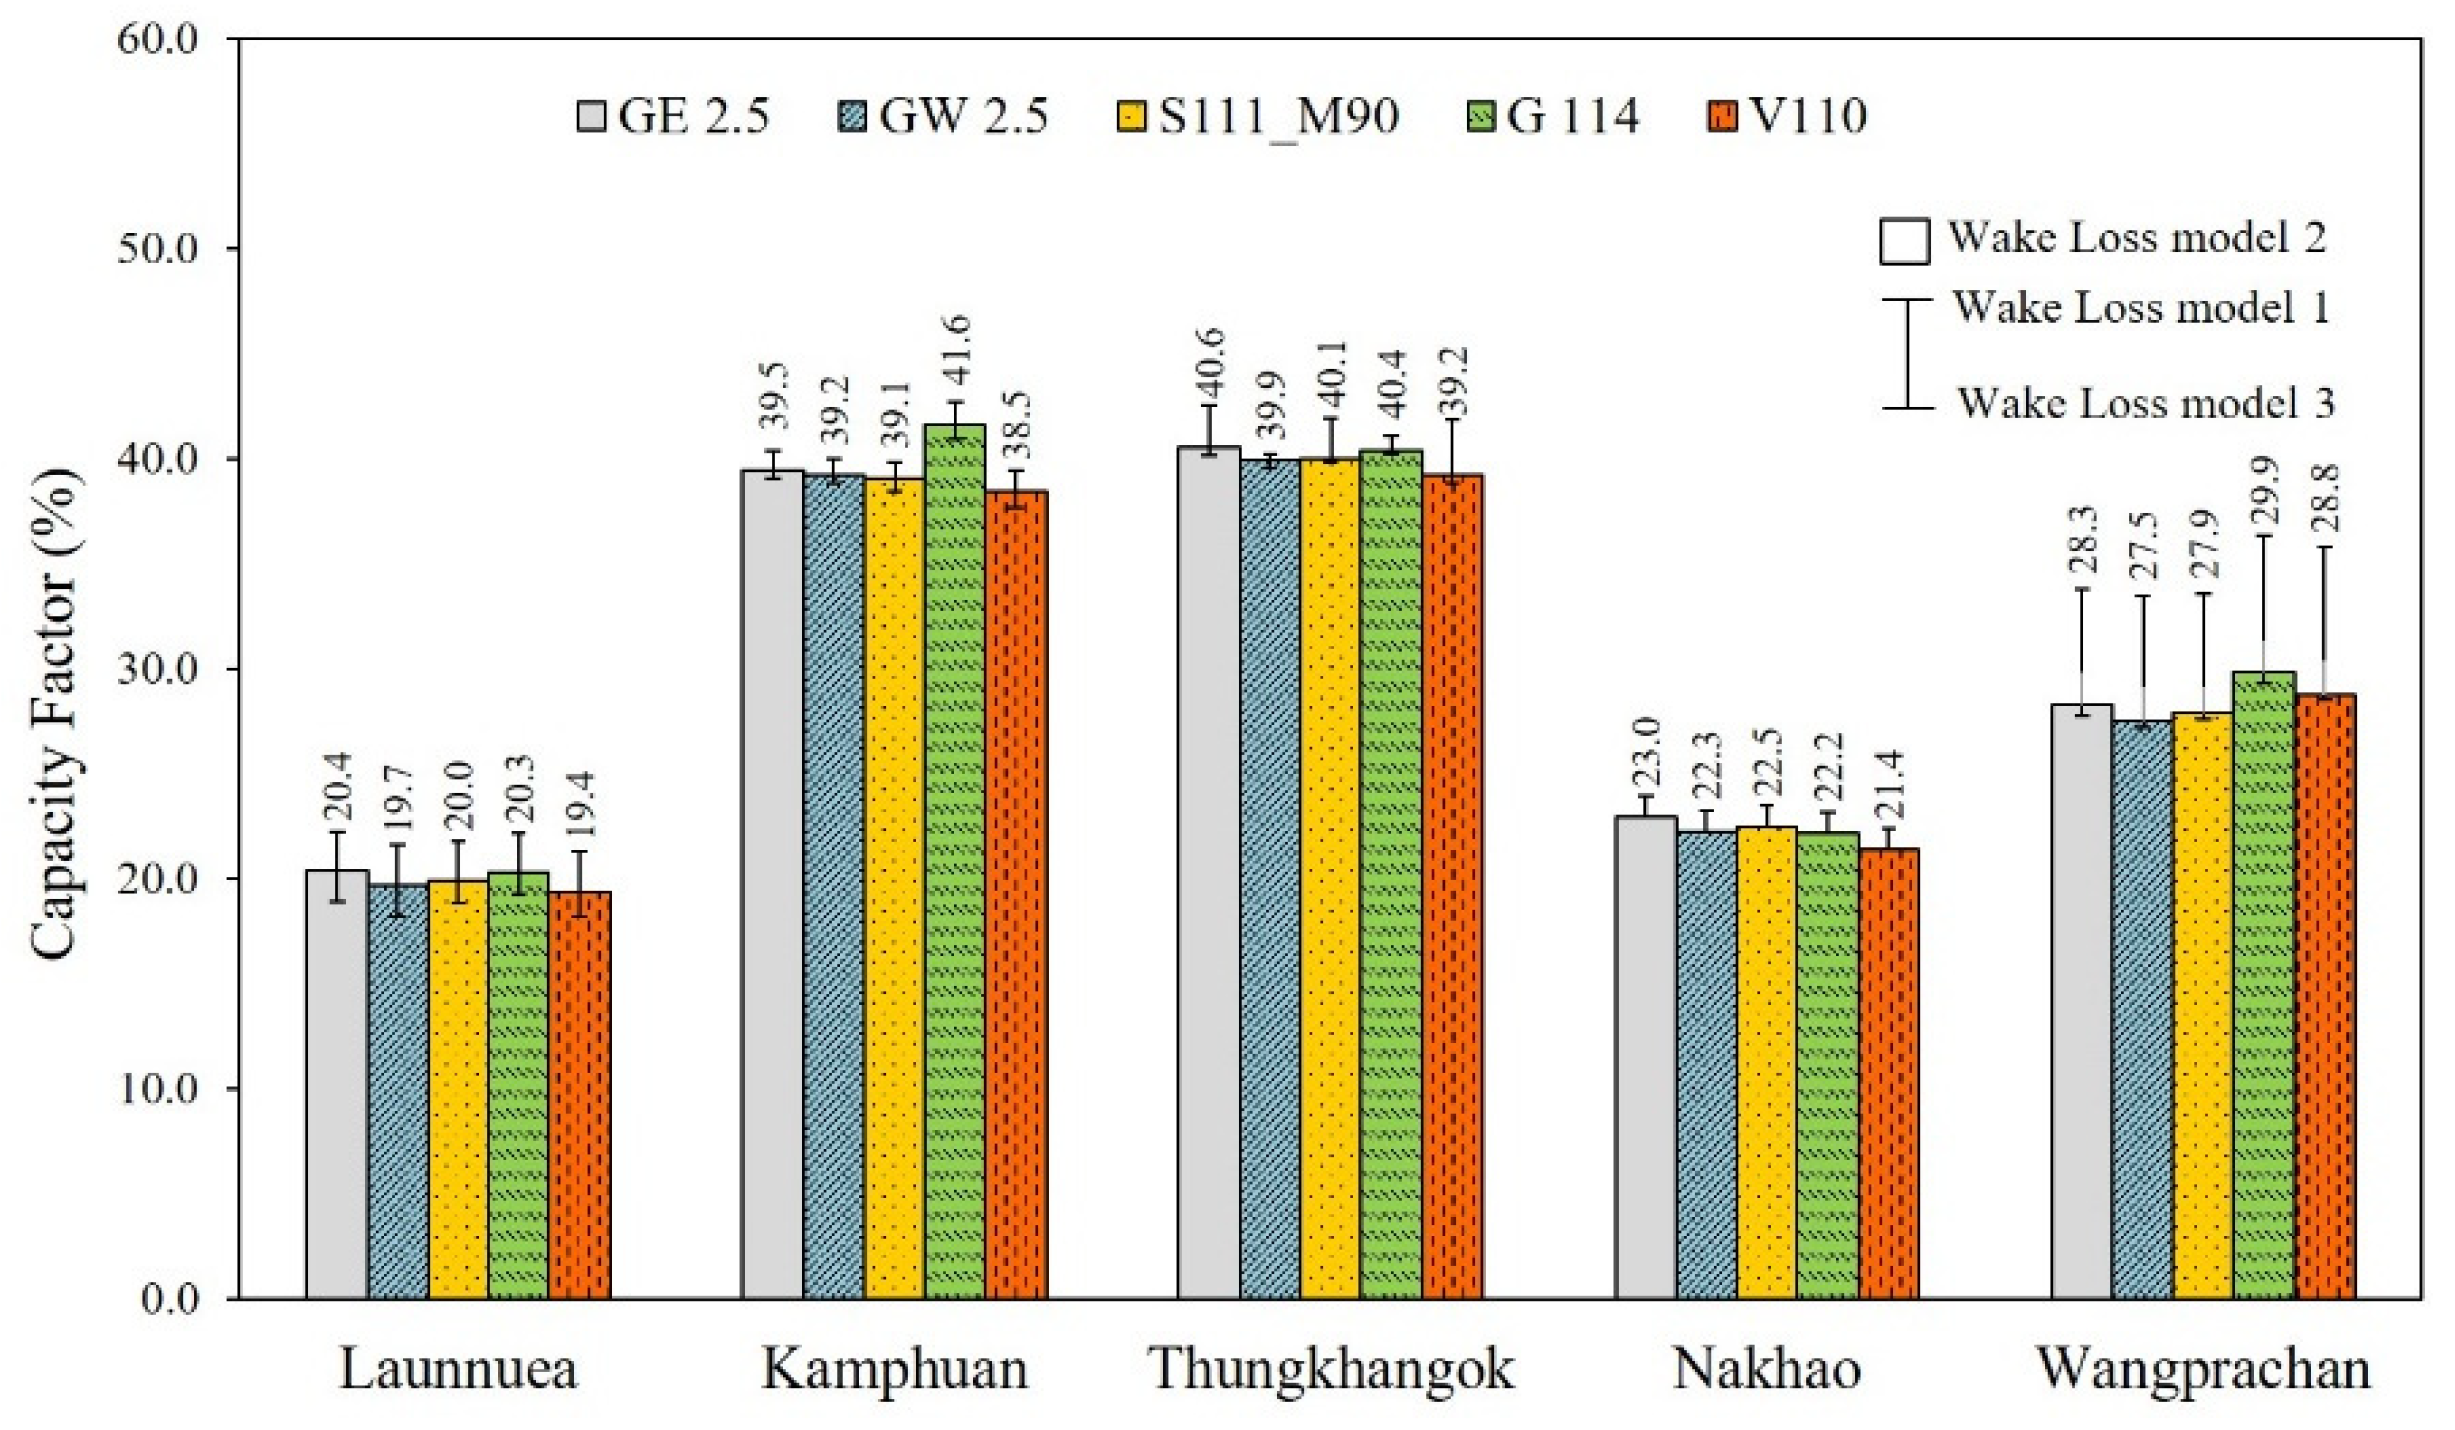
3.3. Annual Energy Production and Capacity Factor

The AEP and capacity factor of a 10-MW wind power plant in five potential sites are evaluated based on CFD modeling at elevations of 120 m and 125 m agl, corresponding to the hub heights of the WTG studied. Five models of utility-scale WTG, with nominal capacities ranging from 2.0 MW to 2.5 MW, are chosen as possible technologies to install VSPP wind power plants (less than or equal to 10-MW capacity) in the different sites. The details of the WTG studied, the total installed capacities and the maximum mean wind speeds for the five potential sites for wind power development are given in Table 5. Regarding individual wind power plant layouts, siting optimizations are required to find the best suitable locations where the WTG can harvest the maximum energy yields under Thailand’s Energy Regulatory Commission (ERC) criteria [56]. The 2D and 3D optimized WTG layouts of the five wind power plants in the potential sites of development are presented in Figure 11.
Figure 12 presents the estimated annual energy productions of 10-MW VSPP wind power plants in the potential sites of development. In this figure, the histogram results are for the Larsen wake loss model (Model 2), while the wake loss models of Jensen (Model 1) and Ishihara (Model 3) are presented using error bars. From this figure, it can be seen that the sites with the most favorable winds (Thungkhangok and Kamphuan) have the largest annual energy productions. Additionally, this figure shows that the three wake loss models did not have significant impacts on the annual energy production for most of the sites, except for the Wangprachan site. For this site, the Larsen (Model 2) and the Ishihara (Model 3) wake loss models give approximately similar values of AEP, while the Jensen (Model 1) wake loss model gives larger values for the AEP. Thus, the results for the AEP at all sites are computed from the predicted wind speeds obtained using the Larsen (Model 2) and the Ishihara (Model 3) wake loss models.
The efficiency of the wind power plants depends on their individual capacity factor, shown in Figure 13. Based on the AEP of 10-MW VSPP wind power plants, the results show that the Thungkhangok and the Kamphuan wind power plants would have the highest efficiencies, with capacity factors near 40% for all WTG. Similar to the results of Figure 12, the capacity factor follows the same trend as the wind speeds in regards to the impact of the wake loss models.
For model consideration, it appears that both the G114 and the GE 2.5 WTG could generate the largest energy yields at the Thungkhangok site. However, if considering the total AEP for all five potential sites and using a single WTG technology, it is found that the G114 WTG could harvest energy yields marginally larger than the GE 2.5. The total AEP using the G114 WTG on all sites could reach 135.5 GWh/year, while the GE2.5 WTG could generate 133.0 GWh/year. Thus, in this work, and considering the AEP from a single WTG model for all sites, wind power plants with the G114 WTG appear to be the best option to achieve the maximum energy production.
In regards to the greenhouse gas emissions, the current CO2eq emissions from electricity generation in Thailand are 0.5986 kg/kWh (Thailand Greenhouse Gas Management Organization (Public Organization) [61]). The power production from the five wind power plants integrating the G114 WTG model could thus reduce GHG emissions in the order of 80 ktons CO2eq/year.
Table 6 presents a summary of the AEP and GHG emission avoidances for the five potential sites, along with the totals for the five sites considered.

4. Conclusions

A wind resource assessment on the Andaman Coast of Thailand was executed based on a coupled mesoscale/microscale wind modeling, along with CFD modeling, to assess the wind resource and to estimate the annual energy production and GHG emission avoidances of five potential sites for wind power development. High-resolution microscale wind resource maps were produced to assess the wind resources on the western coast of Southern Thailand; on the Andaman Sea and covering the provinces of Ranong, Phangnga, Phuket, Krabi, Trang and Satun.
The AEP of siting optimized wind power plants, including their capacity factors, were also estimated using CFD modeling. The parameters for the input data included the MERRA wind climatic database, along with high-resolution topography and LULC digital data. The results showed that, at 120 m agl, the predicted wind speeds from the model proposed were 20% lower for the mesoscale model and 10% lower for the microscale model, in comparison to the equivalent wind speeds obtained from the WRF model.
The results from the microscale wind resource maps showed that the western coast of Thailand is characterized by limited wind resources for power generation. Nonetheless, localized areas of Launnuea and Kamphuan in Ranong Province, Thungkhangok in Phangnga Province and Nakhao in Krabi Province, as well as Wangprachan in Satun Province, have potential for wind power developments, notably at the small-scale level. The five potential sites identified for wind power development using 10-MW VSPP could attain capacity factors of over 20% for all the five sites identified, while two sites (Thungkhangok and Kamphuan) could reach capacity factors of 40%. The annual energy productions for these sites ranged from the lowest production (18 GWh/y in Launnuea; 19 GWh/year in Nakhao) to the largest production (36 GWh/year in Kamphuan; 35 GWh/year in Thungkhangok), with Wangprachan (26 GWh/year) in the middle range. The total AEP would be in the vicinity of 135 GWh/year when using a single wind turbine generator model for the five sites studied. The combined energy productions by these wind power plants, once operational, could avoid the GHG emissions of more than 80 ktons of CO2eq/year.
Future works will include contributions at two levels. In terms of modeling, future works will include the development of robust models for the effect of the canopy on the wind resource and the integration of these canopy models in global modeling. Regarding sustainable development, scenario suitability assessments for the development of wind power in the region studied could be made using models such the Analytical Hierarchy Process (AHP), along with an economic assessment based on the levelized cost of energy (LCOE).

Author Contributions

Conceptualization, L.N. and J.W.; methodology, J.W.; software, L.N.; validation, L.N.; formal analysis, L.N.; investigation, C.L.; resources, J.W. and C.L.; data curation, J.W.; writing—original draft preparation, L.N.; writing—review and editing, J.W. and Y.G.; visualization, J.W.; supervision, Y.G.; project administration, C.L. and funding acquisition, J.W. All authors have read and agreed to the published version of the manuscript.

Funding

This research received no external funding.

Data Availability Statement

Not applicable.

Acknowledgments

The authors would like to thank the Department of Alternative Energy Development and Efficiency (DEDE) of Thailand for their kind support of the wind speed data for the wind map validation. The authors also thank the Energy Policy and Planning Office (EPPO) and International College, Thaksin University for partial financial support of this work under the framework of the International Graduate Program (IGP).

Conflicts of Interest

The authors declare no conflict of interest.

References

  1. Electricity Generating Authority of Thailand (EGAT). Statistical Data: Proportion of Electric Power in the Fuel System of EGAT in 2019. Available online: http://www.egat.co.th (accessed on 10 December 2021).
  2. International Renewable Energy Agency (IRENA). Energy Profile Thailand. Available online: https://www.irena.org/IRENADocuments/Statistical_Profiles/Asia/Thailand_Asia_RE_SP.pdf (accessed on 10 December 2021).
  3. Energy Policy and Planning Office (EPPO). Energy Statistics. Available online: http://www.eppo.go.th/index.php/en/en-energystatistics/electricity-statistic (accessed on 10 December 2021).
  4. International Renewable Energy Agency (IRNA). Renewable Power Generation Costs in 2018. Available online: https://www.irena.org/publications/2019/May/Renewable-power-generation-costs-in-2018 (accessed on 10 December 2021).
  5. International Renewable Energy Agency (IRENA). Renewable Power Market Analysis: GCC2019. Available online: https://www.irena.org/publications/2020/Jun/Renewable-Power-Costs-in-2019 (accessed on 10 December 2021).
  6. Global Wind Energy Council (GWEC). GWEC Global Wind Report 2019. Available online: www.gwec.net (accessed on 10 December 2021).
  7. Department of Alternative Energy Development and Efficiency. Wind Resource Assessment of Thailand, Final Report (E-Book). Available online: http://www2.dede.go.th/dede/renew/Twm/REPORT.html (accessed on 10 December 2021).
  8. The World Bank Asia Alternative Energy Program. Wind Energy Resource Atlas of Southeast Asia. Available online: http://documents1.worldbank.org/curated/en/252541468770659342/pdf/318700Wind0energy0atlas0complete.pdf (accessed on 10 December 2021).
  9. Manomaiphiboon, K.; Prabamroong, A.; Chanaprasert, W.; Rajpreeja, N.; Phan, T.T. Wind Resource Assessment Using Advanced Atmospheric Modeling and GIS Analysis: Final Report, 1st ed.; Thailand Research Fund: Bangkok, Thailand, 2010. [Google Scholar]
  10. Janjai, S.; Masiri, I.; Promsen, W.; Pattarapanitchai, S.; Pankaew, P.; Laksanaboonsong, J.; Bischoff-Gauss, I.; Kalthoff, N. Evaluation of Wind Energy Potential over Thailand by using an Atmospheric Mesoscale Model and a GIS Approach. J. Wind. Eng. Ind. Aerodyn. 2014, 129, 1–10. [Google Scholar] [CrossRef]
  11. Waewsak, J.; Landry, M.; Gagnon, Y. High Resolution Wind Atlas for Nakhon Si Thammarat and Songkhla Provinces, Thailand. Renew. Energy 2013, 53, 101–110. [Google Scholar] [CrossRef]
  12. Waewsak, J.; Chancham, C.; Chiwamongkhonkarn, S.; Gagnon, Y. Wind Resource Assessment of the Southernmost Region of Thailand Using Atmospheric and Computational Fluid Dynamics Wind Flow Modeling. Energies 2019, 12, 1899. [Google Scholar] [CrossRef] [Green Version]
  13. Waewsak, J.; Ali, S.; Nathee, W.; Kongruang, C.; Chancham, C.; Gagnon, Y. Assessment of Hybrid, Firm Renewable Energy-Based Power Plants: Application in the Southernmost Region of Thailand. Renew. Sustain. Energy Rev. 2020, 130, 109953. [Google Scholar] [CrossRef]
  14. Department of Alternative Energy Development and Efficiency, Ministry of Energy. Available online: https://weben.dede.go.th/webmax/content/dede’s-15-mw-wind-power-pilot-project-proven-be-great-success (accessed on 10 December 2021).
  15. Energy Policy and Planning Office. Thailand Power Development Plan 2018–2036 (PDP 2018). Available online: http://www.eppo.go.th/index.php/en/policy-and-plan/en-tieb/tieb-pdp (accessed on 10 December 2021).
  16. Department of Alternative Energy Development and Efficiency, Ministry of Energy. Performance on Alternative Energy Policy: January 2020. Available online: https://weben.dede.go.th/webmax/content/annual-report-2015-department-alternative-energy-development-and-efficiency (accessed on 10 December 2021).
  17. Energy Regulatory Commission (ERC). Energy Data Center, SPP/VSPP Database System. Available online: http://www.erc.or.th/ERCSPP (accessed on 10 December 2021).
  18. Peña, A.; Hasager, C.B. Remote Sensing for Wind Energy, 1st ed.; Risø National Laboratory for Sustainable Energy: Roskilde, Denmark, 2011. [Google Scholar]
  19. Lucchesi, R. File Specification for MERRA Products. GMAO Office Note No.1 (Version 2.3). Available online: http://gmao.gsfc.nasa.gov/pubs/office_notes (accessed on 15 May 2019).
  20. Weekes, S.M.; Tomlin, A.S.; Vosper, S.B.; Skea, A.K.; Gallani, M.L.; Standen, J.J. Long-Term Wind Resource Assessment for Small and Mediun-Scale Turbines using Operational Forecast Data and Measure-Correlate-Predict. Renew. Energy 2015, 81, 760–769. [Google Scholar] [CrossRef] [Green Version]
  21. Veronesi, F.; Grassi, S.; Raubal, M. Statistical Learning Approach for Wind Resource Assessment. Renew. Sustain. Energy Rev. 2016, 56, 836–850. [Google Scholar] [CrossRef]
  22. Murthy, K.S.R.; Rahi, O.P. A Comprehensive Review of Wind Resource Assessment. Renew. Sustain. Energy Rev. 2017, 72, 1320–1342. [Google Scholar] [CrossRef]
  23. Beaucage, P.; Brower, M.C.; Tensen, J. Evaluation of Four Numerical Wind Flow Models for Wind Resource Mapping. Wind. Energy 2012, 17, 197–208. [Google Scholar] [CrossRef]
  24. Carvalho, D.; Rocha, A.; Silva Santos, C.; Pereira, R. Wind Resource Modelling in Complex Terrain using Different Mesoscale-Microscale Coupling Techniques. Appl. Energy 2013, 108, 493–504. [Google Scholar] [CrossRef] [Green Version]
  25. Waewsak, J.; Landry, M.; Gagnon, Y. Offshore Wind Power Potential of the Gulf of Thailand. Renew. Energy 2015, 81, 609–626. [Google Scholar] [CrossRef]
  26. Chancham, C.; Waewsak, J.; Gagnon, Y. Offshore Wind Resource Assessment and Wind Power Plant Optimization in the Gulf of Thailand. Energy 2017, 193, 706–731. [Google Scholar] [CrossRef]
  27. Gasset, N.; Landry, M.; Gagnon, Y. A Comparison of Wind Flow Models for Wind Resource Assessment in Wind Energy Applications. Energies 2012, 5, 4288–4322. [Google Scholar] [CrossRef] [Green Version]
  28. Mughal, M.O.; Lynch, M.; Yu, F.; Sutton, J. Forecasting and Verification of Winds in an East African Complex Terrain using Coupled Mesoscale—And Microscale Models. J. Wind Eng. Ind. Aerodyn. 2018, 176, 13–20. [Google Scholar] [CrossRef]
  29. Bilal, M.; Birkelund, Y.; Homola, M.; Virk, M.S. Wind over Complex Terrain—Microscale Modeling with Two Types of Mesoscale Wind at Nygårdsfjell. Renew. Energy 2016, 99, 647–653. [Google Scholar] [CrossRef]
  30. Boopathi, K.; Kushwaha, R.; Balaraman, K.; Bastin, J.; Kanagavel, P.; Prasad, R. Assessment of wind power potential in the coastal region of Tamil Nadu, India. Ocean. Eng. 2021, 219, 108356. [Google Scholar] [CrossRef]
  31. Potic, I.; Joksimovic, T.; Millincic, U.; Kicovic, D.; Milincic, M. Wind energy potential for the electricity production—Knjazevac Municipality cast study (Serbia). Energy Strategy Rev. 2021, 33, 100589. [Google Scholar] [CrossRef]
  32. Jameel, M.A.; Syed, A.; Ali, F.; Imran, M. A techno-economic analysis for power generation through wind energy: A case study of Pakistan. Energy Rep. 2021, 7, 1424–1443. [Google Scholar]
  33. Chaichan, W.; Waewsak, J.; Gagnon, Y. A Systematic Decision-Making Approach for the Assessment of Hybrid Renewable Energy Application with Techno-Economic Optimization: Application to the Rajamangala University of Technology Srivijaya (Trang Campus), Southern Thailand, Songklanakarin. J. Sci. Technol. 2021, 43, 1800–1806. [Google Scholar]
  34. Gasset, N.; Yu, W. WEST (Wind Energy Simulation Toolkit) Tutorial, 1st ed.; Recherche en Prevision Numerique, Environment Canada: Montréal, QC, Canada, 2011. [Google Scholar]
  35. Meissner, D. WindSim Getting Started, WindSim 7, 8th ed.; WindSim As.: Tønsberg, Norway, 2015. [Google Scholar]
  36. Ranthodsang, M.; Waewsak, J.; Kongruang, C.; Gagnon, Y. Offshore Wind Power Assessment on the Western Coast of Thailand. Energy Rep. 2020, 6, 1135–1146. [Google Scholar] [CrossRef]
  37. Land Development Department, Ministry of Natural Resources and Environment, Royal Thai Government. Land Use and Topography Databases. Available online: http://www1.ldd.go.th/WEB_OLP/report_research_S.html (accessed on 15 May 2018).
  38. Niewiadomski, M.; Leung, Y.C.D.; Benoit, R. Simulations of Wind Field and Other Meteorological Parameters in the Complex Terrain of Hong Kong Using MC2—A Mesoscale Numerical Model. J. Wind Eng. Ind. Aerodyn. 1999, 80, 71–82. [Google Scholar] [CrossRef]
  39. Yu, W.; Benoit, R.; Girard, C.; Glazer, A.; Lemarquis, D.; Salmon, J.R.; Pinard, J.P. Wind Energy Simulation Toolkit (WEST): A Wind Mapping System for Use by Wind Energy Industry. Wind Eng. 2009, 30, 15–33. [Google Scholar] [CrossRef]
  40. Pinard, J.P.; Benoit, R.; Wildson, J.D. Mesoscale Wind Climate Modelling in Steep Mountains. Atmos.-Ocean 2009, 47, 63–67. [Google Scholar] [CrossRef] [Green Version]
  41. Canadian Hydraulics Centre. AnemoScope Wind Energy Simulation and Mapping Reference Guide, 1st ed.; Cacadian Hydraulics Centre, Environment Canada: Montréal, QC, Canada, 2006. [Google Scholar]
  42. Katic, I.; Højstrup, J.; Jensen, N.O. A simple model for cluster efficiency. In Proceedings of the European Wind Energy Association Conference & Exhibition, Rome, Italy, 7–9 October 1986. [Google Scholar]
  43. Pinard, J.P.; Benoit, R.; Yu, W. A West Wind Climate Simulation of Mountainous Yukon. Atmos.-Ocean 2005, 43, 259–281. [Google Scholar] [CrossRef]
  44. Wakes, S.J.; Maegli, T.; Dickinson, K.J.; Hilton, M.J. Numerical Modelling of Wind Flow over a Complex Topography. Environ. Model. Softw. 2010, 25, 237–247. [Google Scholar] [CrossRef]
  45. Tabas, D.; Fang, J.; Porté-Agel, F. Wind Energy Prediction in Highly Complex Terrain by Computational Fluid Dynamics. Energies 2019, 12, 1311. [Google Scholar] [CrossRef] [Green Version]
  46. Temel, O.; Porchetta, S.; Bricteux, L.; Beeck, J.V. RANS Closures for Non-Neutral Microscale CFD Simulations Sustained with Inflow Conditions Acquired from Mesoscale Simulations. Appl. Math. Model. 2018, 53, 635–652. [Google Scholar] [CrossRef] [Green Version]
  47. García-Sánchez, C.; Gorlé, C. Uncertainty Quantification for Microscale CFD Simulation Based on Input from Mesoscale Codes. J. Wind Eng. Ind. Aerodyn. 2018, 176, 87–97. [Google Scholar] [CrossRef]
  48. Rezaeiha, A.; Montazeri, H.; Blocken, B. On the Accuracy of Turbulence Models for CFD Simulations of Vertical Axis Wind Turbines. Energy J. 2019, 180, 838–857. [Google Scholar] [CrossRef]
  49. Ploster, M.F. Comprehensive Comparison of Analytical Wind Turbine Wake Models with Wind Tunnel Measurements and Wake Model Application on Performance Modelling of a Downstream Turbine. Master’s Thesis, Energy and Environmental Engineering, Norwegian University of Science and Technology, Torgarden, Norway, July 2017. [Google Scholar]
  50. Salagaso, L.G. Experimental Analysis of Analytical Wake Models for Wind Turbines. Master’s Thesis, Energy Engineering, Aalborg University, Aalborg, Denmark, May 2017. [Google Scholar]
  51. Archer, C.L.; Vasel-Be-Hagh, A.; Yan, C.; Wu, S.; Pan, Y.; Brodie, J.F.; Maguire, A.E. Review and Evaluation of Wake Loss Models for Wind Energy Applications. Appl. Energy 2018, 226, 1187–1207. [Google Scholar] [CrossRef]
  52. Göçmen, T.; Laan, P.V.D.; Réthoré, P.E.; Diaz, A.P.; Larsen, G.C. Wind Turbine Wake Models Developed at the Technical University of Denmark: A Review. Renew. Sustain. Energy Rev. 2016, 60, 752–769. [Google Scholar] [CrossRef] [Green Version]
  53. Ishihara, T.; Qian, G.W. A New Gaussian-Based Analytical Wake Model for Wind Turbines Considering Ambient Turbulence Intensities and Thrust Coefficient Effects. J. Wind Eng. Ind. Aerodyn. 2018, 177, 275–292. [Google Scholar] [CrossRef]
  54. Rivas, R.A.; Clausen, J.; Hansen, K.S.; Jensen, L.E. Solving the Turbine Positioning Problem for Large Offshore Wind Farms by Simulated Annealing. Wind. Eng. 2009, 3, 287–297. [Google Scholar] [CrossRef]
  55. WindSim. Available online: http://windsim.com/services/optimized-wind-farm-design.aspx (accessed on 30 April 2020).
  56. Energy Regulatory Commission (ERC). Proclamation of the Energy Regulatory Commission on Determination of Spacing of Wind Power Plant Project and Capacities for Wind Energy Industry. Available online: http://www.erc.or.th (accessed on 10 December 2021).
  57. Lackner, M.A.; Rogers, A.L.; Manwell, J.F. Uncertainty Analysis in Wind Resource Assessment and Wind Energy Production Estimation. In Proceedings of the 45th AIAA Aerospace Sciences Meeting and Exhibit, Reno, NV, USA, 8–11 January 2007. [Google Scholar]
  58. Assasa, M.F. Wind Resource Assessment and Micro-Sitting: Uncertainty Analysis Approach. Master’s Thesis, The Graduate School of Natural and Applied Sciences Energy System Operation and Technology, The Republic of Turkey Bahçeşehir University, Istanbul, Turkey, 2016. [Google Scholar]
  59. Garrad Hassan and Partners Ltd. GH WindFarmer Theory Manual, 1st ed.; Garrad Hassan: Bristol, UK, 2009. [Google Scholar]
  60. Measuring Network of Wind Energy Institutes (MEASNET). Evaluation of Site-Specific Wind Conditions. 2016, p. 38. Available online: http://www.measnet.com/wp-content/uploads/2016/05/Measnet_SiteAssessment_V2.0.pdf (accessed on 27 March 2022).
  61. Thailand Greenhouse Gas Management Organization (Public Organization). Update Emission Factor CFP. Available online: http://thaicarbonlabel.tgo.or.th (accessed on 10 December 2021).
Figure 1. The study area along the coast of the Andaman Sea in Southern Thailand.
Energies 15 03025 g001
Figure 2. Topography map of the study area along the coast of the Andaman Sea.
Energies 15 03025 g002
Figure 3. Roughness heights of the study area along the coast of the Andaman Sea.
Energies 15 03025 g003
Figure 4. The climatic data points from the WRF model for the validation at various terrain characteristics.
Energies 15 03025 g004
Figure 5. Microscale wind resource map at 100 m agl for the western coast of Southern Thailand.
Energies 15 03025 g005
Figure 6. Microscale wind resource map at 120 m agl for the western coast of Southern Thailand.
Energies 15 03025 g006
Figure 7. Microscale wind resource map at 140 m agl for the western coast of Southern Thailand.
Energies 15 03025 g007
Figure 8. Scatter plot of the predicted and WRF mean annual wind speeds at 120 m agl for 15 representative locations within the study area.
Energies 15 03025 g008
Figure 9. Mean annual wind speeds at 120 m agl of the potential sites for wind power development.
Energies 15 03025 g009
Figure 10. Wind rose diagrams and Weibull probability density functions at 120 m agl for the potential sites for wind power development.
Energies 15 03025 g010
Figure 11. The 2D and 3D optimized WTG layouts of the wind power plants in the potential sites of development.
Energies 15 03025 g011
Figure 12. Estimated annual energy productions of 10-MW VSPP wind power plants at the potential sites of development.
Energies 15 03025 g012
Figure 13. Estimated capacity factors of 10-MW VSPP wind power plants at the potential sites of development.
Energies 15 03025 g013
Table 1. Details of the representative points at an elevation of 120 m agl used in the validation of the mesoscale and microscale wind resource maps.
No.Site.Flat TerrainSemi-Complex TerrainComplex Terrain
Longitude (°E)Latitude (°N)Longitude (°E)Latitude (°N)Longitude (°E)Latitude (°N)
1.Ranong98.5979.59898.4069.73298.5929.443
2.Phangnga98.2968.36198.419.13298.4988.615
3.Phuket98.3258.00798.3167.84098.3277.950
4.Krabi99.1918.32198.9238.53198.9378.274
5.Trang99.4947.70199.8087.20499.7977.526
Table 2. The mechanical characteristics of the wind turbine generators used in this analysis.
No.Wind Turbine
Generator Model
Hub
Height
(m)
Rotor
Diameter
(m)
Rated
Capacity
(MW)
Cut-in
Speed
(m/s)
Rated
Speed
(m/s)
Cut-Out Speed
(m/s)
1.GE 2.51201202.53.011.021.0
2.G1141251142.03.012.525.0
3.GW2.51201212.53.511.022.0
4.S111-M901201112.13.010.521.0
5.V110-2.01251102.03.010.520.0
Table 3. Energy losses and uncertainties to estimate the net annual energy productions.
List of LossesPercentage of Losses
Energy losses
  • Wake effect
Jensen/Larsen/Ishihara
  • Electrical transmission
3%
  • Availability
3%
  • Turbine performance
3%
  • Environmental Uncertainty
1%
  • Anemometer
2%
  • Topographic effect (complex terrain)
5%
  • Wind turbine power curve
5%
  • Wind shear modeling
3%
Table 4. The geographical coordinates of the potential sites for wind power plants and their mean annual wind speeds at elevations of 100 m, 120 m and 140 m agl.
No.Site NameCoordinatesMean Annual Wind Speed
Latitude (°N)Longitude (°E)100 m agl120 m agl140 m agl
1.Launnuea, Ranong9.95498.7814.654.754.91
2.Kamphuan, Ranong9.32698.5115.235.646.02
3.Thungkhangok, Phangnga8.58998.5105.175.716.24
4.Nakhao, Krabi8.27798.9404.684.935.16
5.Wangprachan, Satun6.753100.1944.785.125.22
Table 5. Details of the WTG, total installed capacities and maximum mean wind speeds for the five potential sites for wind power development.
Wind Turbine Generator ModelNo. of Wind Turbine GeneratorsNominal Power of
Turbine
Generator (MW)
Total Installed Capacity (MW)Maximum Mean Wind Speed (m/s)
Launnuea,
Ranong
Kamphuan,
Ranong
Thungkhangok, PhangngaNakhao, KrabiWangprachan, Satun
GE 2.542.5105.18.69.85.46.0
GW 2.542.5105.18.69.85.46.0
S111_M9042.18.45.18.69.85.46.0
G11452.0104.98.59.45.26.1
V11052.0104.98.59.45.26.1
Table 6. AEP and GHG emission avoidances for the five potential sites.
No.Site NameAEP
(GWh/Year)
GHG Emission Avoidance
(ktons CO2eq/y)
GE2.5GE2.5S111G114V110GE2.5GE2.5S111G114V110
1.Launnuea17.917.314.717.917.010.710.48.810.710.2
2.Kamphuan34.634.428.736.533.820.720.617.221.820.2
3.Thungkhangok35.635.029.535.434.421.321.017.721.220.6
4.Nakhao20.119.516.619.518.812.011.79.911.711.3
5.Wangprachan24.824.120.526.225.214.814.412.315.715.1
Total133130.3110135.5129.279.678.065.881.177.3
Publisher’s Note: MDPI stays neutral with regard to jurisdictional claims in published maps and institutional affiliations.

