Article

Household Ability of Expenditures on Electricity and Energy Resources in the Countries That Joined the EU after 2004

by
Krystyna Gomółka
1,* and
Piotr Kasprzak
2
1
Department of Eastern Studies, Faculty of Management and Economics, Gdańsk University of Technology, 80-233 Gdańsk, Poland
2
Department of Finance, Faculty of Management and Economics, Gdańsk University of Technology, 80-233 Gdańsk, Poland
*
Author to whom correspondence should be addressed.
Energies 2022, 15(9), 3052; https://doi.org/10.3390/en15093052
Submission received: 16 March 2022 / Revised: 11 April 2022 / Accepted: 15 April 2022 / Published: 21 April 2022

Abstract

:
The purpose of the following article is to present the situation of the energy market from a household perspective between 2010 and 2020 in selected EU countries (the group of member states which joined EU after 2004). The selected countries when joining the EU had similar economic indicators and to some extent were similar in other macro-economic situations (personal income, unemployment rate, GDP level and annual growth). This article analyzes the past and current situation of the household ability expenditure on electricity and energy resources (petrol—eurosuper 95 and diesel and natural gas), taking into account price, tax conditions and the real possibility to purchase the analyzed energy sources (based on annual net salaries). The paper includes the conclusions and prospects for the future. The main objective of the study is to determine the ability amount of expenditure on electricity, natural gas and liquid fuels by household in the countries that joined the European Union after 2004. The specific objectives of the work include: the evolution of retail prices of energy sources in those countries and prices of electricity, natural gas and liquid fuels—petrol and diesel oil—in the research period from 2010 to 2020. The element that influences the final price, as assessed in this paper, is the share of taxes and compulsory charges imposed by the EU countries covered in this study. The result of the study presented inter alia that energy consumption structure did not change significantly, electricity prices were steadily growing in the countries under assessment, the use of liquid fuels—petrol and diesel oil—in the countries under study, grew over the study period. Furthermore, prices of fuel fluctuated over the period from 2010 to 2020 and during the COVID-19 pandemic, which broke out in March 2020, but did not cause any significant changes in the prices of energy carriers in the analyzed period, apart from the declines in the prices of eurosuper 95 and diesel.

1. Introduction

The European Community, established on 1 January 1958 and based on the Treaties of Rome, has been joined by various European countries since its beginning. The first stage of expansion took place in 1973 and included Denmark, Ireland and Great Britain. During the second stage, in 1981, Greece joined the European Community, and during the third stage, in 1986, Spain and Portugal joined. As soon as the existing Member States signed the Treaty on European Union, more countries joined. Austria, Finland and Sweden joined in 1995. In the history of the EU, there have been six stages of expansion, the largest of which took place on 1 May 2004, when ten countries joined the EU: Cyprus, the Czech Republic, Estonia, Lithuania, Latvia, Malta, Poland, Slovakia, Slovenia and Hungary. In 2007, the number of EU members increased to 27—Romania and Bulgaria also joined the Community, and in 2013, Croatia joined [1]. The countries that joined the European Union after 2004 are characterized by a lower level of consumption than the other members of the Community [2,3,4,5]. As in the other countries, the households incur expenditure for electricity and energy resources. In the literature on the subject, there is no assessment of the ability amount of expenditure on electricity and energy resources in thirteen counties of the European Union. This paper fills that research gap.
The research of many papers focuses on renewable energy sources which, due to climate policy, have become a priority in the last decade [6,7,8,9,10,11]. Many authors have also mentioned energy security because some countries do not produce liquid fuels and have to export them [10,12]. Scientists and consumers are worried about the dynamically changing prices of electricity [13,14,15,16] and liquid fuels [17,18,19,20]. The above is particularly important for the new members of the European Union as the households have much lower incomes than those in the states that joined the European Union before 2004 [21,22,23,24].
The main objective of the study is to determine the ability amount of expenditure on electricity, natural gas and liquid fuels by the households in the countries that joined the European Union after 2004. A novelty of this paper is undertaking the topic concerning the actual possibilities of purchasing the analyzed energy goods by citizens of countries that joined the EU after 2004. There are no similar studies in the literature and worldwide research, hence the authors believe that this study will fill a significant research gap.
The specific objectives of the work include: the evolution of retail prices of energy sources in those countries: prices of electricity, natural gas and liquid fuels—petrol and diesel oil—in the research period from 2010 to 2020. The element that influences the final price, assessed in this paper, is the share of taxes and compulsory charges imposed by the EU countries covered in this study. The process of the so-called harmonization of indirect taxes (value-added tax and excise duty) imposed on, inter alia, energy sources and carriers (mineral oil, gas, electricity, energy from alternative sources and aviation fuel) has been ongoing in the EU for years [25,26,27,28,29,30,31]. The basic structure of excise duty on mineral oil in the Community was established in 1992 [32,33]. As in the case of alcohol and tobacco products and contrary to the original plans for total harmonization, only minimum rates have been set. Thus, taxation in individual countries varies as it depends on the VAT rates adopted in a given country and on the level of excise duty which, however, should not be lower than the minimum rate agreed to by all members of the European Union [34].
The quantitative consumption of energy in households is reflected in the expenditure on individual energy carriers. In the study of household budgets under the assessed ability expenditure category, spending money on electricity, natural gas and liquid fuels was taken into account. An additional element of the analysis was to consider the level of inflation as well as wages and salaries in the countries covered in the study, which made it possible to determine the level and direction of price formation and the real ability to purchase individual energy carriers by the inhabitants of the countries under assessment.

2. Materials and Methods

The study covered the thirteen countries that joined the European Union after 2004. The period of the analysis described the years from 2010 to 2020. The source of the collected information was a review of the literature on the subject and Eurostat data. Descriptive, tabular and graphical methods, constant dynamic indicators and coefficient of variation were used for the analysis and presentation of the results. In the first stage of the study, the share of final energy consumption in the housing sector by EU Member State and by the source of consumption between 2010 and 2020 was analyzed. In the second stage, electricity prices (kWh) for households, including taxes and charges in the period from 2010 to 2020 were presented, in euros, as well as the prices without taxes and extra fees. This way, the net electricity prices and the percentage share of the fees and taxes were determined. Natural gas is one of the most important energy sources used in households. As in the case of energy, in the third stage of the study, the net prices of gas were analyzed, as well as the prices including the taxes and charges.
In the European Union, electric cars are most frequently registered in Germany, Great Britain and France [35]. A much smaller number of electric cars was registered in the thirteen countries under study. The differences in electromobility in individual EU countries result from the underdeveloped charging structure and lower household income in the thirteen countries under assessment [36,37,38,39,40,41,42]. However, and above all, higher prices of electric cars compared to those of internal combustion engine cars, plus lower subsidies for their purchase than in Western European countries, are the reasons for the low rate of growth in the number of electric cars in the states under assessment [43,44]. The above means the use of combustion engine cars to a greater extent in the analyzed countries, and, consequently, increased use of liquid fuels in the last decade of the 21st century. In the fourth stage of the study, the prices of these liquid fuels were analyzed: eurosuper 95 petrol and diesel oil (two most common ones used by individuals in the researched European Union member states). The strong fluctuations in world oil prices during the period under review may have had a negative impact on the economies of the importers of oil. The above contributed to an increase in production costs, and, consequently, to the increase in inflation. The level of consumption in the assessed countries is influenced by the level of wages and salaries which, in the case of the thirteen countries, did not exceed the average remuneration in the European Union. The authors of the paper have analyzed the ability to purchase individual energy carriers, taking into account annual wages and salaries in those countries. Descriptive, tabular and graphical techniques were used to present the data.

3. Results

According to Eurostat (2010–2020), energy from different sources (electricity, natural gas, heat pumps, fuel oils, coal and derivatives and from renewable sources) is used by EU residents mainly for space heating (63.6% of the EU average, see Table 1). Lighting and household appliances account for 14.1% of final energy consumption in households, while the share of energy used to heat water (for sanitary purposes) is slightly higher—14.8%. Cooking appliances use 6.1% of the energy consumed by the households, while space cooling equipment and other appliances consume 0.4% and 0.97%, respectively. Individual values vary; for example, those related to space cooling are much higher in southern European and Mediterranean countries (especially Malta with 11.83% share in final energy consumption). Consequently, space and water heating accounts for 78.4% of the final energy consumed by the households.

3.1. Electricity

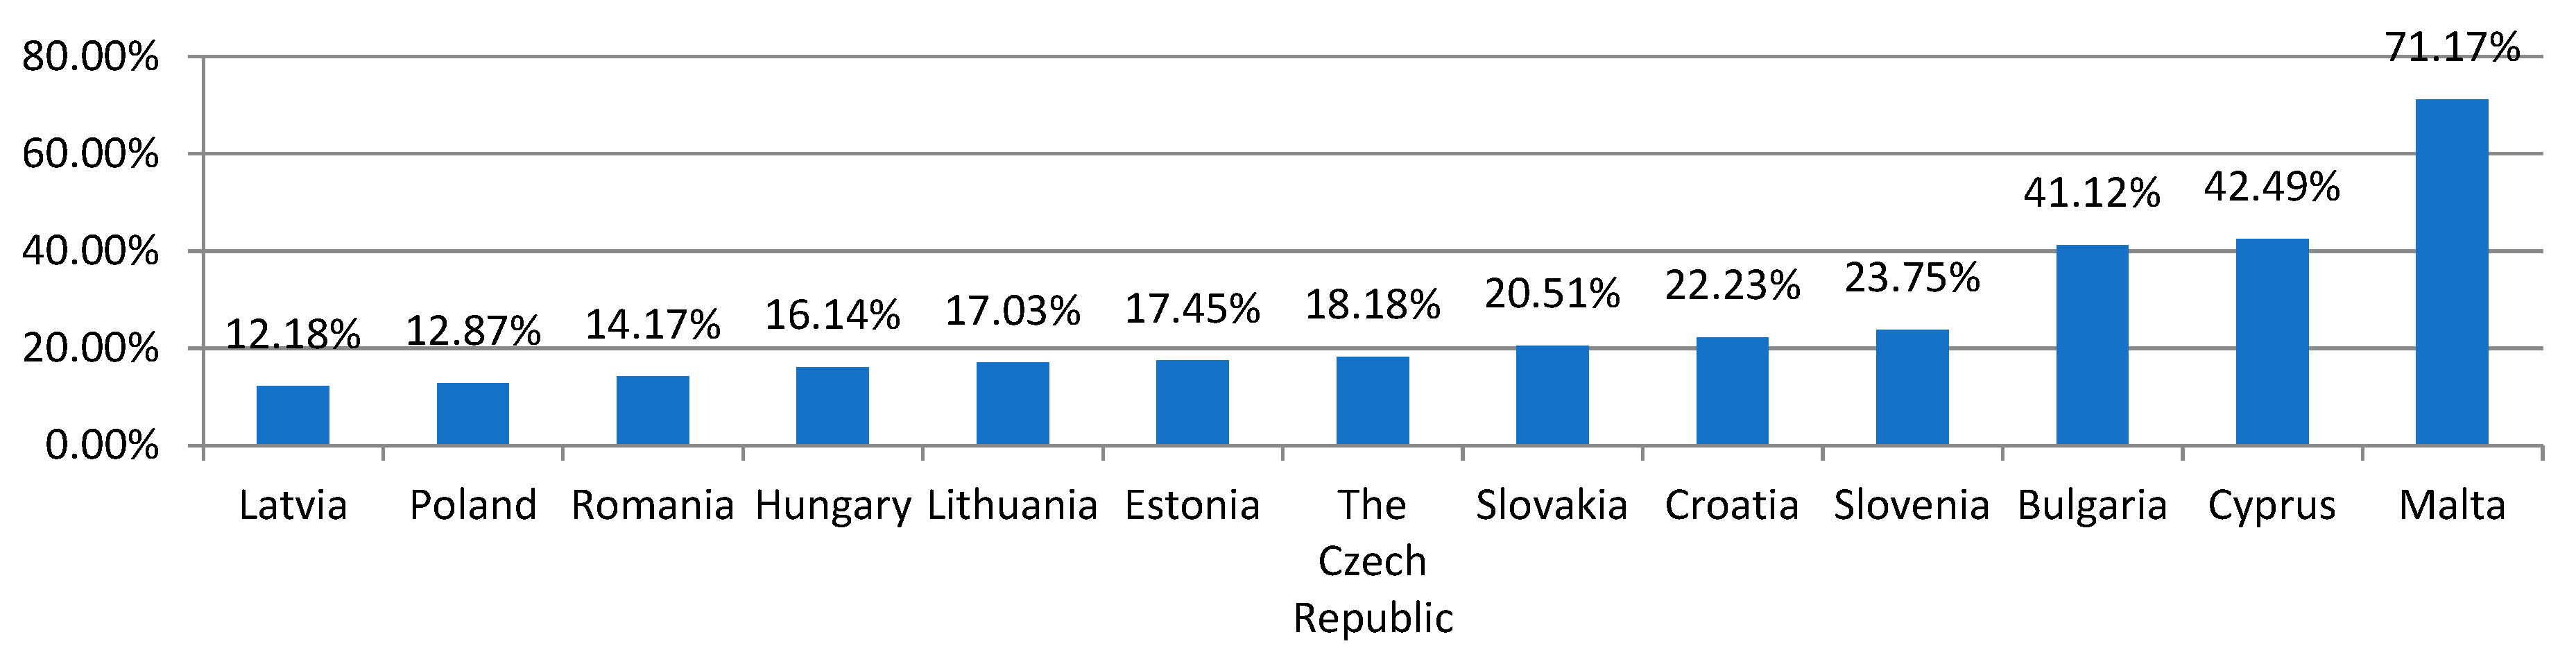
Electricity is one of the most important energy sources used by households in the European Union [45]. Eurostat (2010–2020) estimates that electricity accounted for an average of 24.7% share in energy sources across all EU countries. The greatest percentage share was recorded in Malta—71.17%, and the smallest in Latvia—12.18%. The average share of electricity in the total energy consumption between 2010 and 2020 by households among the countries under study, that is, those that joined the EU after 2004, is presented in Figure 1.
Depending on the country and, above all, the region, as well as the availability of collective energy sources (heat and power plants, municipal boiler houses or boiler rooms located in a specific housing estate or in a common space of a specific housing community), electricity is used for various purposes (heating or cooling households, power supply for the kitchen, lighting, other household appliances and audio/video devices) [47,48,49].
An important factor related to a household budget and ability expenditure on energy carriers is the purchase cost. Table 2 presents a summary of the costs of purchasing electricity by households in the period from 2010 to 2020 (two-year data presentation interval), taking into account taxes (VAT and excise duty) and other fees (including pro-environmental fees and charges introduced by individual EU countries) [50]. Based on the summary, the average purchase price of a kilowatt-hour in all EU countries has increased by EUR 0.05 over 10 years. In the assessed countries, the greatest increase was recorded in Latvia—EUR 0.08. In addition, a stable situation was noticed in Poland, Lithuania and Bulgaria (slight fluctuations in price), whereas the largest decrease in price was in Hungary (in the period from 2010 to 2020, the prices for a kilowatt-hour fell by EUR 0.07). In 2020, the lowest gross purchase price of electricity was recorded in Bulgaria and Hungary (EUR 0.10 per kWh), whereas the highest price was noticed in the Czech Republic (EUR 0.24 per kWh).
Apart from the costs of producing and transmitting electricity (the margins of the producer, seller and possible intermediary), the cost of purchasing electricity is affected by taxes and compulsory levies imposed by individual states [13]. It should be noted that energy carriers are subject to obligatory VAT and excise duty in the EU, and the tax rates (VAT and excise duty) in individual countries vary [52,53].
When analyzing the purchase prices of electricity excluding obligatory fiscal levies, it can be noticed that the average price of kWh in all EU countries was EUR 0.15 in 2020, compared to EUR 0.24 of the price, including taxes (see Table 3). At this point, it should be noted that in the EU countries, the share of taxes and fees in one kWh of the gross final price is 35.6%, on average. Having analyzed the net prices in the countries under study, in 2020, the lowest price was recorded in Hungary—EUR 0.0801, whereas the highest price was recorded in the Czech Republic—EUR 0.18. When analyzing the prices of electricity, we have not noted a significant change caused by the COVID-19 pandemic. Therefore, it did not have an impact on the final price of the electricity.
It should be noted that the greatest difference between the net purchase price of electricity and the gross price, and thus the share of taxes in the total price, was recorded in Slovenia and Poland (35%) in 2020, and the smallest difference was in Malta (5.7%) as presented in Table 4. Moreover, it should be noted that the taxation on electricity has increased over the past decade in all countries. The highest change was noted in Latvia, from 4.7% in 2010 to 31.7% in 2020. The average for the entire EU was 35.59% in 2020. The average share of tax in the gross price of electricity between 2010 and 2020 is presented in Figure 2.
According to the data presented in Figure 2, Malta had the lowest share of taxes in gross price of electricity throughout the period from 2010 to 2020, whereas the highest level was noticed in Slovenia—32.06%. However, all analyzed countries had lower levels of taxation than the average from all EU countries, which basically means that the level of imposed taxes is lower in the countries than joined EU after 2004 than in those which have been EU members for a longer period of time.

3.2. Natural Gas

Natural gas is one of the basic energy sources for households [54,55]. In all EU countries, it accounted for 32.1% share of all energy sources, on average. Therefore, it should be noted that natural gas is a more popular source of energy than electricity in the area under study, on average, since electricity accounts for 24.7% of the EU average. As in the case of electricity, the share of an energy carrier in the overall energy mix depends primarily on the geographical location. Moreover, not every country has the same level of reserves of natural gas or is able to import it (access to gas pipelines or infrastructure necessary to handle liquefied gas, e.g., in seaports). Two island countries, Cyprus and Malta, did not record gas consumption by households at all (thus they are not included in the assessment in this part of the article) [56]. Among the countries under study, the greatest share of consumption of natural gas was recorded in Slovakia—51.4%, whereas the lowest share, among the countries using that type of fuel, was noticed in Bulgaria—2.58%. The share of natural gas in the total energy consumption by households among the countries under study, that is, those that joined the EU after 2004, is presented in Figure 3.
During the period under review, there was a clear difference in gas prices between the countries. In 2010, the lowest prices of gas were recorded in Romania (approximately EUR 0.028 gross for the equivalent of 1 kWh), whereas the highest prices were recorded in Slovakia (EUR 0.097 gross for the equivalent of 1 kWh). During the same period of time, the EU average was EUR 0.095. In the analyzed period, that is, the period from 2020 to 2010, in the EU, there was an overall increase in price—from EUR 0.095 to EUR 0.105 (an increase of 10.48%). The prices fluctuated in the states under assessment. In six countries, the prices dropped: Estonia −6.62%, Bulgaria −11.38%, Slovenia −21.09%, Poland −21.58%, Lithuania −39.48% and Hungary −49.01%. In five countries, the prices of natural gas increased: Romania +16.42%, Croatia +25%, Slovakia +26.52%, the Czech Republic +33.87% and Latvia +47.36%.
Similar to electricity, the tables with differences between the net and gross price are presented (Table 5 and Table 6). As presented in all countries, the taxes on natural gas influence the final price for individual consumers. Unlike with electricity, the share of taxes in natural gas is lower.
The share of taxes varied widely across the countries, as presented in Table 7. We can observe that the lowest share of taxes in 2010 was noted in Latvia—9.2%, whereas the highest in Romania 47.86%. In 2020, the share of taxes in the gross price of natural gas was the lowest in Romania and the highest in Slovenia. It is worth noting that in case of Romania, the share of taxation has significantly decreased by 68%.
The average share of taxes in analyzed countries between 2010 and 2020 is presented in Figure 4. During that period, the highest level was noticed in Romania (37.81% on average) and the lowest in Slovakia (16.53%).
Based on Figure 4, we can come to the conclusion than in most analyzed countries, i.e., nine, the average share of taxes in the gross price of natural gas for households was lower than the total average for all EU member states. Only two countries (Slovenia and Romania) had a higher level of taxation than the EU average; however, as mentioned before, Romania had significantly decreased the value between 2010 and 2020.

3.3. Liquid Fuels (Petrol and Diesel Oil)

Liquid fuels such as petrol and diesel are among the significant expenses incurred by households. It should be noted that in the majority of the EU countries, the price of fuel depends mainly on the price of the basic raw material, which is crude oil, and taxes which, in most cases, account for over 50% of the final gross price. It should also be noted that as long as the number of electric cars does not increase, the price of petrol and diesel oil (in some countries, also alternative fuels such as LPG and more and more popular CNG) will be the main element of the transport expenditure catalogue (see Table 8.). Although the number of electric vehicles continues to grow, the global share of the sale of electric vehicles versus the total sale of new vehicles was only 4.61% in 2020 [57,58]. When it comes to analyzed countries, the number of newly registered electric vehicles did not achieve a significant number. The volume of the newly registered cars in selected countries (not all data is available) is presented in Figure 5.
Hence, taking into account the fact that petrol and diesel oil will remain the main source of power supply for passenger vehicles in the coming years, it is necessary to analyze the price formation in the selected EU countries.
When analyzing the changes in price over the decade, it should be noted that, in 2010, the lowest price of petrol was recorded in Bulgaria—EUR 1.01 per liter, whereas the commodity was the most expensive in the Czech Republic—EUR 1.25 per liter (see Figure 6). It should be noted that the price of petrol has fluctuated over the 10-year period. There was a general rise in price until 2012; then, the prices fell before rising again. A clear reduction in the price of petrol can be noticed by comparing the years 2019 and 2020. During that period, due to the outbreak of the COVID-19 pandemic, most EU countries introduced numerous sanitary restrictions, which consequently led to a reduction in economic activity and to a significant reduction in demand for liquid fuels (in 2020, record low oil prices were also seen in world markets).
Table 9 presents the share of taxation in eurosuper 95. As we can see, the level of taxation in petrol is generally much higher than in electricity and natural gas. It is mainly caused by the fact that petrol, including diesel, is generally imposed with the highest possible VAT rate, as well as the fact that higher excise tax may be included. The detailed data is presented below.
When analyzing the share of taxes in the final price of petrol, we can see that, generally, it increases year by year (see Table 9 and Figure 7). In 2010, the lowest number was in Cyprus, with a 44.99% tax share, whereas the highest was in Slovakia—56.59%. When it comes to 2020, the lowest tax share in the gross price was in Hungary—54.53%, and the highest in Slovenia—64.66%. The share of taxes in the final price is much higher than that of the price of electricity or natural gas.
When it comes the period from 2010 to 2020, the following changes in the prices of petrol over the 10 years can be noticed (see Figure 8). As we can see, four countries recorded an increase in petrol prices, whereas nine recorded a decrease. It was caused mainly by the COVID-19 pandemic, as the demand for petrol decreased dramatically in the first two quarters of 2020.
The other popular fuel in EU is diesel. Diesel prices are generally comparable to eurosuper 95. The possible difference in price between countries may be caused by the individual demand and supply (some EU countries are becoming stricter when it comes to diesel fuel and do not allow some vehicles to operate in city centers) as well as the various approaches towards taxation (Figure 9).
Considering diesel prices, as in the case of petrol, a change in price over the years can be observed, in similar periods. In 2010, the cheapest diesel oil was recorded in Bulgaria— EUR 0.98 per liter, and the most expensive in the Czech Republic—EUR 1.23 per liter. However, in 2020, the lowest price was in Bulgaria— EUR 0.92 per liter, whereas the highest was in Malta—EUR 1.24 per liter.
When analyzing the share of taxes in both petrol and diesel, we can note that the share is much higher than that of electricity or natural gas (Figure 10 and Table 10). In terms of diesel, the highest share of taxes in 2010 was in Czech Republic—50.42%, whereas the lowest was in Cyprus— 41.52%. In 2020, the highest taxation was in Slovenia—62.35%, whereas the lowest was in Poland—50.68%.
Over the period from 2010 to 2020, the average share of taxation in the gross price of diesel was the highest in Slovenia, exceeding 55%, whereas the lowest was in Bulgaria—almost 47%. It had impact on the final price of diesel petrol in Bulgaria, as it remained the cheapest in that country; however, Slovenia, despite having the highest taxation, was not noted as the highest price, on average (see Figure 11).
The below shows the following price changes, taking place from 2010 to 2020, as the years of comparison. As noted in the most analyzed countries, the average price between 2010 and 2020 decreased. The most significant decrease was noted in the Czech Republic. Only two countries noted the price increase, i.e., Cyprus and Malta. This is caused mainly by the lockdowns introduced to almost all European countries and the lowering demand for both petrol and diesel in 2020 (see Figure 12).

3.4. Salaries and Wages

An important factor that influences the level of consumption is the level of wages and salaries of the residents. In the countries that joined the EU after 2004, the level of wages and salaries was significantly lower than those of the states that joined the European Union earlier (see Figure 13) [61,62,63]. Moreover, none of the analyzed countries reached the EU average; therefore, all of those countries are lower than the EU’s average level of wages and salaries. It should be noted that the highest wages and salaries, among the countries under assessment, were recorded in Malta (slightly over EUR 50,000 per year), whereas the lowest were in Bulgaria (EUR 18,000 per year, on average). The average annual remuneration for all EU countries was EUR 70,000, in 2020. In all the countries, average wages and salaries increased over the period from 2010 to 2020.
Considering the issues that are the subject of this study, it is important to determine the potential level and ability to purchase energy and its carriers by households. For that purpose, to conduct the analysis, the level of net wages and salaries should be taken into account. It should be noted that the difference between the gross and net amount results, to a large extent, from so-called labor costs.
Labor costs are the expenses incurred by an economic unit related to recruiting an employee. In the literature on the subject, the costs are often referred to as employer’s costs or employment costs, and are often considered to be one of the factors that make up the price of an offered product or service (see Figure 14). Thus, labor costs are defined as the value of labor used to provide services or to manufacture certain goods.
Taking into consideration the so-called labor components, they can be divided into wage components, that is, the expenses directly related to the remuneration of an employee, and non-wage components. For the purpose of international comparisons, Eurostat narrows down labor costs by including wage and salary costs into wage components, and employers’ social security contributions are considered to be non-wage components (Eurostat, 2010–2020) presented in Figure 15.
Across the EU, the share of taxes and compulsory contributions in gross remuneration was nearly 27%, on average. The lowest ratio was recorded in Cyprus—8.05% and the greatest in Romania—over 32%.

3.5. Inflation

The last factor under assessment that influences the level of consumption is the overall changes in price, as measured by inflation. That indicator varied widely across the analyzed countries during the period under review. In some of the countries (Bulgaria, Estonia, Croatia, Cyprus, Latvia, Lithuania, Poland, Romania, Slovenia and Slovakia), medium-term (up to 3 years) deflation was also recorded (see Figure 16).
The strong fluctuations in crude oil prices in the world markets, recorded in the second decade of the 21st century, may have serious negative consequences for the functioning of the economies of the countries that import significant amounts of that commodity. The impact of oil and fuel prices on inflation takes place through several channels. First, the prices of refinery products, as a group of goods in the consumption basket, are directly taken into account in the construction of the consumer price index. Second, crude oil and its derivatives are used in production processes in many industries and in transport. Therefore, an increase in their price contributes to an increase in production costs, which tends to increase inflation.
While analyzing the levels of inflation in individual countries, it is important to bear in mind that it is an imperfect measure, as it has to be compared with real purchasing power. Thus, in the next part of the study, that is, in Conclusions, indicators will be presented that describe the real purchasing power of residents of individual countries. We can observe that in the last 3–4 years of the analyzed period, the inflation rate has gradually grown.
When analyzing prices in nominal terms, it should not be forgotten that, given the changes in wages and salaries as well as inflation, such a study would, in principle, be flawed. It should be noted that the prices of individual goods and services may change; however, when earnings change, the increase or decrease in nominal terms may not be that significant.

3.6. Household Expenditure

For the comprehensive analysis of the prices of energy carriers (electricity, gas and liquid fuels) and earnings and inflation, the authors of the study presented a summary of the ability to purchase individual energy carriers for an average annual salary, and a comparison of the years between 2010 and 2020. The data in Table 11 shows the real purchase ability with regards to energy carriers, taking into account the change in nominal prices (gross values) and the average annual net remuneration.
In the case of electricity, the largest increase in the ability to purchase that commodity for the average net remuneration was recorded in Hungary (+153.87%). In Slovenia, the buying power decreased by 2.36%. Having analyzed the absolute values, in 2010, the greatest amount of electricity could be purchased by the inhabitants of Cyprus (179,000 kWh), and the smallest amount by the residents of Romania (75,000 kWh). In 2020, the greatest amount of electricity could be purchased by the residents of Malta (272,000 kWh, an increase of 78.23% compared to 2010), whereas the smallest amount could be purchased by the residents of the Czech Republic (107,000 kWh, an increase of 16.44% compared to 2010).
With regards to natural gas, the greatest increase in the buying power was recorded in Lithuania (+ 253.6%), whereas in the Czech Republic, the purchase ability declined by 0.3%. In absolute terms, in 2010, the inhabitants of Slovenia were able to buy the largest amount of gas (330,000 kWh equivalent), whereas the smallest amount could be bought by the residents of Lithuania (154,000 for the equivalent of kWh). In 2020, the greatest amount of natural gas could be purchased by the residents of Hungary (689,000 for the equivalent of kWh, an increase of 204.8% compared to 2010), whereas the smallest amount could be purchased by the residents of Slovakia (174,000 for the equivalent of kWh, an increase of 2.9% compared to 2010). With regards to gas, the situation in Cyprus and Malta was not taken into account for the analysis, as the households did not use that raw material.
When it comes to the prices of liquid fuels, the increase in real purchase power is not as large as in the case of electricity and gas. The maximum increase was recorded for petrol—146% and for diesel oil—136%.
Having compared the ability to purchase petrol in relative values in the years 2010 and 2020, the largest increase was recorded in Romania (+146%), whereas the smallest was in Malta (+21%). Taking absolute values into account, in 2010, the residents of Bulgaria were able to purchase the smallest amount of petrol (6709 L), whereas the inhabitants of Cyprus, the largest amount (29,912 L). In 2020, the residents of Bulgaria were still able to buy the smallest amount of petrol (13,759 L, an increase of 105%), whereas the inhabitants of Cyprus were still able to purchase the largest amount of that commodity (39,396 L, an increase of 32%).
With regards to diesel oil, the greatest increase in purchase power was recorded in Romania (+136%), whereas the smallest was in Malta (+17%). In 2010, the residents of Bulgaria were able to buy the smallest amount of diesel oil (6.987 L), whereas the largest amount of that commodity could be purchased by the residents of Cyprus (38,189 L). In 2020, the inhabitants of Bulgaria were still able to buy the smallest amount of diesel oil (13,897 L, increase by 99%), whereas the residents of Cyprus were still able to purchase the largest amount of that commodity (38,189 L, increase by 29%).

4. Discussion

The authors proved that electricity prices in the countries that joined the European Union after 1 May 2004 grew in the analyzed period. In these countries, renewable sources of energy (RSE) were used to a smaller extent than in Western European countries, and energy prices were characterized by lower volatility [50,66,67,68,69,70]. The basic raw materials used to generate electricity in thirteen countries were coal, oil and gas, exported mainly from the Russian Federation [71]. Although the article does not discuss energy sources, the authors notice a growing need for a debate and research on this topic. This subject has been discussed in numerous studies, in which a detailed attempt was made to analyze energy sources and the importance of renewable sources (solar, hydro and wind energy) [72] and the methods of distribution [73].
Raw materials on world markets fluctuated over the considered period and had a direct impact on net prices. The price of energy is also influenced by the demand and its supply in a given country [74,75]. The import of non-renewable resources affects the energy security of the studied countries [76]. The most important threats to energy security are: the possibility of interrupting energy supplies from abroad, or damaging the production and transmission infrastructure, threats of cyber-terrorist attacks and the exhaustion of energy resources and consumption of energy infrastructure.
Differences in energy prices between the thirteen surveyed countries result from the way they are determined and the amount of taxes and charges set by the governments of these individual countries, and so they differ in environmental costs, taxes and compulsory fees.
During the analyzed period, gas was one of the basic sources of energy for households in the thirteen surveyed countries, except in Cyprus and Malta; their prices and taxes, as well as compulsory charges, were clearly differentiated and fluctuated periodically.
Due to the low number of electric cars in these countries, diesel and gasoline were a major part of household spending from 2010 to 2020 [35,77,78,79]. During the COVID-19 pandemic, most countries introduced sanitary regimes (lockdowns), which reduced the demand for gasoline and diesel fuel. Compulsory fees and taxes shaped the final fuel prices in individual countries.
The amount of electricity, natural gas, gasoline and diesel in the thirteen researched countries may have contributed to the reduction in demand. The authors’ findings present that electricity in thirteen countries from 2010 to 2020 was mainly used for space and water heating, and its much smaller purchases led to energy poverty [50]. According to the European Energy Poverty Observatory, the main indicators of poverty are: low absolute energy consumption and the inability to maintain an adequate temperature in the home [80,81,82]. This phenomenon is largely due to lower household incomes in the thirteen countries compared to Western European countries. Energy poverty has a number of negative health consequences, due to low temperatures and the stress of being unable to pay energy bills [83,84]. Energy poverty directly affects the environment and labor productivity [85,86]. Solving this problem has many benefits, including reduced government spending on health, less pollution and CO2 emissions, greater comfort and well-being and improved household budgets.
Moreover, the use of non-renewable resources for the production of electricity in the studied countries contributes to the increase in air pollution and CO2 emissions, the reduction of which is required by the European Union [83,87]. Some of the analyzed countries will therefore face the problem of the dynamic development of RES in the current decade of the 21st century, especially as they do not have any major gas and crude oil sources [88]. Rising prices of non-renewable resources force countries to invest in new technologies and renewable energy sources. This process is likely to be accelerated by the outbreak of the war in February 2022 in Ukraine and the resignation from the purchase of non-renewable resources in Russia by some of the studied countries. Changes taking place in the markets of these countries may have a serious impact on the periodic increase in the price of energy and gas, crude oil and gasoline, as well as electricity, and contribute to the increase in energy poverty in the near future.

5. Conclusions

  • During the analyzed period, the energy consumption structure did not change significantly.
  • Electricity prices were steadily growing in the countries under assessment. Over the 10 years, the average purchase price of a kilowatt-hour, inclusive of taxes and levies, increased by EUR 0.05. The greatest increase in price was recorded in Latvia, whereas the price of 1 kilowatt-hour fell by EUR 0.07 in Hungary. The country also recorded the lowest net price of 1 kilowatt-hour in 2020. The greatest net price was recorded in the Czech Republic. In the EU countries, the share of taxes and charges was approximately 35.6% of the price. The taxes and fees were shaped by the governments of individual countries. The greatest percentage tax was imposed in Slovenia—35.5% of the final electricity price, whereas the lowest was in Malta—5.7%.
  • Gas was used in the majority of households in the countries under study. Only Cyprus and Malta did not use that source of energy. The greatest number of households that used gas was in Slovakia and the lowest number was in Bulgaria. During the period under review, there was a fluctuation in gas prices across the analyzed countries. The highest gas prices, including taxes and fees, were recorded in Slovakia—EUR 0.09.7 per kWh, whereas the lowest price was recorded in Romania—EUR 0.02.8 The greatest share of taxes and levies in the price of liquid fuels was recorded in Slovenia in 2020, whereas the lowest share was recorded in Romania.
  • The use of liquid fuels—petrol and diesel oil—in the countries under study, grew over the study period, and prices of fuel fluctuated over the period from 2010 to 2020. In 2010, the lowest price of petrol was recorded in Bulgaria and the greatest was in the Czech Republic. In 2020, diesel oil prices followed a similar pattern. The lowest price of diesel fuel was recorded in Bulgaria (EUR 0.92 per liter), whereas the highest was in Malta (EUR 1.24 per liter). The greatest increase in the price of diesel oil was recorded in Malta and the highest decrease was in the Czech Republic. When it comes to diesel, the greatest increase of price similarly was recorded in Malta and the highest decrease was in the Czech Republic.
  • In the countries under study, wages and salaries increased over the period from 2010 to 2020. However, annual household income was significantly lower than in the other states of the European Union. Inflation was a factor that influenced the level of consumption. Its rate varied in the countries under assessment. With regards to the ability to purchase certain raw materials in 2020, it should be noted that the greatest increase in the ability to buy electricity was recorded in Hungary (+153.87%), whereas the lowest was in Slovenia (+2.36%). In the case of natural gas, the largest increase in purchase power was in Lithuania (+253.6%). The most unfavorable situation was in the Czech Republic, where there was a decline in the purchase ability by 0.3%. With regards to petrol, the greatest increase in the purchase ability was in Romania, —146%, whereas the smallest was in Malta—+21%. Similarly, in the case of diesel oil, the greatest increase was recorded in Romania (+136%) and the smallest in Malta (+17%).
  • The COVID-19 pandemic, which broke out in March 2020, did not cause any significant changes in the prices of energy carriers in the analyzed period, apart from the declines in the prices of eurosuper 95 and diesel. It was not until 2021, which was not analyzed, that we noted significant changes in the price of raw materials and final energy prices. In addition, at the end of 2020, due to the COVID-19 pandemic, there were no significant changes in the tax policy with regard to energy resources. The highest taxation occurred in eurosuper 95 and diesel fuels—about 50% of the final price, whereas the lowest occurred in natural gas prices—around 20%.

Author Contributions

Conceptualization, K.G. and P.K.; methodology, K.G.; software, P.K.; validation, K.G. and P.K.; formal analysis, P.K.; investigation, K.G. and P.K.; resources, K.G. and P.K.; data curation, P.K.; writing—original draft preparation, K.G. and P.K.; writing—review and editing, K.G. and P.K.; supervision, K.G.; project administration, K.G.; funding acquisition, K.G. All authors have read and agreed to the published version of the manuscript.

Funding

This research received no external funding.

Informed Consent Statement

Not applicable.

Data Availability Statement

Not applicable.

Conflicts of Interest

The authors declare no conflict of interest.

References

  1. Małuszyńska, E.; Gruchman, B. Kompendium Wiedzy o Unii Europejskiej; PWN: Warsaw, Poland, 2018. [Google Scholar]
  2. European Economy, European Commission; Directorate-General for Economic and Financial Affairs: Brussels, Belgium, 2004.
  3. Compos, N.; Cricelli, F.; Moretti, L. Institutional Integration and economics growth in Europe. J. Monet. Econ. 2019, 103, 88–104. [Google Scholar] [CrossRef]
  4. Belka, M. How Poland’s EU Membership Helped Transform its Economy; 30 Occasional Paper 83; Group of Thirty: Washington, DC, USA, 2013. [Google Scholar]
  5. Grabowska, I. The 2004 EU Enlargement as an Outcome of Public Policies: The Impact of Intra-EU Mobility on Central and Eastern European Sending Countries, Soc. Policy Soc. 2021, 20, 175–191. [Google Scholar] [CrossRef]
  6. Owusu, P.A.; Asumadu-Sarkodie, S. A review of renewable energy sources, sustainability issues and climate change mitigation. Cogent Eng. 2016, 3, 1167990. [Google Scholar] [CrossRef]
  7. Liang, X. Emerging power quality challenges due to integration of renewable energy sources. IEEE Trans. Ind. Appl. 2017, 53, 855–866. [Google Scholar] [CrossRef]
  8. Rokicki, T.; Perkowska, A. Changes in Energy Supplies in the Countries of the Visegrad Group. Sustainability 2020, 12, 7916. [Google Scholar] [CrossRef]
  9. Rokicki, T.; Perkowska, A. Diversity and Changes in the Energy Balance in EU Countries. Energies 2021, 14, 1098. [Google Scholar] [CrossRef]
  10. Rokicki, T.; Koszela, G.; Ochnio, L.; Wojtczuk, K.; Ratajczak, M.; Szczepaniuk, H.; Michalski, K.; Borawski, P.; Bełdycka-Borawska, A. Diversity and Changes in Energy Consumption by Transport in EU Countries. Energies 2021, 14, 5414. [Google Scholar] [CrossRef]
  11. Van den Bergh, K.; Delarue, E.; D’haeseleer, W. Impact of renewables deployment on the CO2 price and the CO2 emissions in the European electricity sector. Energy Policy 2013, 63, 1021–1031. [Google Scholar] [CrossRef] [Green Version]
  12. Cox, E. Assessing long-term energy security: The case of electricity in the United Kingdom. Renew. Sustain. Energy Rev. 2017, 82, 2287–2299. [Google Scholar] [CrossRef]
  13. Lucia, J.J.; Schwartz, E.S. Electricity Prices and Power Derivatives: Evidence from the Nordic Power Exchange. Rev. Deliv. Res. 2002, 5, 5–50. [Google Scholar]
  14. Huisman, R.; Mahieu, R. Regime jumps in electricity prices. Energy Econ. 2003, 25, 425–434. [Google Scholar] [CrossRef] [Green Version]
  15. Raviv, E.; Bouwman, K.E.; Van Dijk, D. Forecasting day-ahead electricity prices: Utilizing hourly prices. Energy Econ. 2015, 50, 227–239. [Google Scholar] [CrossRef] [Green Version]
  16. Maekawa, J.; Hai, B.H.; Shinkuma, S.; Shimada, K. The Effect of Renewable Energy Generation on the Electric Power Spot Price of the Japan Electric Power Exchange. Energies 2018, 11, 2215. [Google Scholar] [CrossRef] [Green Version]
  17. Covern, M.; Heald, S.; Pirie, J. Oil Dependency in the EU; Cambridge Econometrics: Cambridge, UK, 2020; Available online: https://www.transportenvironment.org/wpcontent/uploads/2021/07/2020_CE_Oil_Dependency_in_EU_report.pdf (accessed on 10 April 2022).
  18. Miller, R.G.; Sorrell, S.R. The future oil supply. Philos. Trans. A Math. Phys. Eng Sci. 2014, 372, 20130179. [Google Scholar] [CrossRef] [PubMed] [Green Version]
  19. Arezki, R.; Jakab, Z.; Laxton, D.; Matsumoto, A.; Nurbekyan, A.; Wang, H.; Yao, J. Oil Prices and the Global Economy. IMF Work. Pap. 2017, 17, 1. [Google Scholar] [CrossRef]
  20. Kanai, M. Decoupling the Oil and Gad Prices. In Natural Pricing in the Post-Financial Crisis Market; Federal Reserve Bank of Dallas: Brussels, Belgium, 2011; Available online: https://www.ifri.org/sites/default/files/atoms/files/noteenergiemiharukanai.pdf (accessed on 10 April 2022).
  21. Wages Determinants in the European Union Updated Results from Structure of Earnings Survey (SES 2018) DATA 2021 Edition. Available online: https://ec.europa.eu/eurostat/documents/7870049/12810163/KS-FT-21-004-EN-N.pdf/178c1845-cf78-60fe-495e-59c4c1d72f32?t=1621928655427 (accessed on 10 April 2022).
  22. Afonso, O.; Albuquerque, A.L.; Almeida, A. Wage inequality determinants in European Union countries. Appl. Econ. Lett. 2013, 20, 1170–1173. [Google Scholar] [CrossRef]
  23. Barnes Atkinson, A.; Malier, E. Income and Living Condicions in Europe; Eurostat: Luxembourg, 2010; Available online: https://ec.europa.eu/eurostat/documents/3217494/5722557/KS-31-10-555-EN.PDF (accessed on 10 April 2022).
  24. Galgóczi, B. Why Central and Eastern Europe Needs a Pay Rise. Available online: https://www.etui.org/sites/default/files/WP%202017-01-pay%20rise-HD-web%20version%20finale.pdf (accessed on 10 April 2022).
  25. Directive 96/92/EC of the European Parliament and of the Council of 19 December 1996 concerning common rules for the internal market in electricity. Off. J. Eur. Communities 1996, L27, 20–29.
  26. European Union. Directive 2003/54/EC of the European Parliament and of the Council of 26 June 2003 concerning common rules for the internal market in electricity and repealing Directive 96/92/EC. Off. J. Eur. Union. 2003, L176, 37–55. [Google Scholar]
  27. European Union. Directive of 2009/72/EC of the European Parliament and of the Council of 13 July 2009 concerning common rules for the internal market in electricity and repealing Directive 2003/54/EC. Off. J. Eur. Union. 2009, 211, 55–93. [Google Scholar]
  28. European Commission. Energy 2020. A Strategy for Competitive, Sustainable and Secure Energy; The Publications Office of the European Union: Brussels, Belgium, 2010. [Google Scholar]
  29. European Commission. Energy Roadmap 2050; Publications Office of the European Union: Luxembourg, Luxembourg, 2012. [Google Scholar]
  30. European Commission. Energy Union Package; The Publications Office of the European Union: Brussels, Belgium, 2011. [Google Scholar]
  31. European Commission. A Framework Strategy for a Resilient Energy Union with a Forward Looking Climate Change Policy; The Publications Office of the European Union: Brussels, Belgium, 2015. [Google Scholar]
  32. Council Directive 92/81/EEC of 19 October 1992 on the harmonization of the structures of excise duties on mineral oils. OJL 1992, 316, 12–15.
  33. Kopits, G. Tax harmonization in the European Community; Policy Issues and Analysis; International Monetary Fund: DC, USA, 1992; ISBN 9781557752253. [Google Scholar]
  34. Hoeller, P.; Louppe, M.; Vergriete, P. Fiscal Relations within the European Union; OECD Economics Department Working Papers, No. 163; OECD Publishing: Paris, France, 1996. [Google Scholar] [CrossRef]
  35. Rokicki, T.; Borawski, P.; Bełdycka-Borawska, A.; Żak, A.; Koszela, G. Development of Electromoblity in Eurorpean Union under COVID-19 Condictions. Energies 2022, 15, 9. [Google Scholar] [CrossRef]
  36. Drożdż, W.; Starzyński, P. Economic conditions for the development of electromobility in Poland compared to selected countries. Eur. J. Serv. Manag. 2018, 28, 133–140. [Google Scholar] [CrossRef]
  37. Ramsey, M. Ford Reveals How Much Electric-Car Batteries Cost. Wall Str. J. 2012, 1–27. Available online: http://blogs.wsj.com/drivers-seat/2012/04/17/ford-reveals-how-much-electric-car-batteries-cost (accessed on 10 July 2021).
  38. Dano, F.; Rehák, R. Electromobility in the European Union and in the Slovakia and its Development Oportunies. Int. J. Multiciscplinary Bus. Sci. 2018, 4, 74–83. Available online: https://hrcak.srce.hr/file/302226 (accessed on 10 July 2021).
  39. Połom, M.; Wiśniewski, P. Implementing Electromobility in Public Transport in Poland in 1990–2020. A Review of Experiences and Evaluation of the Current Development Directions. Sustainability 2021, 13, 4009. [Google Scholar] [CrossRef]
  40. Castelli, M.; Beretta, J. Development of electromobility in France: Causes, facts and figures. Electr. World Veh. J. 2016, 8, 772–782. [Google Scholar] [CrossRef] [Green Version]
  41. Andrae, A.S.G.; Edler, T. On Global Electricity Usage of Communication Technology: Trends to 2030. Challenges 2015, 6, 117–157. [Google Scholar] [CrossRef] [Green Version]
  42. Feckova Skrabulakova, E.; Ivanova, M.; Rosova, A.; Gresova, E.; Sofranko, M.; Ferencz, V. On Electromobility Development and the Calculation of the Infrastructural Country Electromobility Coefficient. Processes 2021, 9, 222. [Google Scholar] [CrossRef]
  43. Sierzchula, W.; Bakker, S.; Maat, K.; Van Wee, B. The influence of financial incentives and other socio-economic factors on electric vehicle adoption. Energy Policy. 2014, 68, 183–194. [Google Scholar] [CrossRef]
  44. Łuszczyk, M.; Sulich, A.; Siuta-Tokarska, B.; Zema, T.; Thier, A. The Development of Electromobility in the European Union: Evidence from Poland and Cross-Country Comparisons. Energies 2021, 14, 8247. [Google Scholar] [CrossRef]
  45. Pelau, C.; Acatrinei, C. The Paradox of Energy Consumption Decrease in the Transition Period towards a Digital Society. Energies 2019, 12, 1428. [Google Scholar] [CrossRef] [Green Version]
  46. European Comission. Energy Prices and Costs in Europe. Available online: https://ec.europa.eu/energy/sites/default/files/documents/swd2020_951_-_1_en_autre_document_travail_service_part3_v1.pdf (accessed on 22 February 2022).
  47. Tsemekidi Trzeiranak, S.; Bertoldi, P.; Paci, D.; Castellazzi, L.; Ribeiro Serrenho, T.; Economidou, M.; Zangheri, P. Energy Consumption and Energy Efficiency Trends in EU-28, 2000–2018; JRC JRC120681; Publications Office of the European Union: Luxembourg, Luxembourg, 2020. [Google Scholar] [CrossRef]
  48. European Commissio. Clean Energy for All Europeans. Communication from the Commission to the European Parliament, the Council, the European Economic and Social Committee, the Committee of the Regions and the European Investment Bank; Publications Office of the European Union: Brussels, Belgium, 2016. [Google Scholar]
  49. Hortaçsu, A.; Madanizadeh, S.A.; Puller, S.L. Power to choose? An analysis of consumer inertia in the residential electricity market. Am. Econ. J. Econ. Policy 2017, 9, 192–226. [Google Scholar] [CrossRef] [Green Version]
  50. Rokicki, T.; Borawski, P.; Gradziuk, B.; Gradziuk, P.; Mrówczyńska-Kamińska, A.; Kozak, J.; Guzal-Dec, D.J.; Wojtczuk, K. Differentiation and Changes of Household Electricity Prices in EU Countries. Energies 2021, 14, 6894. [Google Scholar] [CrossRef]
  51. Eurostat. Electricity Prices for Household Consumers—Bi-Annual Data (from 2007 Onwards). Available online: https://ec.europa.eu/eurostat/databrowser/view/NRG_PC_204/default/table?lang=en (accessed on 22 February 2022).
  52. Verbič, M.; Filipovič, S.; Radovanovič, M. Electricity prices and energy intensity in Europe. Util. Policy 2017, 47, 58–68. [Google Scholar] [CrossRef]
  53. Price, C.W.W.; Zhu, M. Non-discrimination clauses: Their effect on British retail energy prices. Energy J. 2016, 37, 111–132. [Google Scholar]
  54. Lebelhuber, C.; Steinmuller, H. How and the which extent can the gas sector contribute to a climate-neutral European energy system? A qualitative approach. Energy Sustain. Society 2019, 9, 23. [Google Scholar] [CrossRef]
  55. Cătuţi, M.; Egenhofer, C.; Elkerbout, M. The Future of Gas in Europe: Review of Recent Studies on the Future of Gas. Research Report 03/2019. 2019. Available online: https://www.ceps.eu/wp-content/uploads/2019/08/RR2019-03_Future-of-gas-in-Europe.pdf (accessed on 22 February 2022).
  56. Kostakis, I. Socio-demographic determinants of household electricity consumption: Evidence from Greece using quantile regression analysis. Curr. Res. Environ. Sustain. 2020, 1, 23–30. [Google Scholar] [CrossRef]
  57. Bellocchi, S.; Manno, M.; Noussan, M.; Vellini, M. Impact of Grid-Scale Electricity Storage and Electric Vehicles on Renewable Energy Penetration: A Case Study for Italy. Energies 2019, 12, 1303. [Google Scholar] [CrossRef] [Green Version]
  58. Wróblewski, P.; Drożdż, W.; Lewicki, W.; Dowejko, J. Total Cost of Ownership and Its Potential Consequences for the Development of the Hydrogen Fuel Cell Powered Vehicle Market in Poland. Energies 2021, 14, 2131. [Google Scholar] [CrossRef]
  59. Available online: https://www.iea.org/articles/global-ev-data-explorer (accessed on 22 February 2022).
  60. Available online: https://ec.europa.eu/energy/observatory/reports/latest_prices_with_taxes.xlsx (accessed on 18 February 2022).
  61. Brandolini, A.; Rosolia, A. The Distribution of Well-Being Among Europeans. Europe’s Income, Wealth, Consumption, and Inequality; Fischer, G., Strauss, R., Eds.; Oxford University Press: Oxford, UK, 2021. [Google Scholar]
  62. Almeida, V.; Barrios, S.; Christl, M.; De Poli, S.; Tumino, A.; Van der Wielen, W. Households´ Income and the Cushioning Effect of Fiscal Policy Measures during the Great Lockdown; JRC Working Papers on Taxation and Structural Reforms 06/2020; European Commission, Joint Research Centre: Seville, Spain, 2020. [Google Scholar]
  63. Fischer, G.; Strauss, R. Europe’s Income, Wealth, Consumption, and Inequality; Oxford University Press: Oxford, UK, 2021. [Google Scholar]
  64. Eurostat. Annual Net Earnings. Available online: https://ec.europa.eu/eurostat/databrowser/view/earn_nt_net/default/table?lang=en (accessed on 22 February 2022).
  65. Eurostat. Database. Available online: https://ec.europa.eu/eurostat/web/hicp/data/database (accessed on 22 February 2022).
  66. Ketterer, J.C. The impact of wind power generation on the electricity price in Germany. Energy Econ. 2014, 44, 270–280. [Google Scholar] [CrossRef] [Green Version]
  67. Martinez-Anido, C.B.; Brinkman, G.; Hodge, B.M. The impact of wind power on electricity prices. Renew. Energy. 2016, 94, 474–487. [Google Scholar] [CrossRef] [Green Version]
  68. Ballester, C.; Furió, D. Effects of renewables on the stylized facts of electricity prices. Renew. Sustain. Energy Rev. 2015, 52, 1596–1609. [Google Scholar] [CrossRef]
  69. Cruz, A.; Muñoz, A.; Zamora, J.L.; Espínola, R. The effect of wind generation and weekday on Spanish electricity spot price forecasting. Electr. Power Syst. Res. 2011, 81, 1924–1935. [Google Scholar] [CrossRef]
  70. Paska, J.; Sałek, M.; Surma, T. Current status and perspectives of renewable energy sources in Poland. Renew. Sustain. Energy Rev. 2013, 13, 142–154. [Google Scholar] [CrossRef]
  71. Streimikiene, D.; Kyriakopoulos, G.L.; Lekavicius, V.; Siksnelyte-Butkiene, I. Energy Poverty and Low Carbon Just Energy Transition: Comparative Study in Lithuania and Greece. Soc. Indic. Res. 2021, 158, 319–371. [Google Scholar] [CrossRef] [PubMed]
  72. Sun, W.; Zhang, H.; Tseng, M.-L.; Zhang, W.; Li, X. Hierarchical energy optimization management of active distribution network with multi-microgrid system. J. Ind. Prod. Eng. 2022, 39, 210–229. [Google Scholar] [CrossRef]
  73. Chen, W.-C.; Chen, W.-K.; Chen, C.-W.; Lo, C.-C. An empirical study of willingness to renewable energy installation using importance-performance analysis: The case of Taiwan. J. Ind. Prod. Eng. 2019, 36, 451–460. [Google Scholar] [CrossRef]
  74. Ouyang, Z.-Y.; Qin, Z.; Cao, H.; Xie, T.-Y.; Dai, X.-Y.; Wang, Q.-W. A Spillover Network Analysis of the Global Crude Oil Market: Evidence from the post-financial crisis era. Pet. Science 2021, 18, 1256–1269. [Google Scholar] [CrossRef]
  75. Kilian, L.; Zhou, X. Oil Prices, Gasoline Prices and Inflation Expectations: A New Model and New Facts; Working Paper 2025; Federal Reserve Bank of Dallas: Dallas, TX, USA, 2020; Available online: https://www.dallasfed.org/-/media/documents/research/papers/2020/wp2025.pdf (accessed on 10 April 2022).
  76. Khattak, M.A.; Ayoub, M.A.H.; Manaf, A.F.A.; Mahrul, M.F.; Juhari, M.R.M.; Mustaffa, M.I.; Kazi, S. Global Energy Security and European Union: A Review. J. Adv. Res. Appl. Sci. Eng. Technol. 2018, 11, 64–81. Available online: https://akademiabaru.com/submit/index.php/araset/article/view/1961/1533 (accessed on 10 April 2022).
  77. Kucukvar, M.; Onat, N.C.; Kutty, A.A.; Abdella, G.M.; Enis Bulak, M.; Ansari, F.; Kumbaroglu, G. Environmental efficiency of electric vehicles in Europe under various electricity production mix scenarios. J. Clean. Prod. 2022, 335, 130291. [Google Scholar] [CrossRef]
  78. Tsakalidis, A.; Thiel, C. Electric Vehicles in Europe from 2010 to 2017: Is Full-Scale Commercialisation Beginning? An overview of the Evolution of Electric Vehicles in Europe; JRC Science for Policy Report EUR 29401 EN; Publications Office of the European Union: Luxembourg, 2018. [Google Scholar] [CrossRef]
  79. Gomez Vilchez, J.J.; Julea, A.; Peduzzi, E.; Pisoni, E.; Krause, J.; Siskos, P.; Thiel, C. Modelling the impacts of EU countries’ electric car deployment plans on atmospheric emissions and concentrations. Eur. Transp. Res. Rev. 2019, 11, 1–17. [Google Scholar] [CrossRef]
  80. European Union Comission Recommendation no. 2020/1563 of 14 October 2020 on Energy Poverty. Available online: https://eur-lex.europa.eu/legal-content/PL/TXT/HTML/?uri=CELEX:32020H1563&from=EN (accessed on 10 April 2022).
  81. Streimikiene, D.; Lekavičius, V.; Baležentis, T.; Kyriakopoulos, G.L.; Abrhám, J. Climate Change Mitigation Policies Targeting Households and Addressing Energy Poverty in European Union. Energies 2020, 13, 3389. [Google Scholar] [CrossRef]
  82. Stankuniene, G.; Streimikiene, D.; Kyriakopoulos, G.L. Systematic Literature Review on Behavioral Barriers of Climate Change Mitigation in Households. Sustainability 2020, 12, 7369. [Google Scholar] [CrossRef]
  83. Turnock, S.T.; Butt, E.W.; Richardson, T.B.; Mann, G.W.; Reddington, C.L.; Forster, P.M.; Haywood, J.; Crippa, M.; Janssens-Maenhout, G.; Johnson, C.E. The impact of European legislative and technology measures to reduce air pollutants on air quality, human health and climate. Environ. Res. Lett. 2016, 11, 024010. [Google Scholar] [CrossRef] [Green Version]
  84. Juginović, A.; Vuković, M.; Aranza, I.; Biloš, W. Health impacts of air pollution exposure from 1990 to 2019 in 43 European countries. Sci. Rep. 2021, 11, 22516. [Google Scholar] [CrossRef]
  85. Holian, M.J. The impact of building energy codes on household electricity expenditures. Econ. Lett. 2020, 186, 108841. [Google Scholar] [CrossRef]
  86. Kan, X.; Reichenberg, L.; Hedenus, F. The impacts of the electricity demand pattern on electricity system cost and the electricity supply mix: A comprehensive modeling analysis for Europe. Energies 2021, 235, 121329. [Google Scholar] [CrossRef]
  87. Sicard, P.; Agathokleous, E.; De Marco, A.; Paoletti, E.; Calatayud, V. Urban population exposure to air pollution in Europe over the last decades. Environ. Sci. Eur. 2021, 33, 28. [Google Scholar] [CrossRef]
  88. Ahmadov, A.K.; Van der Borg, C. Do natural resources impede renewable energy production in the EU? A mixed-methods analysis. Energy Policy 2019, 126, 361–369. [Google Scholar] [CrossRef]
Figure 1. Share of electricity in total energy consumption by households (average between 2010 and 2020). Source: Own elaboration based on: [46].
Energies 15 03052 g001
Figure 2. Average share of taxes in gross price of electricity in selected EU countries between 2010 and 2020 (average between 2010 and 2020). Source: Own elaboration based on: [51].
Energies 15 03052 g002
Figure 3. Share of natural gas in the total energy consumption of households in the selected EU countries (average between 2010 and 2020). Source: Own elaboration based on: [46].
Energies 15 03052 g003
Figure 4. Average share of taxes in gross price of natural gas for households (consuming between 20 and 200 GJ per year) in selected EU countries (average between 2010 and 2020). Source: Own elaboration based on: [51].
Energies 15 03052 g004
Figure 5. Average annual gross purchase price of 1 L of eurosuper 95 petrol in selected EU countries, in the period from 2010 to 2020 (prices in euros). Source: Own elaboration based on: [60].
Energies 15 03052 g005
Figure 6. Average annual net purchase price of 1 L of eurosuper 95 petrol in selected EU countries, in the period from 2010 to 2020 (prices in euros). Source: Own elaboration based on: [60].
Energies 15 03052 g006
Figure 7. Average share of taxes in gross price of eurosuper 95 in selected EU countries between 2010 and 2020. Source: Own elaboration based on: [60].
Energies 15 03052 g007
Figure 8. Average change in gross prices of eurosuper 95 in selected EU countries between 2010 and 2020. Source: Own elaboration based on: [60].
Energies 15 03052 g008
Figure 9. Average annual gross purchase price of 1 L of diesel oil in selected EU countries, in the period from 2010 to 2020. (Prices in euros). Source: Own elaboration based on: [60].
Energies 15 03052 g009
Figure 10. Average annual net purchase price of 1 L of diesel oil in selected EU countries, in the period from 2010 to 2020 (prices in euros). Source: Own elaboration based on: [60].
Energies 15 03052 g010
Figure 11. Average share of taxes in gross price of diesel in selected EU countries between 2010 and 2020. Source: Own elaboration based on: [60].
Energies 15 03052 g011
Figure 12. Average change in gross prices of diesel in selected EU countries between 2010 and 2020. Source: Own elaboration based on: [60].
Energies 15 03052 g012
Figure 13. Annual average earnings for a single-person household in selected EU countries, in the period from 2010 to 2020, including taxes and social security contributions (in euros). Source: [64].
Energies 15 03052 g013
Figure 14. Annual average earnings of a single-person household in selected EU countries, in the period from 2010 to 2020, excluding taxes and social security contributions (in euros). Source: [64].
Energies 15 03052 g014
Figure 15. Average tax and insurance share in gross remuneration in selected EU countries between 2010 and 2020. Source: [64].
Energies 15 03052 g015
Figure 16. Annual average HICP inflation in selected EU countries, in the period from 2010 to 2020 (data in %). Source: [65].
Energies 15 03052 g016
Table 1. Share of final energy consumption in the residential sector by the EU Member State and by the source of consumption (average between 2010 and 2020).
CountrySpace HeatingSpace CoolingWater HeatingCooking ShareLightningOther
European Union—27 countries (from 2020)63.64%0.40%14.80%6.10%14.10%0.97%
Euro area—19 countries (from 2015)64.32%0.34%14.07%6.10%14.51%0.65%
Bulgaria53.52%0.43%17.50%7.98%20.57%0.70%
The Czech Republic68.45%0.07%16.69%6.31%6.94%1.54%
Estonia72.47%0.40%11.83%4.77%10.93%1.00%
Croatia68.38%1.67%10.34%6.81%12.80%1.00%
Cyprus36.11%10.83%22.83%7.47%21.00%1.76%
Latvia65.76%0.40%18.32%7.12%8.19%0.61%
Lithuania70.36%0.50%8.87%6.52%14.25%0.90%
Hungary72.71%0.15%12.56%4.72%9.86%0.70%
Malta17.18%11.83%26.66%15.06%27.57%1.70%
Poland65.37%0.40%16.39%8.28%9.97%0.90%
Romania63.26%0.32%13.42%9.55%13.45%0.50%
Slovenia66.00%0.49%15.42%3.80%14.29%0.30%
Slovakia68.99%0.14%13.81%5.28%11.76%0.02%
Source: Own elaboration based on: [46].
Table 2. Electricity prices (kWh) for households, including taxes and levies in the period from 2010 to 2020—prices in euros.
European Union—27 Countries (from 2020)BulgariaThe Czech RepublicEstoniaCroatiaCyprusLatviaLithuaniaHungaryMaltaPolandRomaniaSloveniaSlovakia
20100.190.080.210.100.110.200.100.120.170.190.150.110.170.18
20120.210.100.220.110.150.290.120.130.170.190.160.110.180.20
20140.230.090.180.140.140.230.120.130.120.140.150.130.190.17
20160.230.090.190.130.140.160.170.120.120.150.140.130.200.18
20180.240.100.210.150.140.230.160.110.110.150.150.130.200.17
20200.240.100.240.140.140.180.180.130.100.150.160.150.210.19
Source: Own elaboration based on: [51].
Table 3. Electricity prices (kWh) for households, excluding taxes and levies in the period from 2010 to 2020—prices in euros.
European Union—27 Countries (from 2020)BulgariaThe Czech RepublicEstoniaCroatiaCyprusLatviaLithuaniaHungaryMaltaPolandRomaniaSloveniaSlovakia
20100.140.070.170.070.090.170.100.100.130.180.120.090.120.16
20120.150.080.180.080.120.240.080.110.130.190.120.080.130.16
20140.150.080.150.100.110.190.070.090.090.140.120.090.130.14
20160.150.080.160.100.110.130.110.080.090.140.110.090.130.15
20180.160.080.170.110.110.190.110.080.090.140.100.100.130.10
20200.160.090.180.110.110.130.120.100.080.140.100.110.140.13
Source: Own elaboration based on: [51].
Table 4. Share of taxes in electricity purchase prices for 1 kWh in 2020.
European Union—27 Countries (from 2020)BulgariaThe Czech RepublicEstoniaCroatiaCyprusLatviaLithuaniaHungaryMaltaPolandRomaniaSloveniaSlovakia
201027.8%13.5%18.6%27.5%17.2%16.1%4.7%14.7%22.5%3.6%22.1%23.2%28.6%14.1%
201228.9%20.7%18.4%26.3%20.6%17.2%30.9%17.9%24.4%2.7%23.0%29.8%25.3%20.2%
201434.1%16.6%16.6%28.1%21.6%17.2%39.2%30.8%21.8%1.7%22.6%27.5%31.8%17.6%
201635.6%12.1%18.6%24.2%21.4%20.2%34.9%30.6%23.3%7.5%20.1%29.9%36.4%19.0%
201833.8%16.4%17.5%28.0%20.1%19.6%32.4%28.6%18.3%6.7%35.6%25.0%34.8%39.2%
202035.6%15.0%26.6%24.1%21.4%28.1%31.7%23.9%19.9%5.7%35.1%30.3%35.5%31.9%
Source: Own elaboration based on: [51].
Table 5. Prices of natural gas (per kWh) for households (consuming between 20 and 200 GJ per year) including taxes and levies for the period from 2010 to 2020—prices in euros.
TIMEEuropean Union—27 Countries (from 2020)BulgariaThe Czech RepublicEstoniaCroatiaLatviaLithuaniaHungaryPolandRomaniaSloveniaSlovakia
20100.100.040.080.050.040.070.070.060.060.030.070.10
20120.110.060.100.060.050.080.090.060.070.030.100.10
20140.110.050.090.060.050.070.080.040.070.030.070.10
20160.110.030.090.040.050.070.070.040.050.030.070.10
20180.120.050.110.050.050.070.070.040.050.040.060.11
20200.110.040.110.050.050.100.040.030.050.030.060.12
Source: Own elaboration based on: [51].
Table 6. Prices of natural gas (per kWh) for households (consuming between 20 and 200 GJ per year), excluding taxes and levies for the period from 2010 to 2020—prices in euros.
TIMEEuropean Union—27 Countries (from 2020)BulgariaThe Czech RepublicEstoniaCroatiaLatviaLithuaniaHungaryPolandRomaniaSloveniaSlovakia
20100.070.040.070.040.030.060.060.050.050.020.060.08
20120.090.050.080.050.040.070.070.040.060.020.080.08
20140.090.040.070.040.040.060.060.030.050.020.050.09
20160.080.030.080.030.040.050.060.030.040.020.050.08
20180.090.040.090.040.040.060.050.030.040.030.040.09
20200.080.030.090.040.040.080.030.020.040.030.040.10
Source: Own elaboration based on: [51].
Table 7. Share of taxes in natural gas for households (consuming between 20 and 200 GJ per year) for the period from 2010 to 2020.
TIMEEuropean Union—27 Countries (from 2020)BulgariaThe Czech RepublicEstoniaCroatiaLatviaLithuaniaHungaryPolandRomaniaSloveniaSlovakia
201023.10%16.59%16.62%21.21%18.95%9.20%17.27%20.03%18.06%47.86%22.70%15.96%
201222.76%16.61%16.61%20.35%20.09%19.50%17.40%22.87%18.72%46.91%21.38%16.67%
201423.28%16.63%17.31%20.44%19.93%19.62%17.35%21.22%18.70%51.71%25.94%16.59%
201624.74%16.67%17.29%24.93%19.87%20.21%17.35%21.33%18.79%48.32%27.74%16.73%
201824.37%16.63%17.38%26.32%20.04%19.72%20.66%21.33%18.98%16.10%28.97%16.64%
202023.69%16.84%17.50%24.58%20.00%19.14%23.02%21.10%19.62%15.95%29.45%16.63%
Source: Own elaboration based on: [51].
Table 8. Number of the sale of electric vehicles in the sale of new vehicles worldwide in the period from 2010 to 2020.
20102011201220132014201520162017201820192020
The Czech RepublicNANANA2374177139741525248281807103
EstoniaNANA6007081067111611561191125413822147
CroatiaNANANANANA163233285461725987
LatviaNANA10151882112413124426581247
LithuaniaNANANANA7016935861996513951696
HungaryNANA901101753427581996383965956101
RomaniaNANA100020422737386363489947110327982007
SloveniaNANANANA133288457779130819981926
Source: [59].
Table 9. Share of taxes in eurosuper 95 price in selected EU countries between 2010 and 2020.
BulgariaCroatiaCyprusThe Czech RepublicEstoniaHungaryLatviaLithuaniaMaltaPolandRomaniaSlovakiaSlovenia
201048.34%No data44.99%55.56%52.62%54.58%50.33%52.58%50.19%53.11%49.72%56.59%55.17%
201244.51%No data44.70%52.19%47.60%50.55%48.65%48.43%47.19%48.90%46.54%54.36%53.61%
201444.83%54.58%49.03%52.90%49.11%51.15%50.24%49.71%49.45%50.21%49.86%55.80%56.23%
201653.54%61.69%57.52%60.88%53.50%56.80%57.54%56.70%57.55%55.68%55.02%62.74%64.37%
201850.09%58.57%53.48%57.25%59.69%53.28%55.95%53.20%55.51%52.60%52.35%57.73%60.44%
202055.66%61.14%57.16%62.63%61.44%54.53%62.48%60.09%55.07%55.31%54.85%62.69%64.66%
Source: Own elaboration based on: [60].
Table 10. Share of taxes in diesel price.
BulgariaCroatiaCyprusThe Czech RepublicEstoniaHungaryLatviaLithuaniaMaltaPolandRomaniaSlovakiaSlovenia
201044.84%No data41.52%50.42%49.44%49.07%45.89%42.89%46.51%46.10%45.39%48.10%50.35%
201241.37%No data41.96%47.09%45.18%47.86%43.39%41.11%43.64%45.08%43.08%45.36%47.46%
201444.57%51.36%51.00%50.43%50.02%50.56%48.17%46.15%48.45%49.62%52.14%50.53%55.62%
201651.41%55.63%55.36%55.79%50.70%53.92%52.48%50.33%55.45%52.47%52.15%54.24%61.66%
201846.04%51.03%49.83%51.70%54.42%49.38%49.34%47.18%53.50%47.91%48.55%49.05%55.00%
202052.43%54.12%53.82%56.33%53.64%52.08%58.10%54.54%53.04%50.68%51.02%53.82%62.35%
Source: Own elaboration based on: [60].
Table 11. Ability to purchase individual energy carriers for an annual average net salary in selected countries in the period from 2010 to 2020.
Electricity (kWh)Natural Gas (kWh Equivalent)Eurosuper 95 (Liter)Diesel Oil (Liter)
20102020Change20102020Change20102020Change20102020Change
Bulgaria82,141.59125,491.5852.77%161,947.39342,585.29111.50%6709.9013,759.49105.00%6987.4513,897.0899.00%
Cyprus179,330.23231,931.7729.33%NANANA29,912.5039,396.1532.00%29,550.8538,189.3629.00%
The Czech Republic92,461.22107,658.4116.44%240,818.39240,129.92−0.30%15,296.7523,903.1156.00%15,887.8124,092.1452.00%
Estonia16,1401.27210,305.3430.30%320,290.47623,029.5894.50%14,879.4723,864.0160.00%14,961.5827,295.9382.00%
Croatia11,6478.01151,935.3630.44%309,740.41447,809.4744.60%12,034.6417,669.8347.00%12,757.3118,353.3644.00%
Hungary82,310.90208,963.03153.87%226,354.97689,985.06204.80%11,180.9220,785.8386.00%11,791.3020,133.6171.00%
Lithuania85,927.68169,758.2797.56%154,520.17546,320.38253.60%9053.8320,760.29129.00%10,465.1022,877.88119.00%
Latvia104,674.14112,305.797.29%165,457.77208,518.6326.00%10,097.9317,800.4176.00%10,311.5219,461.3889.00%
Malta152,817.13272,372.0078.23%NANANA24,644.6729,804.3521.00%28,193.5432,926.9817.00%
Poland96,497.71147,774.7253.14%239,953.34514,848.4114.60%12,647.3724,138.7591.00%13,534.3523,993.7577.00%
Romania75,831.98121,717.7860.51%287,078.21543,996.3289.50%7558.0918,616.28146.00%7788.0118,381.27136.00%
Slovenia143,705.71140,311.42−2.36%330,134.73498,538.0151.00%20,375.6427,278.4634.00%21,314.1827,425.0929.00%
Slovakia86,884.19109,494.3626.02%165,755.23174,778.465.40%12,835.4918,090.0341.00%14,382.4920,031.2139.00%
For Cyprus and Croatia, the presented data is for 2014. Source: Own calculations and elaboration.
Publisher’s Note: MDPI stays neutral with regard to jurisdictional claims in published maps and institutional affiliations.

