Article

Hydraulic Tests of the PZ0 Gear Micropump and the Importance Rank of Its Design and Operating Parameters

1
Faculty of Mechanical Engineering, Wroclaw University of Science and Technology, 7/9 Łukasiewicza St., 50-370 Wrocław, Poland
2
Faculty of Production Engineering and Logistics, Opole University of Technology, 76 Prószkowska St., 45-758 Opole, Poland
3
Opole University of Technology, 76 Prószkowska St., 45-758 Opole, Poland
*
Author to whom correspondence should be addressed.
Energies 2022, 15(9), 3068; https://doi.org/10.3390/en15093068
Submission received: 6 March 2022 / Revised: 15 April 2022 / Accepted: 16 April 2022 / Published: 22 April 2022

Abstract

:
This article presents the results of hydraulic tests performed for a prototype gear micropump of a new design. The development of modern hydraulic systems is following two directions: the integration of hydraulic and electronic engineering and a reduction in the mass and the dimensions of the system. The scope of this research involved identifying static characteristics of the prototype gear pump, i.e., its efficiency, torque and power. The tests were performed for PZ0 pumps with the following specific deliveries (which are their design parameters), 0.25 cm3/rev, 0.315 cm3/rev, 0.5 cm3/rev, 0.8 cm3/rev, and 1.0 cm3/rev—with two different types of hydraulic oils, Azolla ZS 22 and HL 68. The operating parameters included the rotational speed, the discharge pressure and the flow rate. The obtained research results suggest an application of the decision tree induction-based classification method for identifying the most important design and operating parameters and their values influencing total efficiency. In addition, the article investigates the influence of rotational speed and specific delivery on total efficiency. The total efficiency translates indirectly into the energy consumption of the solution. The criterion of energy consumption is a key parameter for ecological and economical reasons, related mainly to future operating costs.

1. Introduction

Modern gear pumps are developed in the following directions: to increase their working pressures, to improve their total efficiencies, to lower their pressure pulsations, to minimize their masses and noise emissions, and to reduce the dynamic loads [1,2,3,4]. Working pressures in a hydrostatic system have a decisive influence on its efficiency. A tendency is observed in modern hydrostatically driven machines and devices to increase the discharge pressure [5,6] of the displacement units at the cost of reducing the flow velocity of the working medium [7,8]. Flow velocity has a significant influence on both hydraulic losses in the ducts and on local resistances [9]. Pumps are among the most popular work machines and are used in all branches of technology and in all industries. Their designs are based on a number of various solutions [10]. The share of pumps in electric energy consumption is estimated to be between 20% and 35%. For the above reasons, the optimization of pump efficiency seems a reasonable object of research justified by both ecological and economical reasons [11]. Optimized pump efficiency directly translates into profits for both the economy and for the natural environment.
In accordance with the commonly accepted definition, a pump is a type of machine which transforms mechanical energy delivered from the motor into hydraulic energy accumulated in the pumped liquid stream of the working medium. The most common type of pumps used in hydrostatic systems are gear pumps, which have been constantly developed for the past 400 years. The first such pump is attributed to Johannes Kepler, who patented his solution in 1604 [12].
Currently, gear pumps are developed in order to reduce delivery non-uniformity, which may cause malfunctions of the control elements, vibrations and increased noise emissions of hydrostatically driven machines and devices. The delivery non-uniformity factor of commercial external gear pumps is an average level of approx. 18%. In comparison with other displacement units (e.g., piston pumps and diaphragm pumps, with elements performing progressive and reciprocating movements [13]; vane pumps, with rotating and reciprocating motion [14]; lobe pumps and screw pumps, similar to gear pumps, with elements making rotary movements [15]; canned circulating pumps and hose pumps, with elements making circulating motions [16]), gear pumps have the highest non-uniformity factor. Pulsation is most effectively and efficiently reduced by using an active method, i.e., by flattening its instantaneous delivery curve and by lowering the non-uniformity amplitude of the delivery transmitted to the hydraulic system [2,17,18,19,20].
The second important direction in the development of gear pumps is the minimization of energy losses and increase in transmitted power. It is a tendency aimed at an even greater increase in the energy efficiency of the generator. The total efficiency of the currently manufactured gear pumps is at a level of approximately 85–90% (for nominal pressures) and up to 32 MPa for maximum pressures [21].
Gear pumps began to be used extensively in hydraulic power trains after Roth-Lauck introduced the axial clearance compensated design in 1936. The increased use of gear pumps necessitated the development of a design basis. The first empirical and theoretical formulas defining the pump performance of Amman [22], Zass, Falc, Thomy, and later Judin [23] and Gutbrod [24], appeared. In 1966, a patent was filed by Otto Eckerle with the U.S. Patent and Trademark Office on an innovation for the time pump design with radial clearance compensation for externally meshed units (Patent No. US3472170). A year later, an application to the patent office was filed by G.L. Niell, J.E. Cygnor and J.G. Sundberg, who proposed nearly five radial clearance compensating designs in patent no. US3437048. Otto Eckerle was the leading manufacturer implementing radial play compensation ideas. Within one decade, the company had patented almost ten different concepts, which were also applied in pumps with internal gearing patents: inner gear pump patents no: US3525581 from 1968, USRE27901 and USRE27904 in 1968, US3779674 in 1971, US389066 in 1974, US3912427 in 1974, US4132514 in 1977.
Over the years, other solutions appeared from companies such as Bosch (patent no. US3995975 from 1975), Tyrone Hydraulics (patents no.: US4266915 and WO8101315 from 1979, US4336005 from 1980) and others. Development of new methods of backlash compensation allowed significant increases in efficiency of generators, above 90%, and resulted in an increase in operating pressures to 24 MPa. In the 1990s, pumps appeared on the market reaching pressures of up to 32 MPa, and, additionally, solutions with so-called zero backlash appeared [25,26,27].
In the last decade, there have been more and more frequent attempts to undertake research and production of pumps with special outlines designed exclusively for use in gear units. This is dictated primarily by the desire to obtain better hydraulic and acoustic properties. In the group of special outlines, we can distinguish the following pumps with outlines: Maglotta, Hitosi according to patent No US3164099, Catania according to patent No US2011/0223051, Klassen according to patent No US8118579, and the CTR [28] or Truninnger outline.
Despite numerous patents and publications, and despite the fact that gear pumps are nowadays manufactured in vast quantities, there is still room for improvement as regards technical methods for ensuring optimal internal tightness, maximizing the operating pressures and minimizing the delivery non-uniformity and noise emissions.
In addition, analysis of the literature regarding currently manufactured gear units, could indicate that technical methods to ensure optimal internal tightness, maximum operating pressures and minimum efficiency pulsation and noise emission have already been exhausted. However, the performed considerations and our own research, in juxtaposition with the aforementioned analysis, contradict the thesis of reaching peak analysis of the operational parameters of modern gear units.
The presented results are a continuation of the author’s research on the application of non-standard decision support methods to determine the importance rank of structural and/or operational parameters of newly designed pump types. So far, pumps and entire series of common gear pumps have been studied. In particular, the work [21] presented possibilities and methods to reduce performance pulsations and proposal of new design solutions to increase operating pressures while ensuring high internal tightness. These tasks required solving a number of technological, design and construction problems. The research on the prototype gear pump, initiated for example in [29], allowed development of a discrete optimization method using multi-valued logical decision trees. Discrete optimization also showed that it is possible to significantly reduce the dynamic load amplitudes in the pump even at the design stage. At the same time, the obtained results initiated further research on the optimization of different types of pumps. In [30], an innovative polyvolute tooth shape was developed using multi-valued decision trees with weight coefficients. Using multi-valued logic trees, in a further stage, in [19], optimization of the technology regarding the processing of elements affecting the total efficiency of newly designed units was carried out. The analysis of dimensional tolerances and shape, in the end, allowed for the selection of control dimensions: critical, important and unimportant. The research carried out so far has contributed to the narrowing of dimensional and shape tolerances where it is necessary, and the lowering of accuracy class in unimportant places. This has ultimately contributed to lowering the cost of production and increasing the efficiency of common gear pumps.
Importantly, ref.[21] presents the potential and methods for lowering the delivery non-uniformity and proposes new design solutions which increase working pressures while ensuring a high level of internal tightness. These tasks required a number of technological, design and structural problems to be solved [31,32,33]. The current work is the initiation of research on micropumps, for which, so far, no rank analysis of the importance of design and/or performance parameters has been carried out.

1.1. Gear Pumps in Microhydraulics

A tendency has been observed in recent years to miniaturize hydraulic elements and systems. A new field of drive systems is emerging—microhydraulics. In classic hydrostatic drive units, certain type series of nominal values (NV) are used. In the case of valves, the nominal value is the nominal diameter of the flow-through openings. All hydraulic elements having nominal diameters smaller than 6 mm (NV < 6 mm) are classified as remaining within the field of microhydraulics [34,35]. In the case of gear micropumps, the nominal value NV is calculated as the geometric volume per revolution Vg < 1.2 cm3/rev [36].
Microhydraulic solutions are applied in fields where demand exists for the transmission of high power levels, for smooth movement, and for a significant reduction in geometrical dimensions. Owing to advancements in their design and development, microhydraulic systems increasingly often replace pneumatic or electro-mechanical systems. Moreover, as a result of miniaturization, microhydraulic systems have an advantage over classic hydraulic systems in every application in which the dimensions or the mass of a system are significant. This is the case in medical engineering and in medical technology, e.g., in the drive systems of operating and X-ray tables or of dentist chairs; in the automotive industry, e.g., in servomechanisms used in power steering and brake assist systems, in automatic gearboxes, in car seat automation; in lifting mechanisms; in the aviation, chemical, or food industries; and in the dosing of fluids [36].
In this article, the authors present tests of a prototype hydraulic gear micropump PZ0. The research has been performed under a development grant. Selected fragments of the research performed as part of this project were also published in [37,38].
In the first part, the article identifies static characteristics of the prototype gear pump, i.e., its efficiency, torque and power. In the second part, it presents an application of the decision tree induction-based classification method for identifying the most important design and operating parameters.

1.2. Knowledge Management in Terms of Expert Systems

Knowledge discovery in data involves solving many tasks. Publications [39,40,41] list the following basic categories of such tasks: classification, regression, time series analysis, cluster analysis, data summary with descriptions of characteristic classes of objects, analysis of relationships between the attributes describing the objects, searching for anomalies and deviations from typical data.
Knowledge discovery has an interdisciplinary character and is based on the results from the fields of statistics, machine learning, data visualization, databases and processing of uncertain information (e.g., fuzzy set theory or approximate set theory). Machine learning and statistics are currently the most important sources of algorithms used in learning. On the other hand, the specific nature of knowledge discovery in databases entails new research problems, in the areas of both machine learning and databases.
The development of induction rule algorithms and the evaluation method of such rules are mainly focused on the classification of new objects. A set of rules is treated as a classifier, and therefore the classification accuracy and the determination of the importance rank are the main evaluation measures [42,43,44]. Some basic categories of classification methods include individual and compound or complex classification models. The most popular solutions include inter alia: neural networks, support vector machines (SVM) [45,46], logistic regression, the naive Bayes algorithm, the k-nearest neighbors (KNN) algorithm, decision rules [47] and decision trees. A particular mention should be here made of induction and multi-valued logic decision trees [48].

1.3. Methodology

An expert system consisting of two main programs was used in this paper:
(1)
An inductive decision tree generator (a modified DeTreex program was used)
(2)
domain-independent rule language tool (a modified PC Shell program was used).
In the analysis, the entropy measure was used to determine the most significant design and performance parameters as a method for classifying information and generating rules using decision trees. In generating inductive decision trees, a series of tests performed in a specific order, where the data samples, as a result of each successive test, are separated into subgroups of greater “purity”, i.e., containing more and more samples from a given class only. Then, after applying the method of inductive trees, a rule-based expert system was used, which compares the hypothesis with the facts collected in the knowledge base (inductive trees), checking whether among the collected facts there are none that answer the hypothesis. The system recursively calculates at each split until the maximum depth is reached. The choice of maximum depth is very important and significantly affects how our model may under- or over-fit the data. Tree depth analysis allows you to optimally adjust the criterion function.

2. The Research Object and Test Stand

The prototype unit designed and manufactured as part of this research has a three-plate design [49], schematically shown in Figure 1. The front plate (1) serves as a means for attaching the micropump to the drive system. The middle plate (2) contains gears, slide bearing housings and suction and discharge openings for connecting to the hydraulic system. The structure is covered by the rear plate (3). The plates are bolted with one another. They are uniaxially arranged with the use of dowel pins. Two gears rotate in the middle plate, in dedicated machine-turned openings. The active gear is driven by a drive shaft (4) and is engaged with the passive gear. A three-plate design is advantageous for structural reasons (simple shape, convenient arrangement of the pump parts, simple attachment and connection to the motor—simple installation), for technological reasons (facilitated machine working of the pump elements with the use of conventional methods, convenient inspection of pump elements), and due to uncomplicated assembly (simple assembly and interconnection of pump elements) (Figure 1).
The investigated pump is an original design manufactured by Wytwornia Pomp Hydraulicznych Sp. z o.o. in Wroclaw. The tests were performed for five pump units PZ0 having specific delivery (also known in the literature as geometric volume per revolution) values from 0.25 cm3/rev to 1.0 cm3/rev. Table 1 includes the meshing parameters of the tested pumps.

Test Stand

The static characteristics of the gear micropump were identified on the test stand [50] presented in Figure 2 and Figure 3. The tested displacement pump (1) is driven by a three-phase Slh80-4B2/PO motor (10) having a power of 0.75 kW, manufactured by Besel S.A. The motor is provided with an additional windings cooling system, which protects the motor from overheating when it works at low rotational speeds. The rotational speed of the motor may be regulated steplessly owing to the use of the SS-01/07-10/PWR switchbox (11) integrated with an inverter. The system allows the rotational speed of the motor to be regulated within the range from 0 to 1750 rpm. The tested pump (1) is protected against overloading by an adjustable safety valve (5). The load on the tested unit is adjusted with a throttle valve (7). The actual delivery (also referred to in the literature as flow) Qrz of the pump (1) is measured with the Parker K-SCVF-002-10-07X flowmeter (6), having a measurement range of 0.01–2.0 L/min. A pressure gauge (8) provides information on the pump discharge pressure. The torque M on the pump shaft is measured with the SensorAT MT5Nm-N24 torque meter having a measurement range of ±5Nm. The measurements were read from the MW2006-2 m. The rotational speed n of the pump (1) was controlled on the shaft of the torque meter with the use of a magnetic sensor. Figure 2 shows a schematic diagram of the test stand.
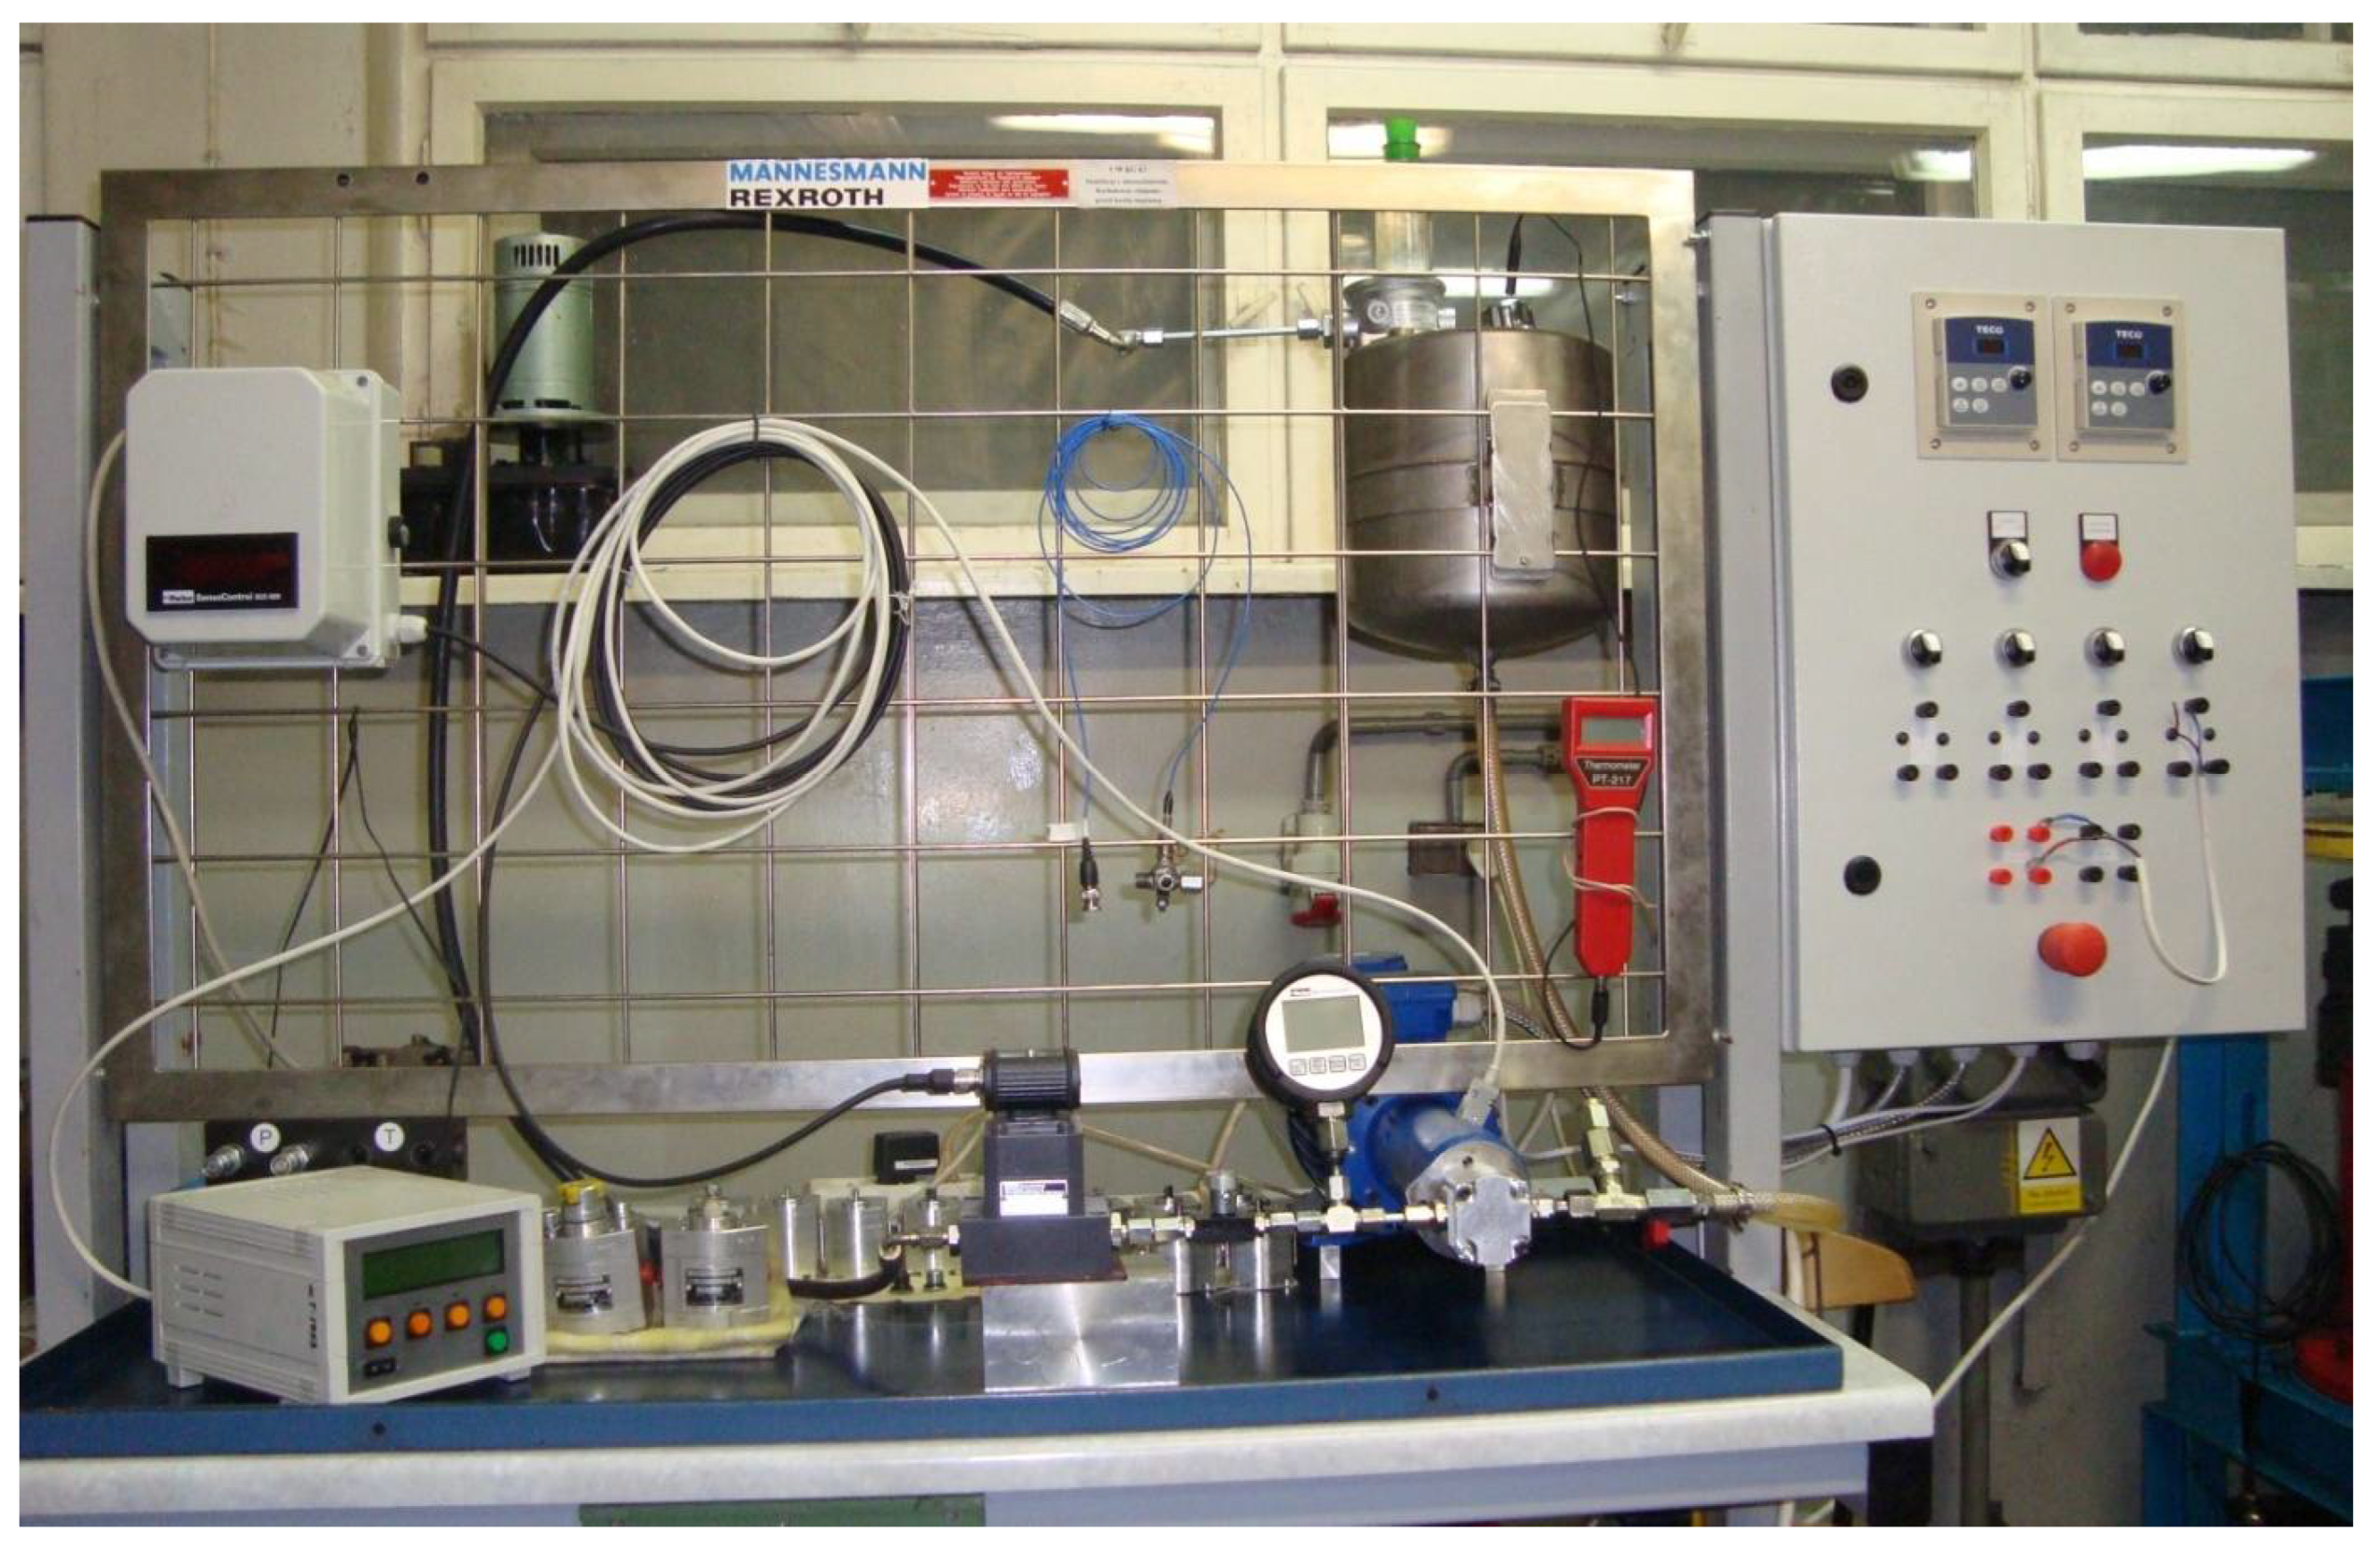
Figure 3 is a view of the test stand.
The tests were performed after a test launch of the test stand, i.e., after the operation of the pump, the safety valve and the readings from all of the measurement devices had been checked. The measurements were started by setting a defined shaft rotational speed n = 500, 750, 1000, 1250, 1500, 1750 rpm. The readings were taken for the discharge pressure pt = 0, 1, 2, 3… 22 MPa. Tests of the static characteristics were performed for the constant working medium temperature of 40 °C and for two types of hydraulic oils: Azolla ZS 22 and HL 68. The kinematic viscosities of the oil for the set working temperature were ν = 65.6 cSt for the HL 68 and ν = 22.5 cSt for the Azolla ZS 22, respectively.
As shown in Figure 4, the torque meter was mounted on the shaft of the motor (2) using the ROTEX GS flexible coupling manufactured by KTR (5). The measuring set allowed both the torque on the shaft and its rotational speed to be recorded in real time. The measurements are displayed on the MW2006-2 m. The torque is transmitted to the tested pump (1) through the KTR ROTEX GS flexible coupling (4).
A data sheet containing physical and chemical parameters for the Azolla ZS oil group, including type No. 22, is included in Supplementary Materials File S1.
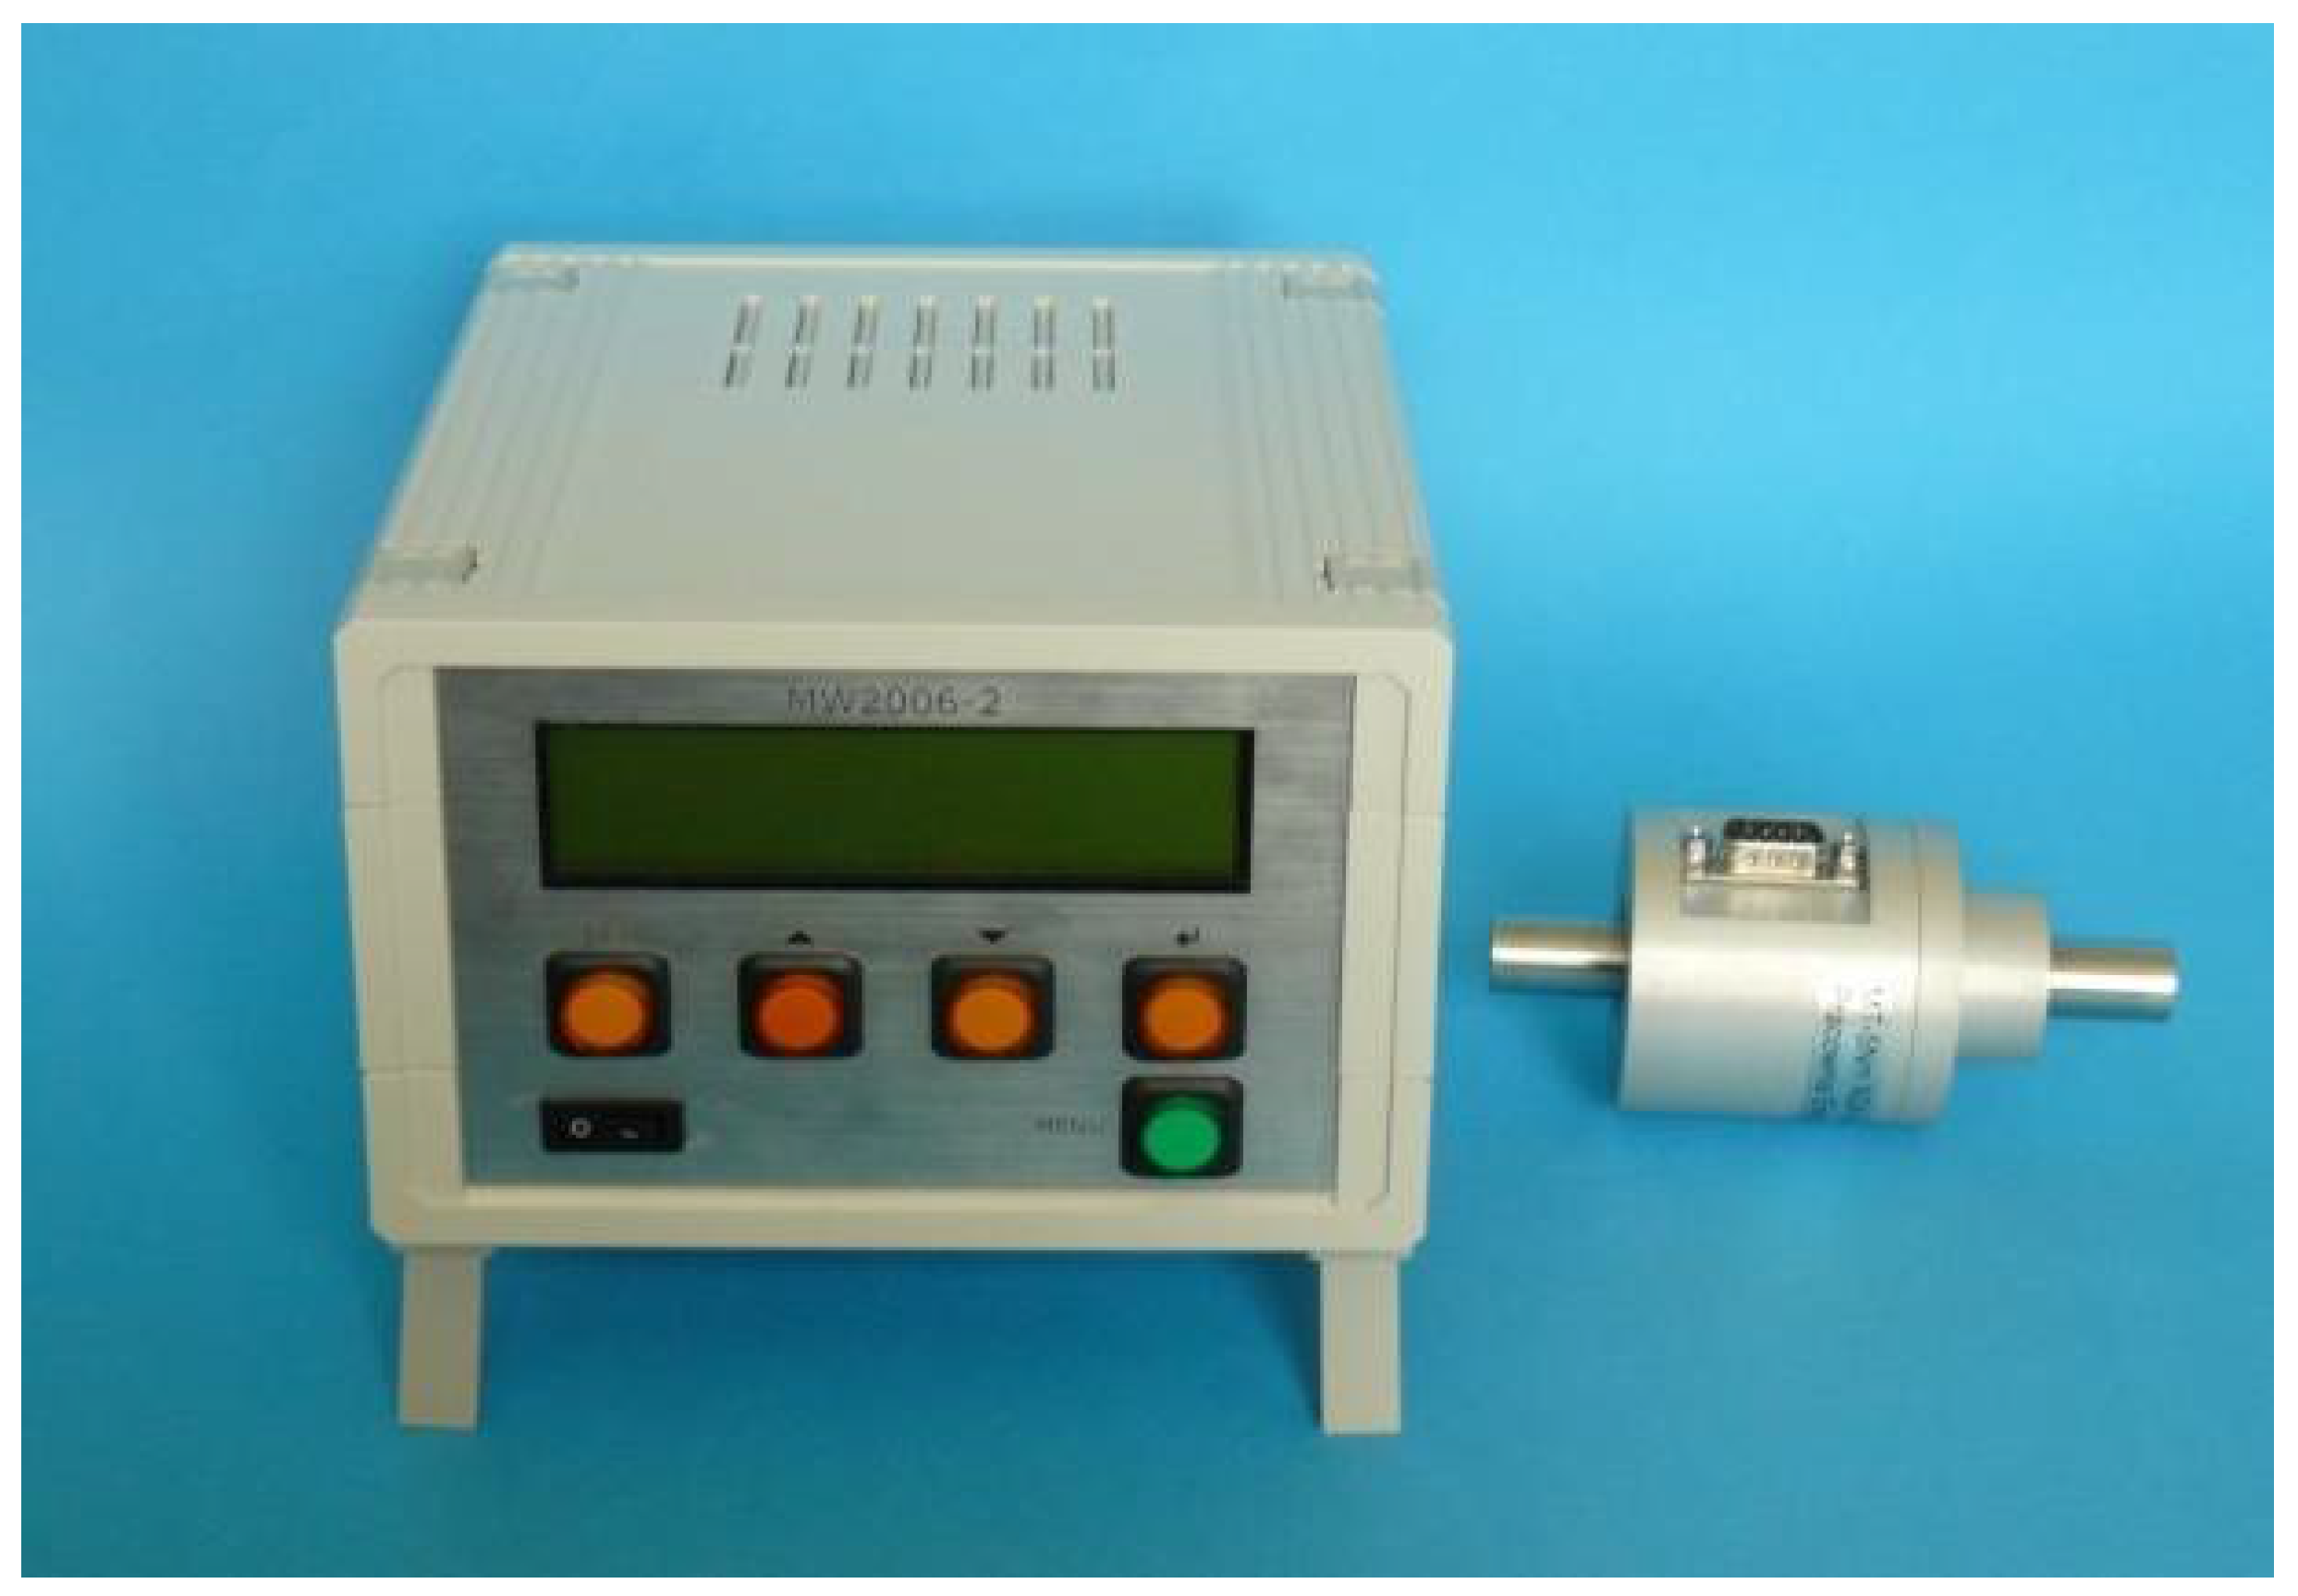
The measurements of the torque M and of the rotational speed n were performed with the MT5Nm-N24 set, serial No. 090410, coupled with the Sensor-AT MW2006-2 m, serial No. 090303, shown in Figure 5.
Figure 6 is a view of the pump unit.

3. Hydraulic Tests of the Micropump

The tests were performed for the working medium temperature of 40 °C. The tests were performed for pumps PZ0 having the following specific deliveries (which are their design parameters): 0.25 cm3/rev; 0.315 cm3/rev; 0.5 cm3/rev; 0.8 cm3/rev; and 1.0 cm3/rev. Two different types of hydraulic oils were used: Azolla ZS 22 and HL 68. The operating parameters included the rotational speed, the discharge pressure and the actual delivery.

Selected Measurement Results for the Azolla ZS 22 Hydraulic Oil

Table 2, Table 3 and Table 4 show representative measurement results of the static characteristics of the PZ0 pump. Table 3 contains abbreviated measurement results of static characteristics for the pump specific delivery of 0.25 cm3/rev (serial No. X10050003); Table 4 contains the results for the pump specific delivery of 0.315 cm3/rev (serial No. X10050005); and Table 5 contains the results for the pump specific delivery of 1.0 cm3/rev (serial No. X10050010). The complete results for all of the delivery values have been presented in the report [37].
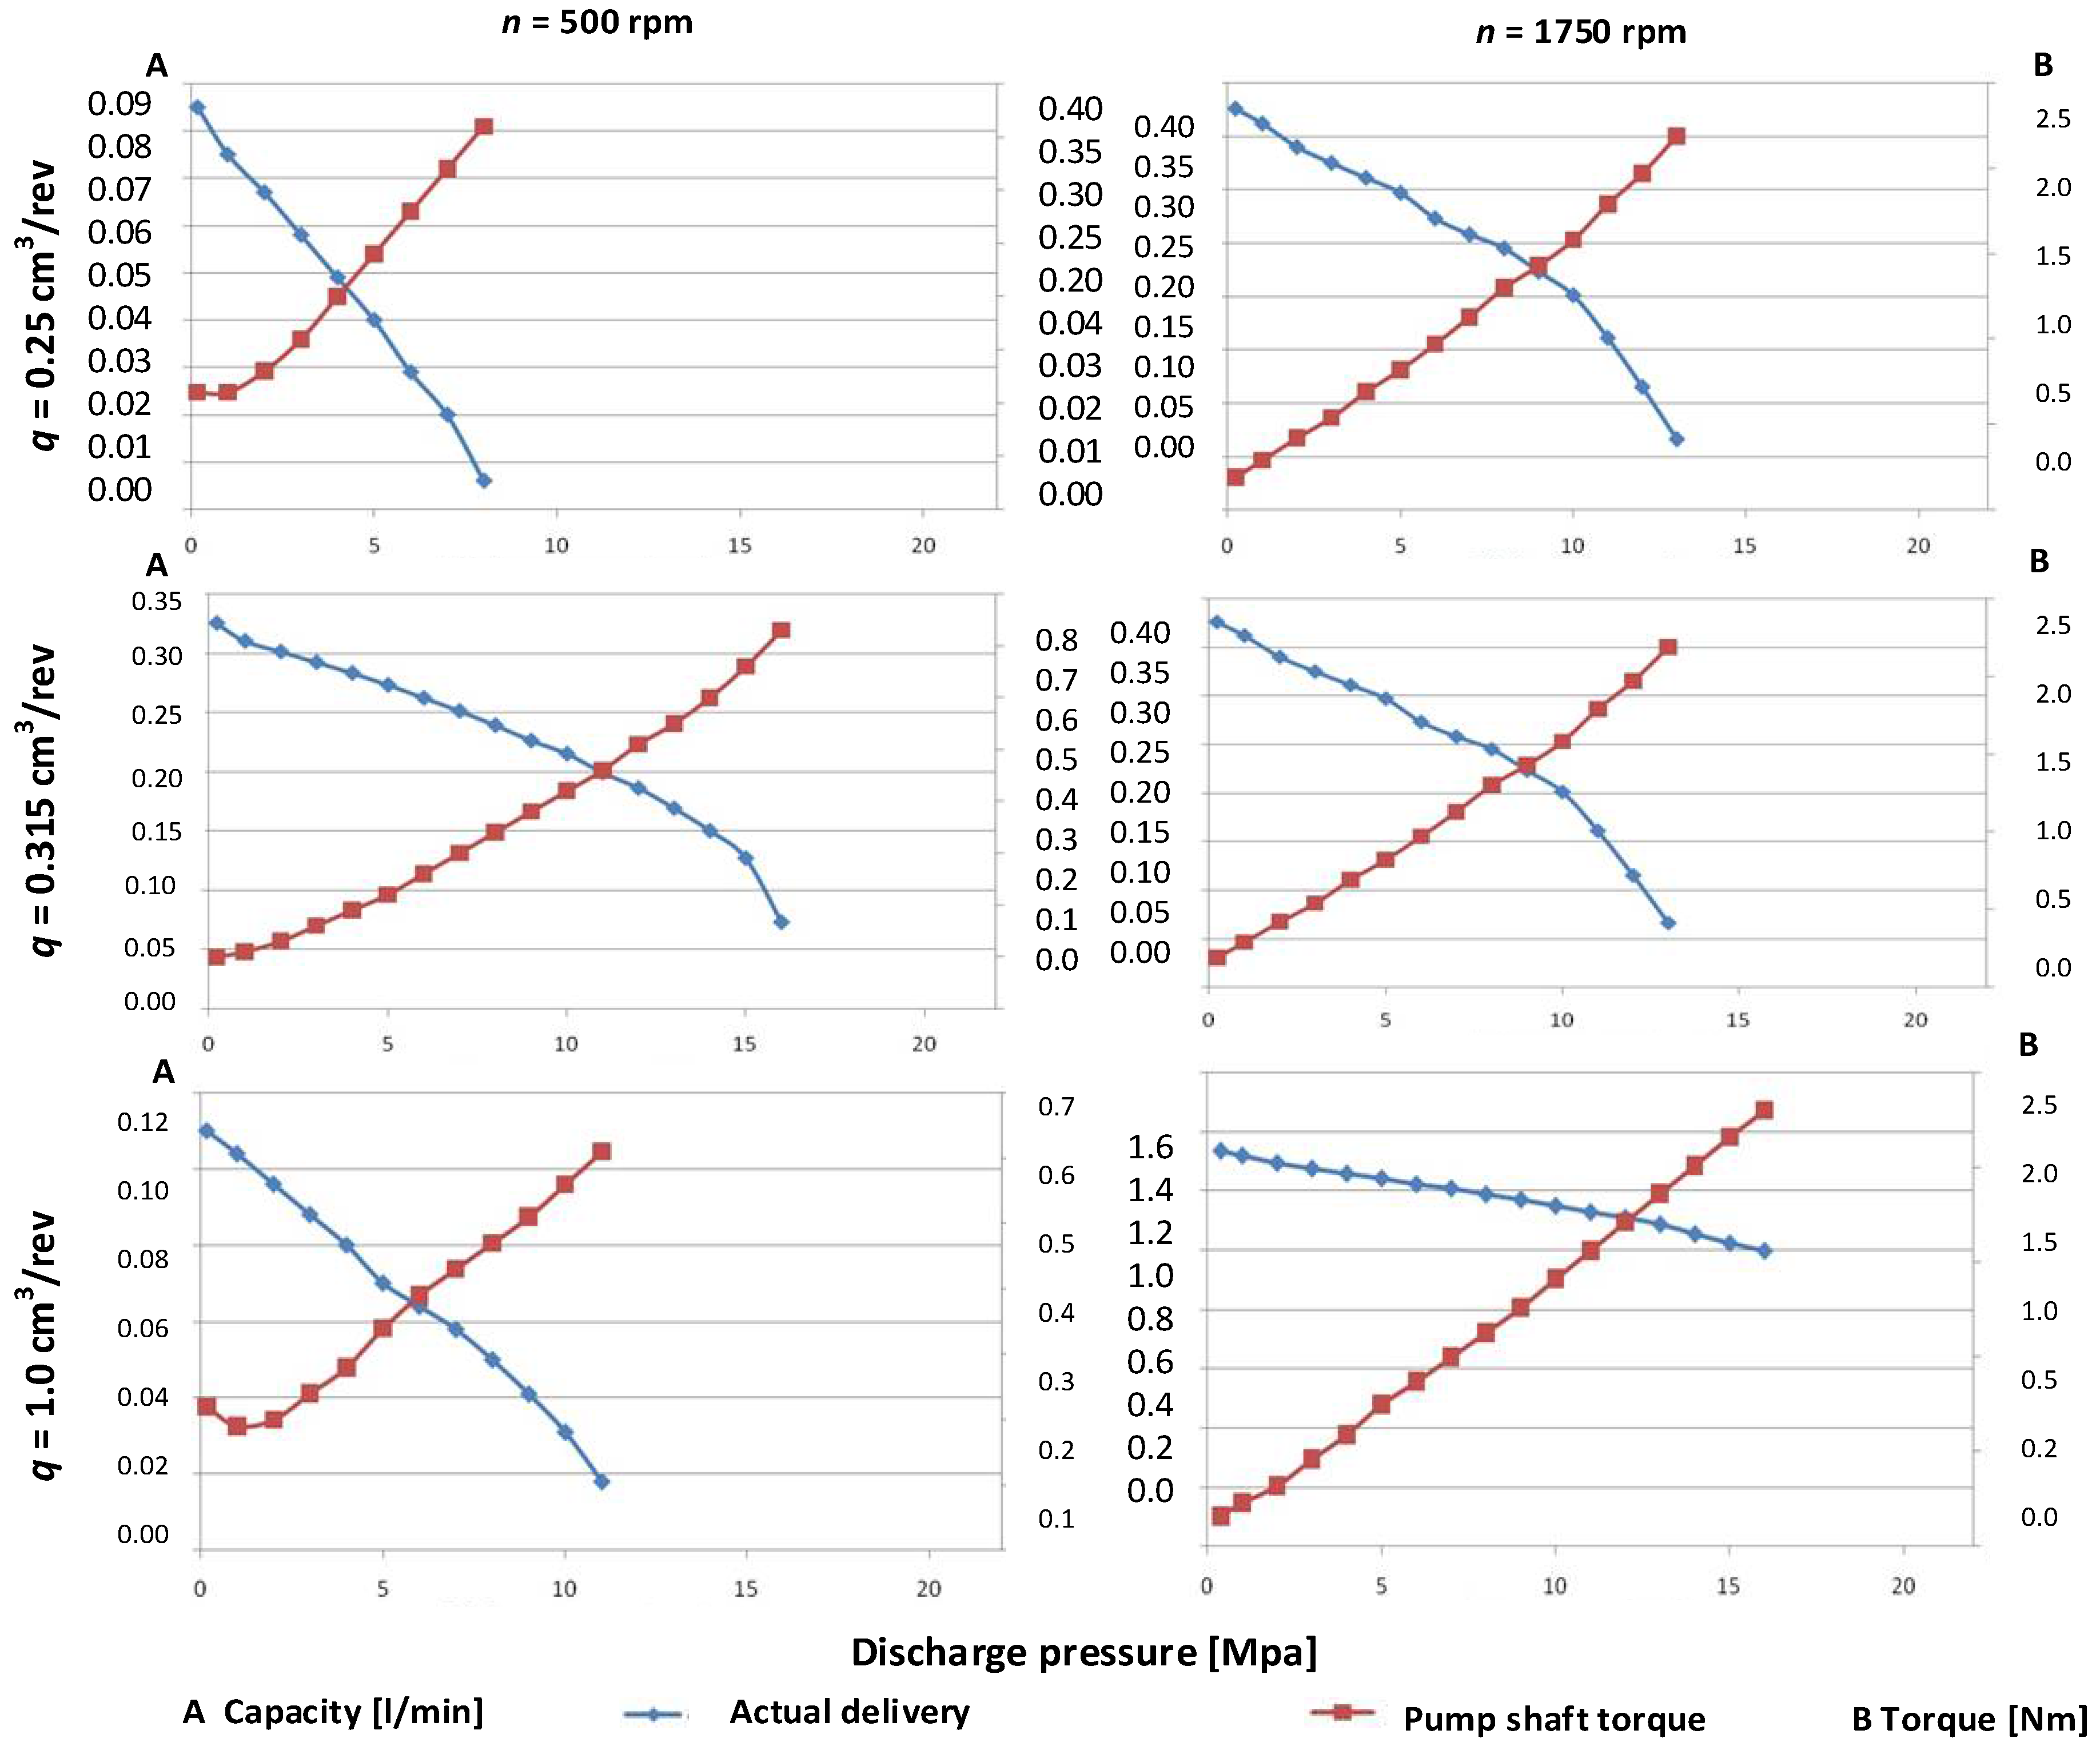
Figure 7 shows selected characteristics of actual deliveries and torques on the pump shaft for the respective specific deliveries q = 0.25 cm3/rev, q = 0.315 cm3/rev and q = 1.0 cm3/rev.
Figure 8 shows selected characteristics of pump efficiency for selected specific deliveries q for respective rotational speeds n for the oil Azolla ZT type 22.
The plotted static characteristics of the prototype pumps have curve shapes similar to the known curve shapes of conventional pumps. The pumps reached the highest volumetric efficiencies for low working pressures. The deformation of pump elements under loads increases the gap widths which are mainly responsible for the volumetric losses at higher discharge pressures.
η v = Q r Q t = Q t Δ Q Q t  
The pump volumetric efficiency ην is the ratio of a real displacement Qrz to theoretical efficiency Qt, where ΔQ is the volumetric loss in a pump.
The discharge pressure is not the only factor which influences the efficiency of the prototype pump. The efficiency curves additionally depend on the rotational speed, dynamic viscosity, oil density and specific delivery [1].
η v = 1 c μ p 2 π μ n c r 1 n 2 p ρ q 1 3
where cμ is the coefficient, which is a function of dimensions and the number of gaps, which also depends on the efficiency of an appropriate pump, p is the working pressure, q is the proper efficiency, n is the rotational speed, μ is the liquid dynamic viscosity, and cr is the coefficient dependent on the type of gaps, their dimensions and efficiency of an appropriate pump.
The curves indicate a tendency for the volumetric efficiency to increase when oil of higher viscosity is used. The use of the HL 68 oil causes the volumetric efficiency to increase by more than 50% (especially for higher working pressures). A similar effect can be obtained if the rotational speed is increased. In this case, the change of speed from 500 to 1750 rpm causes an increase in efficiency by more than 50%. Lower specific delivery q also results in increased internal leaks for high discharge pressures. For this reason, small units are best suited to systems operating at lower pressures.
The pump hydromechanical efficiency η h m is defined as the ratio of the theoretical torque Mt to the actual torque loading the pump shaft.
η h m = M t M r z = M t M t Δ M
The hydromechanical loss torque Δ M can be represented as follows:
Δ M = M ν + M ρ + M P + M k
The measurement of the individual components of the loss torque ( M ν , M ρ , M P , M k ) is metrologically very difficult (3b). Therefore, the hydromechanical efficiency η h m was determined indirectly, on the basis of the commonly accepted relationship (3a) and of the prior calculations of the total efficiency η c and the volumetric efficiency η v .
η c = η v η h m
As follows from the above-presented static characteristics, the experimental micropumps have a stable characteristic of total efficiency within the entire pressure range from 0 to 22 MPa for units having specific deliveries q approximate to 1 cm3/rev and working on an oil type of higher density. The volumetric efficiency is the main factor which influences the final value of the total efficiency. The losses related to the friction force of the liquid and to the mechanical efficiency of the structure have a significantly smaller influence on the total efficiency.
In the next stage, an analysis was performed of the importance rank of both the design and operating parameters which influence the total efficiency.

4. Tests of the Importance Rank of the Design and Operating Parameters from a Classification Perspective

Complex classification methods are used when an issue needs to be analyzed from the perspective of two or more objective functions. Complex classifiers include multi-stage classifiers [51], multi-purpose two-level classifiers [52] and classifier sets [53]. In multi-stage discovery, the following sequence of classifications tasks is performed: in the first stage, the input set of characteristics considered in a particular classification problem is used to select a subset of characteristics, serving as the basis for making a classification decision which limits the set of possible class labels in the first stage.

4.1. Determination of Importance Rank for Design Parameters with the Use of the Rule-Based Knowledge Representation

A classification tree is one of the representations of a recurrent classification for a particular set. It consists of a gradual division of a multi-dimensional space of characteristics into disjoint subsets until they become homogenous with respect to that characteristic (y). Next, a local model of this variable is built in each of the obtained segments. The recurrent classification method is graphically represented by a decision tree. If such a tree is related to a characteristic y, which is a nominal characteristic, then its representative tree is called a classification tree, and if it is related to a continuous variable, then the tree is called a regression tree.
The tests were performed for the specific deliveries 0.25 cm3/rev, 0.315 cm3/rev, 0.5 cm3/rev, 0.8 cm3/rev, and 1.0 cm3/rev.
The object of the recurrent classification is the N-element set of objects.
In this case, it is a set of design parameters characterized by a vector of M+1 characteristics, which are their values [x,y], where:
X = [ x 1 , x 2 , x 3 , , x M ]
where x1, x2, x3, …, xM- are the decision variables of the analyzed set.
Multi-dimensional observations (parameter values) in the analyzed set of measurement data can be represented as the following matrix:
[ x n , y n ] N x M + 1 = [ x 11 x 1 M y 1 x 21 x 2 M y 2 x N 1 x N M y N ]
Variables x1, x2, ..., xM define the design parameters, where y1, y2, y3, …, yN- are the output values of the criterion function.
x1= n, x2 = pt, x3 = Qrz, x4 = M, x5 =Nm, x6 = Nh, and the variable y is the output variable: ηc.
Using the data from the matrix, such a relationship between the variable y and the variables x1, x2, x3, x4, x5, x6 must be found that based on the known values of the predicates, it is possible to define the key parameters (x1, x2, x3, x4, x5, x6) influencing the value of the variable y (ηc). Such a function f is thus searched for that:
y = f ( x , α ) + ε
where ε is the matching error ratio.
In practice, only one additive is considered:
y = α 0 + K = 1 K α k g k ( x , β )
where: α0—model parameters, αk—change of model in k-th step, gk—coefficient of the matching function in k-th step.
The constructed model is graphically represented by a decision tree. In particular, the constructed inductive decision trees can employ the measure of entropy.

4.1.1. Application of Induction Trees

The measure of entropy is defined as:
E n t ( S ) = i = 1 r p i log 2 p i
where pi is the probability that a randomly selected example from S belongs to class Ki (pi estimated as ni/n). Attribute a (given decision variable from the set) is used to build a test in the tree node conditional entropy. The lower the value, the better the conjunction of P.
The problem of reducing the number of attributes is also considered from various perspectives. Due to the complicated calculation process, the fastest techniques are based on removing the attributes which are irrelevant to the classification during preliminary data processing.
Any limit point divides the binary set S into two disjoint subsets S1 and S2 ( S = S 1 S 2 ). For such a division, the conditional entropy is defined as [54,55,56]:
| S 1 | | S | E n t ( S 1 ) + | S 2 | | S | E n t ( S 2 )
The work of the expert system is in several stages. In the first stage, the inductive tree is created; then, follows the optimization of the decision tree depending on the criterion function.
The system operation can be described as follows:
Step 1: A learning file is created
.lrn and a test file .tst. In this step, all the measurement data are entered as input parameters (in) and output parameters (out).
-
the set of input parameters: { x 1 ,   x 2 ,   x 3 ,   x 3 , , x n }
-
the set of output parameters: { y 1 ,   y 2 ,   y 3 ,   y 3 , , y n } .
Step 2: Building a model (classifier) that describes a predefined set of data classes.
This method is the main method used to build decision trees, which reduces the amount of information needed for classification. The attribute with the highest information gain is selected.
S—the set of examples of one of k decision classes, denoted K1, ..., Kk.
N—the number of examples from S, and ni—the class size Ki
Entropy is associated with the classification of the set of examples of S (9).
Set attribute a takes p different values {v1, v2, ..., vp}.
S = {S1, S2, ..., Sp}, where Sj contains examples with vj attribute values (j = 1, ..., p); nSj—abundance of the set Sj.
The entropy of partitioning the set of examples S due to attribute a:
E n t ( S | a ) = j = 1 p n S j n E n t ( S j )
The information gain resulting from using the attribute a to build a split test for a set of examples S:
G a i n ( S , a ) = E n t ( S ) E n t ( S | a )
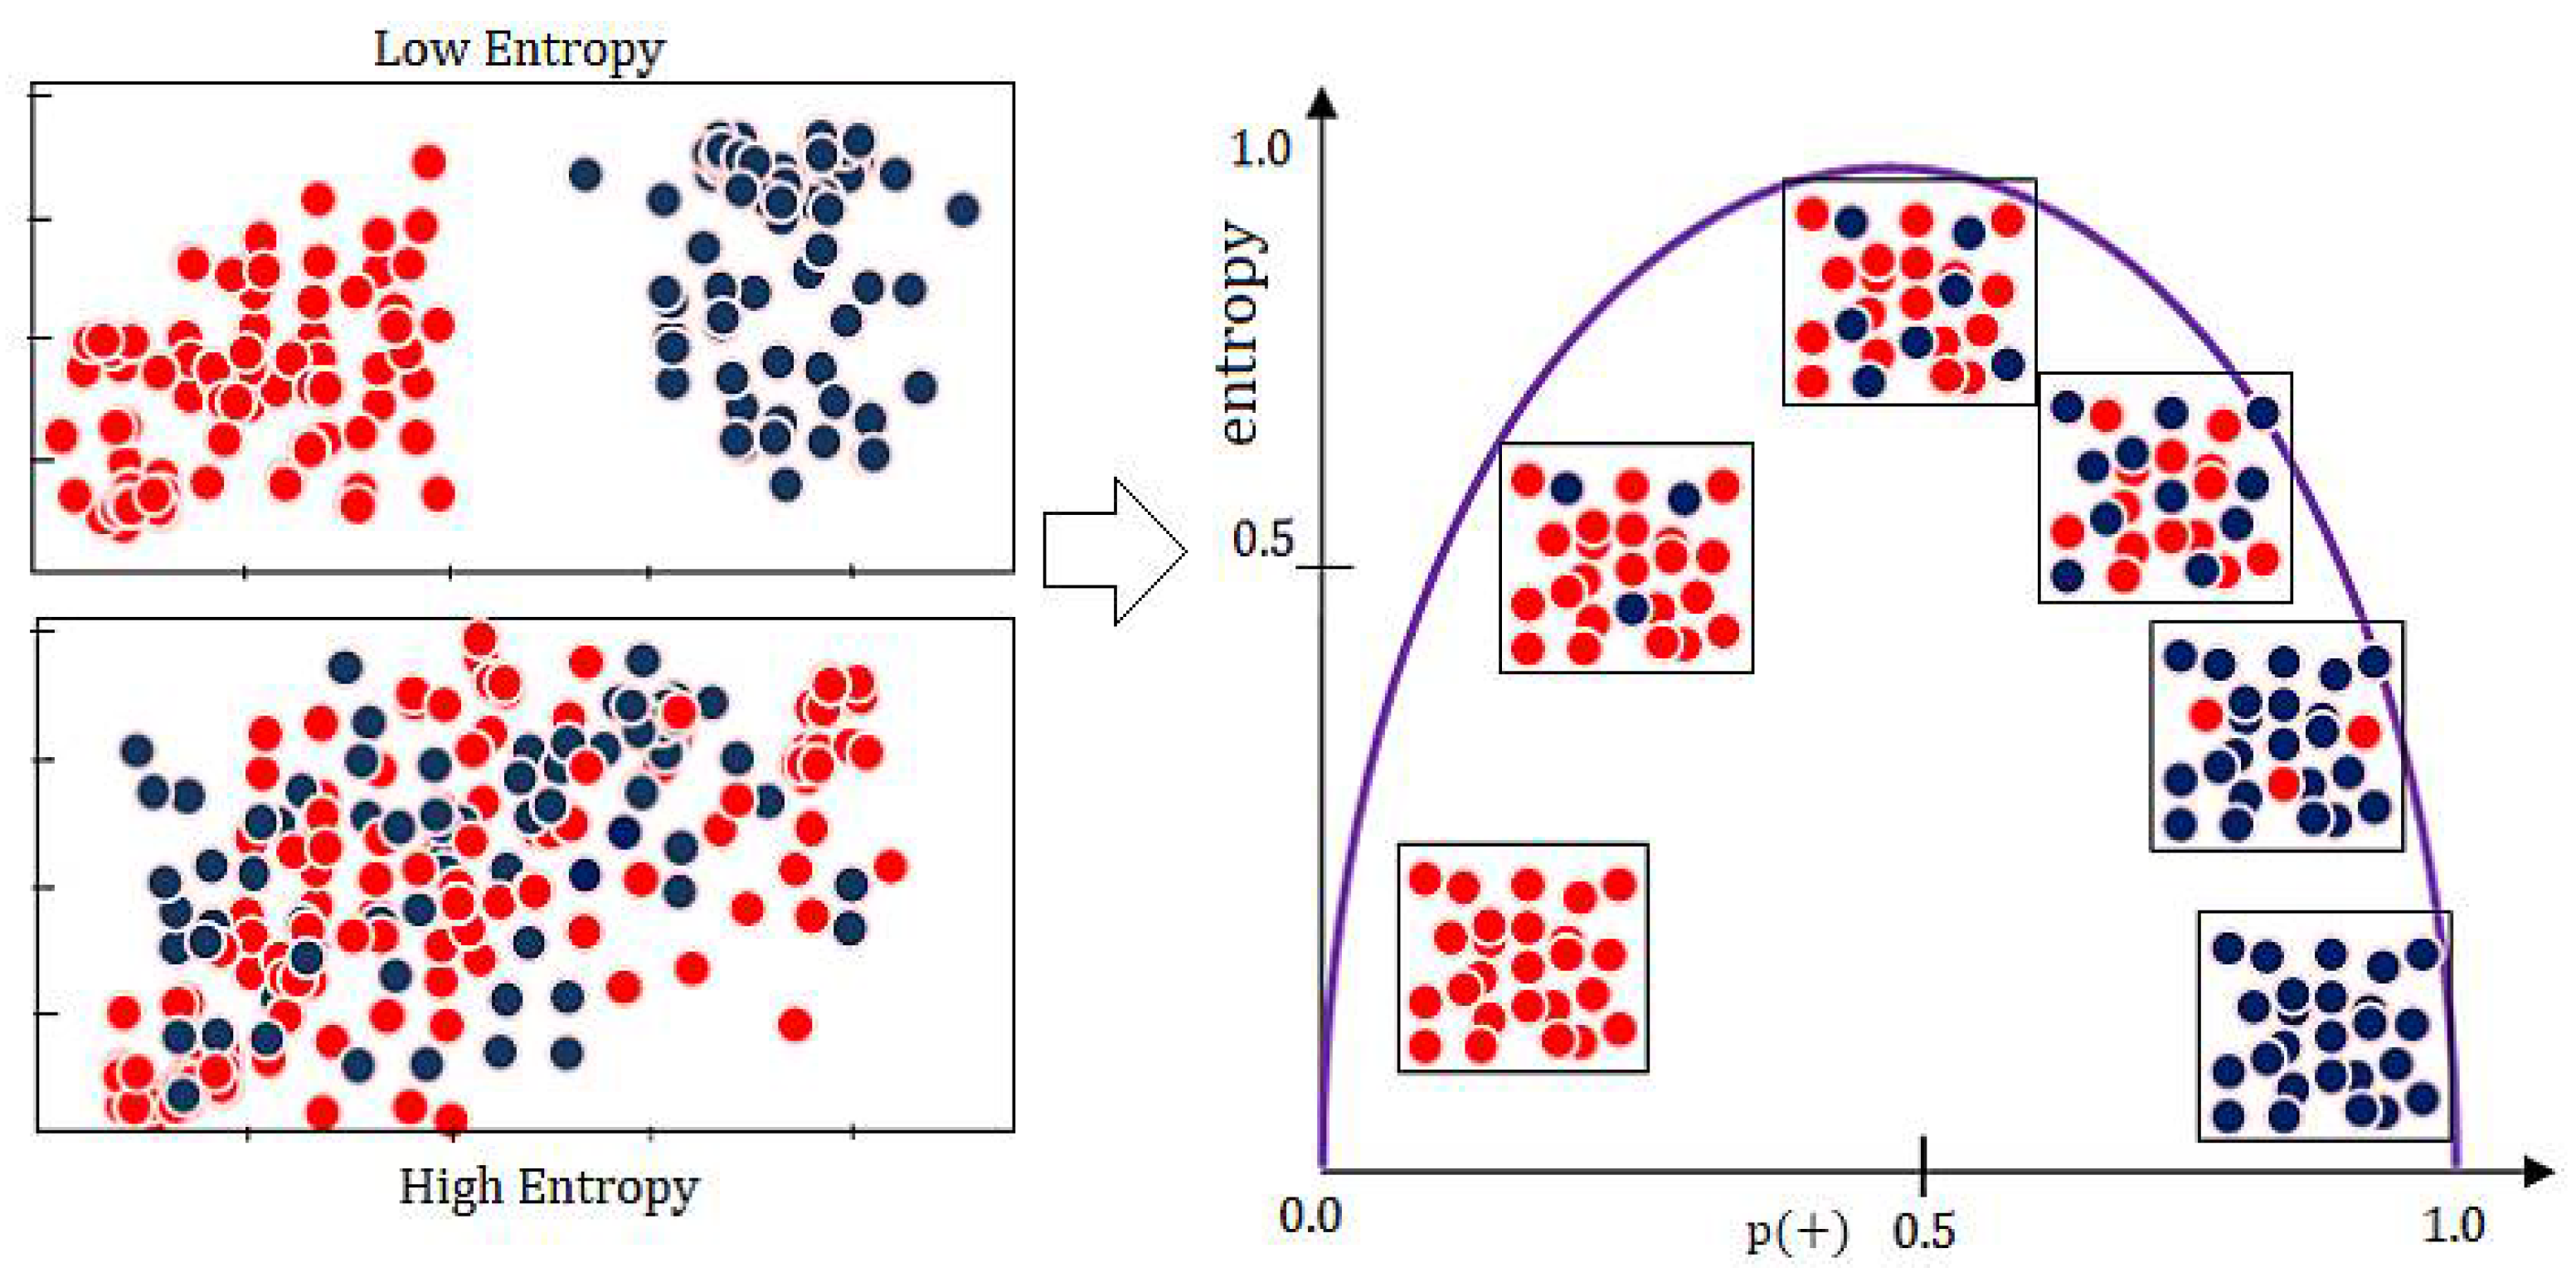
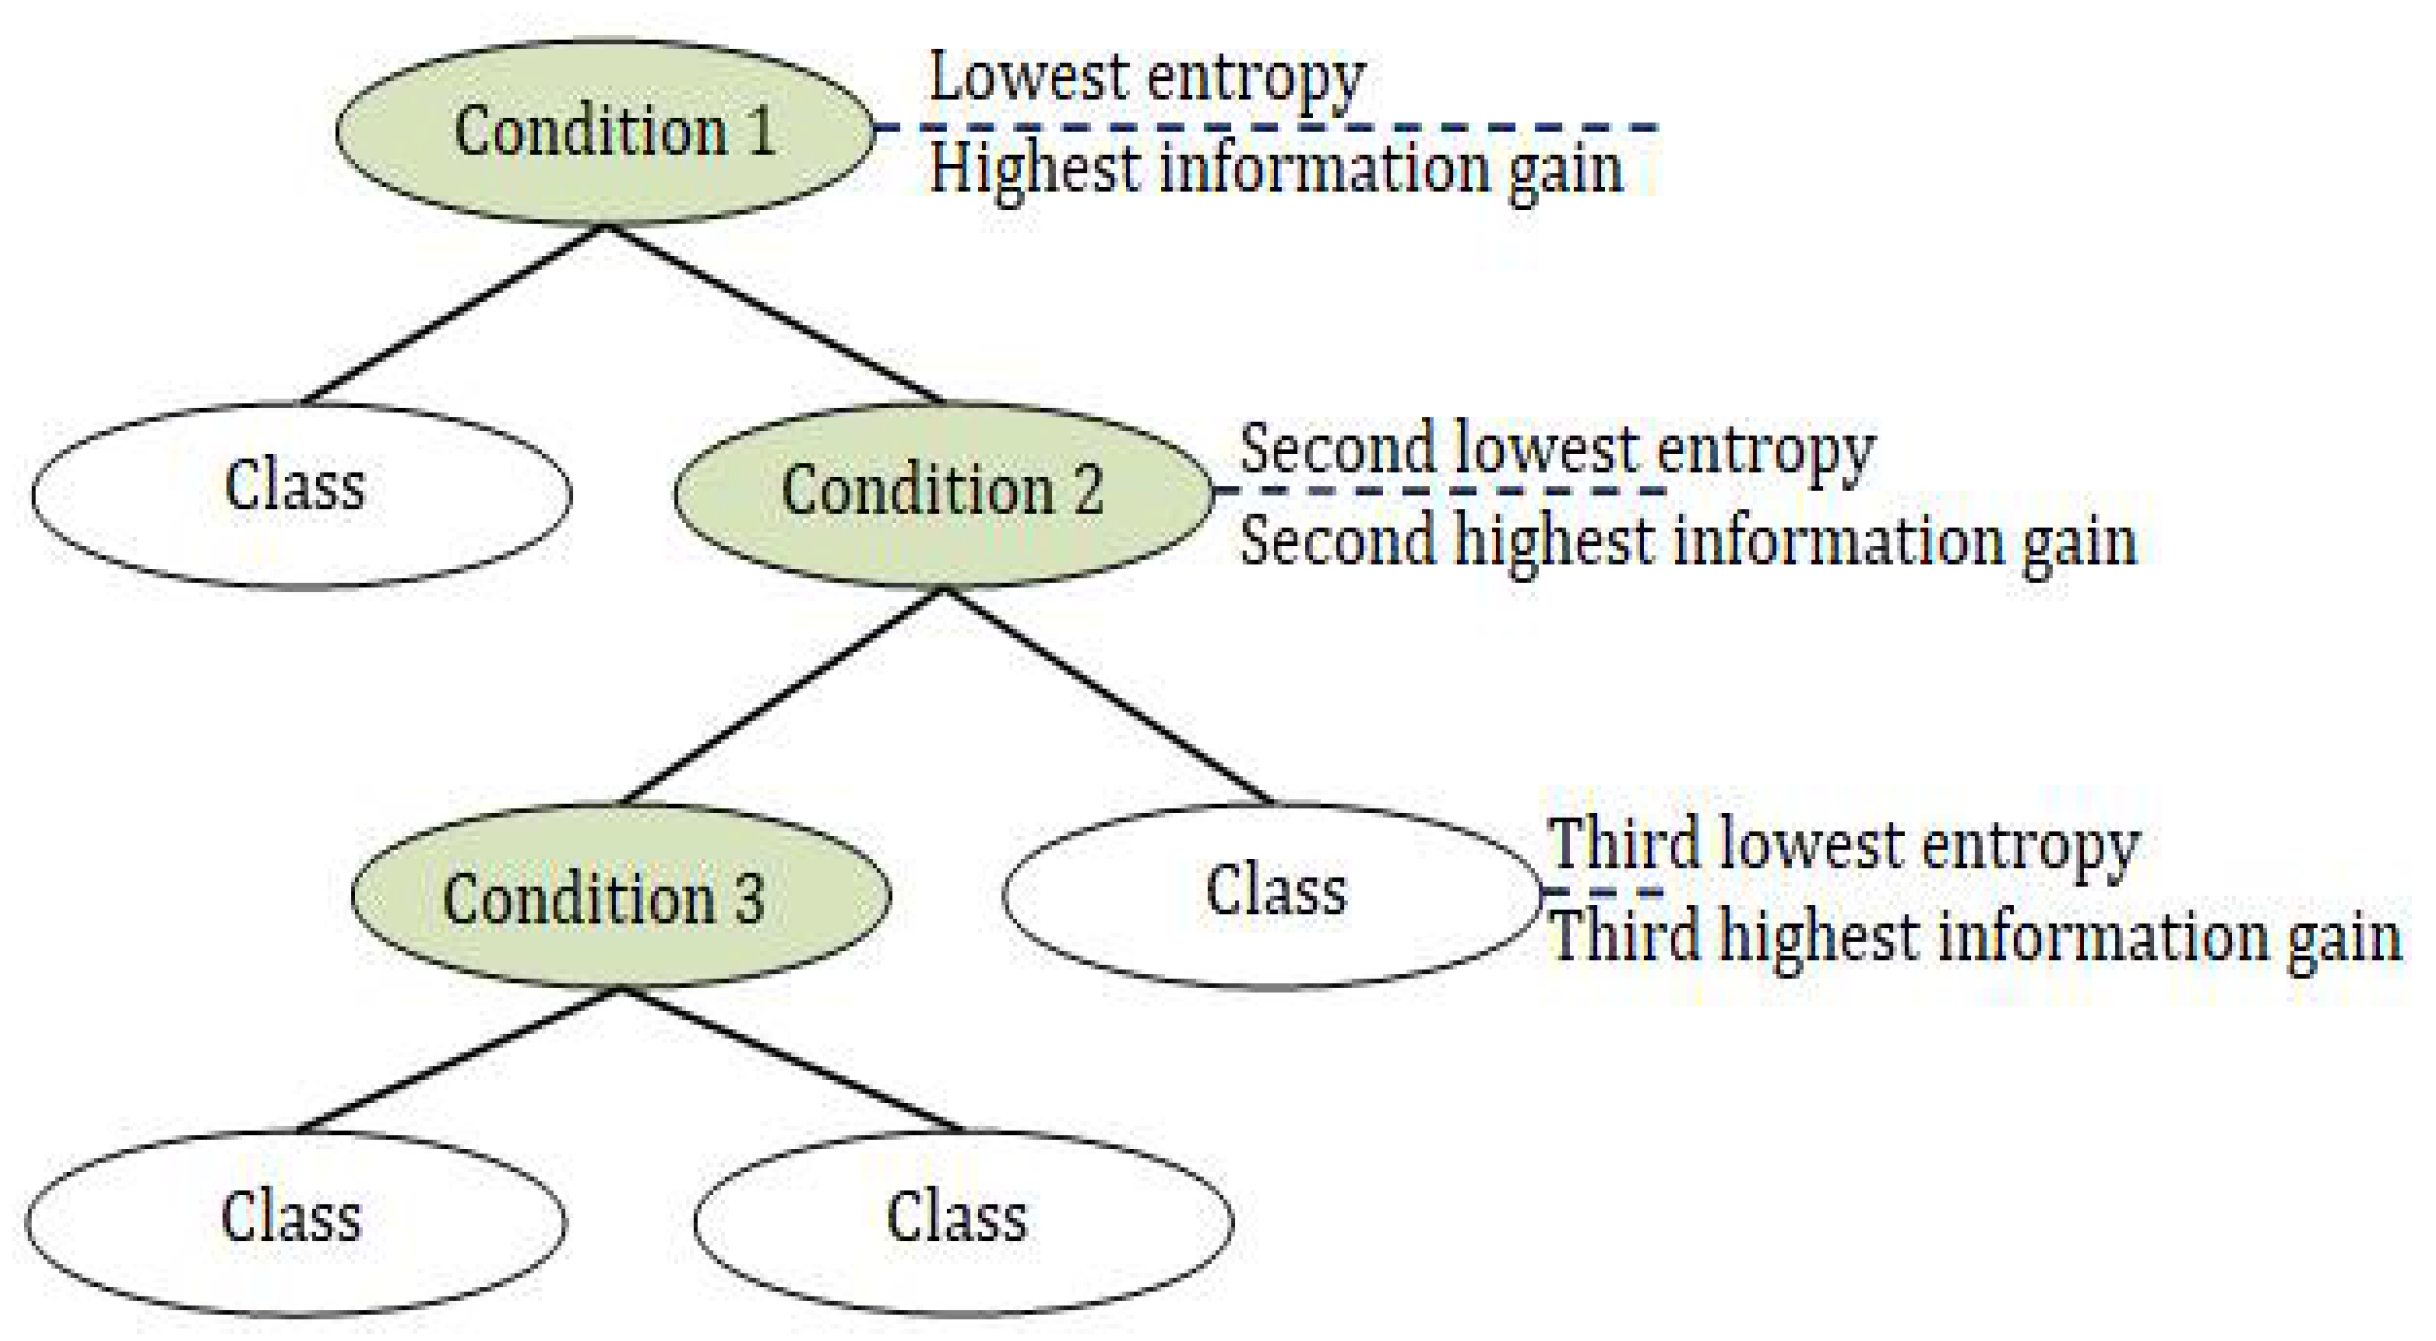
High entropy means low information gain, and low entropy means high information gain (Figure 9).
Such a limit point is selected for a particular attribute which minimizes the value of the conditional entropy. In order to most efficiently direct the input data through a series of conditions to the correct result, feature (condition) fragments with lower entropy (higher information gain) are placed higher on the tree.
Step 3: Generating induction trees
Decision trees make use of entropy in their construction: in order to most efficiently direct input data through a series of conditions to the correct outcome, feature (condition) fragments with lower entropy (higher information gain) are placed higher on the tree (Figure 10).
Step 4: Rule generation for PC Shell system
A method of inference is used, among others, a recursion mechanism, similar to that found in prolog systems. In the PC Shell system, there are different methods of knowledge representation:
-
Declarative in the form of rules and facts;
-
Triple: object, attribute, value;
-
Imperative in the form of an algorithmic program;
-
Knowledge in the form of texts;
-
Distributed knowledge in a neural network;
-
The possibility of dividing the knowledge base into a number of knowledge sources.
For each of the trees, rules are created.
Step 5: Searching the induction tree using rules in order to generate the best answer. Determination of the optimal objective function.
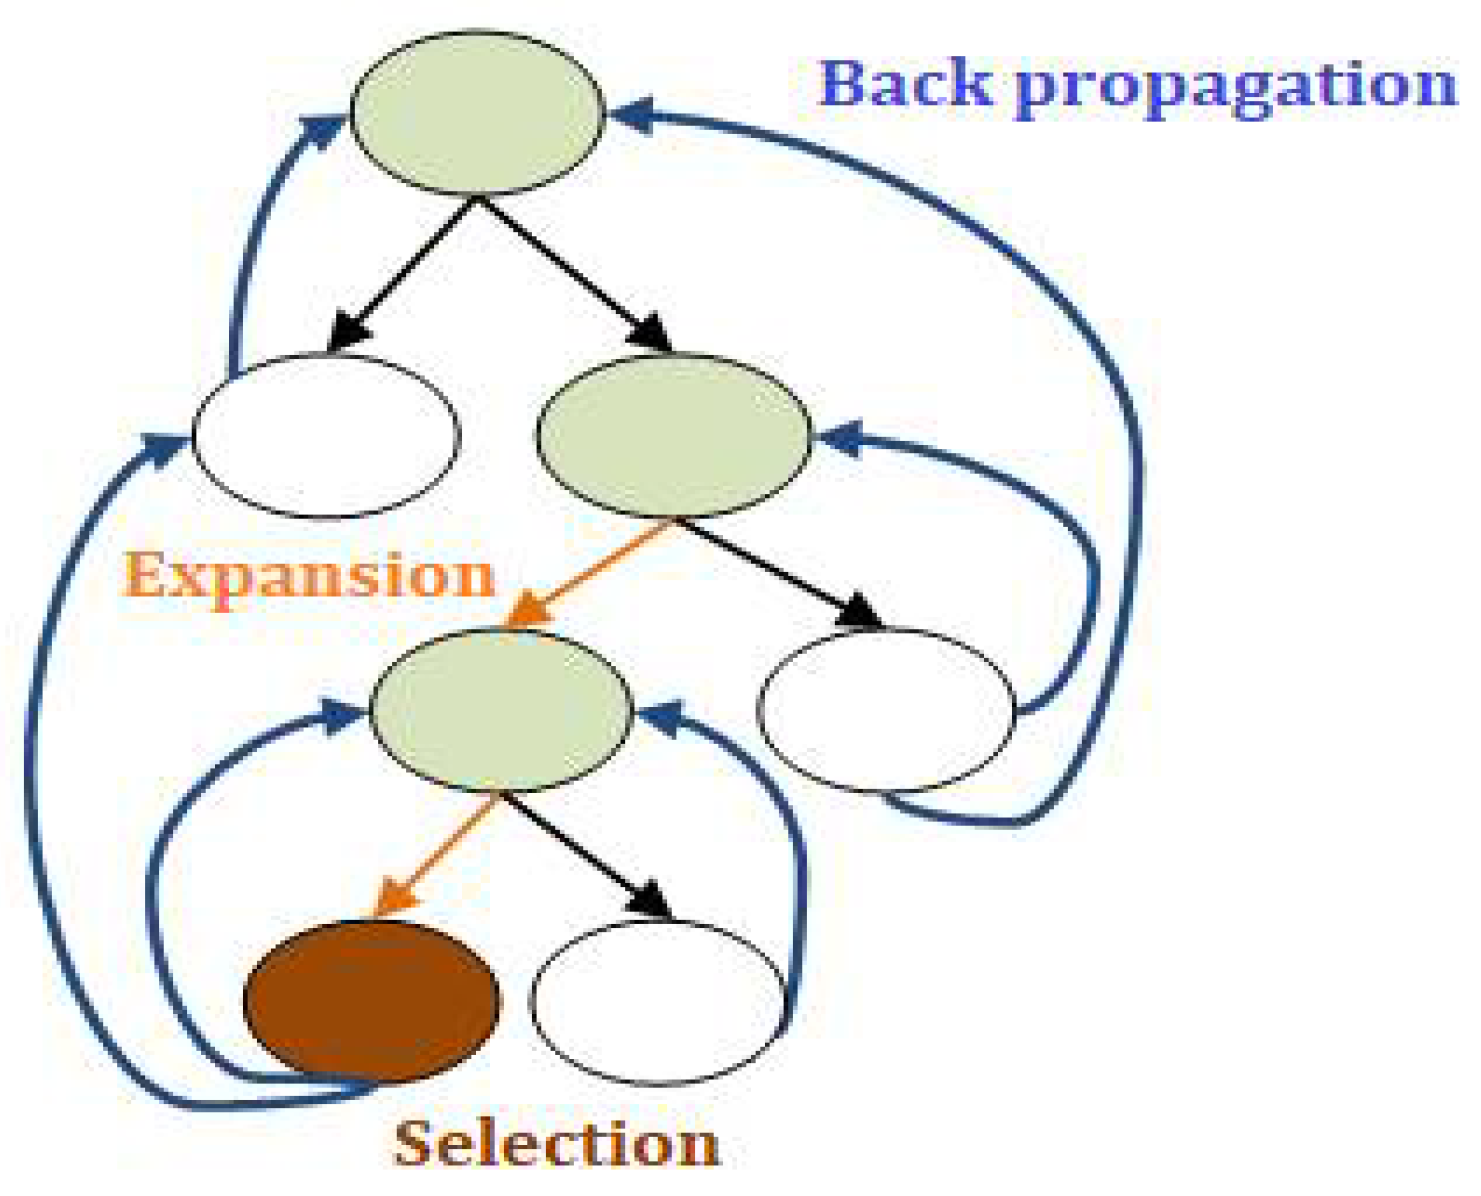
Each induction tree is searched for the best fit of the criterion function (Figure 11).
The algorithm starts at the root node (selecting some arbitrary node as the root node in the case of a graph) and explores as far as possible along each branch before backtracking.
The system recursively calculates at each split until the maximum depth is reached. The choice of maximum depth is very important and significantly affects how our model may under- or over-fit the data.
Tree depth analysis allows you to optimally adjust the criterion function (Figure 12).
Finally, the measurement points that have the greatest influence on the fulfillment of the criterion function are determined.

4.1.2. Calculation Example

In the case of the article, for example:
-
the input attributes (in) are the following parameters: x1 = n, x2 = pt, x3 = Qrz, x4 = M, x5 = Nm, x6 = Nh.
-
the output parameter (out) is the total efficiency ηc.
Calculation of entropy: first level:
η acceptable = ( 9 14 ) log 2 ( 9 14 ) = 0.41 η unacceptable = ( 5 14 ) log 2 ( 5 14 ) = 0.53 E ( S ) = η acceptable + η unacceptable = 0.94
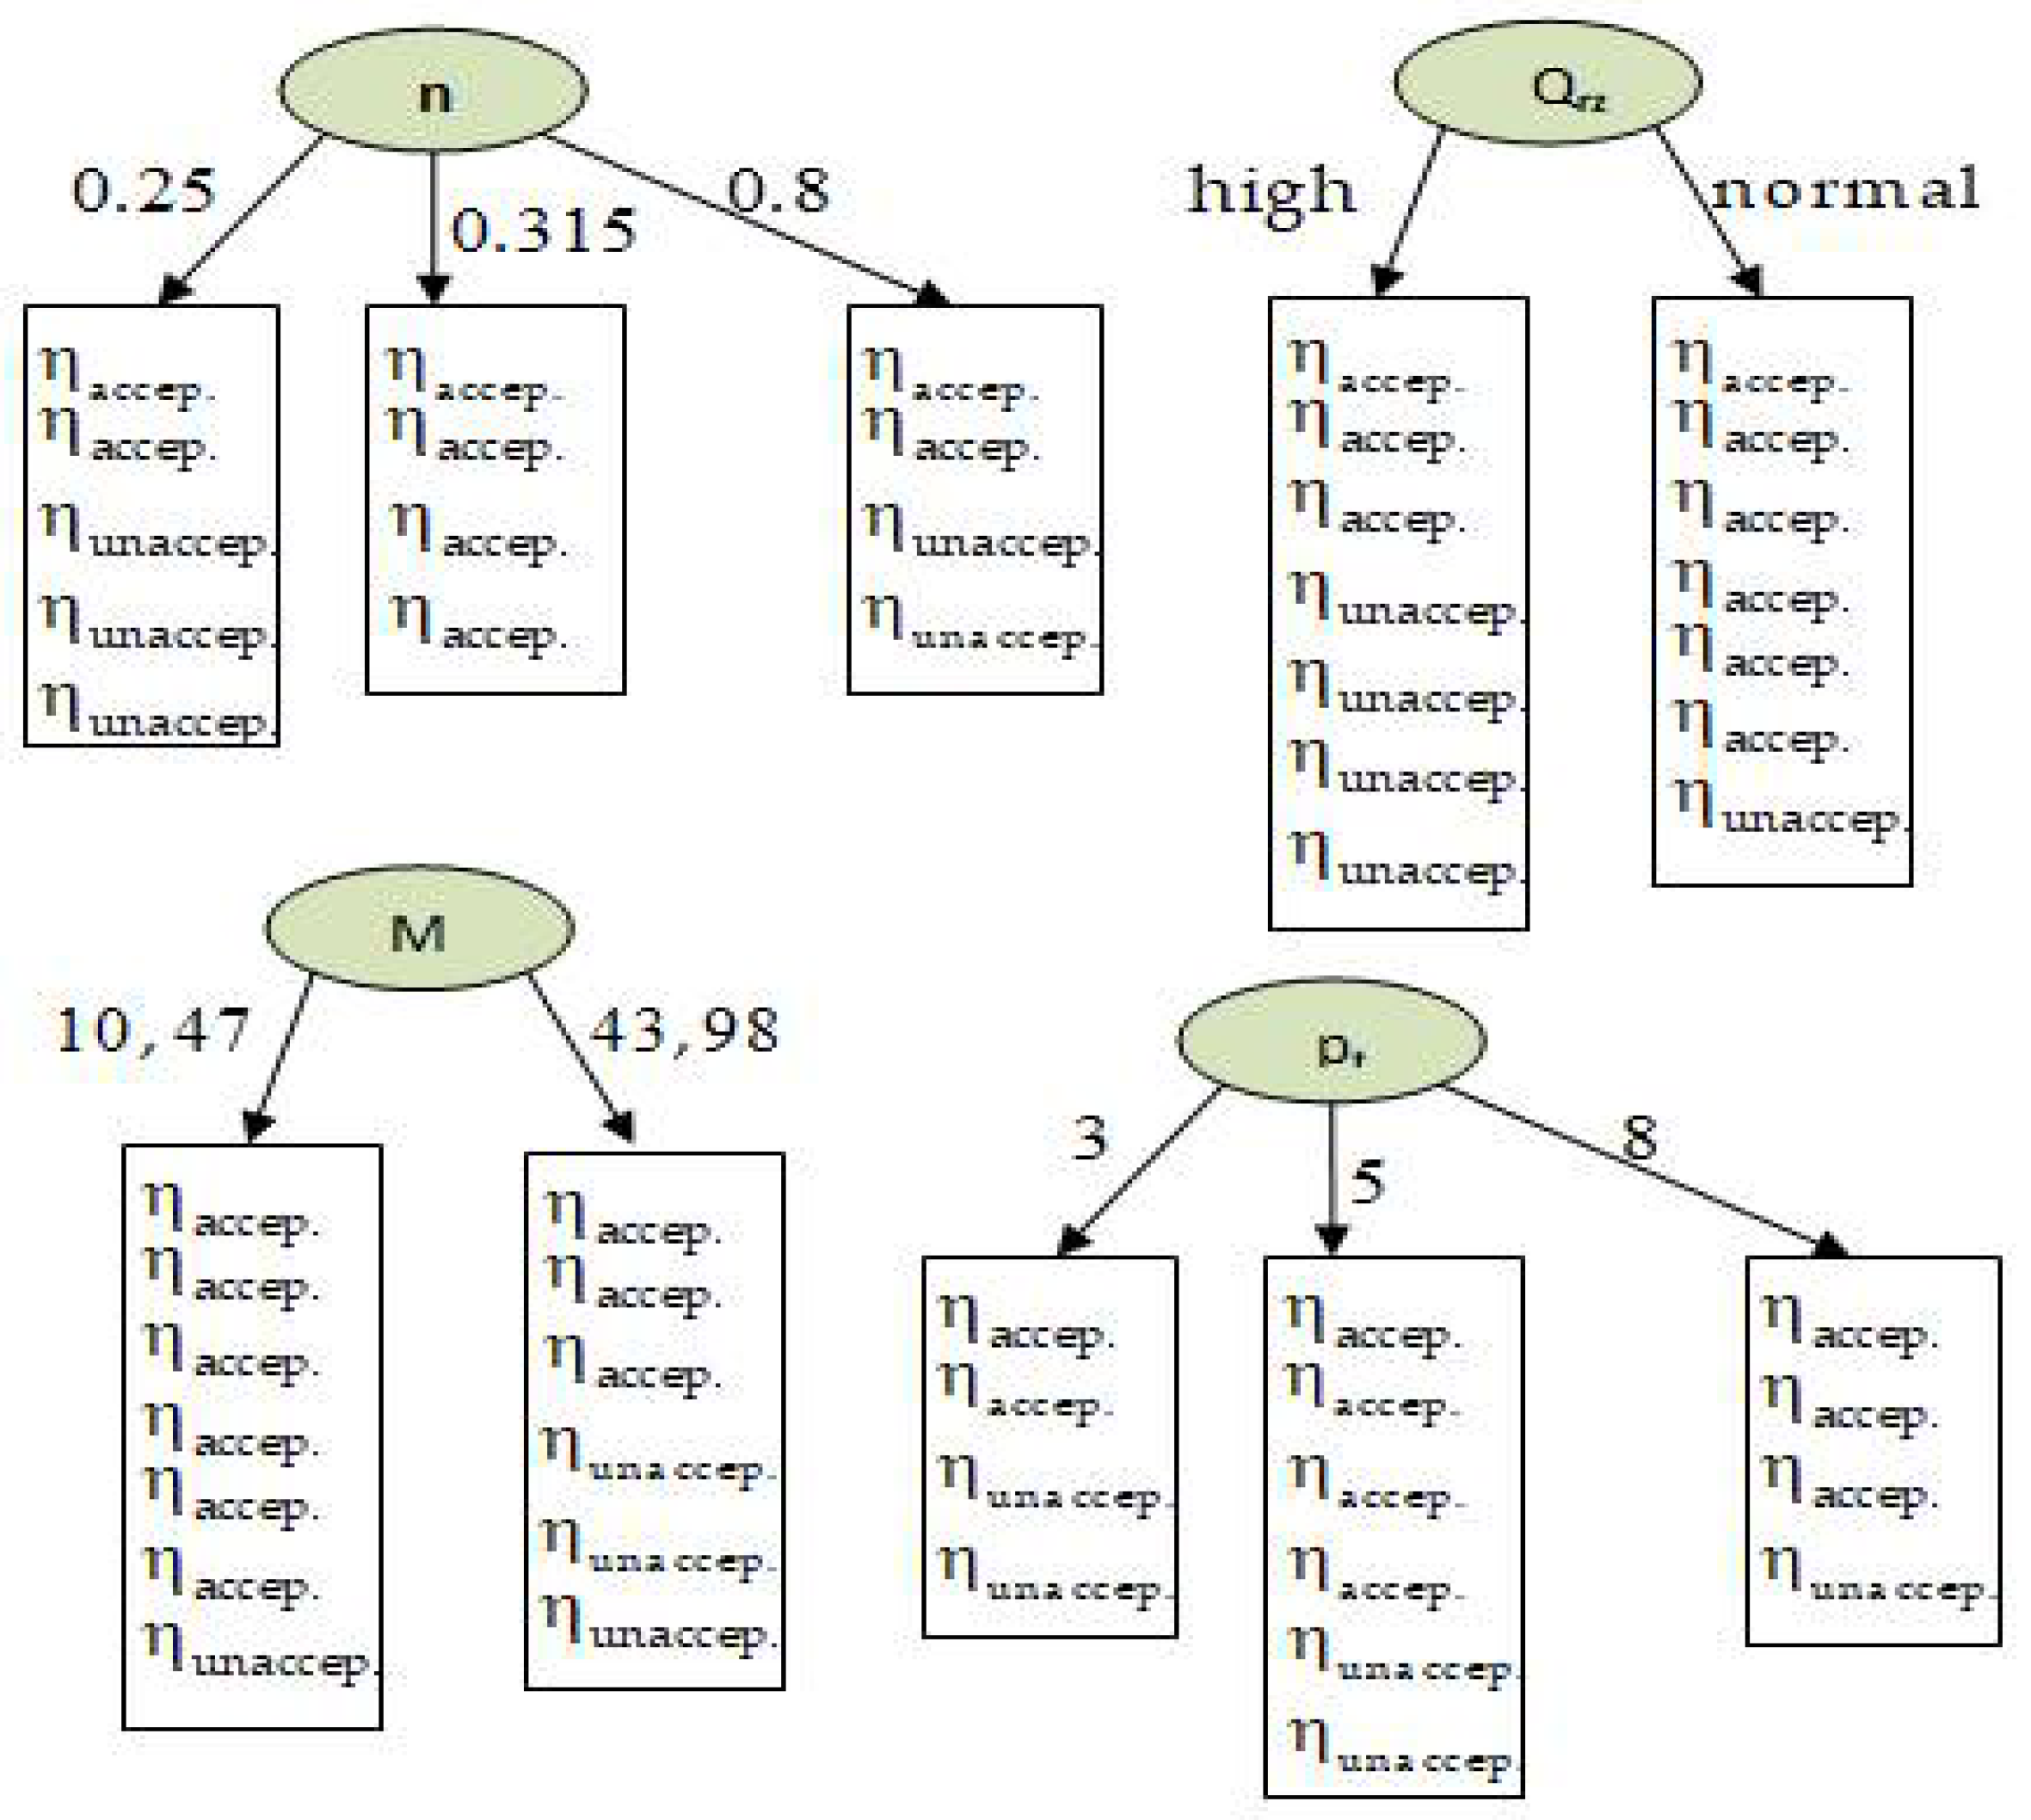
Figure 13 shows decision tree generation at the first level.
Calculation of entropy: second level:
inf o ( [ 2 , 3 ] ) = e n t r o p y ( 2 5 , 3 5 ) = 2 5 log 2 ( 2 5 ) 3 5 log 2 ( 3 5 ) = 0.971
info ( [ 4 , 0 ] ) = e n t r o p y ( 1 , 0 ) = 1 log 2 ( 1 ) 0 log 2 ( 0 ) = 0
Note: log(0) is not defined but we evaluate 0 ∗ log(0) as zero.
inf o ( [ 3 , 2 ] ) = e n t r o p y ( 3 5 , 2 5 ) = 3 5 log 2 ( 3 5 ) 2 5 log 2 ( 2 5 ) = 0.971
inf o ( [ 3 , 2 ] , [ 4 , 0 ] , [ 3 , 2 ] ) = ( 5 14 ) × 0.971 + ( 4 14 ) × 0 + ( 5 14 ) × 0.971 = 0.693
Information gain (information before split):
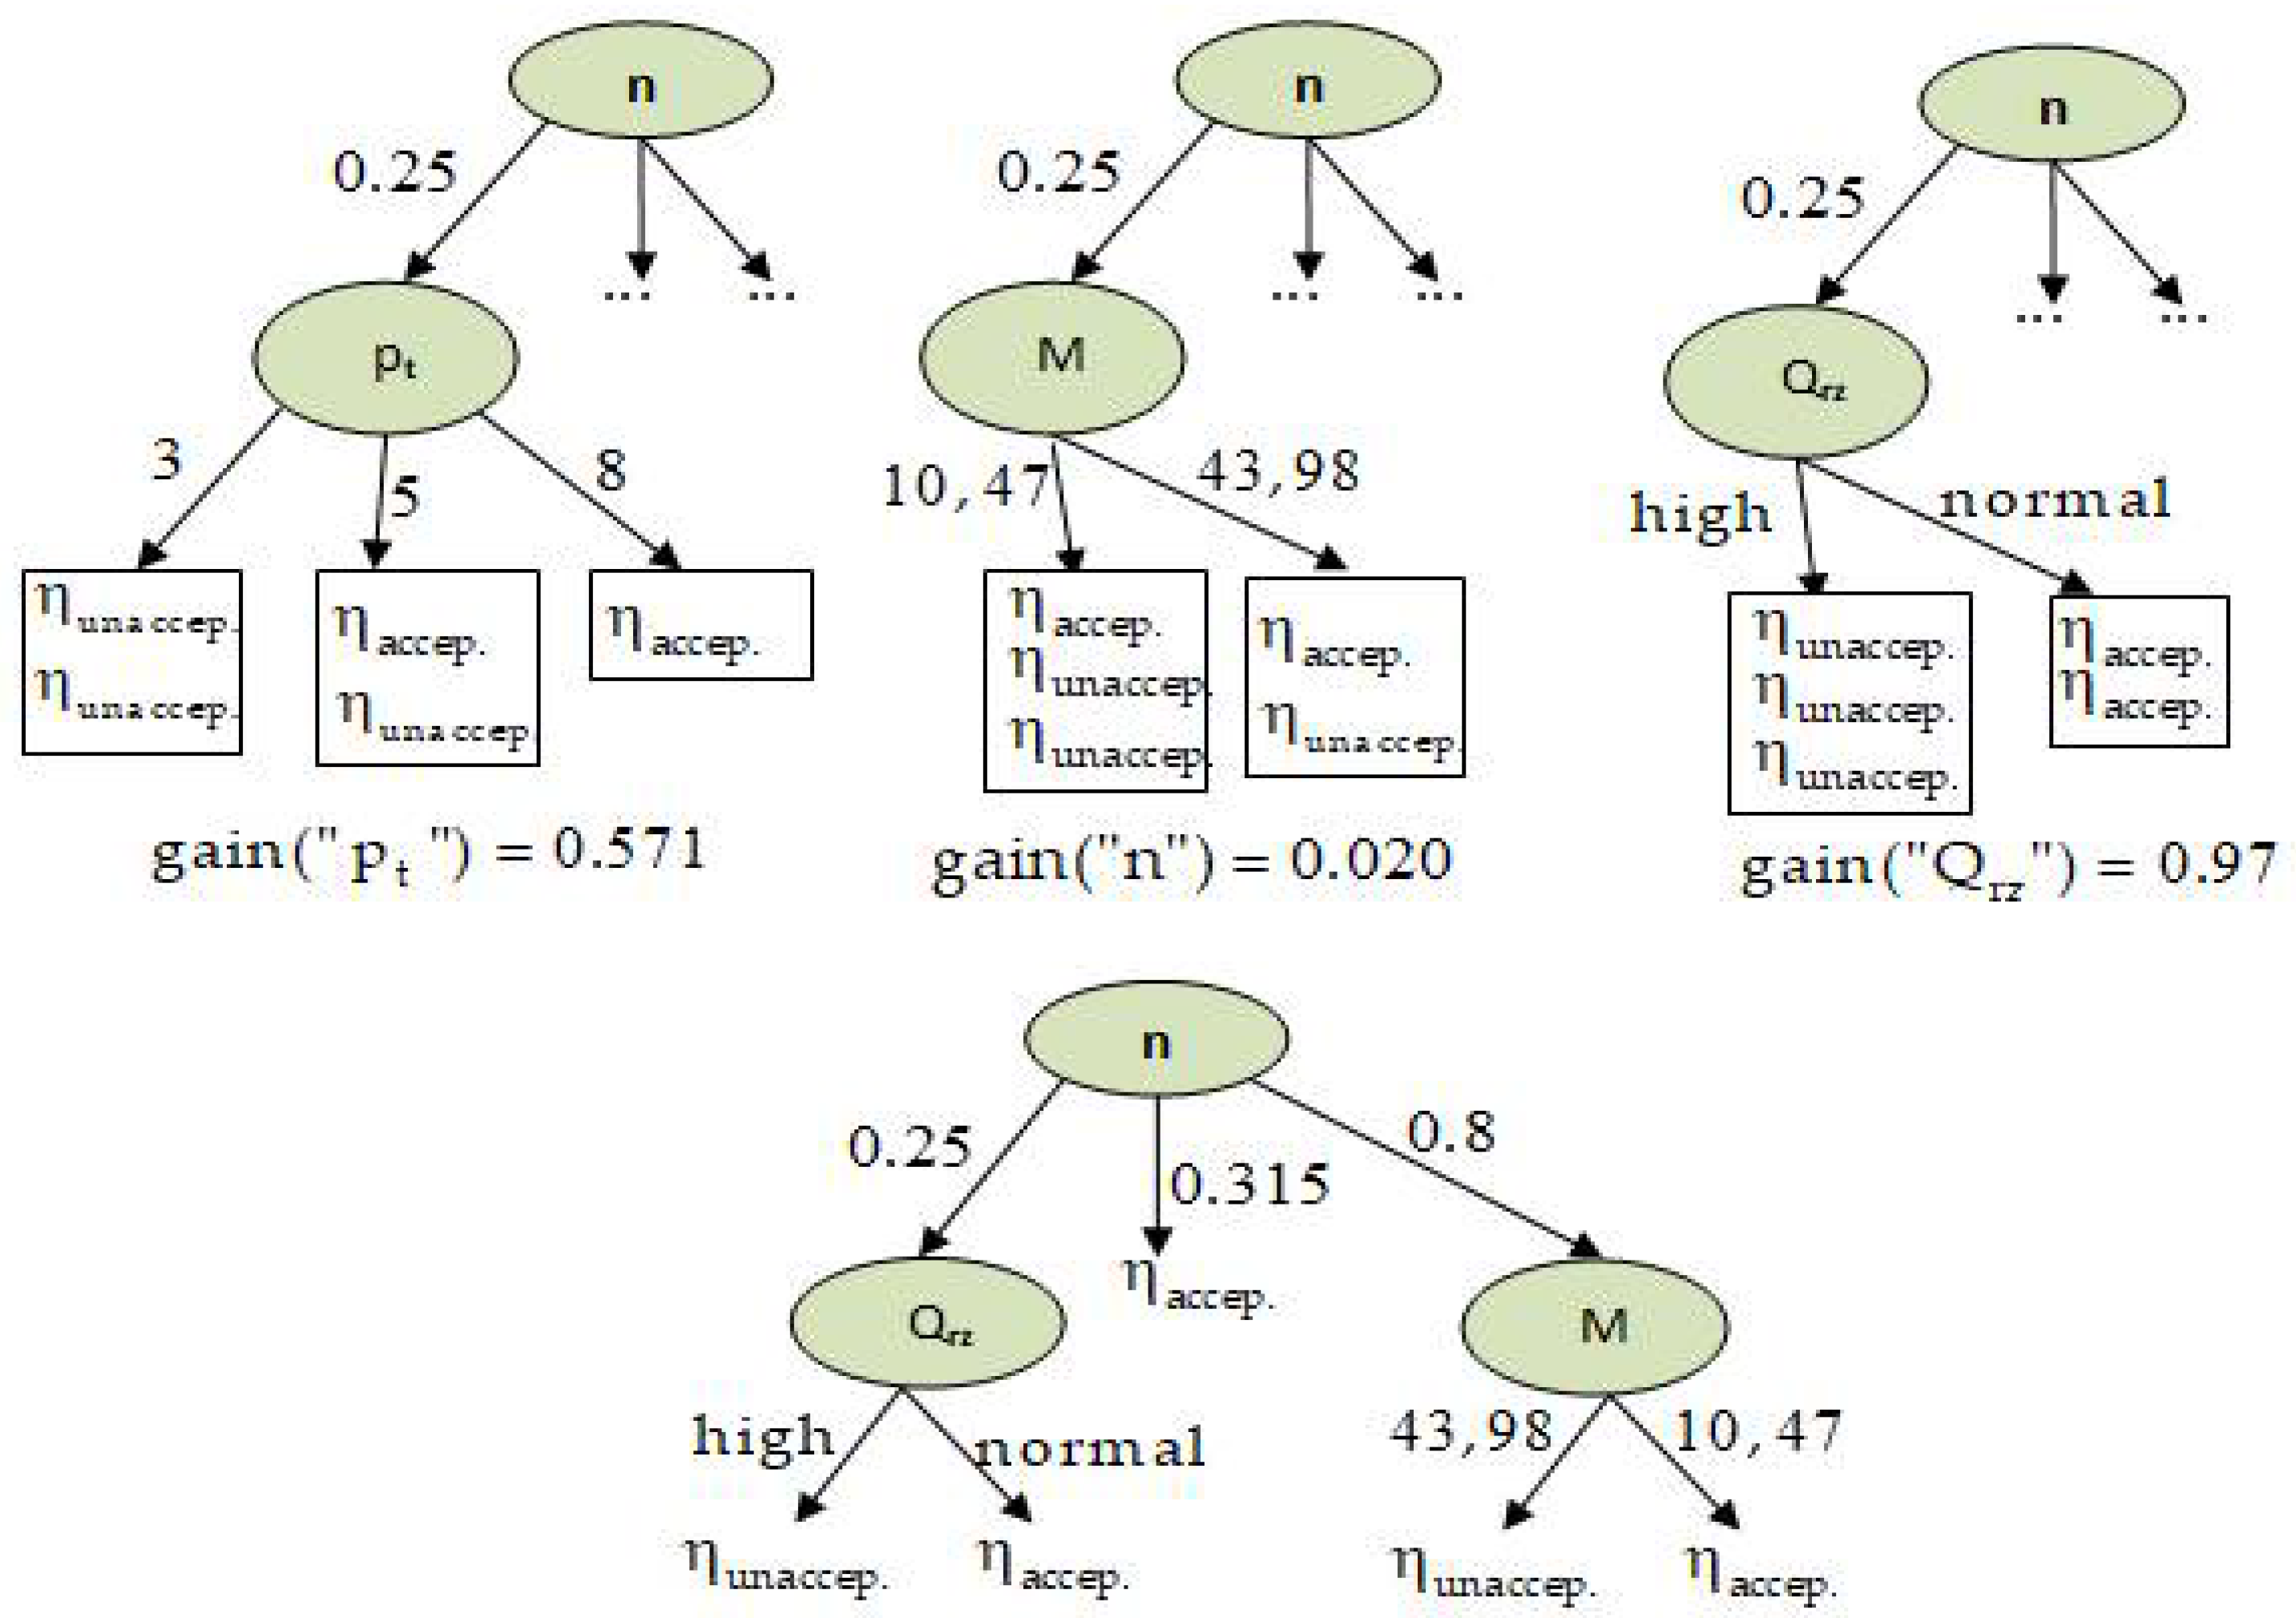
g a i n ( n ) = inf o ( [ 9 , 5 ] ) inf o ( [ 2 , 3 ] , [ 4 , 0 ] , [ 3 , 2 ] ) = 0.940 0.693 = 0.247
Information gain for sample data:
g a i n ( n ) = 0.247 g a i n ( p t ) = 0.029 g a i n ( Q r z ) = 0.152 g a i n ( M ) = 0.048
Figure 14 shows decision tree generation at the second level.
Examples of rules generated for the induction trees in Figure 14 are shown in Supplementary Materials File S2.
The application of the network would ultimately allow determination of the most important values of parameters q and n affecting each other from the point of view of optimal total efficiency ηc for both oils.
The following assumptions were made:
  • The input attributes (in) are the following parameters: x1= n, x2 = pt, x3 = Qrz, x4= M, x5 = Nm, x6 = Nh.
  • The output parameter (out) is the total efficiency ηc.
As schematically shown in Figure 15, three analyses were performed.
I. 
Microanalysis
Analysis performed:
  • separately for each of the instantaneous specific deliveries—0.25 cm3/rev; 0.315 cm3/rev; 0.5 cm3/rev; 0.8 cm3/rev; and 1.0 cm3/rev.
  • separately for two types of oil: Azolla ZS type 22 and HL 68
  • the efficiency values were divided into 10 groups
The analysis provided a set of 10 induction trees.
II. 
Microanalysis
Analysis performed:
  • in combination for all of the instantaneous specific deliveries—0.25 cm3/rev; 0.315 cm3/rev; 0.5 cm3/rev; 0.8 cm3/rev; and 1.0 cm3/rev.
  • separately for two types of oil: Azolla ZS type 22 and HL 68
  • the efficiency values were divided into X groups
The analysis provided a set of two induction trees.
III. 
Microanalysis
Analysis performed:
  • in combination for all of the instantaneous specific deliveries—0.25 cm3/rev; 0.315 cm3/rev; 0.5 cm3/rev; 0.8 cm3/rev; and 1.0 cm3/rev.
  • in combination for two types of oil: Azolla ZS type 22 and HL 68
  • the efficiency values were divided into X groups
The analysis provided one induction tree.
The solution space and decision tree induction were searched with the use of a modified module of the DeTreex expert software.
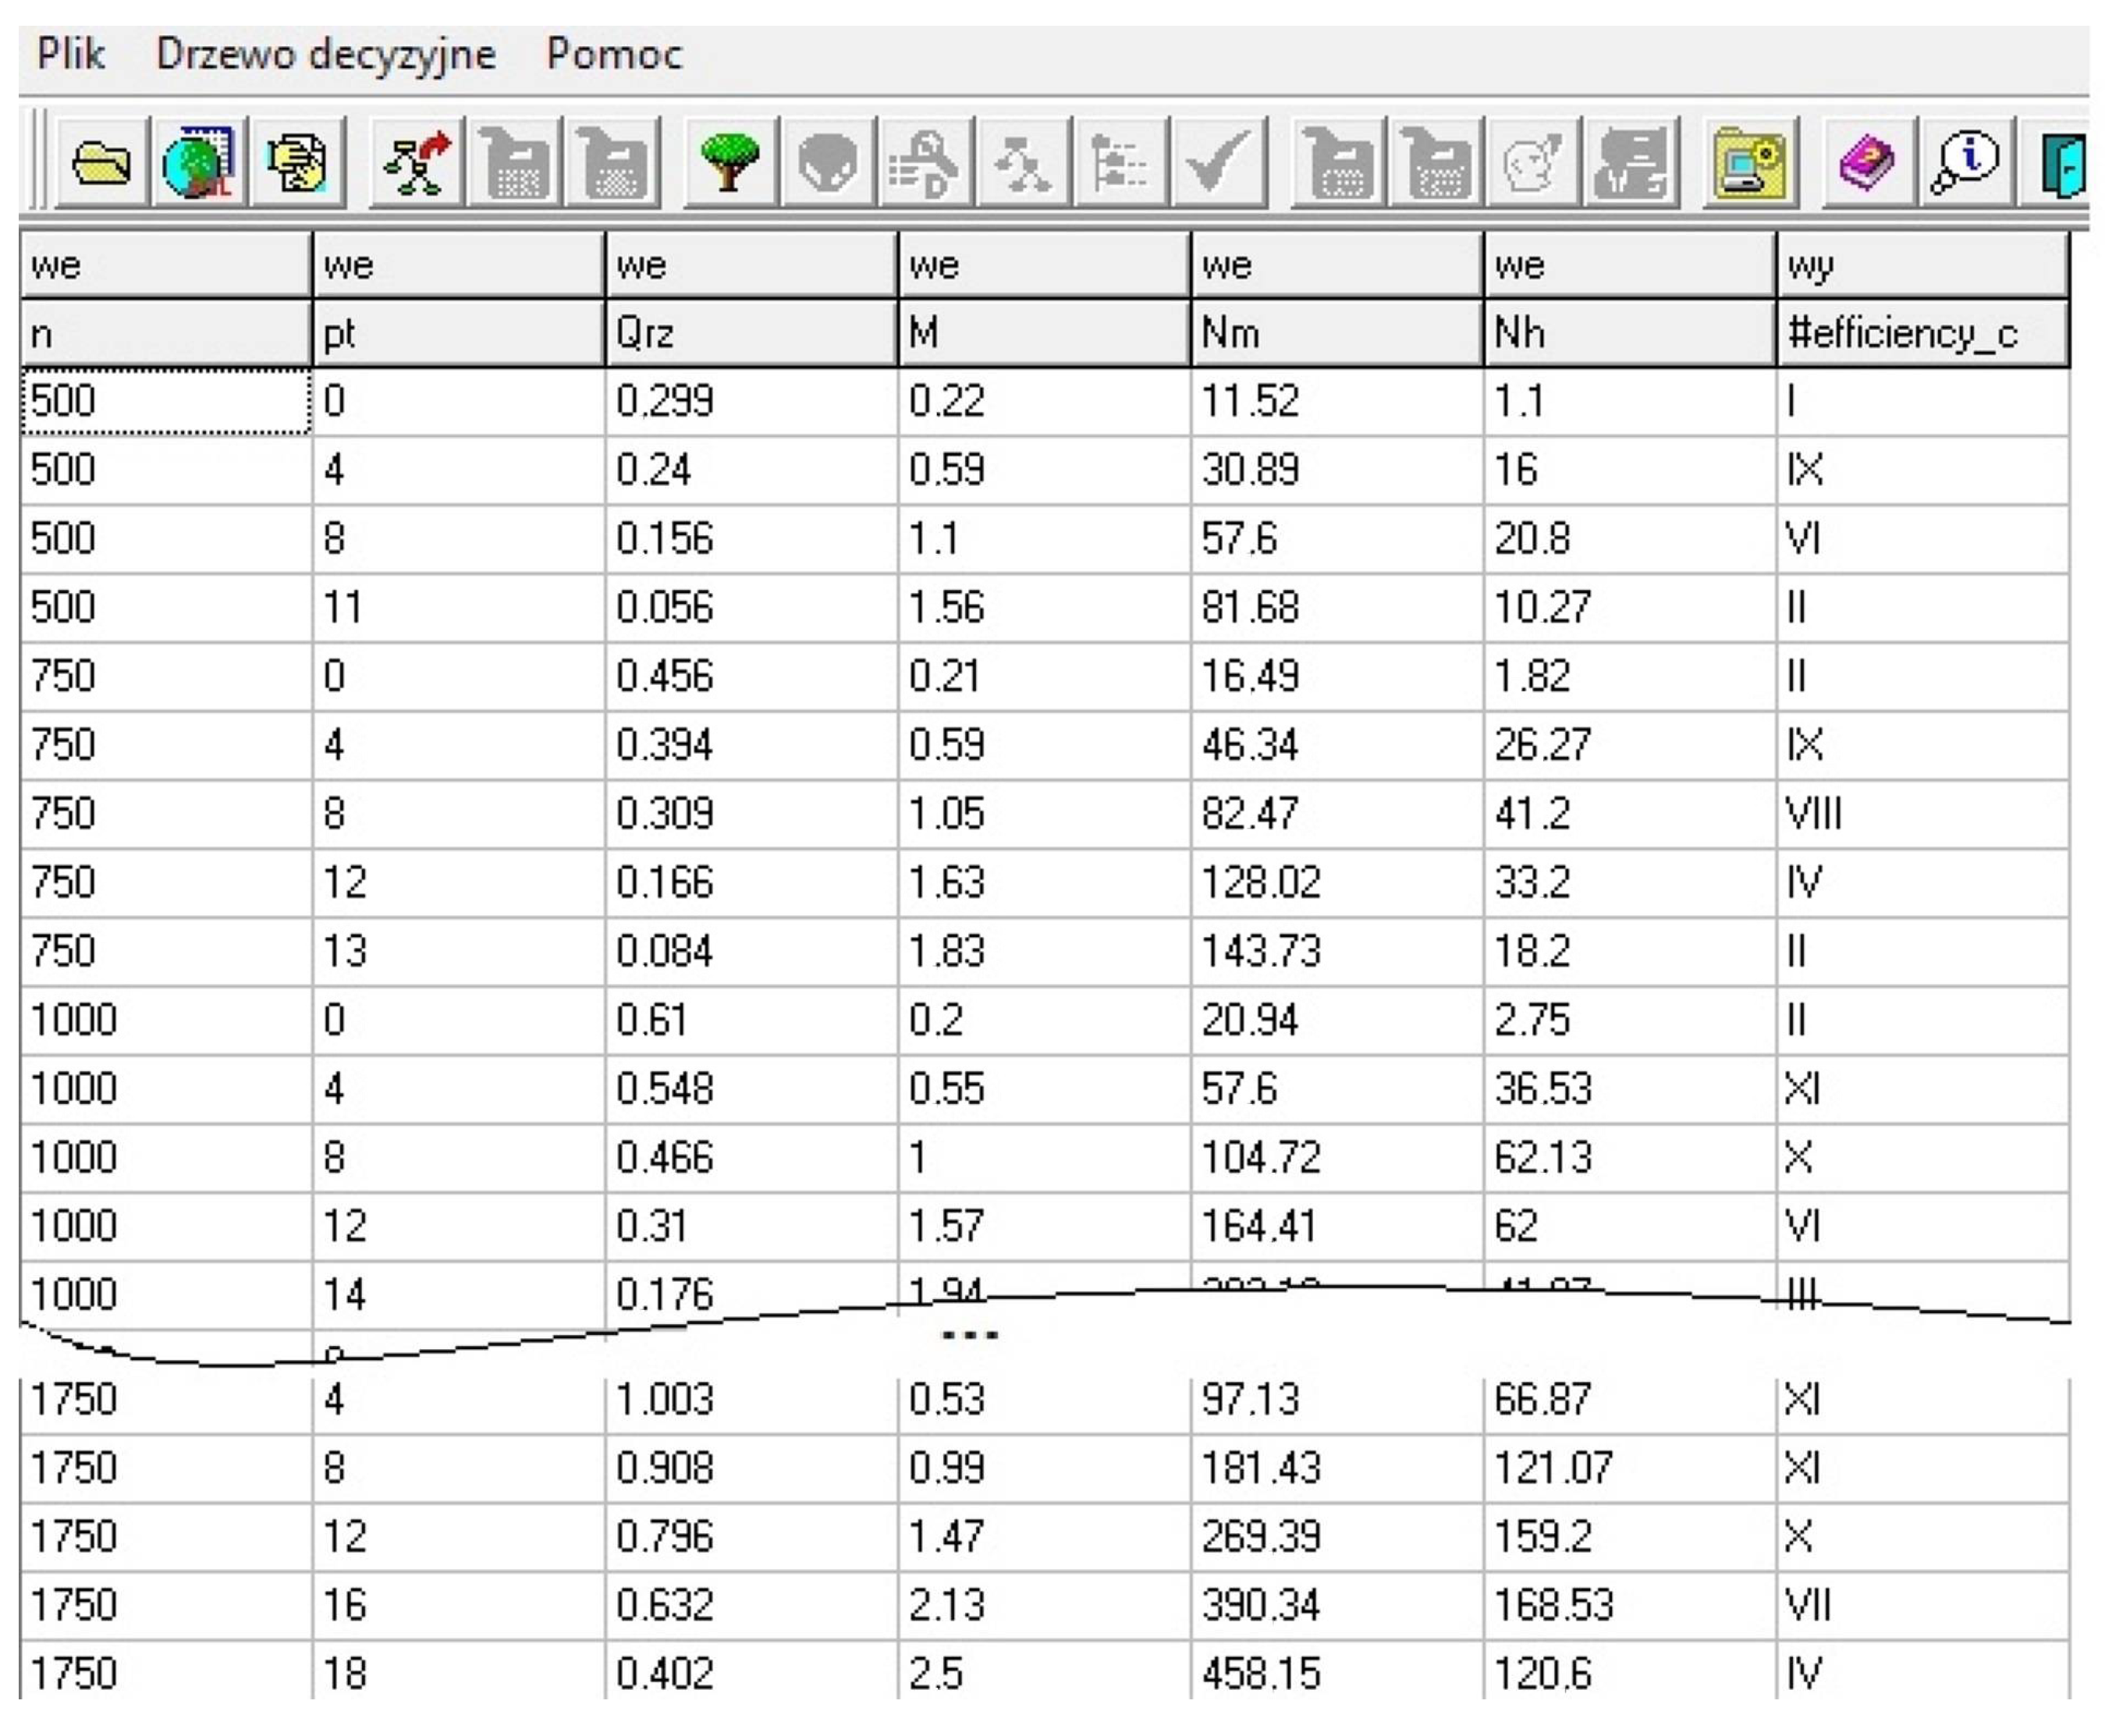
Figure 16 shows a table containing the training set (the .lrn file) for microanalysis 1, related to the specific delivery q = 0.5 cm3/rev for the oil Azolla ZS type 22.
On the other hand, Figure 17 shows a generated induction tree.
Figure 18 shows a table containing the training set (the .lrn file) for microanalysis 1, related to the specific delivery q = 0.8 cm3/rev for the oil Azolla ZS type 22.
Figure 19 shows the induction tree for the file of Figure 18.
An identical analysis was performed for the remaining values of specific delivery for microanalysis 1 and microanalysis 2.
In turn, Figure 20 shows a fragment of the induction tree for microanalysis 3, in combination for all of the instantaneous specific deliveries—0.25 cm3/rev; 0.315 cm3/rev; 0.5 cm3/rev; 0.8 cm3/rev; and 1.0 cm3/rev—and in combination for two types of oil: Azolla ZS type 22 and HL 68.
Each of the trees corresponds to a rule-based notation generated in PC Shell. The “fast” induction tree generation algorithm is presented in Supplementary Materials File S3.
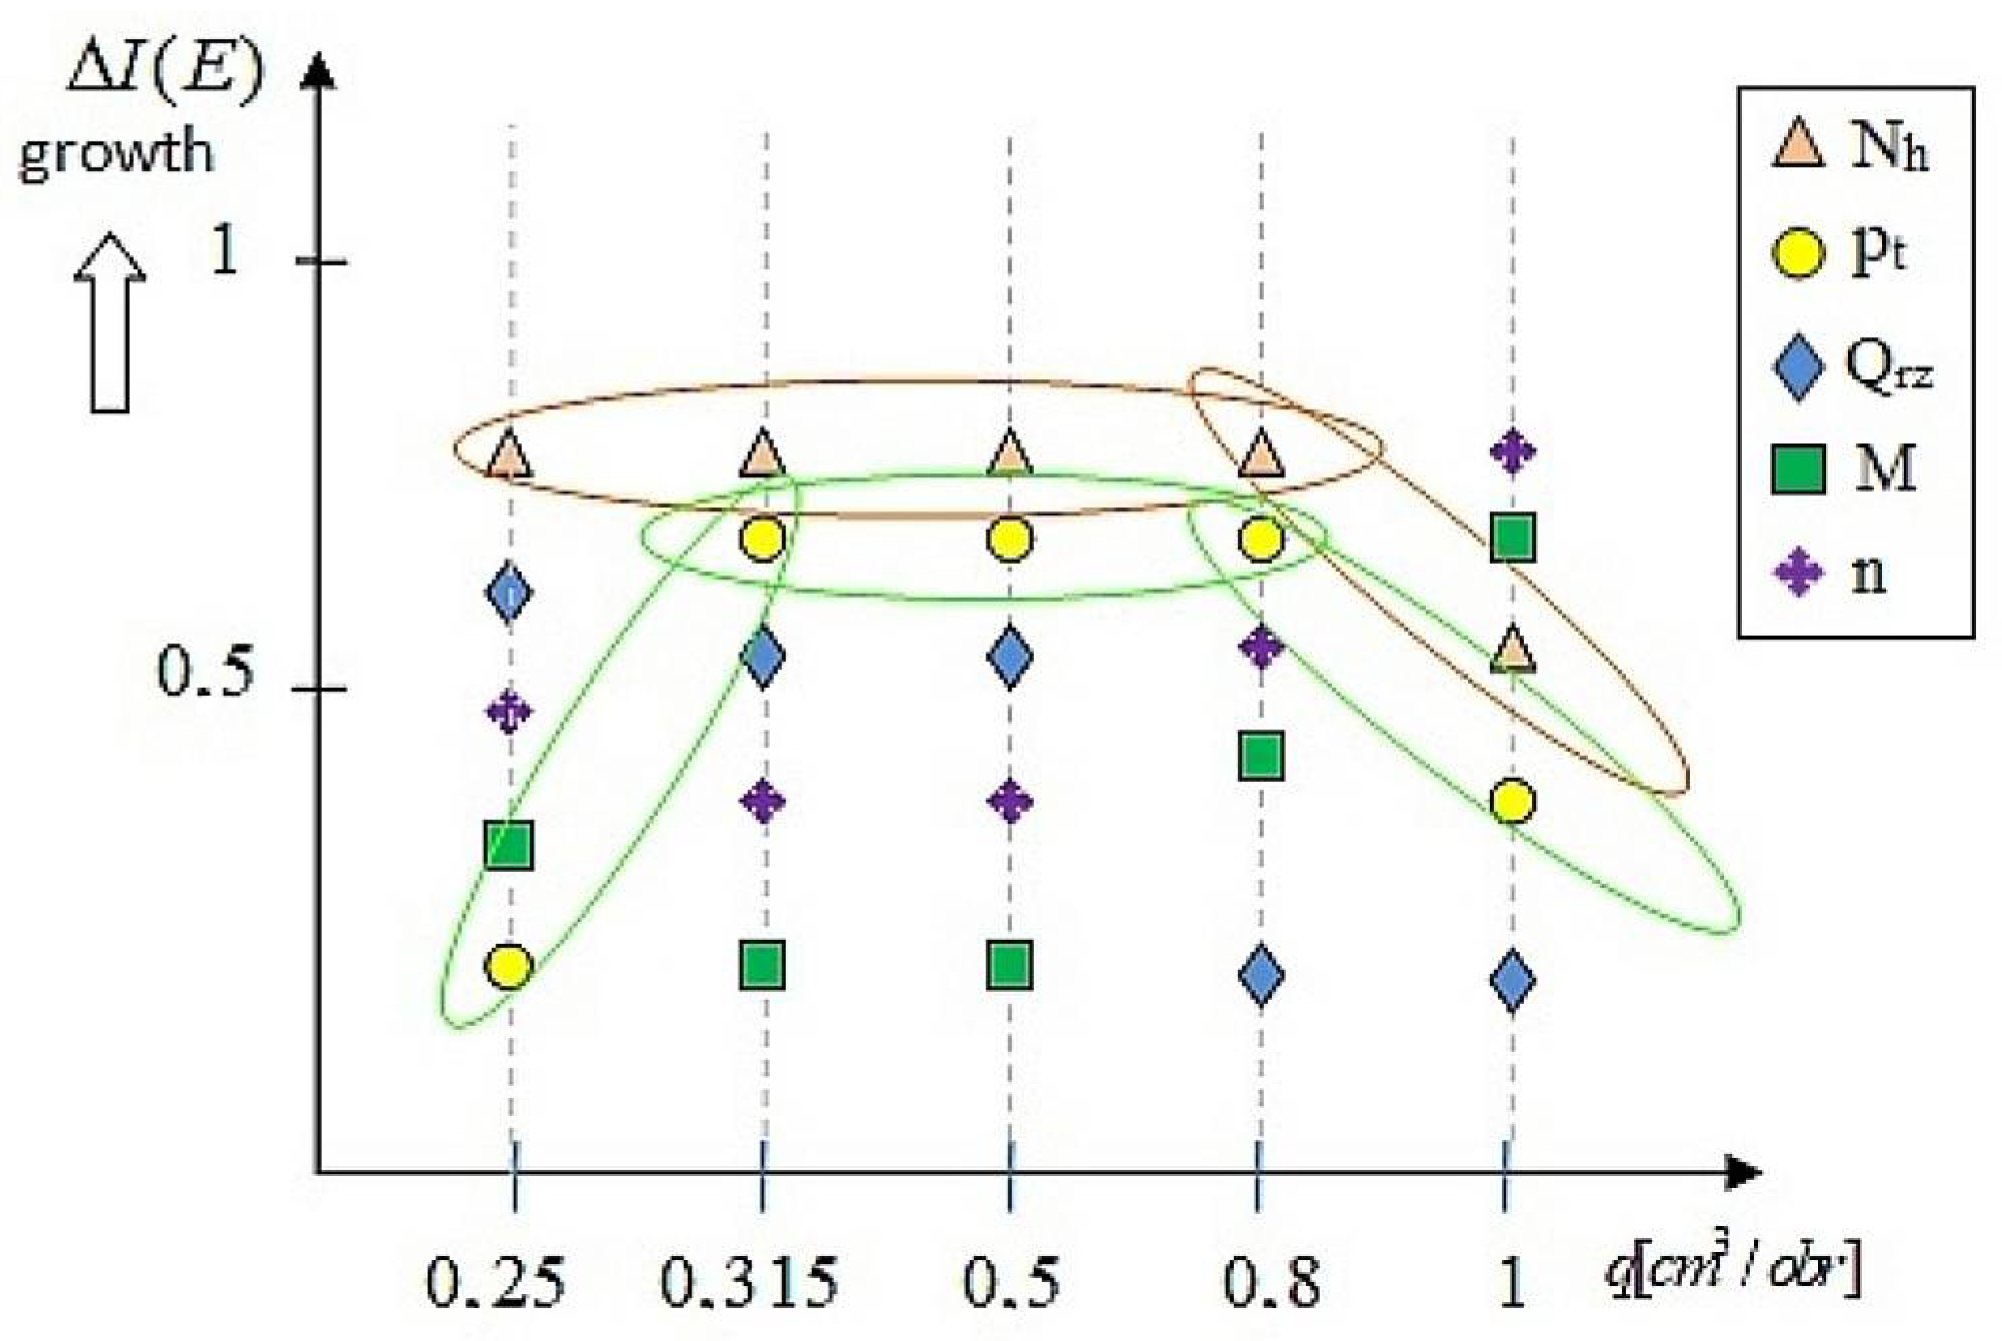
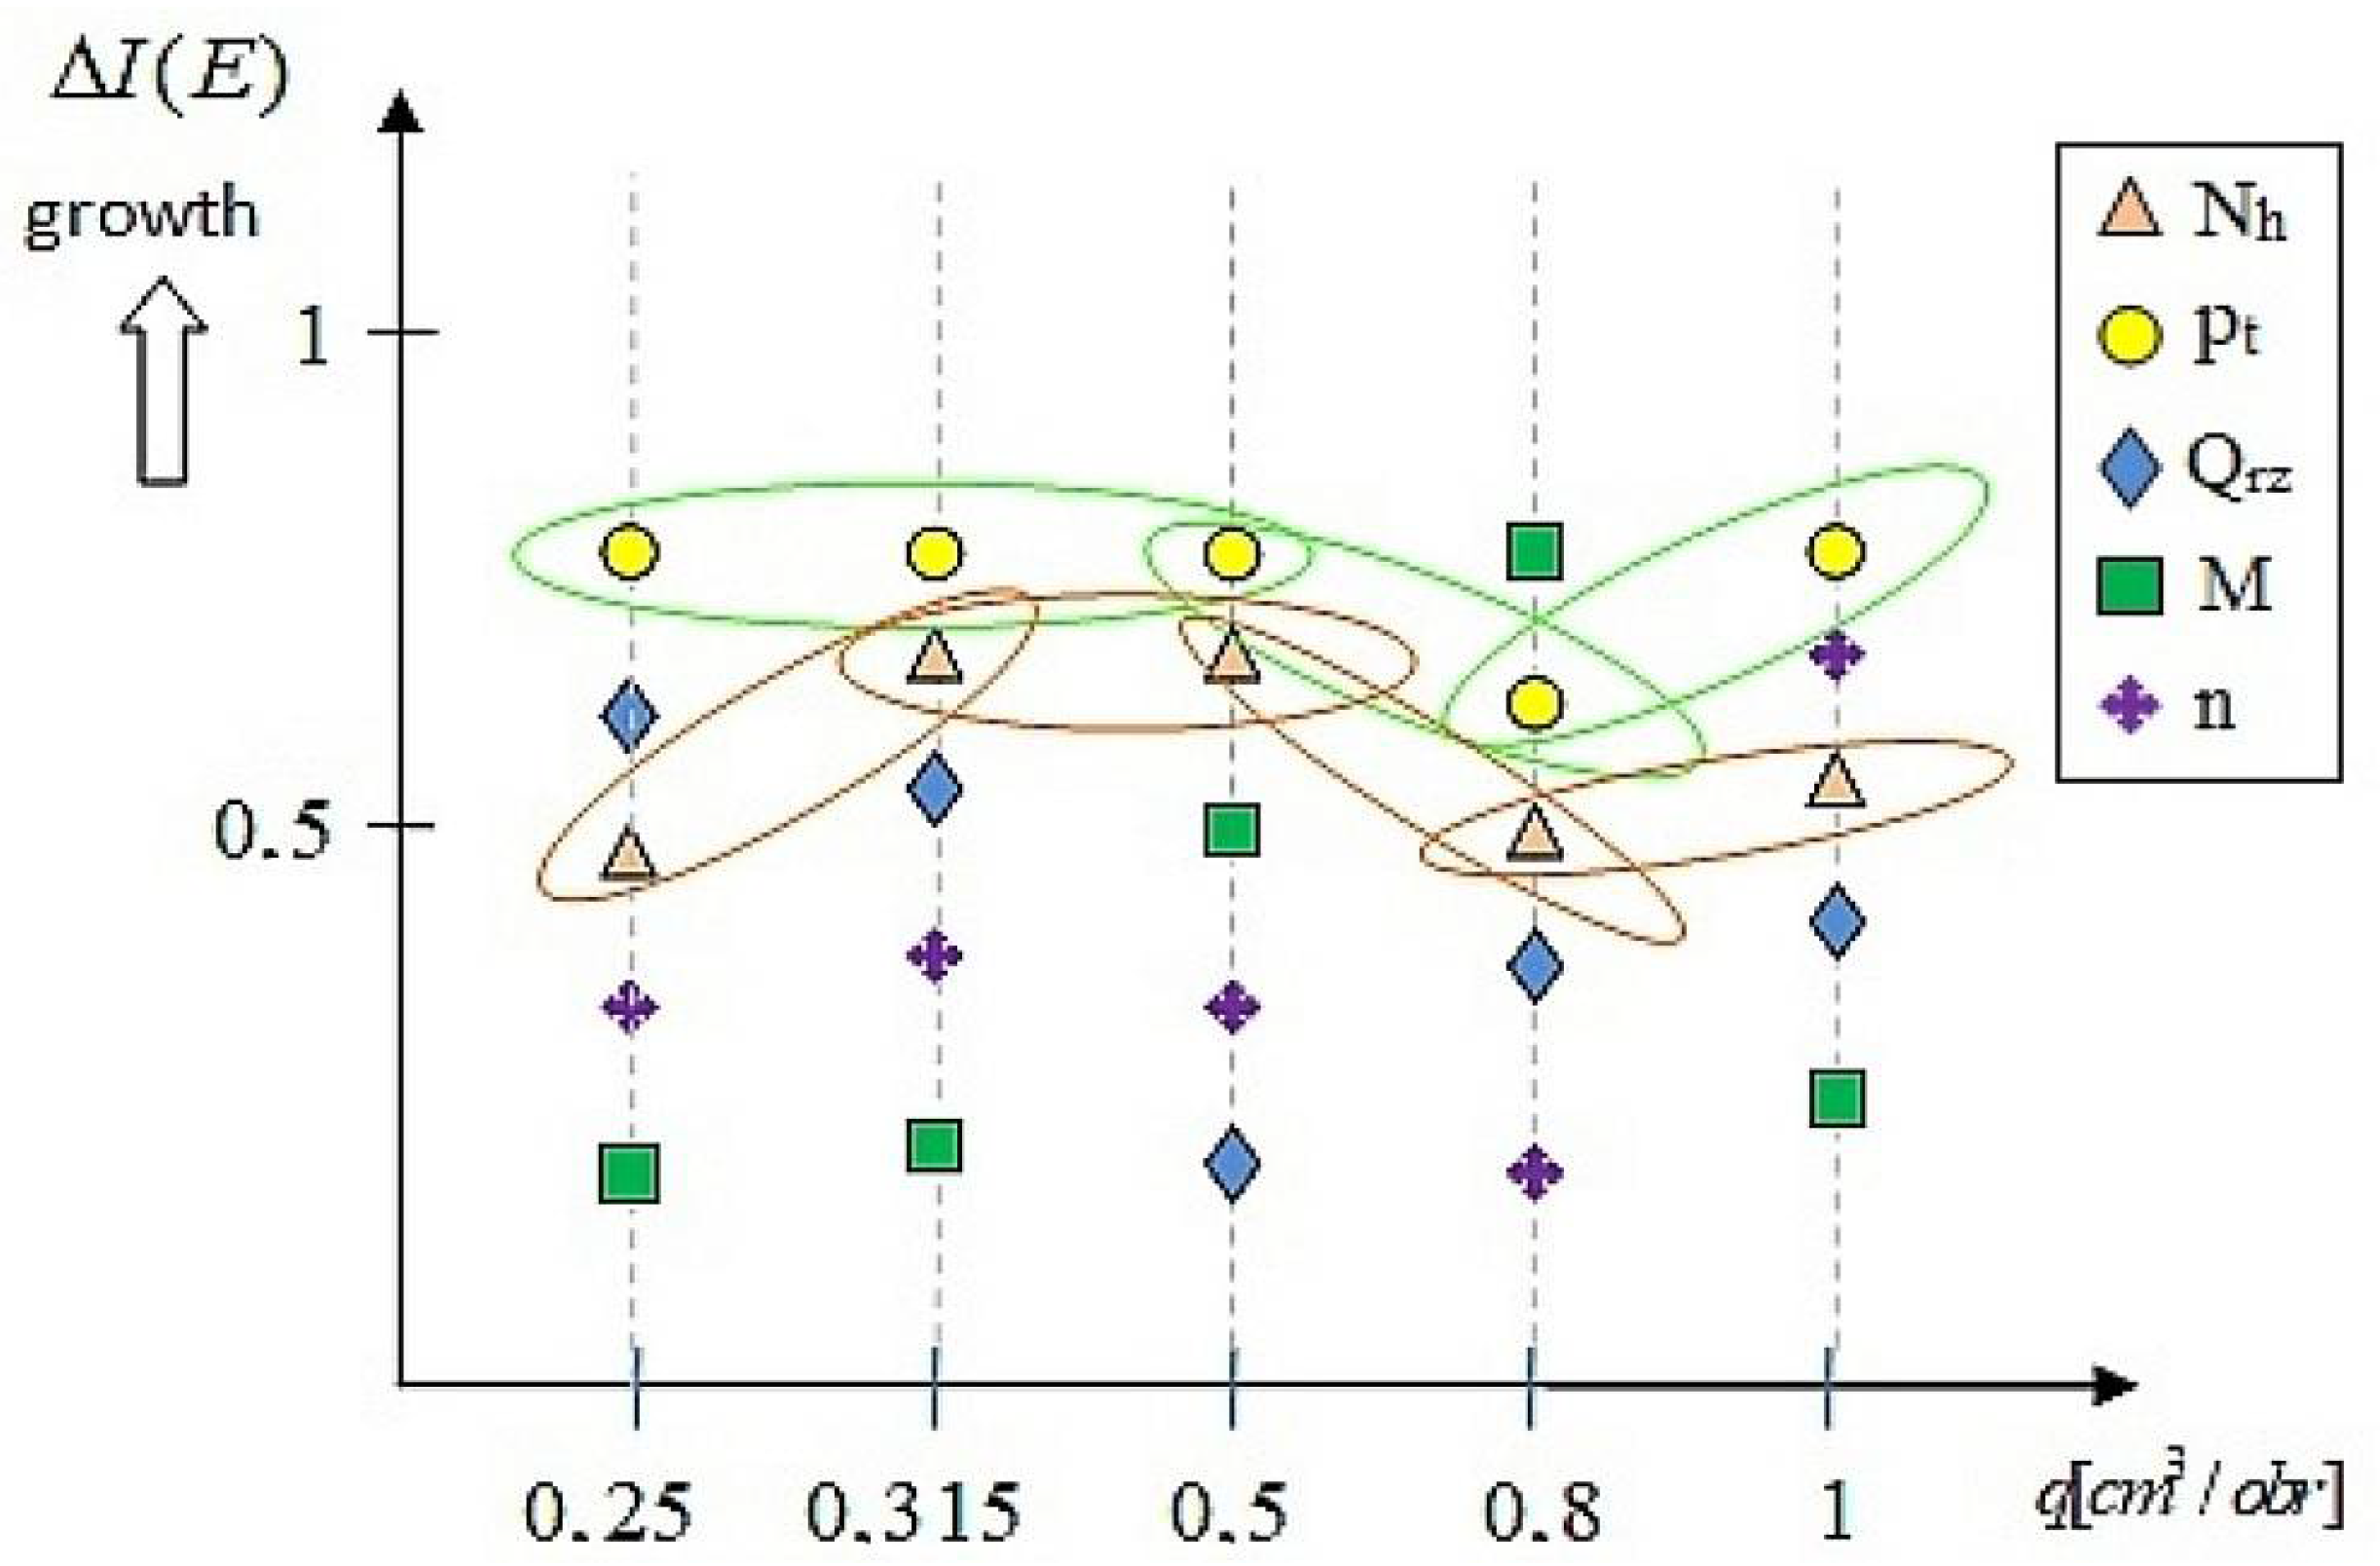
Figure 21, Figure 22 and Figure 23 show hierarchically ordered importance ranks for the analyzed parameters (highest entropy increment) for each of the microanalyses.
In the final stage, the mutual influence of the following parameters was analyzed: the rotational speed n and the specific delivery q simultaneously for both oil types.
In the first case, the output parameter (out) was the delivery and the relationship q(n) was investigated. The induction tree for this analysis is shown in Figure 24. In the second case, the output parameter (out) was the rotational speed n and the relationship n(q) was investigated—the induction tree is shown in Figure 25.
The greatest influence on the delivery is observed for the following rotational speed values:
  • n = 1000 for respective actual delivery Qrz and M (according to Figure 24);
  • n = 1500 for respective actual delivery Qrz and M (according to Figure 25).
The greatest influence on the rotational speed n is observed for the following delivery values:
  • q = 0.315, in the case when the actual delivery Qrz value is greater than 0.172 L/min;
  • q = 0.5, in the case when the actual delivery Qrz value is smaller than or equal to 0.571 L/min;
  • q = 0.8, in the case when the actual delivery Qrz value is greater than 0.378 L/min.

5. Discussion

Each of the induction trees generates an importance rank of the design parameters (and their values) for each type of analysis. The most important parameters are located in the roots of the induction trees (if considered from the top of the tree) and have the highest value of entropy increment ∆I(E).
For example, the tree shown in Figure 17, for the specific delivery q = 0.5 cm3/rev and for the Azolla ZS oil type 22, defines the hydraulic power Nh as the most important parameter, followed by the discharge pressure pt and the actual delivery Qrz. In the case of microanalysis 3, which includes all specific deliveries and both oil types (Azolla ZS type 22 oraz HL 68), the most important parameter is also the hydraulic power Nh, followed by the discharge pressure pt and the rotational speed n. (Figure 20).
Each of the trees corresponds to a rule-based notation generated in PC Shell.
Analysis of the data presented in Figure 21, Figure 22 and Figure 23 demonstrates the importance rank of the design and operating parameters influencing the total efficiency ηc. In the case of the Azolla ZS oil type 22, hydraulic power Nh has the highest importance (Figure 21). Its importance rank decreases slightly for the total efficiency of 1.0 cm3/rev. In the case of the HL 68 oil and of the same type of analysis, the discharge pressure pt is the parameter of the greatest influence for each delivery value, albeit it is immediately followed by the hydraulic power Nh. The results are similar for the Azolla ZS oil type 22. In the case when the entire analysis is considered simultaneously for the two oil types (Figure 23), it confirms that the influence of the hydraulic power Nh is the greatest, immediately followed by the influence of the discharge pressure pt. The results also indicate that the least important parameters include the torque M and the actual delivery Qrz.
In the last stage, the potential of the decision classification can allow an expert decision system to be developed. Such a system will comprise a calculation block and a classification block based on entropy increment, as well as an advice block which will advise the engineer/designer on the selection of the design parameters (their order and values).

6. Conclusions

The tests demonstrated that the static characteristics of the prototype pumps have a curve shape which depends primarily on the viscosity of the oil. Significantly better results were obtained for the HL 68 oil, having an almost three-fold higher viscosity than the viscosity of the Azolla ZS oil type 22. Increased viscosity not only improved the total efficiency and the volumetric efficiency but also slightly increased the hydromechanical efficiency. The best parameters were obtained for the pump with the specific delivery q = 1 cm3/rev. The following efficiency values were obtained for the nominal pressure and revolution values in the case of the Azolla ZS 22 oil: ηv = 52.5%, ηhm = 76.0% and ηc = 39.9%. In the case of the HL 68 oil, the values were ηv = 90.0%, ηhm = 84.2% and ηc = 75,8%. In addition, the tests demonstrated some difficulties with reaching high working pressures in the case of the oil with the lowest viscosity. These difficulties result from high internal leaks and the volumetric efficiency approximates zero. For the above reason, in the case when the pumps are designed to pump liquids of low viscosity, the dimensional tolerance should be stricter and the size of the axial and radial gaps between the gear teeth and the pump body and the slide bearing housings should be decreased. Therefore, the designed and constructed pumps are dedicated to work with oils having working viscosity values at a level of approx. 65–70 cSt. The implemented classification system allowed the determination of importance ranks for the design and operating parameters. The rule sets are evaluated in the following categories: number of rules (smaller is better), average support for the rule (i.e., an average number of examples supporting a rule; more is better), the total number of elementary conditions used in the rules (less is better) and the evaluation of the classification accuracy (more is better). Therefore, the developed expert system can be potentially expanded with additional tools supporting the decision-making process.
In the future, it is possible to use multi-valued logic trees to study the rank importance of design and operating parameters for hydraulic systems. Previous hydraulic measurement results show monotonicity of pt, Qrz, M changes for increasing rotational speed n. Therefore, the logical values of the decision variables for the logic trees can be set for a larger or smaller range of changes. The selected design and operation parameters with arithmetic values as a result of translation into logical values will be analyzed in terms of importance rank by the method of multi-valued logical decision trees, in which there can be only one logical variable on each floor. Structural and operational parameters with similar structural monotonicity can be decisionally combined into a complex variable (e.g., pt, M). Structural and operational parameters with arithmetic intervals that are not disjointed should first be monotonically ordered (e.g., Qrz), and only then may be given logical values of decision variables sequentially for increasing values of speed n. This procedure can be carried out for the given tables of hydraulic measurement results.
The authors’ future work will be directed in two directions:
  • Successive groups of micro-hydraulic pumps with different unit capacities operating with different oils will be subjected to hydraulic tests. The aim will be to develop a comprehensive method for testing the importance of design and operational parameters for the entire range of micro-pumps.
  • The authors will strive to build a “complete” and “automatic” information system for decision support, taking into account the heuristic method and techniques of searching the space of possible solutions. The expert system should have the ability to justify to the user the solution adopted. This is necessary not only after complete inference and presentation of the solution, problem or diagnosis, but also at each stage of inference, i.e., after each stage involving a partial solution. The system performs backward inference as an additional task, requiring expert opinion. It is important that the results are obtained from inference with the facts contained in the knowledge base. To preserve this principle, expert systems have a so-called non-contradiction module. This module allows the system to self-analyse and reconstruct a certain sequence of inference. A strict quantitative measurement of the systems ability to self-analyse is not made, as it would be a very difficult process, and is not always possible or necessary. However, it plays a very important role in the prototype design of pumps and micro-hydraulic devices.
In addition, in the future, interpolation or extrapolation may be carried out for the results of hydraulic measurements, to increase the accuracy of the assessment of the importance rank of constructional and operational parameters.

Supplementary Materials

The following supporting information can be downloaded at: https://www.mdpi.com/article/10.3390/en15093068/s1, File S1. A data sheet containing physical and chemical parameters for the Azolla ZS oil group, including type No. 22; File S2. Examples of rules generated for the induction trees in Figure 14; File S3. The fast induction tree generation algorithm.

Author Contributions

Conceptualization, modeling, methodology, and writing—original draft preparation, A.D. and P.O.; methodology, project administration, P.O.; writing—review and editing, A.D.; project administration and data checking, M.A.P. All authors have read and agreed to the published version of the manuscript.

Funding

This research received no external funding.

Institutional Review Board Statement

Not applicable.

Informed Consent Statement

Not applicable.

Data Availability Statement

Not applicable.

Conflicts of Interest

The authors declare no conflict of interest. The funders had no role in the design of the study; in the collection, analyses, or interpretation of data; in the writing of the manuscript, or in the decision to publish the results.

References

  1. Zhou, J.; Vacca, A.; Casoli, P. A novel approach for predicting the operation of external gear pumps under cavitating conditions. Simul. Model. Pract. Theory 2014, 45, 35–49. [Google Scholar] [CrossRef]
  2. Zardin, B.; Natali, E.; Borghi, M. Evaluation of the Hydro-Mechanical Efficiency of External Gear Pumps. Energies 2019, 12, 2468. [Google Scholar] [CrossRef] [Green Version]
  3. Schiffer, J.; Benigni, H.; Jaberg, H. Development of a novel miniature high-pressure fuel pump with a low specific speed. J. Automob. Eng. 2013, 227, 997–1006. [Google Scholar] [CrossRef]
  4. Frosina, E.; Senatore, A.; Rigosi, M. Study of a High-Pressure External Gear Pump with a Computational Fluid Dynamic Modelling Approach. Energies 2017, 10, 1113. [Google Scholar] [CrossRef] [Green Version]
  5. Śliwiński, P. The Basics of Design and Experimental Tests of the Commutation Unit of a Hydraulic Satellite Motor. Arch. Civ. Mech. Eng. 2016, 16, 634–644. [Google Scholar] [CrossRef]
  6. Patrosz, P. Influence of Properties of Hydraulic Fluid on Pressure Peaks in Axial Piston Pumps’ Chambers. Energies 2021, 14, 3764. [Google Scholar] [CrossRef]
  7. Załuski, P. Experimental research of an axial piston pump with displaced swash plate axis of rotation. In Advances in Hydraulic and Pneumatic Drives and Control; Springer: Berlin, Germany, 2020; pp. 135–145. [Google Scholar]
  8. Jasiński, R. Volumetric and torque efficiency of pumps during start-up in low ambient temperatures. In Advances in Hydraulic and Pneumatic Drives and Control; Stryczek, J., Warzyńska, U., Eds.; Springer: New York, NY, USA, 2020; pp. 28–39. [Google Scholar]
  9. Casoli, P.; Vacca, A.; Berta, G.L. Potentials of a Numerical Tool for the Simulation of Flow in External Gear Machines. In Proceedings of the Tenth Scandinavian International Conference on Fluid Power, Tampere, Finland, 21–23 May 2007. [Google Scholar]
  10. Ivantysyn, J.; Ivantysynova, M. Hydrostatic Pumps and Motors, Principles, Designs, Performance. In Modelling, Analysis, Control and Testing; Akademia Books International: New Delhi, India, 2002. [Google Scholar]
  11. Borghi, M.; Zardin, B.; Specchia, E. External Gear Pump Volumetric Efficiency: Numerical and Experimental Analysis; SAE Technical Paper: Chicago, IL, USA, 2009. [Google Scholar] [CrossRef]
  12. Abel, F. Johannes Kepler and His Importance to Modern Science; Inter Nations Bonn: Bad Godesberg, Germany, 1971. [Google Scholar]
  13. Eckle, F.J.; Bickert, P.; Lachenmann, R.; Wortmann, B. Pumping speed of diaphragm pumps for various gases. Vacuum 1996, 47, 799–801. [Google Scholar] [CrossRef]
  14. Rundo, M.; Nervegna, N. Geometry Assessment of Variable Displacement Vane Pumps. ASME J. Dyn. Syst. Meas. Control 2007, 129, 446–455. [Google Scholar] [CrossRef]
  15. Yan, D.; Kovacevic, A.; Tang, Q.; Rane, S.; Zhang, W. Numerical modelling of twin-screw pumps based on computational fluid dynamics. Proc. Inst. Mech. Eng. Part C J. Mech. Eng. Sci. 2017, 231, 4617–4634. [Google Scholar] [CrossRef] [Green Version]
  16. Scott, C. Considerations for a canned motor pump. World Pumps 2004, 459, 22–25. [Google Scholar] [CrossRef]
  17. Muzzioli, G.; Montorsi, L.; Polito, A.; Lucchi, A.; Sassi, A.; Milani, M. About the Influence of Eco-Friendly Fluids on the Performance of an External Gear Pump. Energies 2021, 14, 799. [Google Scholar] [CrossRef]
  18. Pareja-Corcho, J.; Moreno, A.; Simoes, B.; Pedrera-Busselo, A.; San-Jose, E.; Ruiz-Salguero, O.; Posada, J. A Virtual Prototype for Fast Design and Visualization of Gerotor Pumps. Appl. Sci. 2021, 11, 1190. [Google Scholar] [CrossRef]
  19. Deptuła, A.; Osiński, P.; Partyka, M.A. Analysis of Dimensional Tolerances on Hydraulic and Acoustic Properties of a New Type of Prototypal Gear Pumps. Appl. Sci. 2020, 10, 8535. [Google Scholar] [CrossRef]
  20. Osiński, P.; Chruścielski, G. Strength calculations of an element compensating circumferential backlash in the external gear pump. J. Theor. Appl. Mech. 2016, 54, 251–262. [Google Scholar] [CrossRef] [Green Version]
  21. Osiński, P. High-Pressure and Low-Pulse Gear Pumps with External Meshing; Publishing House of Wrocław University of Technology: Wrocław, Poland, 2013. [Google Scholar]
  22. Amman, R. Zahnradpumpen mit Evolventenverzahnung. Ph.D. Thesis, Technischen Hochschule München, Munich, Germany, 1926. [Google Scholar]
  23. Judin, E.M. Gear Pumps; PWT: Warsaw, Poland, 1958. [Google Scholar]
  24. Goliński, J. Vibration Isolation of Machines and Devices; WNT: Warsaw, Poland, 1979. [Google Scholar]
  25. Lätzel, M.; Schwuchow, D. An innovative external gear pump for low noise applications. In Proceedings of the 8th International Fluid Power Conference, Dresden, Germany, 26–28 March 2012. [Google Scholar]
  26. Osiński, P.; Kollek, W. Performance pulsation of externally meshed gear pumps. Hydraul. Pneum. 2000, 2, 24–26. [Google Scholar]
  27. Wittke, W. Beanspruchungsgerechte und Geräuschoptimierte Stirnradgetrieben: Toleranzvorgaben und Flankenkorrekturen. Ph.D. Thesis, RWTH-Aachen University, Aachen, Germany, 1994. [Google Scholar]
  28. Schwuchow, D. Design tools for modern external gear pumps. In Proceedings of the 3rd International Fluid Power Conterence, Aachen, Germany, 5–6 March 2002. [Google Scholar]
  29. Osiński, P.; Deptuła, A.; Partyka, M.A. Discrete optimization of a gear pump after tooth root undercutting by means of multi—Valued logic trees. Arch. Civ. Mech. Eng. 2013, 13, 422–431. [Google Scholar] [CrossRef]
  30. Deptuła, A.; Osiński, P. The Optimization of Three—Involute Tooth Outline with Taking into Consideration Multi—Valued Logic Trees. In Book: Proceedings of the 13th International Scientific Conference, Struga, North Macedonia, 26–28 September 2022; Springer International Publishing: New York, NY, USA, 2017; pp. 99–107. [Google Scholar]
  31. Fiebig, W. Schwingungs-und Geräuschverhalten der Verdrängerpumpen und Hydraulischen Systeme; Band 19; Universität Stuttgart: Stuttgart, Germany, 2000. [Google Scholar]
  32. Kollek, W. Optimerung das Wirkungsgrades von Zahnradpumpen und—Motoren. Konstruktion 1985, 35, 147–151. [Google Scholar]
  33. Osiński, P.; Kollek, W. Geräuschuntersuchungen der zahnradpumpen mit Hilfe der energetischen Methode. In Proceedings of the IV Polnisch-Deutsches Seminar: Innovationen und Fortschritte in der Hydraulik und Pneumatik, Sopot, Poland, 20–21 September 2001. [Google Scholar]
  34. Dindorf, R.; Wołkow, J. Micro fluidic systems, microhydraulics. In Proceedings of the IX Conference Cylinder 1999 Testing, Design, Manufacture and Operation of Hydraulic Systems, Zakopane, Poland, 23–25 September 1999. [Google Scholar]
  35. Dindorf, R.; Wołkow, J. Microhydraulics. Hydraul. Pneum. 1999, 6, 13–16. [Google Scholar]
  36. Kudźma, Z.; Łomotowski, G.; Osiński, P.; Rutański, J.; Stosiak, M.; Wilczyński, J. Investigations of hydraulic and vibroacoustic properties of fabricated prototypes. In Fundamentals of Design, Modelling and Operation of Microhydraulic Components and Systems; Publishing House of Wrocław University of Technolog: Wrocław, Poland, 2012. [Google Scholar]
  37. Kollek, W.; Wilczyński, A.; Osiński, P.; Rutański, J.; Maga, K. Hydraulic Testing of PZ0 Pinion Micropump; Ser. SPR no S- 07/2011; Reports of the Mechanical Engineering Department of Wrocław University of Technology: Wrocław, Poland, 2011. [Google Scholar]
  38. Kollek, W.; Osiński, P.; Stosiak, M.; Wilczyński, A.; Cichoń, P. Problems relating to high-pressure gear micropumps. Arch. Civ. Mech. Eng. 2014, 14, 88–95. [Google Scholar] [CrossRef]
  39. Fayyad, U.M.; Piatetsky-Shapiro, G.; Smyth, P.; Uthurusamy, R. From data mining to knowledge discovery. Al Mag. 1996, 17, 37–54. [Google Scholar]
  40. Han, J.; Kamber, M. Data Mining: Concepts and Techniques; Morgan Kaufmann: San Francisco, CA, USA, 2000. [Google Scholar]
  41. Alexandropoulos, S.; Kotsiantis, S.; Vrahatis, M. Data preprocessing in predictive data mining. In The Knowledge Engineering Review; Cambridge University Press: Cambridge, UK, 2019; Volume 34. [Google Scholar]
  42. Ahmad, W.; Ayub, N.; Ali, T.; Irfan, M.; Awais, M.; Shiraz, M.; Glowacz, A. Towards Short Term Electricity Load Forecasting Using Improved Support Vector Machine and Extreme Learning Machine. Energies 2020, 13, 2907. [Google Scholar] [CrossRef]
  43. Kuk, E.; Stopa, J.; Kuk, M.; Janiga, D.; Wojnarowski, P. Petroleum Reservoir Control Optimization with the Use of the Auto-Adaptive Decision Trees. Energies 2021, 14, 5702. [Google Scholar] [CrossRef]
  44. Bishop, C.M. Pattern Recognition and Machine Learning; Springer: Berlin/Heidelberg, Germany, 2006. [Google Scholar]
  45. Vapnik, V.N. Statistical Learning Theory; John Wiley and Sons: Hoboken, NJ, USA, 1998. [Google Scholar]
  46. Bingzhen, S.; Xiangtang, C.; Liye, Z.; Weimin, M. Three-way decision making approach to conflict analysis and resolution using probabilistic rough set over two universes. Inf. Sci. 2020, 507, 809–822. [Google Scholar]
  47. Xiancheng, J.; Yan, R.; Hesheng, T.; Jiawei, X. DSmT-based three-layer method using multi-classifier to detect faults in hydraulic systems. Mech. Syst. Signal Processing 2021, 153, 107513. [Google Scholar]
  48. Deptuła, A. Application of parametric trees with logical minimization in the analysis of automatic transmissions. J. Mech. Mechatron. Eng. IJMME-IJENS 2021, 21, 11–21. [Google Scholar]
  49. Kollek, W.; Osiński, P.; Wilczyński, A.; Brzeziński, T. Design Documentation of a Gear Micropump; Report S-09/2011; Wrocław University of Technology: Wrocław, Poland, 2011. [Google Scholar]
  50. Kollek, W.; Osiński, P.; Wilczyński, A. Construction of a Test Rig for Measuring Microhydraulic Systems; Report S-08/2011; Wrocław University of Technology: Wrocław, Poland, 2011. [Google Scholar]
  51. Kruthika, K.R.; Maheshappa, H.D. Multistage classifier-based approach for Alzheimer’s disease prediction and retrieval. Inform. Med. Unlocked 2019, 14, 34–42. [Google Scholar] [CrossRef]
  52. Chen, Y.; Kang, X.; Shi, Y.Q.; Wang, Z.J. A multi-purpose image forensic method using densely connected convolutional neural works. J. Real-Time Image Proc. 2019, 16, 725–740. [Google Scholar] [CrossRef]
  53. Costabal, F.S.; Perdikaris, P.; Kuhl, E.; Hurtado, D.E. Multi-fidelity classification using Gaussian processes: Accelerating the prediction of large-scale computational models. Comput. Methods Appl. Mech. Eng. 2019, 357, 112602. [Google Scholar] [CrossRef] [Green Version]
  54. Quinlan, J.R. Induction of Decision Trees. Mach. Learn. 1986, 1, 81–106. [Google Scholar] [CrossRef] [Green Version]
  55. Quinlan, J.R. C4.5 Program for Machine Learning; Morgan Kaufmann: San Mateo, CA, USA, 1993. [Google Scholar]
  56. Feretzakis, G.; Kalles, D.; Verykios, V.S. Using Minimum Local Distortion to Hide Decision Tree Rules. Entropy 2019, 21, 334. [Google Scholar] [CrossRef] [Green Version]
Figure 1. Three-plate design of an external gear micropump: 1—front (mounting) plate, 2—middle plate, 3—rear plate, 4—drive shaft. Cross-section of the gear pump [37].
Energies 15 03068 g001
Figure 2. Schematic view of the test stand: 1—tested pump, 2—cut-off valve, 3—mounted return line filter, 4—tank, 5—adjustable safety valve, 6—flowmeter, 7—cut-off valve, 8—pressure gauge, 9—torque meter, 10—3-phase motor with separate cooling, 11—switchbox [37].
Energies 15 03068 g002
Figure 3. Test stand [37].
Energies 15 03068 g003
Figure 4. Pump unit with torque meter: 1—tested pump, 2—3-phase motor with separate cooling, 3 —MT5Nm-N24 torque meter, 4,5—ROTEX GS flexible couplings, 6—housing, 7—mounting base [37].
Energies 15 03068 g004
Figure 5. The MT5Nm-N24 torque meter, serial No. 090410 with the Sensor-AT MW2006-2 m, serial No. 090303 [37].
Energies 15 03068 g005
Figure 6. Photograph of the pump unit [37].
Energies 15 03068 g006
Figure 7. Characteristics of actual delivery for q = 0.25 cm3/rev, q = 0.315 cm3/rev, q = 1.0 cm3/rev. and for pump torque n = 500 rpm and n = 1750 rpm [37].
Energies 15 03068 g007
Figure 8. Characteristics of pump efficiency for q = 0.25 cm3/rev, q = 0.315 cm3/rev and for q = 1.0 cm3/rev and for n = 500 rpm and n = 1750 rpm [37].
Energies 15 03068 g008
Figure 9. Graphical interpretation of classification in terms of entropy.
Energies 15 03068 g009
Figure 10. Induction trees in terms of entropy growth.
Energies 15 03068 g010
Figure 11. Searching an inductive decision tree.
Energies 15 03068 g011
Figure 12. Effects of changing the maximum tree depth.
Energies 15 03068 g012
Figure 13. First stage of induction tree generation.
Energies 15 03068 g013
Figure 14. Final stage of induction tree generation.
Energies 15 03068 g014
Figure 15. Schematic diagram of the performed microanalyses.
Energies 15 03068 g015
Figure 16. The learning file (.lrn) for microanalysis 1, q = 0.5 cm3/rev, oil Azolla ZS type 22.
Energies 15 03068 g016
Figure 17. Induction tree for the file of Figure 16.
Energies 15 03068 g017
Figure 18. The learning file (.lrn) for microanalysis 1, q = 0.8 cm3/rev, oil Azolla ZS type 22.
Energies 15 03068 g018
Figure 19. Induction tree for the file of Figure 18.
Energies 15 03068 g019
Figure 20. Induction tree generated for microanalysis 3 including all of the specific deliveries and the two types of oil- after minimization.
Energies 15 03068 g020
Figure 21. Hierarchical importance rank of the parameters for microanalysis 1 and for the oil Azolla ZS type 22.
Energies 15 03068 g021
Figure 22. Hierarchical importance rank of the parameters for microanalysis 1 and for the oil HL 68.
Energies 15 03068 g022
Figure 23. Hierarchical importance rank of the parameters for microanalysis 2 and for both oil types.
Energies 15 03068 g023
Figure 24. Induction tree describing the q(n) relationship- after tree minimization.
Energies 15 03068 g024
Figure 25. Induction tree describing the n(q) relationship- - after tree minimization.
Energies 15 03068 g025
Table 1. Meshing parameters [49].
ParametersSymbol and UnitSpecific Delivery [cm3/rev]
0.250.3150.50.8 1.0
Number of teethz[-]1414141414
Modulem0[mm]11111
Pressure angleα0[0]2020202020
Addendum height coefficienty[-]11111
Addendum modification coefficientx[-]0.610.610.610.610.61
Toothed wheel widthb[mm]2.322.924.647.429.28
Axis-to-axis distancea[-]1515151515
Generating-circle pressure angleαt[0]28.7128.7128.7128.7128.71
Table 2. Selected results of hydraulic measurements for the PZ0 pump at 0.25 cm3/rev, serial X10050003 [37].
n
[rpm]
pt
[MPa]
Qrz
[L/min]
M
[Nm]
Nm
[W]
Nh
[W]
ηv
[%]
ηhm
[%]
ηc
[%]
500≈00.0850.115.760.24100.004.184.18
30.0580.168.382.9068.2450.7334.62
60.0290.2814.662.9034.1257.9819.78
80.0060.3618.850.807.0660.134.24
12*******
16*******
750≈00.1330.107.850.38100.004.804.80
30.1040.1612.575.2078.2052.9241.38
60.0750.2721.217.5056.3962.7235.37
90.0420.3930.636.3031.5865.1320.57
110.0170.4837.703.1212.7864.688.27
16*******
1000≈00.1820.1010.470.52100.004.924.92
30.1510.1515.717.5582.9757.9348.06
60.1210.2627.2312.1066.4866.8544.44
90.0890.3839.7913.3548.9068.6033.55
130.0270.5658.645.8514.8467.249.98
16*******
1250≈00.2290.1013.090.73100.005.545.54
30.1930.1519.639.6584.2858.3149.15
60.1620.2735.3416.2070.7464.7945.84
90.1260.3748.4318.9055.0270.9239.02
120.0810.5166.7616.2035.3768.6124.27
140.0220.6078.545.139.6168.036.54
1500≈00.2780.1117.280.88100.005.095.09
30.2490.1625.1312.4589.5755.3149.54
60.2180.2742.4121.8078.4265.5551.40
90.1770.3961.2626.5563.6768.0743.34
120.1320.5281.6826.4047.4868.0732.32
160.0160.75117.814.275.7662.933.62
1750≈00.3250.1018.331.14100.006.216.21
30.2920.1629.3214.6089.8555.4249.79
60.2620.2647.6526.2080.6268.2154.99
90.2260.3869.6433.9069.5470.0048.68
120.1860.5193.4637.2057.2369.5539.80
160.0730.73133.7819.4722.4664.7814.55
* the tested pump did not achieve the given pressure.
Table 3. Selected results of hydraulic measurements for the PZ0 pump at 0.3153/rev, serial X10050005PZ0 [37].
nptQrzMNmNhηvηhmηc
[rpm][MPa][L/min][Nm][W][W][%][%][%]
500≈00.1100.2211.520.31100.002.712.71
50.0700.3417.805.8363.6451.4932.77
100.0310.5629.325.1728.1862.5317.62
110.0180.6131.943.3016.3663.1410.33
20*******
22*******
750≈00.1700.1814.140.51100.003.613.61
50.1340.3325.9211.1778.8254.6643.08
100.0990.5442.4116.5058.2466.8138.90
150.0360.8062.839.0021.1867.6414.32
160.0050.8869.121.332.9465.591.93
22*******
1000≈00.2290.1717.800.69100.003.863.86
50.1960.3233.5116.3385.5956.9548.74
100.1410.5355.5023.5061.5768.7742.34
150.0740.7881.6818.5032.3170.0922.65
170.0250.9195.297.0810.9268.097.43
22*******
1250≈00.2900.1620.941.06100.005.085.08
50.2420.3039.2720.1783.4561.5451.35
100.1920.5268.0732.0066.2171.0147.01
150.1260.7699.4831.5043.4572.8831.66
190.0321.02133.5210.1311.0368.787.59
22*******
1500≈00.3490.1625.131.28100.005.095.09
50.2990.3047.1224.9285.6761.7252.87
100.2500.5281.6841.6771.6371.2151.01
150.1890.75117.8147.2554.1574.0640.11
200.0221.08169.657.336.3068.574.32
22*******
1750≈00.4100.1731.151.50100.004.834.83
50.3600.2851.3130.0087.8066.5958.47
100.3060.5193.4651.0074.6373.1154.57
130.2450.74135.6161.2559.7675.5845.17
200.1301.05192.4243.3331.7171.0222.52
210.0791.14208.9227.6519.2768.6913.23
* the tested pump did not achieve the given pressure.
Table 4. Selected results of hydraulic measurements for the PZ0 pump at 1.0 cm3/rev, serial X10050010 [37].
nptQrzMNmNhηvηhmηc
[rpm][MPa][L/min][Nm][W][W][%][%][%]
500≈00.3760.199.951.38100.0013.8613.86
50.2970.8242.9424.7578.9972.9857.65
100.2011.5882.7333.5053.4675.7540.49
130.0662.19114.6714.3017.5571.0512.47
20*******
22*******
750≈00.5650.1814.142.45100.0017.3217.32
50.4870.8163.6240.5886.1974.0163.79
100.3911.53120.1765.1769.2078.3654.23
150.1762.43190.8544.0031.1574.0123.05
20*******
22*******
1000≈00.7600.1818.853.67100.0019.4919.49
50.6790.7881.6856.5889.3477.5469.27
100.5931.47153.9498.8378.0382.2864.20
150.4362.25235.62109.0057.3780.6446.26
180.1232.64276.4636.9016.1882.4713.35
22*******
1250≈00.9510.1722.255.39100.0024.2224.22
50.8690.7395.5672.4291.3882.9375.78
100.7801.46191.11130.0082.0282.9368.02
150.6532.25294.52163.2568.6680.7255.43
190.3523.02395.32111.4737.0176.1828.20
22*******
1500≈01.1460.1726.707.26100.0027.1827.18
51.0660.73114.6788.8393.0283.2877.47
100.9721.43224.62162.0084.8285.0372.12
150.8442.16339.29211.0073.6584.4462.19
200.6023.20502.65200.6752.5376.0039.92
220.3953.39532.50144.8334.4778.9127.20
1750≈01.3350.1629.328.46100.0028.8428.84
51.2420.75137.44103.5093.0380.9475.30
101.1491.41258.40191.5086.0786.1174.11
151.0232.16395.84255.7576.6384.3164.61
160.9972.30421.50265.8774.6884.4663.08
21**************
* the tested pump did not achieve the given pressure; ** the test stand did not allow to obtain the required rotational speed for this load.
Table 5. Sample data.
wewewewewy
nptQrzMηc
0.253high10.47unacceptable
0.253high43.98unacceptable
0.3153high10.47acceptable
0.85high10.47acceptable
0.88normal10.47acceptable
0.88normal43.98unacceptable
0.3158normal43.98acceptable
0.255high10.47unacceptable
0.258normal10.47acceptable
0.85normal10.47acceptable
0.255normal43.98acceptable
0.3155high43.98acceptable
0.3153normal10.47acceptable
0.85high43.98unacceptable
Publisher’s Note: MDPI stays neutral with regard to jurisdictional claims in published maps and institutional affiliations.