6.1. Hourly Analysis
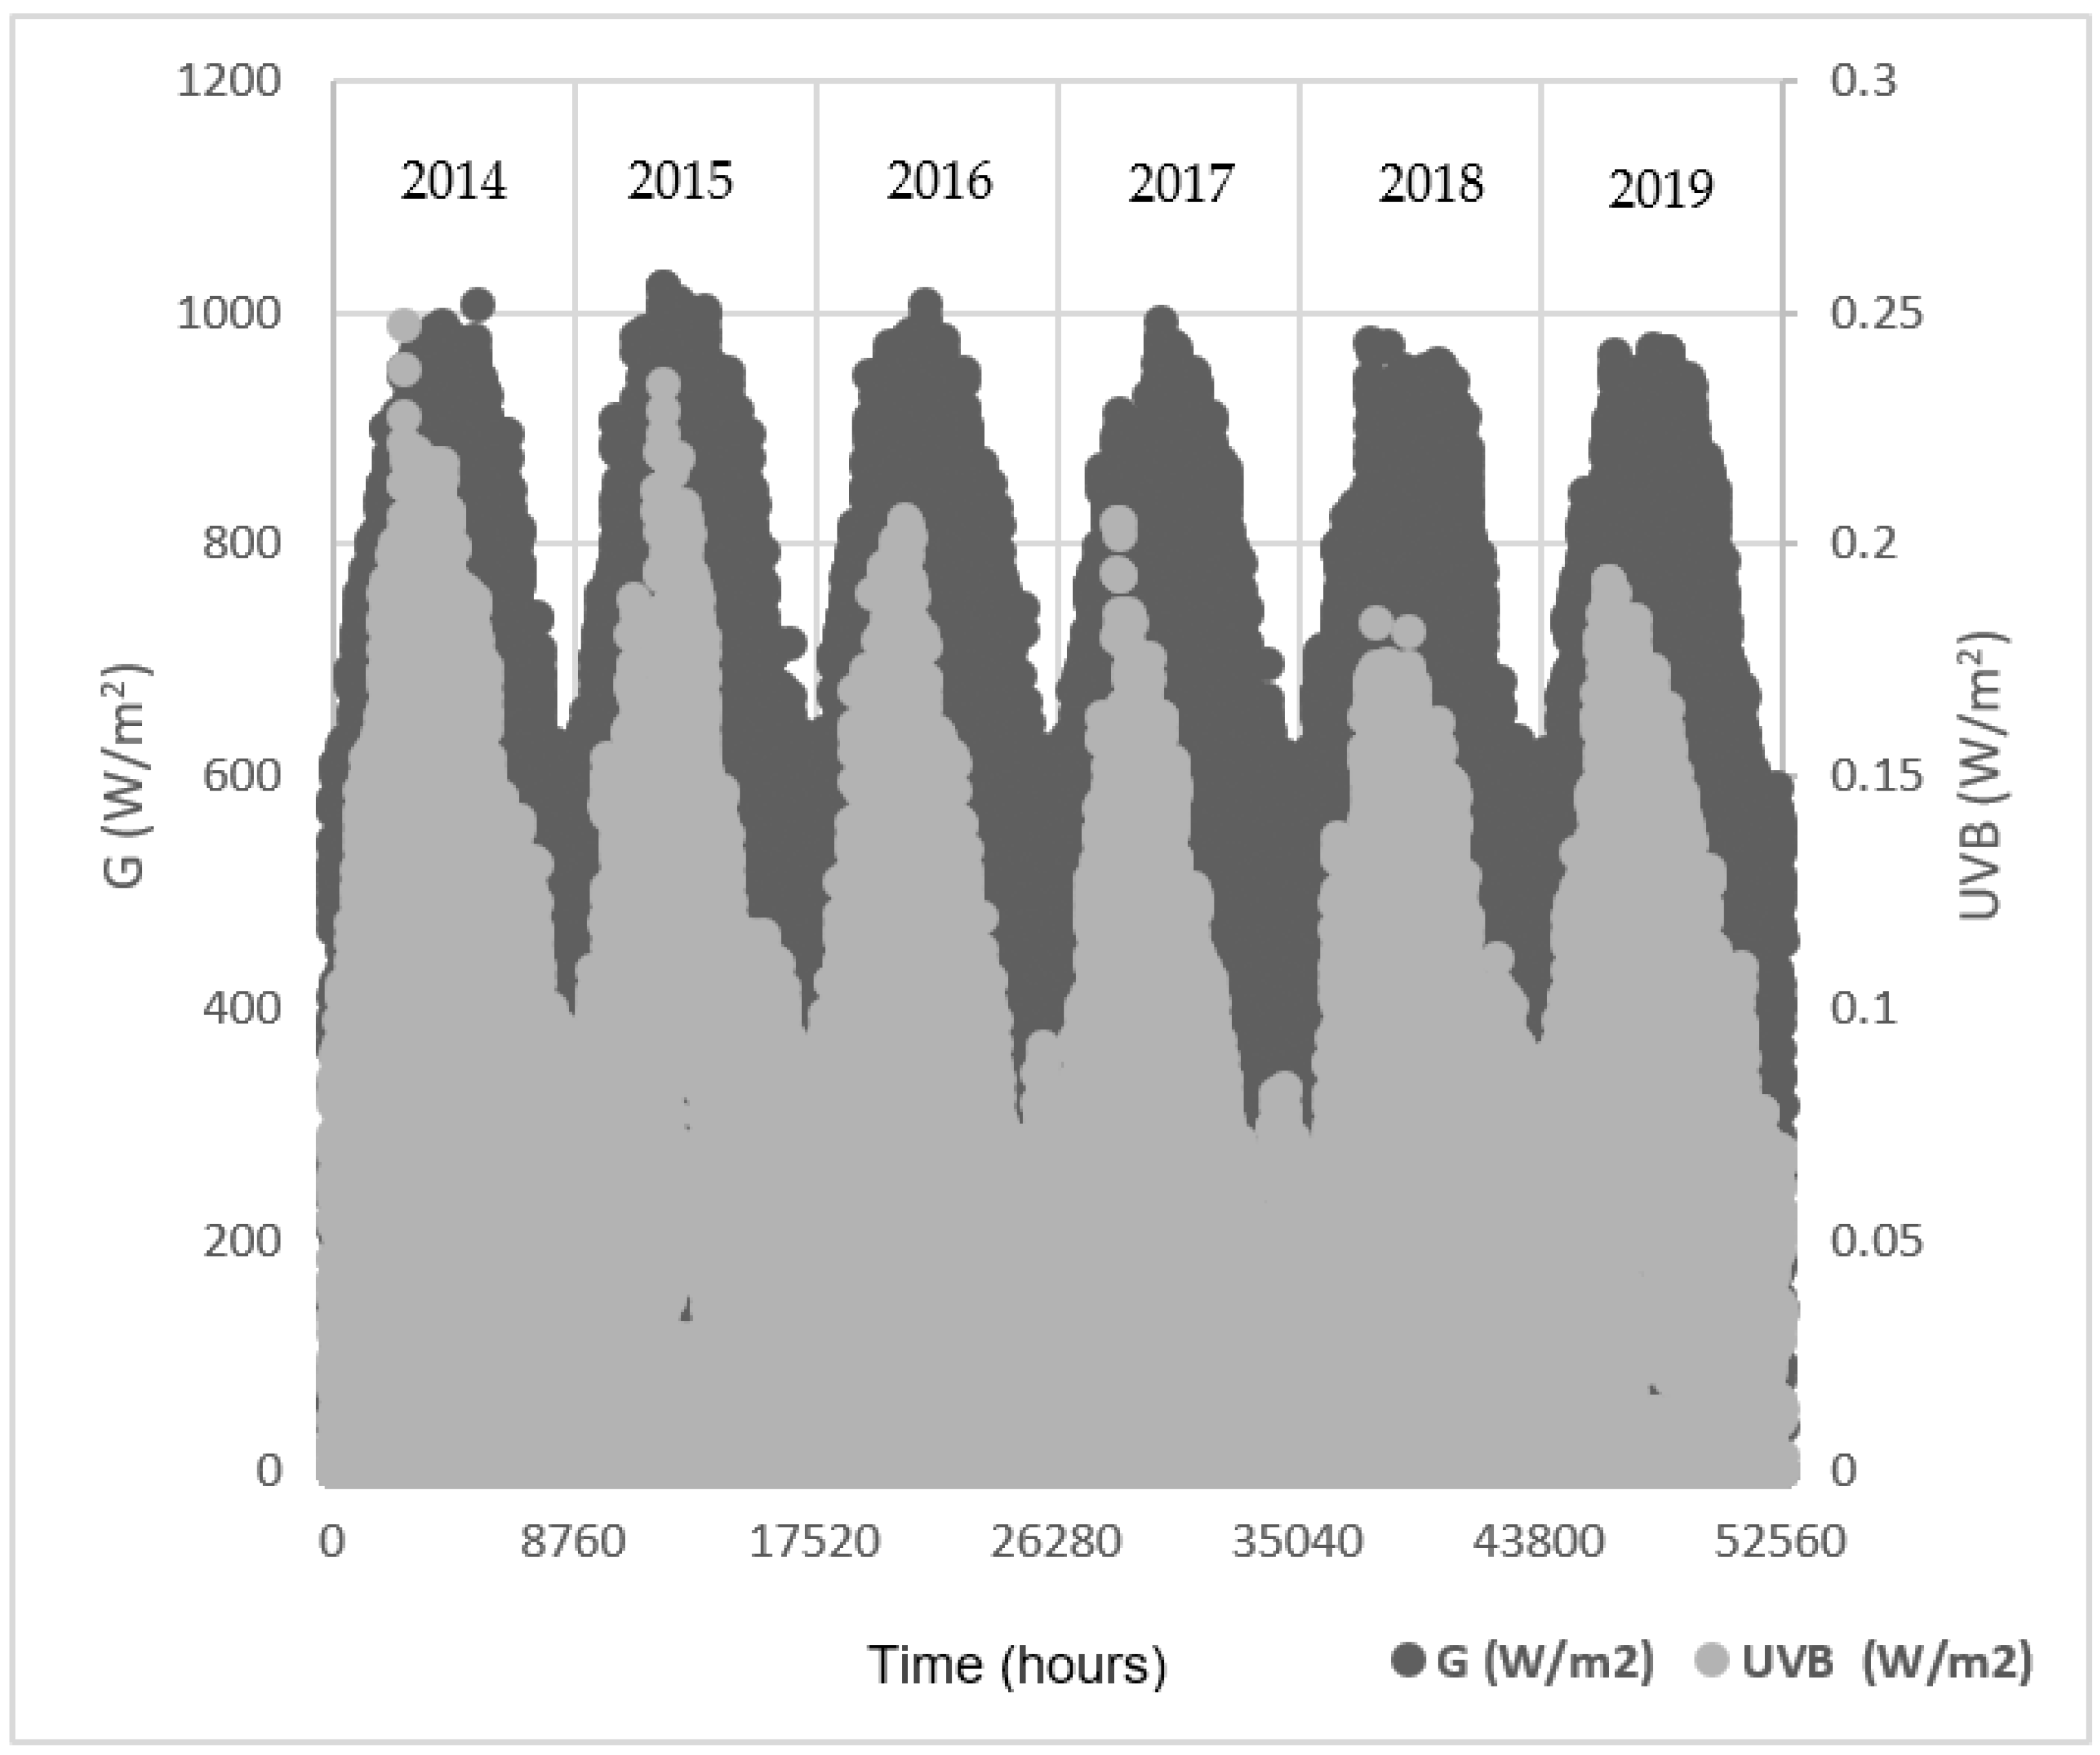
Figure 1 illustrates the hourly variation in both
G and
UVB radiation for the continuous measurements during 2014–2019 under all sky conditions. The hourly
G and
UVB radiation measurements were examined to establish whether there was a precise empirical formula(s) between the two variables. Such empirical formulas, once validated, can be utilized to determine
UVB values for other periods/locations where the
G is measured but not
UVB.
As indicated by
Figure 1, the curves of hourly values show a sinusoidal behavior for both
G and
UVB radiation, with minimum values attained in January and December. In addition, the high variation in
G and
UVB radiation values during spring and summer is directly impacted by dust and sand in Kuwait at these times, while in winter, it may be attributed to the influence of cloud and rain discrepancy.
Figure 1 also reveals a strong similarity between the trend of both hourly
G and
UVB radiation, which indicates the possibility of deriving empirical equations to estimate
UVB from
G. To demonstrate the resemblance between hourly
G and hourly
UVB radiation, a statistical test was employed to validate the link between these two parameters for each year. The validity of the correlation formulas obtained in the present study was examined by comparing the predicted value with the corresponding measured one. The criteria used for such a comparison were RMSE, MBE, and
R2.
Table 2 presents the relationship equations between
G and
UVB for each year during 2014–2019. RMSE, MBE, and
R2 are also listed in
Table 2. The coefficients of determination (
R2) indicate how well the regression equation fits the data. It indicates the proportion of variance in the dependent variable (
UVB) explained by the independent variable (
G).
Table 2 reveals a good agreement between hourly
G and hourly
UVB radiation, as demonstrated by the statistical analysis parameters for each year.
R2 values for all years are higher than 0.91 and the regression coefficient or relationship slopes are similar for all years, except year 2014. In addition, the
UVB radiation predicted in 2014 is higher than those of all other years for which the predicted
UVB is nearly identical to the measured one. The reason the year 2014 is slightly different is attributed to the disturbance in the Kuwait desert climate (dust, wind speed, and visibility), which has a different impact on the transmittance and scattering of both
G and
UVB and, consequently, the ratio
G/
UVB. For 2014, the number of days for which the daily concentration of total suspended particulate (TSP) exceeded 25 µg/m
3, 25 µg/m
3, and 25 µg/m
3 is higher than those for 2015–2019. RMSE and MBE values are smaller than the measurements errors and can be considered negligible. The presented results confirm the validity of the derived empirical equations. Accordingly, they can be used with an acceptable accuracy to estimate hourly
UVB from hourly
G for locations where no
UVB sensors exist.
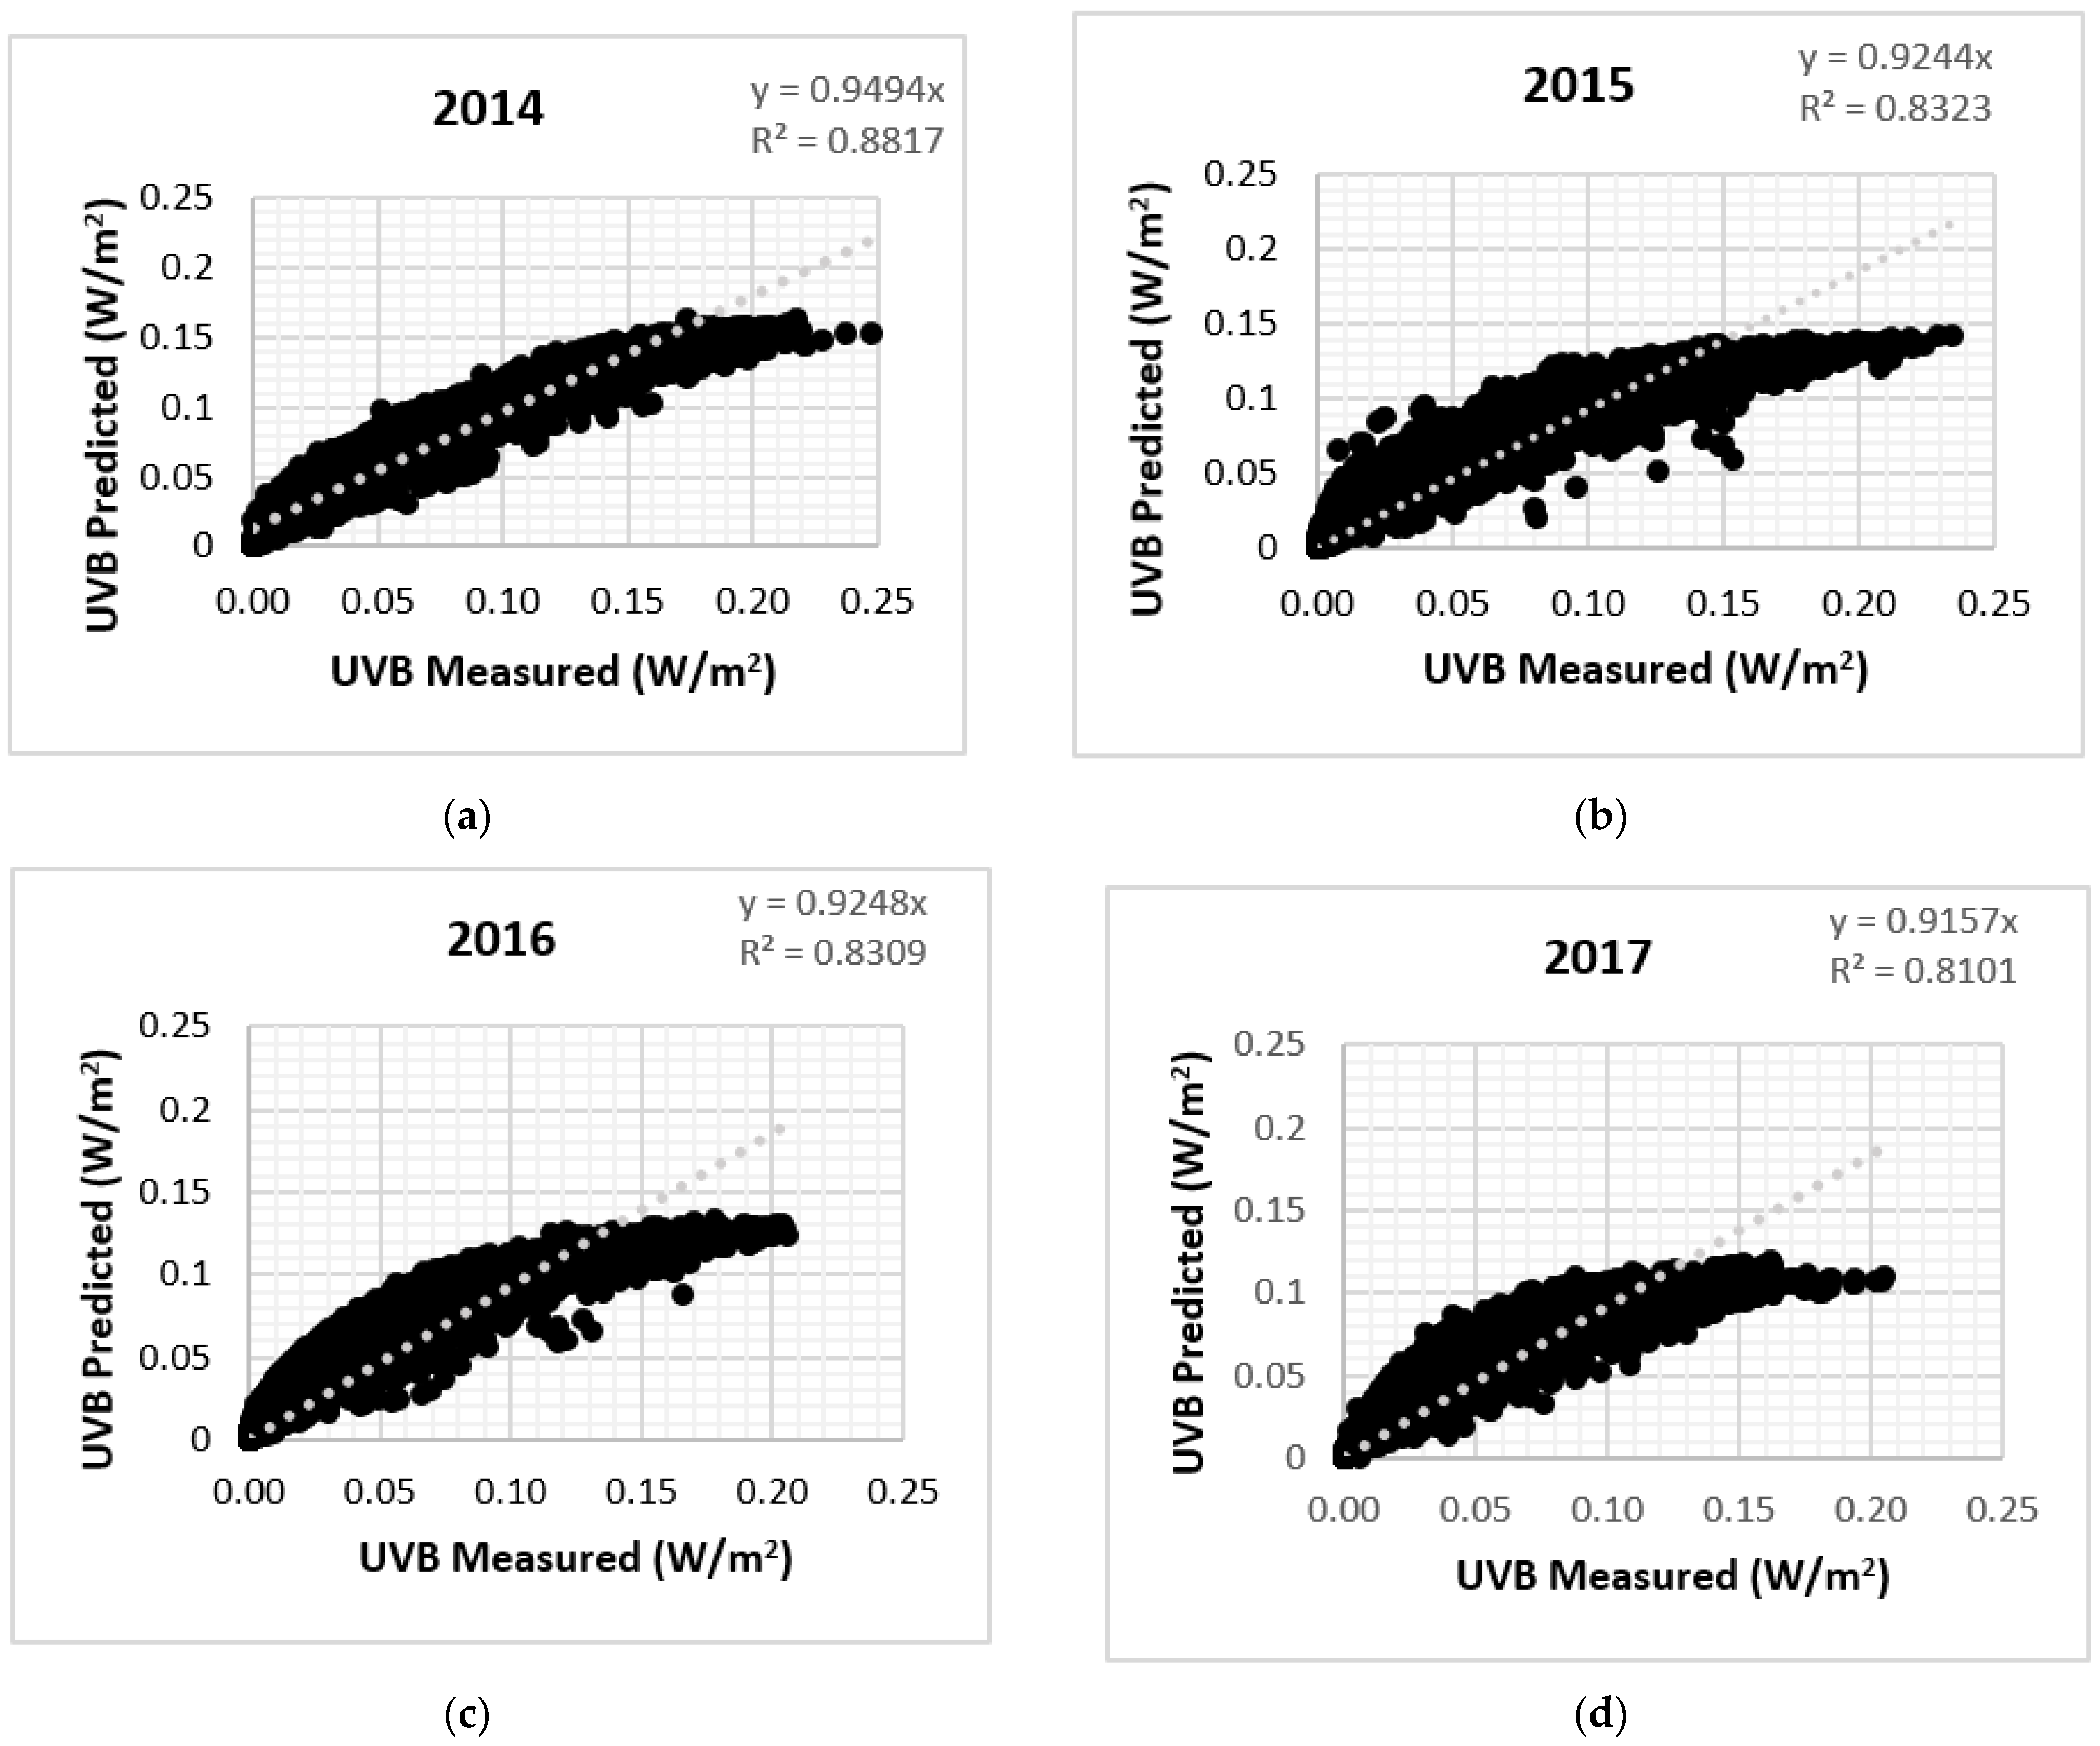
The measured versus predicted hourly values of
UVB for 2014–2019 are illustrated in
Figure 2a–f. These figures reveal the strong correlation between predicted and measured values. As seen from figures, the slope of the line is nearly close to unity for all years. In addition, most of the data are closely clustered around the line, demonstrating the good agreement between the measured and predicted values.
It is observed that the maximum hourly
G and
UVB radiation values take place in summer months at midday (12 h). The maximum values obtained for both hourly
G and hourly
UVB radiation are presented in
Table 3 along with the date of maximum occurrence for each year.
Table 3 shows that except for 2015, the dates of the maximum
G and
UVB values are the same. In addition, the maximum
G values occur between 18 April and 21 June, while the maximum
UVB values are limited to a narrower period, i.e., 5 April to 17 May. In addition, the results in
Table 3 illustrate that the attenuation in the maximum
UVB values over the six-year period is significantly higher, i.e., about 35%, than the corresponding value for the maximum
G values, i.e., about 5.5%. This behavior is linked to the large transmittance of
UVB through the atmosphere [
41]. In addition, the significant transmittance of
UVB in comparison to the corresponding one for
G can be attributed to absorbing aerosols that significantly decrease
UVB but have a much lower impact on
G [
42]. Commonly, the reduction in radiation by clouds is higher at longer wavelengths, while at shorter wavelengths, the transmittance of aerosols is greater [
43].
The hourly (
UVB/G) % against
G for different sky conditions from 2014 to 2019 is presented in
Figure 3 to examine the influence of atmospheric conditions on this ratio. As shown from figure, this ratio decreases with
G as a result of cloudy conditions. This illustrates that clouds transmit
G more effectively than
UVB because of the higher absorption by water vapor [
44], while the attenuation by aerosols and ozone is larger for
UVB radiation than for
G. Thus,
UVB is higher during summer due to reduced cloud cover and reduced stratospheric ozone.
The difference in the hourly characteristic of
G and
UVB is linked to transmittance. Accordingly, the attenuation of
G and
UVB radiation was examined by considering the fluctuation in the (
UVB/G)%-
KT curve as it presents
G radiation attenuation. The variation in (
UVB/G)% with
KT implies that atmospheric parameters alter
G and
UVB in a different manner during their transmittance through the atmosphere.
Figure 4 presents the ratio (
UVB/G) as a function of
KT. The ratio (
UVB/G) tends to decrease with
KT, indicating that higher ratios (
UVB/G) are obtained for higher cloud cover conditions.
Generally, both
G and
UVB decrease with the atmosphere turbidity due to attenuating factors, e.g., clouds, ozone, and aerosols. Several researchers have attributed this behavior to the different effect of sky conditions on
G and
UVB. In addition, some researchers have claimed that clouds dominate the variability in
KT. Hence, future efforts of the authors will focus on investigating the individual effects of different atmospheric parameters on
G and
UVB radiation variation. The relationship between global clearness index (
KT) and
UVB clearness index (
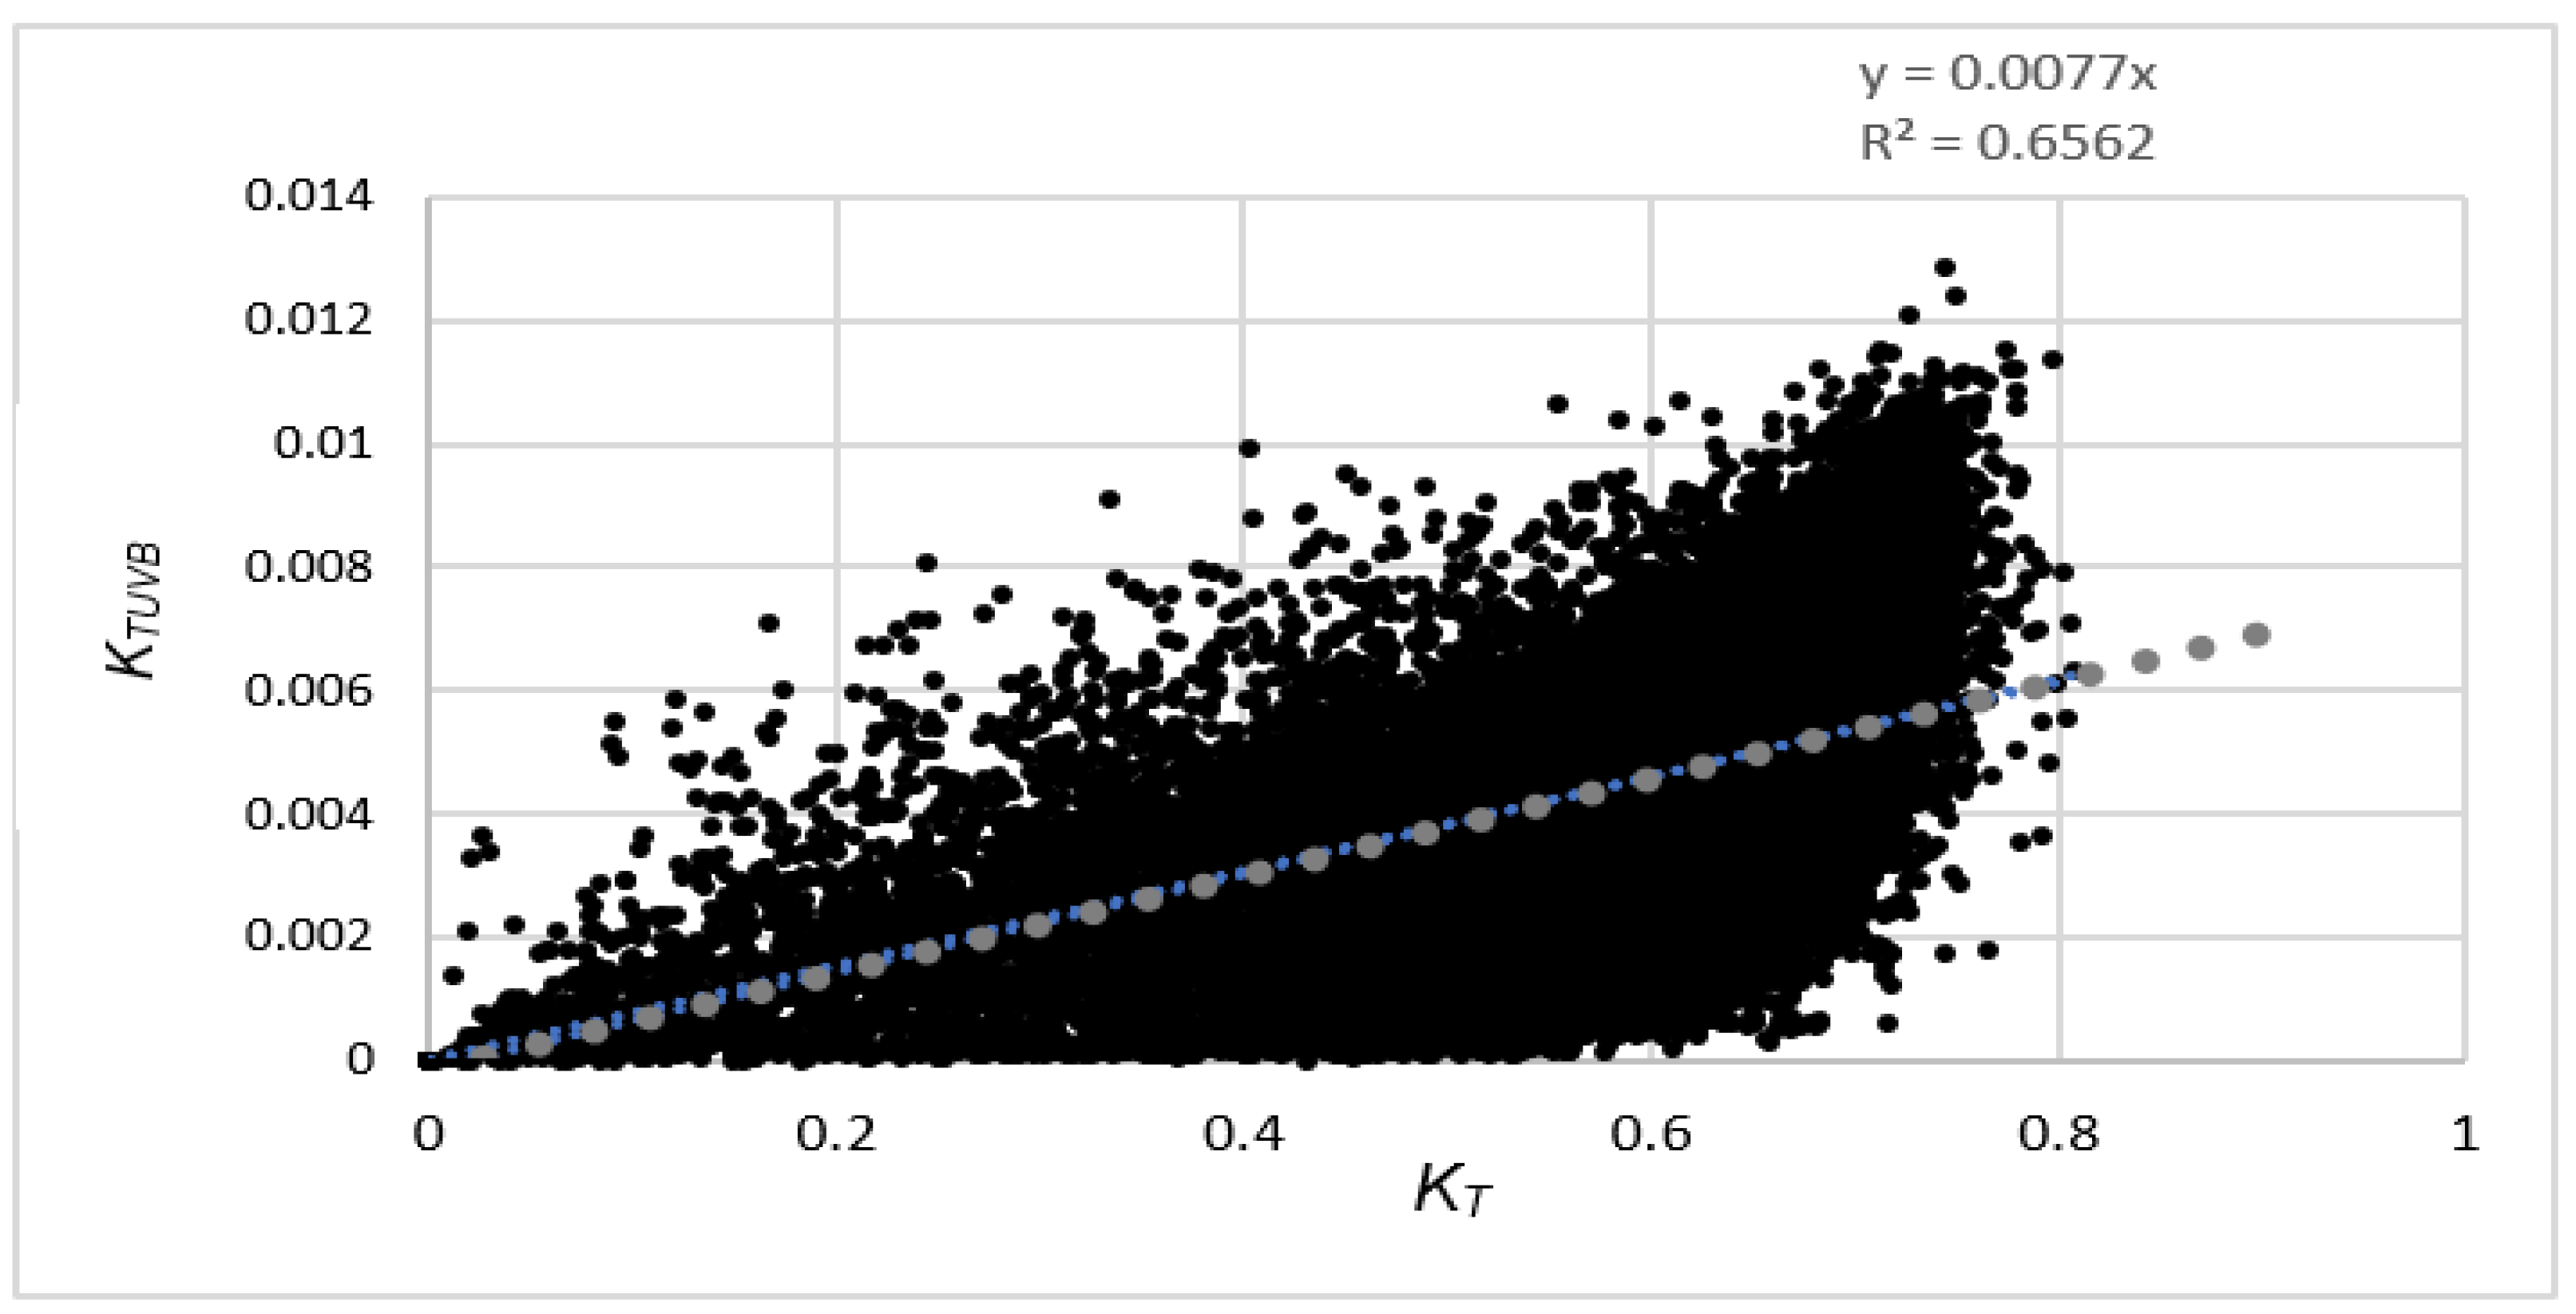
KTUVB) was examined to establish an empirical correlation between them.
Figure 5 presents hourly
KT and
KTUVB during 2014–2019 for all sky conditions in Kuwait.
As depicted in
Figure 5,
KT and
KTUVB are directly proportional. A linear fit between
KTUVB and
KT gives the following equation:
It should be noted that atmospheric conditions also play a role in the correlation between
KTUVB and
KT. Wang et al. [
45] proposed that the attenuation of
G and
UVB is better presented by a polynomial of the third order instead of a linear relation. A third-order polynomial fit between
KTUVB and
KT for the present dataset gives the following empirical formula:
The determination coefficient (
R2) is improved from 0.836 to 0.859. Tena et al. [
45] indicated that
KTUVB was strongly dependent on solar zenith angle, while this is not the case for
KT. Considering that
KTUVB and
KT should have similar behavior, and to prevent the dependency on solar zenith angle, the measurements of the four central hours, i.e., noon ± 2 h, were considered. Following their procedure, the determination coefficient (
R2) was greatly improved, i.e., from 0.859 to 0.933, as presented in
Figure 6.
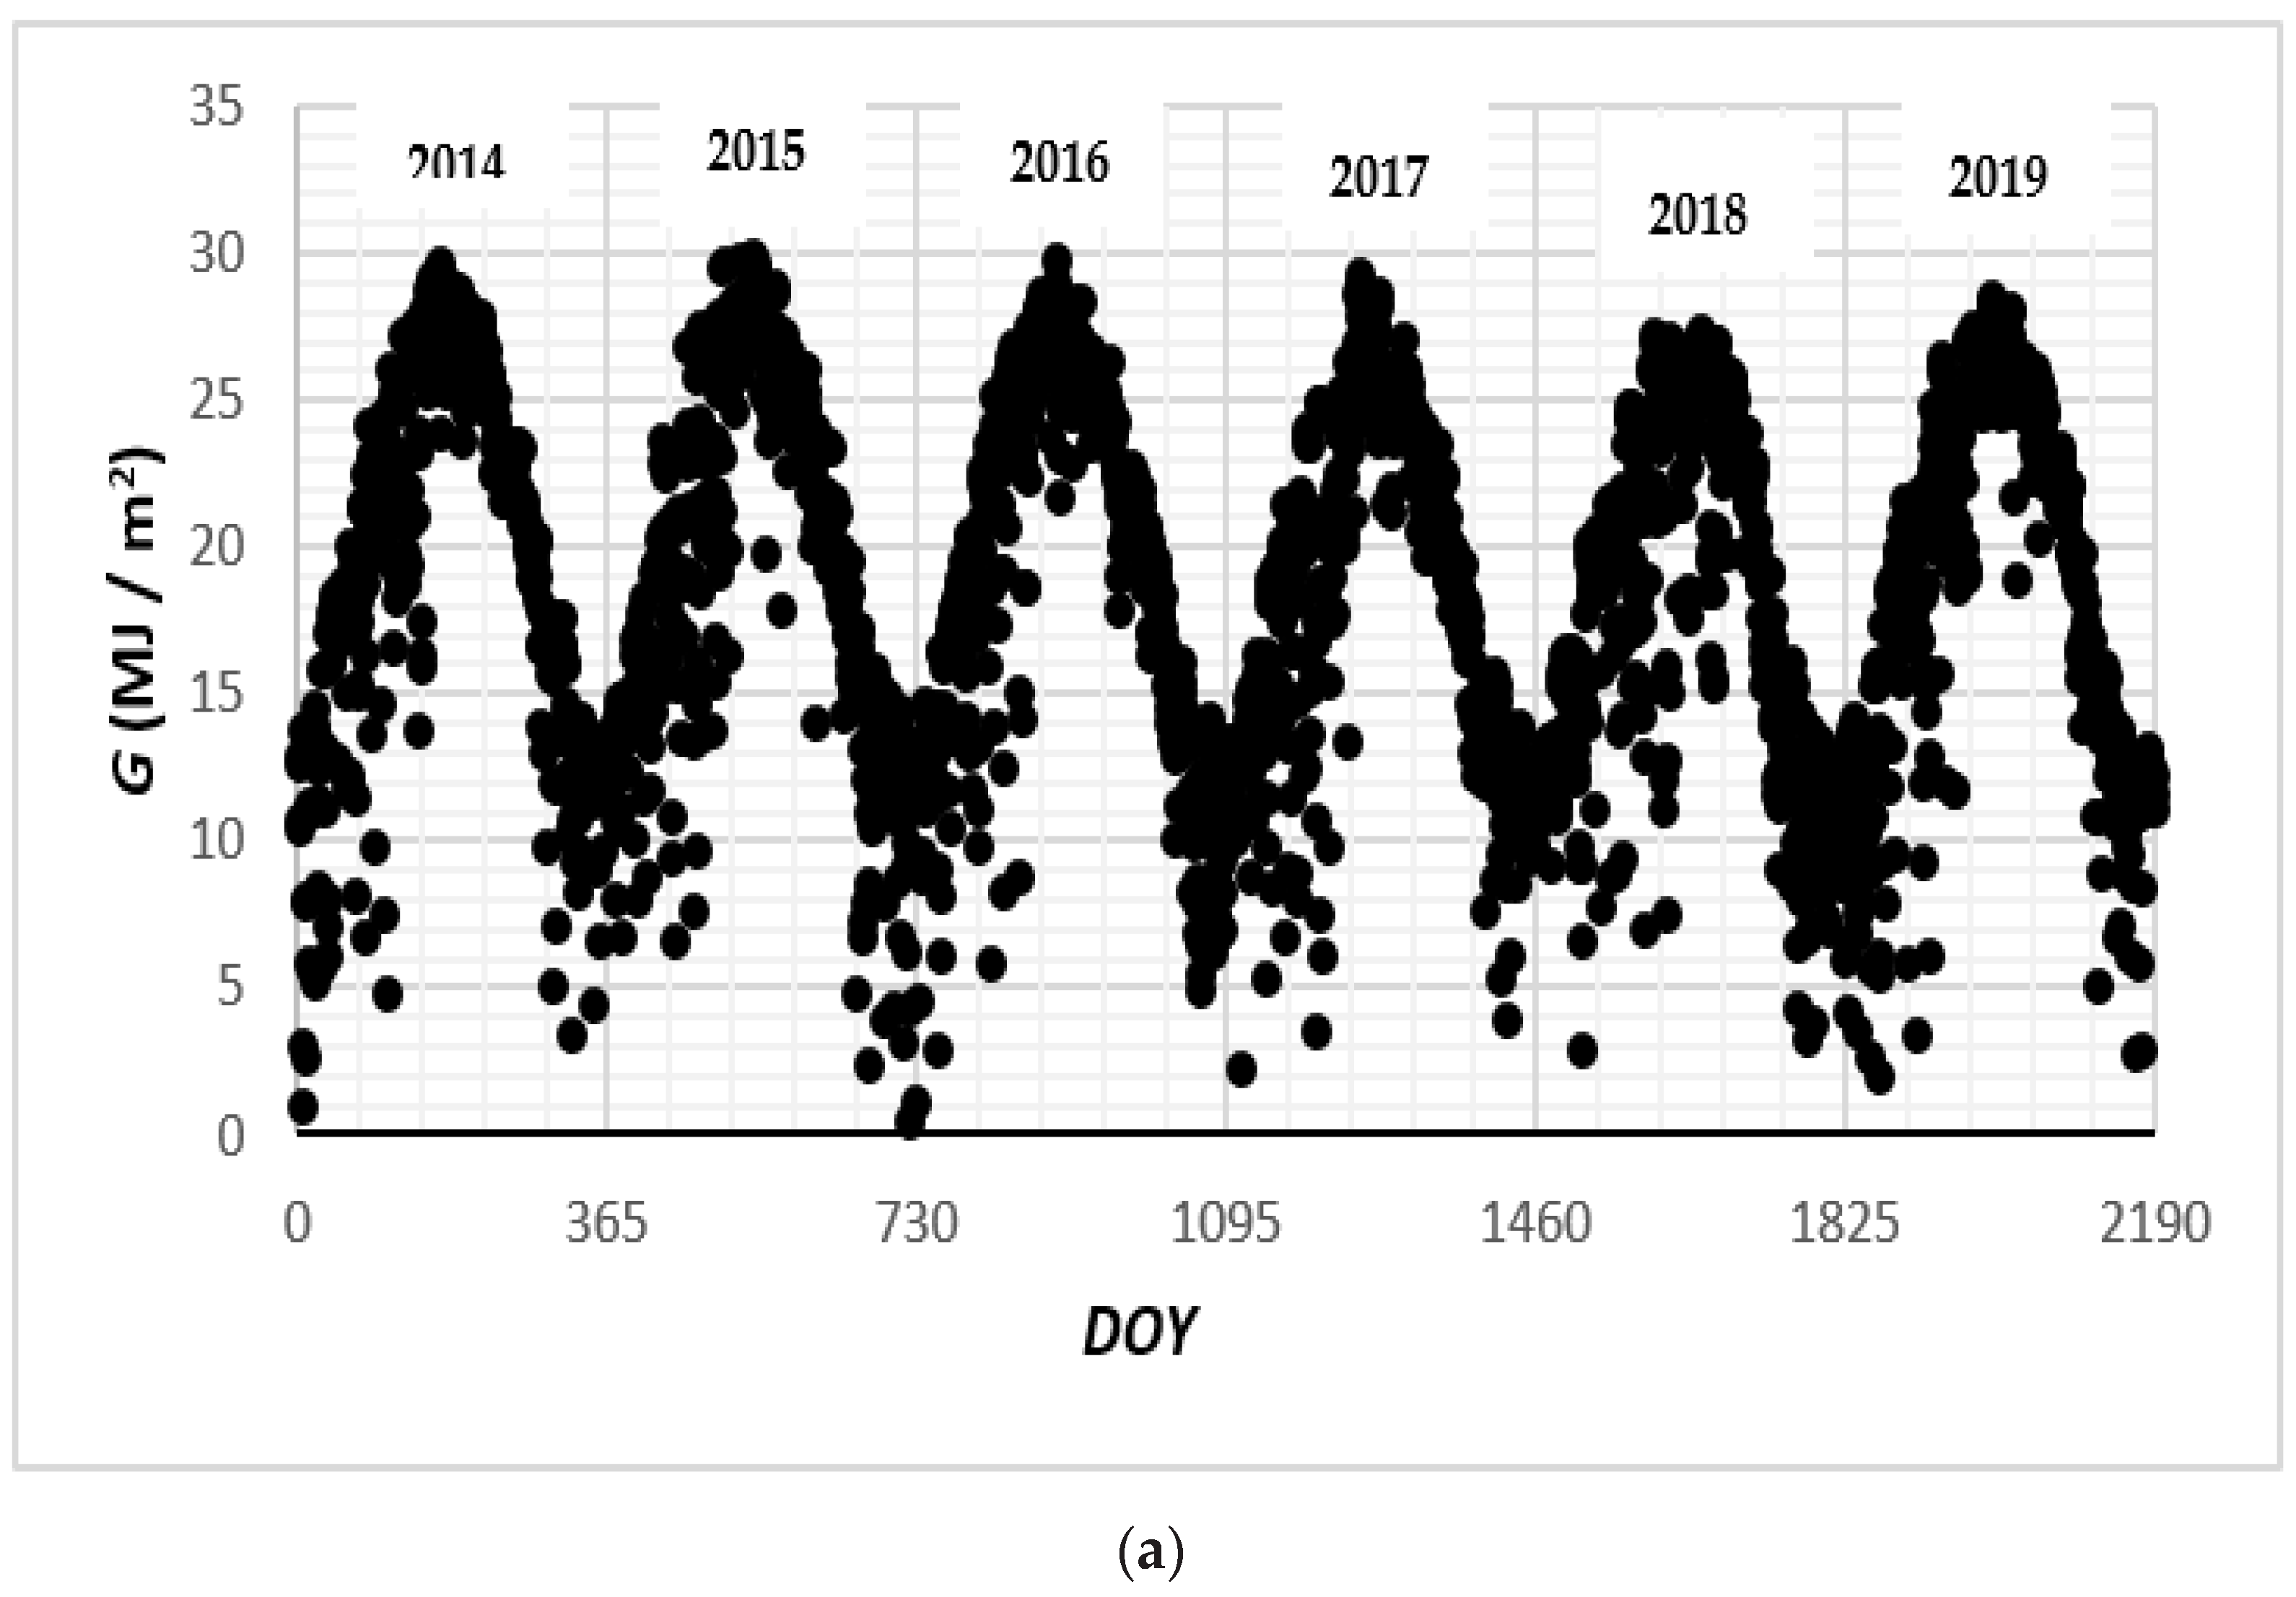
6.2. Daily Analysis
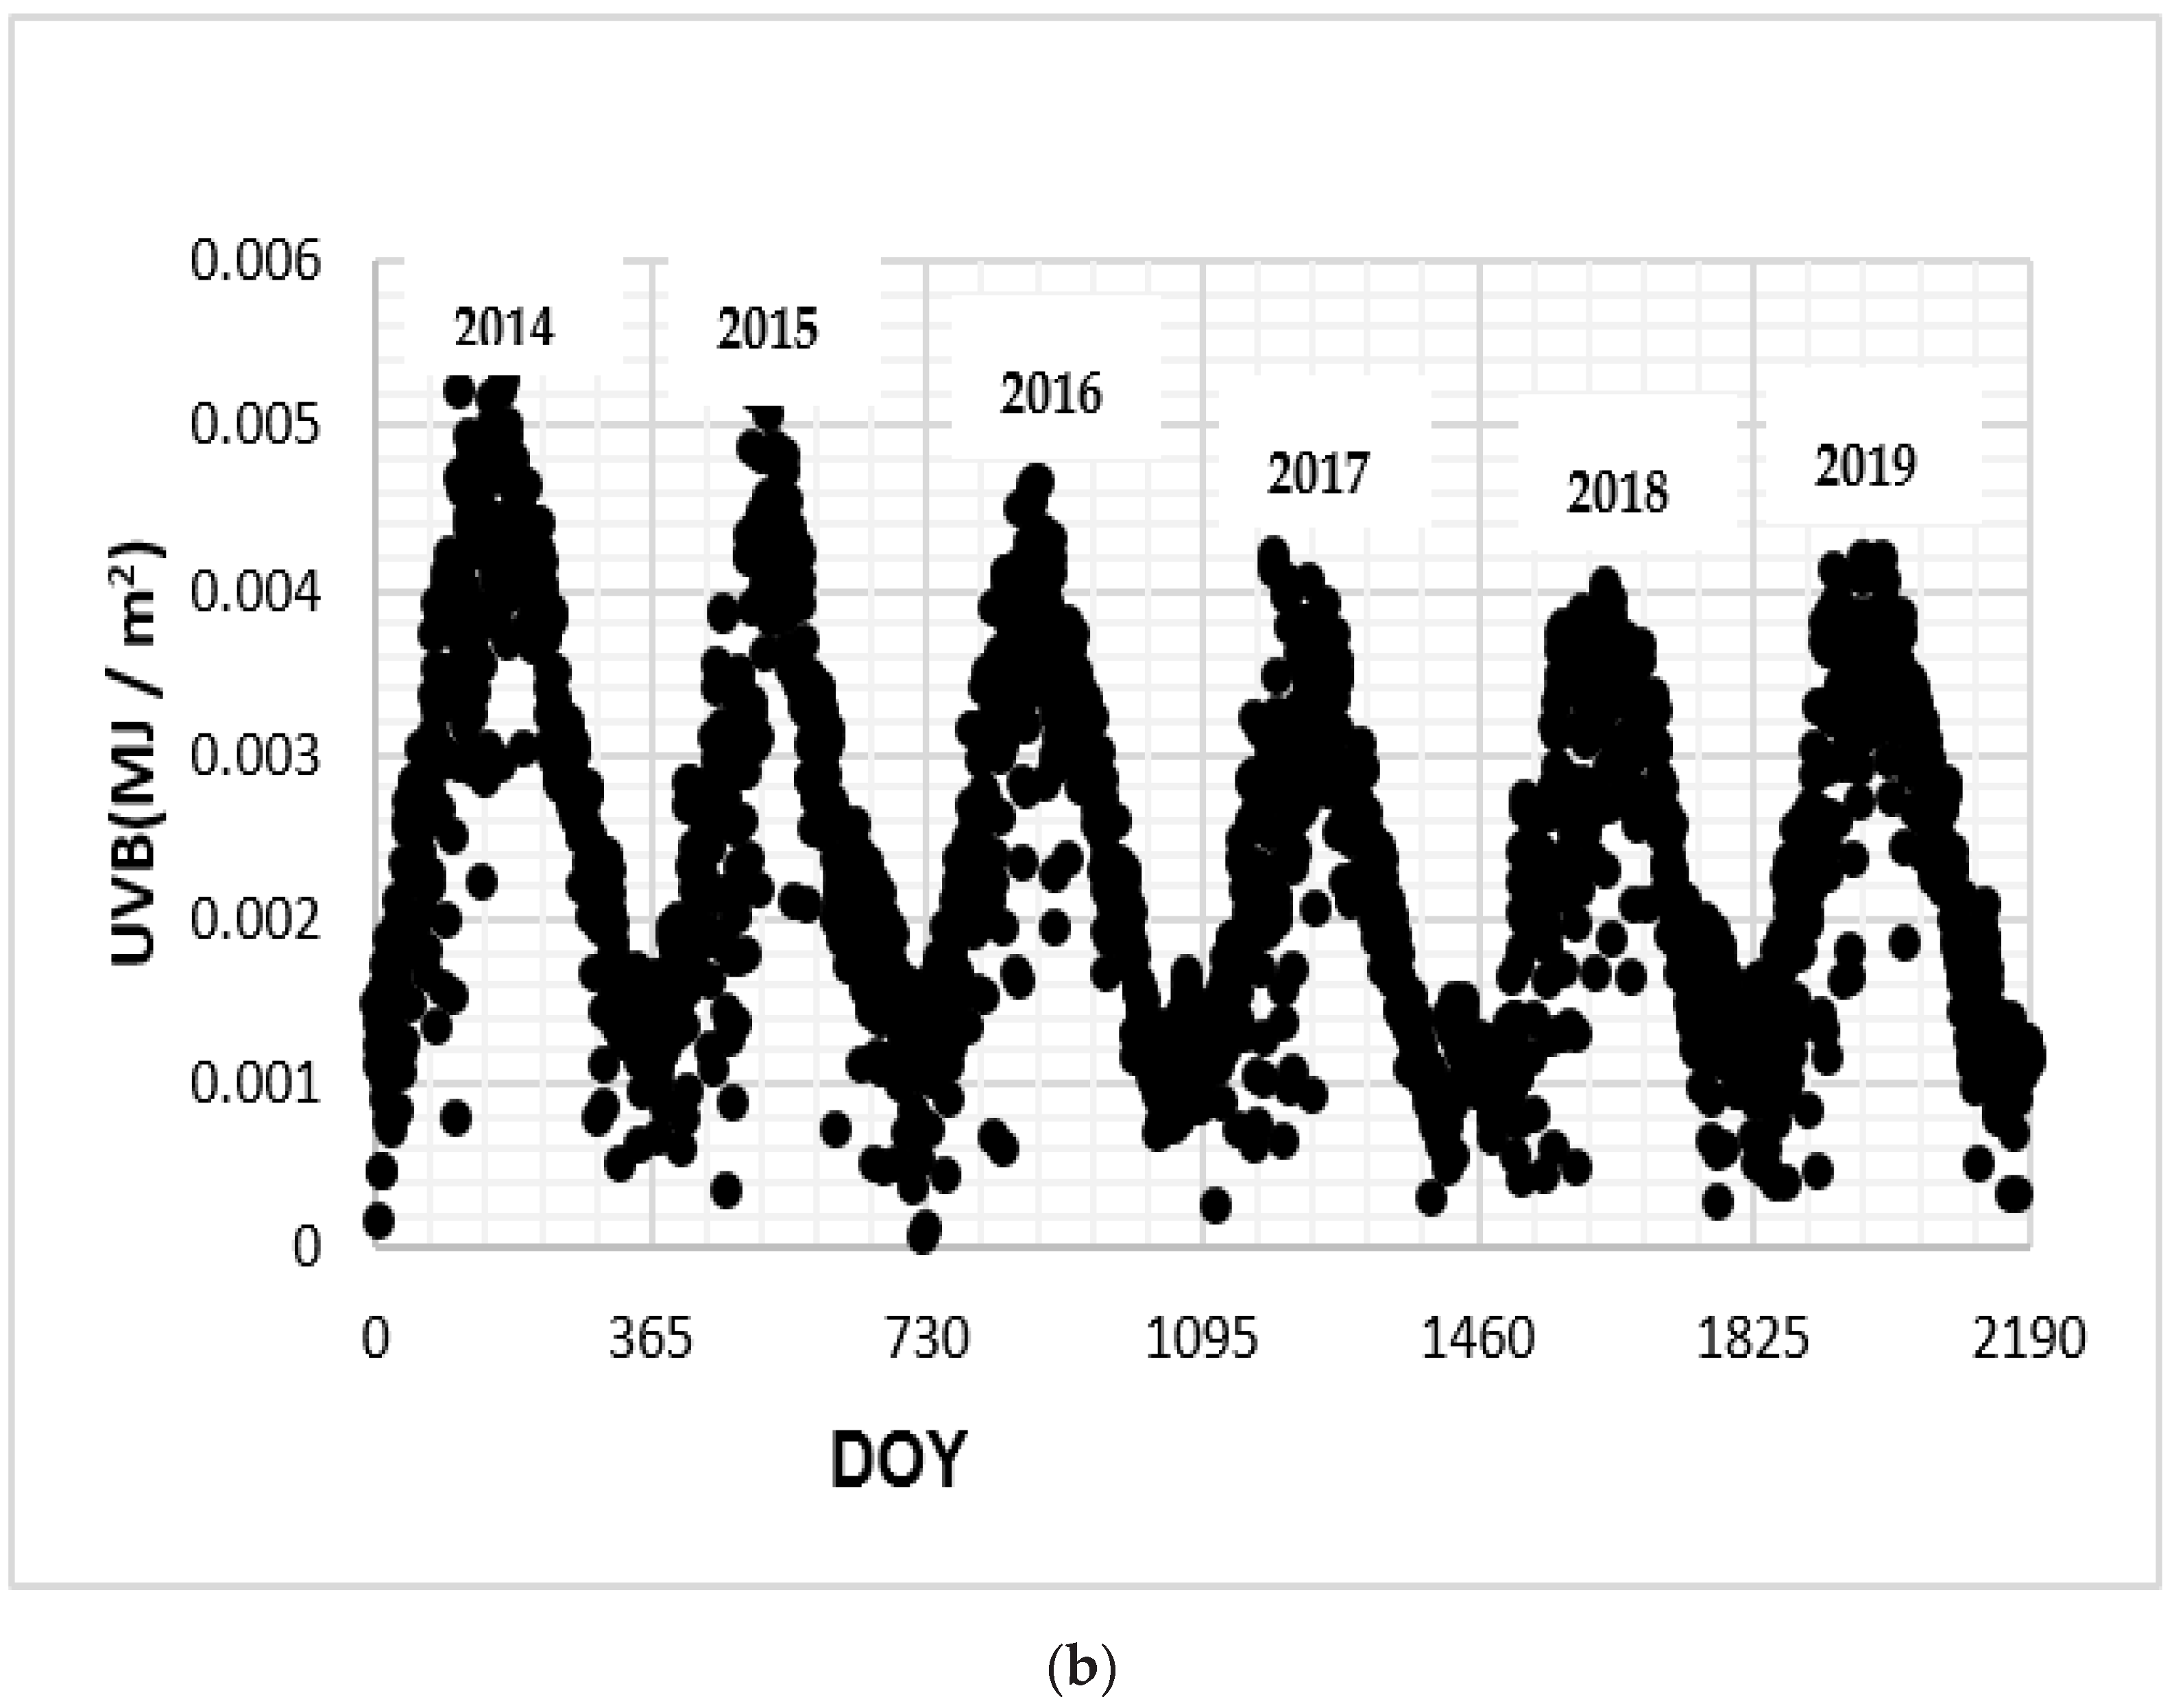
Figure 7a,b present the variation in daily
G and daily
UVB radiation during 2014–2019 for all sky conditions. The daily measurements were examined to derive an emperical relationship between the two parameters, similar to what was carried out for hourly
G and
UVB radiation. The two graphs show a strong agreement in the general behavior, which can be described as being sinusoidal. In addition, the figures show high fluctuations in daily
G and
UVB values observed in the winter season, for all years. On the other hand, there are less fluctuations during the summer season due to clear sky conditions on most days in Kuwait. These figures again confirm the similarity between the behavior of daily
G and daily
UVB radiation, which was noticed in
Figure 1 for hourly values. It is suggested that high fluctuations during the spring months are mostly due to unsteady weather conditions.
As was the case for hourly data, daily
G and
UVB values are strongly correlated, which indicates that daily
UVB can be estimated from the readily available daily
G data. Peak data of daily
G and daily
UVB radiation occur at midday (12 h) during summer months. The maximum values obtained for both
G and
UVB radiation are presented in
Table 4 along with the date for the maximum value for each year.
Table 4 also shows that the date of maximum daily
G radiation does not match that for the maximum daily
UVB radiation. In general, maximum values of daily
G are observed during June, except for 2018 for which the maximum daily
G radiation occurs during July. On the other hand, the maximum daily
UVB radiation is attained during April to June. Another observation is that the maximum daily
G value is about the same for 2014–2017, but it decreases slightly for 2018–2019. The degradation in daily
G radiation during the study period is about 8.99%, while for
UVB radiation, the degradation is more significant with the corresponding value being about 32.5%. The reason behind such phenomena was discussed before (refer to the hourly data part).
To demonstrate the resemblance between the behavior of both daily G and daily UVB, we examined the correlation between these two parameters using MBE and RMSE to validate the derived correlation formula.
Table 5 presents the relationship equation between daily
G and
UVB for each year during 2014–2019, along with the statistical relative parameters, i.e., MBE, RMSE, and
R2.
A quick examination of the values listed in
Table 5 shows a very good agreement between the daily
G and
UVB radiation, as demonstrated by the statistical analysis parameters for each year. The coefficient of determination is significantly improved, and it is very close to unity for all years. The regression coefficient or relationship slopes are nearly the same for all the years (except the year 2014, which is slightly higher).
In addition, the values of RMSE and MBE are greatly enhanced compared to the values obtained for the hourly dataset as the values of RMSE and MBE are almost zero. The above results confirm the validity of the predicted models. Thus, the daily predicted correlations give a higher accuracy in comparison to the hourly ones. Accordingly, they can be utilized with an improved accuracy to estimate daily UVB from daily G for locations where no UVB sensors exist.
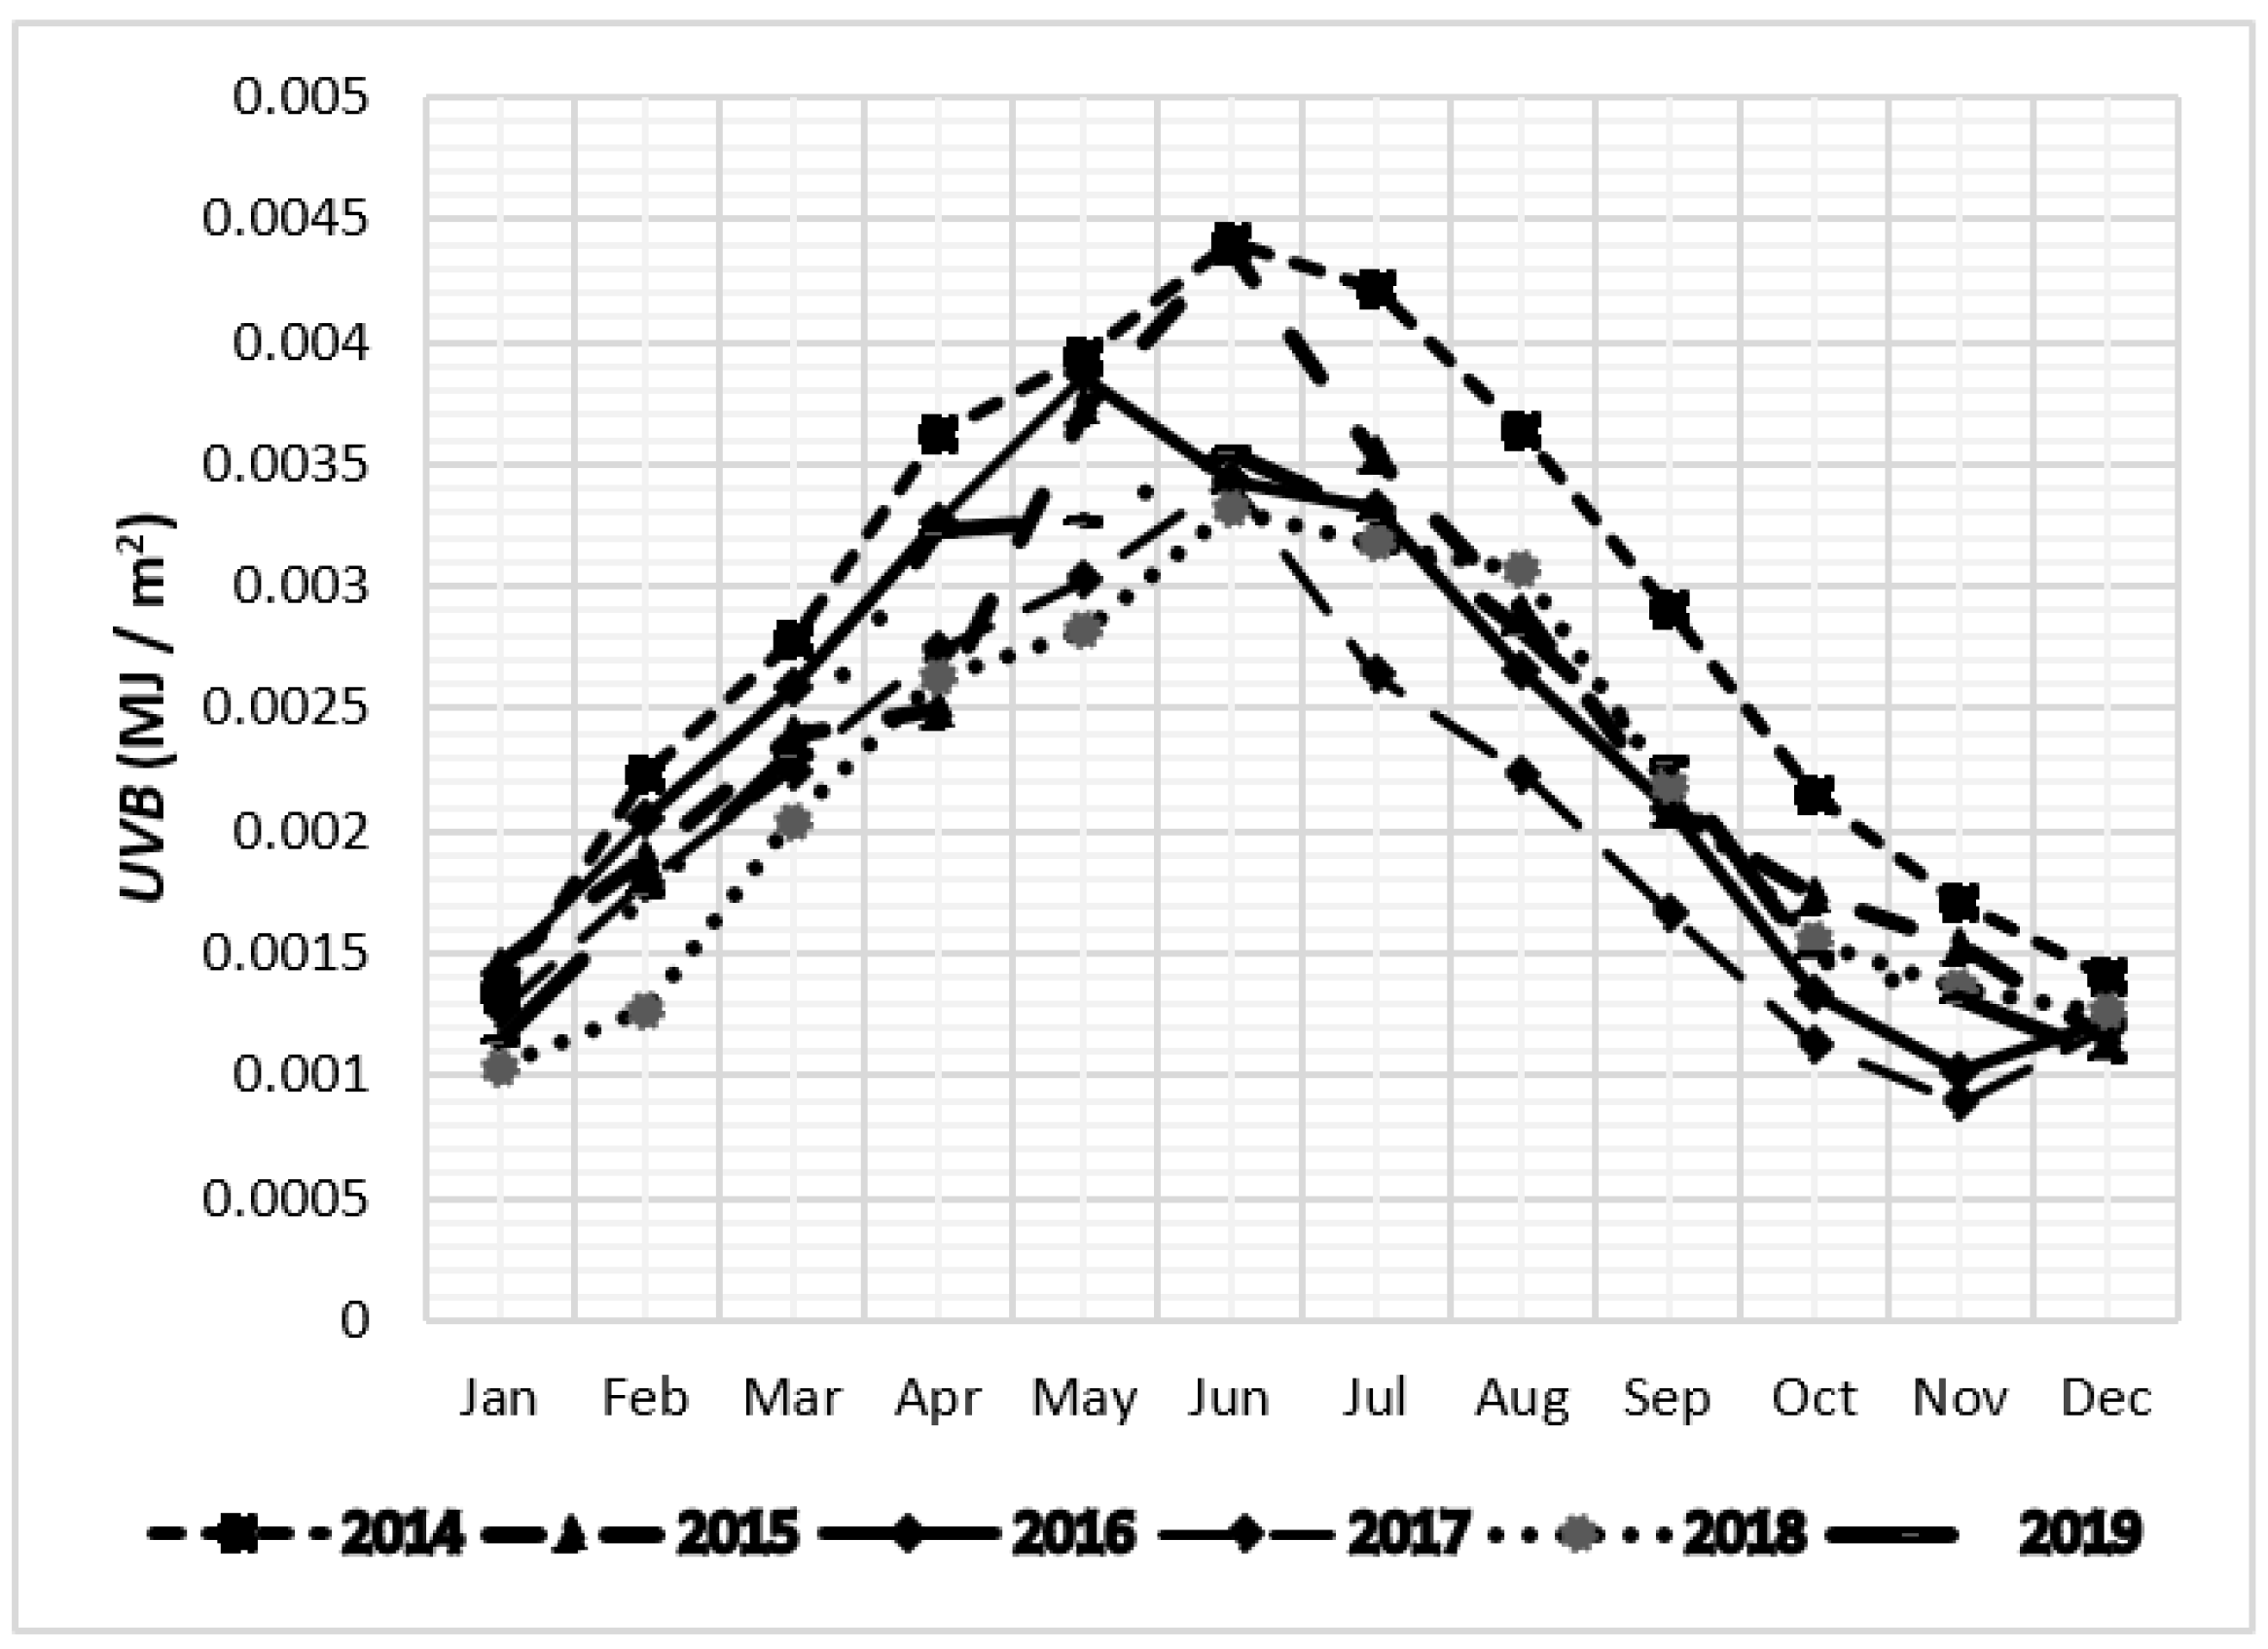
6.3. Monthly Analysis
Figure 8 and
Figure 9 show the monthly average of the daily sum of
G and
UVB radiation for 2014–2019 in Kuwait.
Generally,
G and
UVB have similar monthly behaviors for all years (refer to
Figure 8 and
Figure 9). Minimum monthly values of
G and
UVB occur during the cold months, i.e., November to January, while the maximum monthly
G and
UVB values occur in June, except for 2018 when it occurs in August. The minimum monthly
G radiation is 9.51 MJ/m
2 and occurs in January 2019, while the minimum monthly
UVB radiation is 0.00089 MJ/m
2 and occurs during November 2017. On the other hand, the maximum monthly
G and
UVB radiation values are 27.94 MJ/m
2 and 0.0044 MJ/m
2, respectively, both occurring in June 2015. These observations again confirm the similarity between the behavior of monthly
G and
UVB radiation, which was previously demonstrated for hourly and daily values.
To further check the similarity between the monthly average
G and
UVB radiation, the relationship was examined for each month.
Table 6 presents the relationship equations between the monthly
G and
UVB values for each month. RMSE, MBE, and
R2 are also listed in
Table 6.
Table 6 reveals an excellent agreement between the monthly
G and monthly
UVB radiation, as demonstrated by the statistical analysis parameters for each month. The relationship is linear with the coefficient of determination (
R2) almost equal to unity. The values of RMSE and MBE are significantly less than those for the hourly dataset as RMSE and MBE are almost zero. The above results confirm the validity of the predicted models. Previous predictions indicate that the predicted daily or monthly empirical formula can be utilized with a very high accuracy to predict both daily and monthly
UVB values from both daily and monthly
G for locations where no
UVB sensors exist.


